www.bea.gov intellectual property & the economy j. steven landefeld, director new york state bar...
TRANSCRIPT

www.bea.gov
Intellectual Property & the EconomyJ. Steven Landefeld, Director
New York State Bar Intellectual Property Section Fall Meeting
September 14th, 2012
www.bea.gov
Why adding IP to GDP is Important
▪ GDP, international trade, and other statistics are hard wired into economic policy, including fiscal, monetary, tax, regulatory, and trade policy.
▪ Only a small portion of the nation’s investments in intellectual property are currently included in the nation’s economic statistics.
▪ Including the impact of IP in these statistics is key to assuring that these policies – all of which affect IP – take account of the importance of IP to economic growth, productivity, and trade.
2

www.bea.gov
A Broader Measure of Business Intangibles, 1998-2000
3
(billions of dollars, annual average)
TypeTotal Spending Comments on evidence as capital spending
Capital spending (included in NIPAs)
1. Computerized information 154
Firms capitalize only a fraction of purchased software in financial accounts. Relatively little is known about the service life of software assets. 154
(151)2. Innovative property
(a) Scientific R&D 201Research suggests that scientific R&D yields relatively long-lasting returns and is capital spending. 201
(16)
(b) Nonscientific R&D 223
Little is known about nonscientific research R&D, but a portion of new product development expenditures in the entertainment industry apparently have relatively short-lived effects. 223
(40)3. Economic Competencies
(a) Brand equity 235
Research shows that the effects of some advertising dissipate within one year, but that more that half has effects that last more than one year. 140
(0)
(b) Firm-specific resources 407
Research suggests that firm-specific training is investment. Spending for organizational change is also likely has long-lived effects, but a portion of management fees probably is not capital spending. 365
(0)
Total 1220 1085
(205)
Percent of existing GDP 11.7 Ratio of Tangible Capital Spending 1.2
Source: Corrado, Carol, Charles Hulten and Daniel Sichel. “Intangible Capital and Economic Growth, “ Working paper as part of the Finance and Economics Discussion Series, Divisions of Research and Statistics and Monetary Affairs, Federal Reserve Board, Washington, D.C. April 2006.
www.bea.gov
TFP: Key to Unexplained Portion of Growth
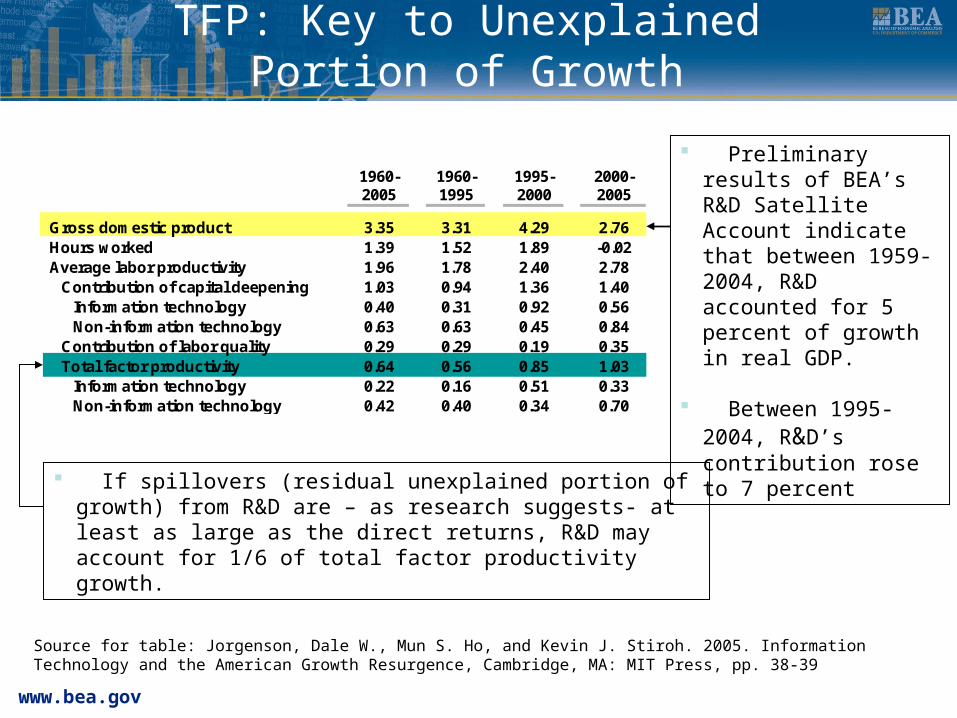
Preliminary results of BEA’s R&D Satellite Account indicate that between 1959-2004, R&D accounted for 5 percent of growth in real GDP.
Between 1995-2004, R&D’s contribution rose to 7 percent
If spillovers (residual unexplained portion of growth) from R&D are – as research suggests- at least as large as the direct returns, R&D may account for 1/6 of total factor productivity growth.
1960- 1960- 1995- 2000-2005 1995 2000 2005
Gross domestic product 3.35 3.31 4.29 2.76Hours worked 1.39 1.52 1.89 -0.02Average labor productivity 1.96 1.78 2.40 2.78
Contribution of capital deepening 1.03 0.94 1.36 1.40Information technology 0.40 0.31 0.92 0.56Non-information technology 0.63 0.63 0.45 0.84
Contribution of labor quality 0.29 0.29 0.19 0.35Total factor productivity 0.64 0.56 0.85 1.03
Information technology 0.22 0.16 0.51 0.33Non-information technology 0.42 0.40 0.34 0.70
Source for table: Jorgenson, Dale W., Mun S. Ho, and Kevin J. Stiroh. 2005. Information Technology and the American Growth Resurgence, Cambridge, MA: MIT Press, pp. 38-39

www.bea.gov 5
Results from BEA’s 2010 R&D Satellite Account:
Treating R&D as investment would have: 1959-2007: Increased the growth rate of real
GDP by .17 percentage point, a 5 percent share of growth
1995-2007: Increased the growth rate of real GDP by .23 percentage point, a 7 percent share of growth
In comparison, private investment in commercial and other types of structures accounted for just over 2 percent of average real GDP growth
The contribution to average real GDP growth from treating R&D as investment is larger than the contribution from private investment in computers and peripheral equipment

www.bea.gov 6
Results from BEA’s 2010 R&D Satellite Account:
▪ If spillovers (residual unexplained portion of growth) from R&D are – as research suggests- at least as large as the direct returns, R&D may account for 1/6 of TFP growth
▪ Recognition of R&D as investment would raise private fixed investment by 11.3 percent in 2007
▪ National saving rate rises by 2.3 percentage points from 14.2 percent to 16.5 percent in 2007

www.bea.gov 7
Results from BEA’s 2010 R&D Satellite Account:
Information, communication, and technology (ITC) and biotechnology-related industries account for two-thirds of the business sector’s R&D contribution to GDP growth between 1995-2007
Recognizing R&D as investment boosts the level of state GDP the most in New Mexico (9.2%) and in Maryland (6.2%), on average between 1995-2007
The value of U.S investments overseas increases by $171 billion or 0.9%, the value of foreign investments in the U.S. increases by $185 billion or 0.9%, for 2007

www.bea.gov
Shares R&D Investment by Industry, 1998 and 2007
8

www.bea.gov 9
R&D Investment and Investment in Nonresidential Structures

www.bea.gov
R&D Investment as a Share of GDP, 1998 and 2007
10

www.bea.gov
Share of Investment in Entertainment Originals by type,
2010
11
Theatrical Movies
Long-Lived Television
Books
Music
Misc.
Total Investment in 2010: $69.7 billion
www.bea.gov
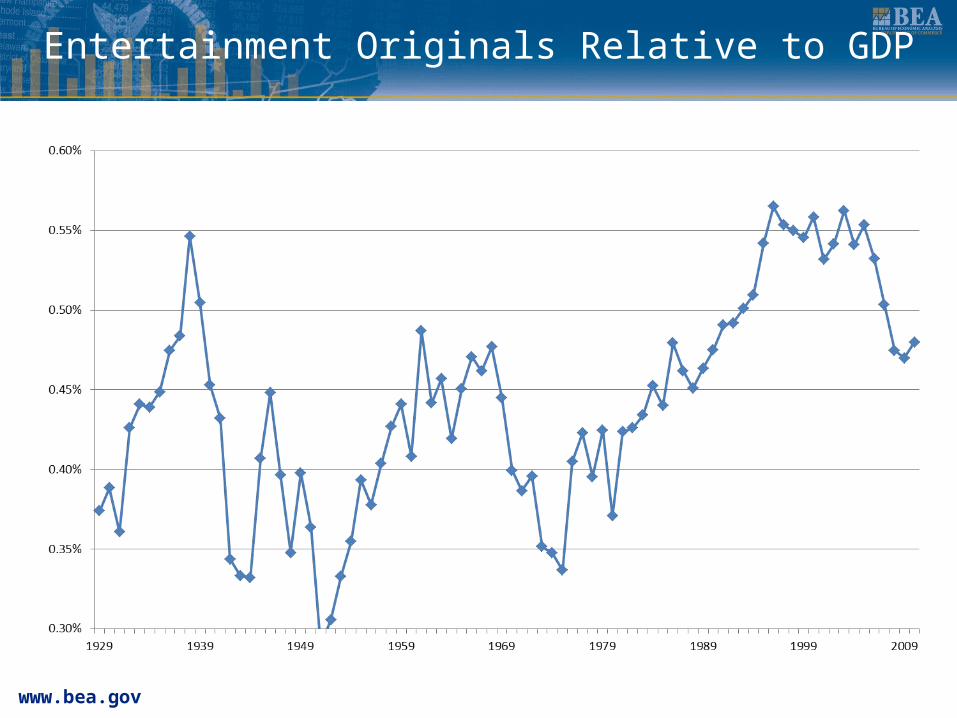
Entertainment Originals Relative to GDP
www.bea.gov
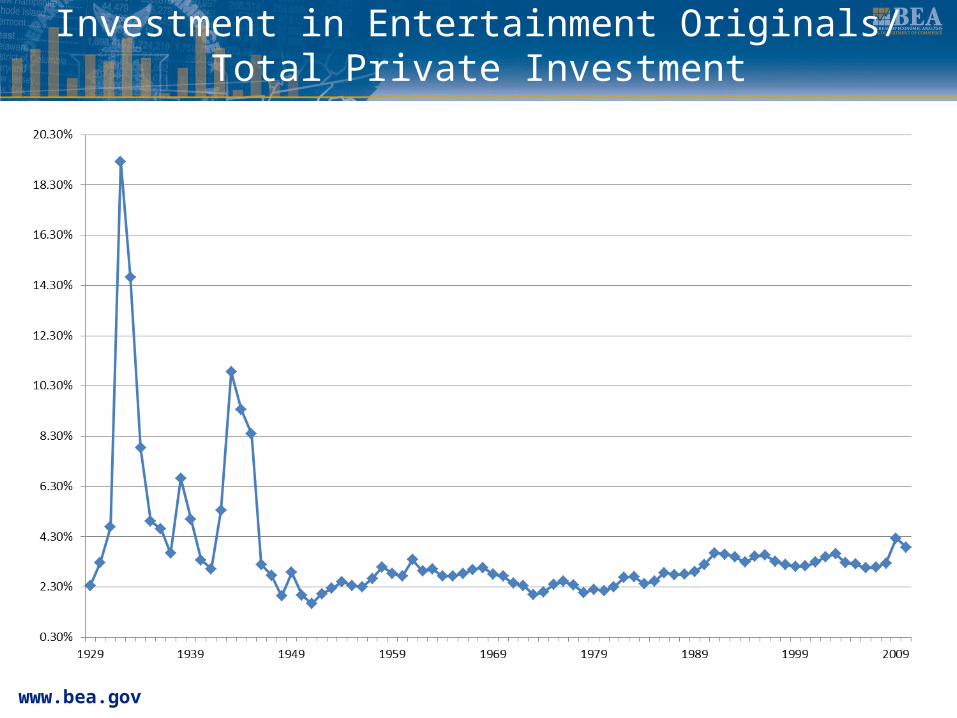
Investment in Entertainment Originals/Total Private Investment

www.bea.gov
Stock of Entertainment Relative to GDP
1.50%
2.00%
2.50%
3.00%
3.50%
4.00%
4.50%
201020001990198019701960195019401930

www.bea.gov
IP-Related Products and Services Leading the Economy
▪ ICT Services: Growth Prices Productivity
▪ Digitally-enabled international trade: Exports Imports Services balance
15

www.bea.gov
Percent Changes in Real GDP and ICT-Producing Industries, 2007:Q2-
2011:Q4
16

www.bea.gov
Price Indexes for Real GDPand ICT-Producing Industries, 2007:Q1-
2011:Q4
17

www.bea.gov
Percent Changes in Real Value Added and Labor Productivity, ICT-Producing
Industries, 1999-2010
18

www.bea.gov
U.S. Exports of Digitally-Enabled Services
19

www.bea.gov 20
U.S. Exports of Digitally-Enabled Services
▪ The share of digitally-enabled services in total exports grew from 45 percent in 1998 to 61 percent in 2010
▪ For 1998-2010, exports of business, professional, and technical services contributed most to the overall increase in digitally-enabled services exports The categories with the fastest rates of growth
were insurance services and financial services ▪ For 2006-2010, business, professional, and
technical services contributed most to the overall increase The largest increases were for management and
consulting services and R&D and testing services
www.bea.gov
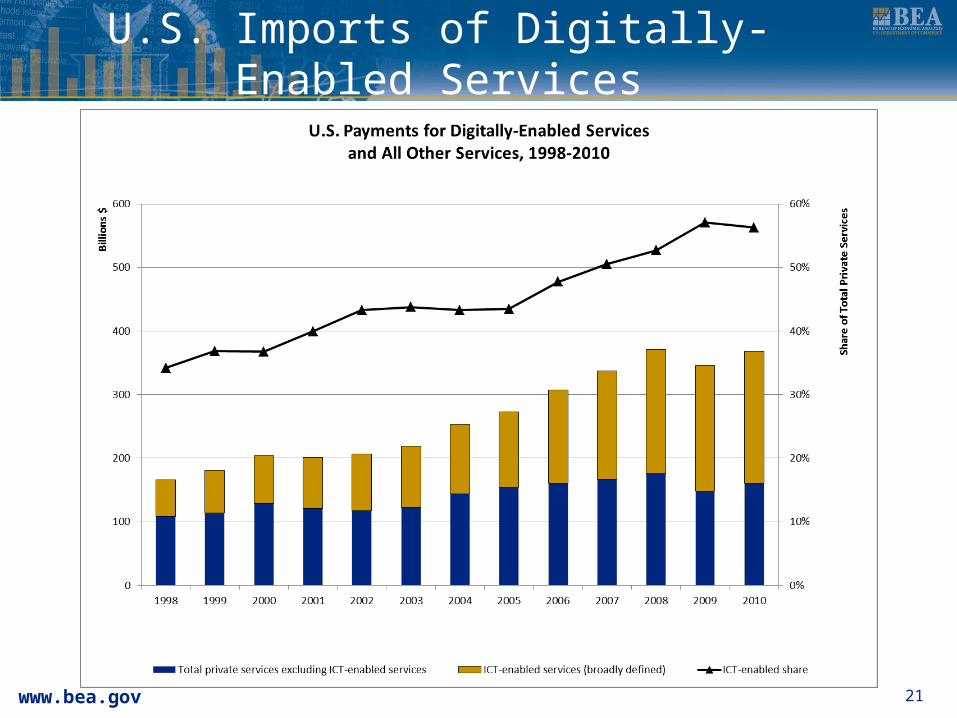
U.S. Imports of Digitally-Enabled Services
21
www.bea.gov 22
U.S. Imports of Digitally-Enabled Services
▪ The share of digitally-enabled services in total imports grew from 34 percent in 1998 to 56 percent in 2010 In 2010, there was a surplus on digitally-
enabled trade in services of $116 billion out of a total surplus in services of $146 billion.
▪ For 1998-2010, business, professional, and technical services and insurance contributed most to the overall increase in digitally-enabled services imports The categories with the fastest rates of growth
were insurance services and business, professional, and technical services

www.bea.gov
Real Value Added & Labor Productivity for Digital-Enabled Service Industries, 1999-2010
23
Average ProductivityGrowth rates, 1999-2010U.S.: 2.6%ITC Producing industries: 12.8%

www.bea.gov
BEA IP Research & Data Priorities
▪ Incorporation of R&D in National Income and Product Accounts (GDP)
▪ Expanded measures of other intangibles, including movies and entertainment, social science R&D, human capital, business models and firm specific R&D
▪ Continued incorporation of improved measures of prices, output, productivity, and investment returns for IT /IP products and services.
24

www.bea.gov
U.S. Dept. of Commerce (DOC) Innovation Efforts
▪ i6 Challenge and Advanced Manufacturing Jobs and Innovation Accelerator by Economic Development Administration (EDA) - http://www.eda.gov/challenges/i6/default.htm and http://www.manufacturing.gov/accelerator/index.html
▪ Internet Policy Task Force by DOC - http://www.ntia.doc.gov/category/internet-policy-task-force
▪ America Invents Act roadshow series by United States Patent and Trademark Office (USPTO) - http://www.uspto.gov/aia_implementation/roadshow.jsp
▪ Advanced Manufacturing Program Office by National Institute of Standards and Technology (NIST) - http://www.manufacturing.gov/amp/ampnpo.html
▪ IP Awareness Assessment Tool by USPTO and NIST - http://www.uspto.gov/inventors/assessment/index.html
▪ Intellectual Property and the U.S. Economy Report by Economic Statistics Administration - http://www.esa.doc.gov/Reports/intellectual-property-and-us-economy-industries-focus
25