www.boc.ie draft for sei review sei workshop on is 393 december 7 th 2005 the potential synergies...
TRANSCRIPT
www.boc.ie
Draft for SEI ReviewSEI Workshop on IS 393
December 7th 2005
The potential synergies between IS 393 and other energy related Drivers and Regulations i.e. IPPC, EU ETS etc. in the light of the recent preparatory work on Ireland’s Second National Allocation
Plan for emissions trading in period 2008-2012
A presentation by
Tom Cleary
Senior Partner
Byrne O Cleirigh
www.boc.ie
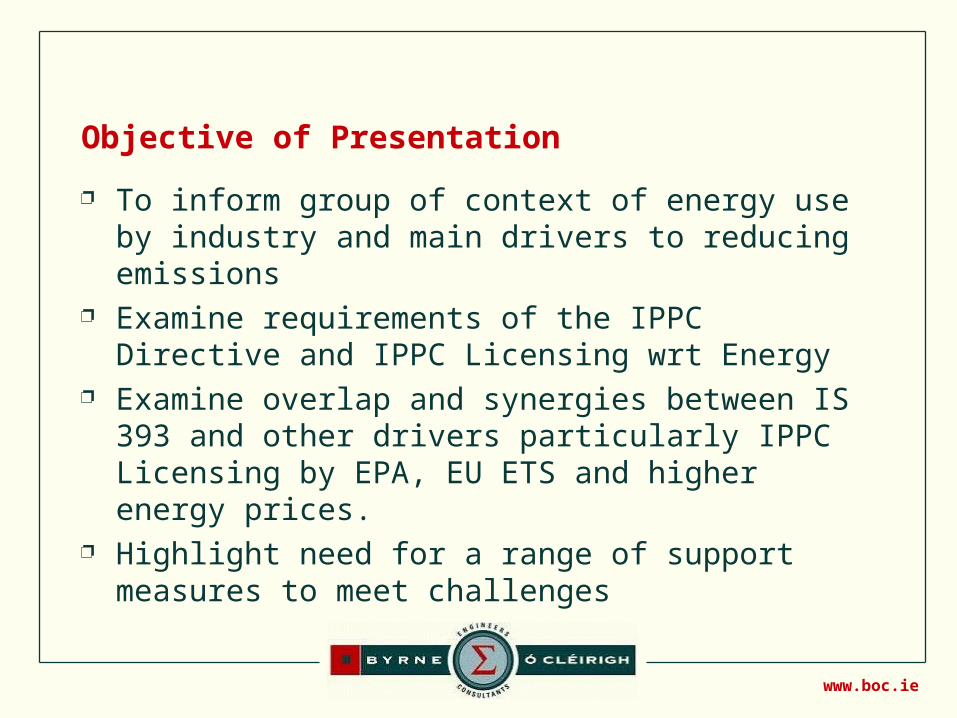
Objective of Presentation
To inform group of context of energy use by industry and main drivers to reducing emissions
Examine requirements of the IPPC Directive and IPPC Licensing wrt Energy
Examine overlap and synergies between IS 393 and other drivers particularly IPPC Licensing by EPA, EU ETS and higher energy prices.
Highlight need for a range of support measures to meet challenges

www.boc.ie
How are Developments in Key Sectors likely to influence the role of IS 393
1. Power sector – EU ETS & Security of Supply
2. Trading sector industry energy emissions
3. Trading Sector Process Emissions
4. Non-trading sector industry
Nos. 1, 2 and 4 are main areas for IS 393 though IS
393 disciplines could also assist identify reductions
in process emissions

www.boc.ie
Relevance of IS 393 to Power Sector
Power sector – prices rising due to rising prices of oil and gas and coal
EU ETS will add a cost to power sector which will have knock on impacts on industry and services and competitiveness
Power companies are not immune to the need to reduce energy costs and hence EU ETS costs
We in BOC see great synergies between all drivers – because of escalating energy costs it is nearly impossible to have too many stimuli for energy efficiency. IS 393 potentially important in sector
www.boc.ie
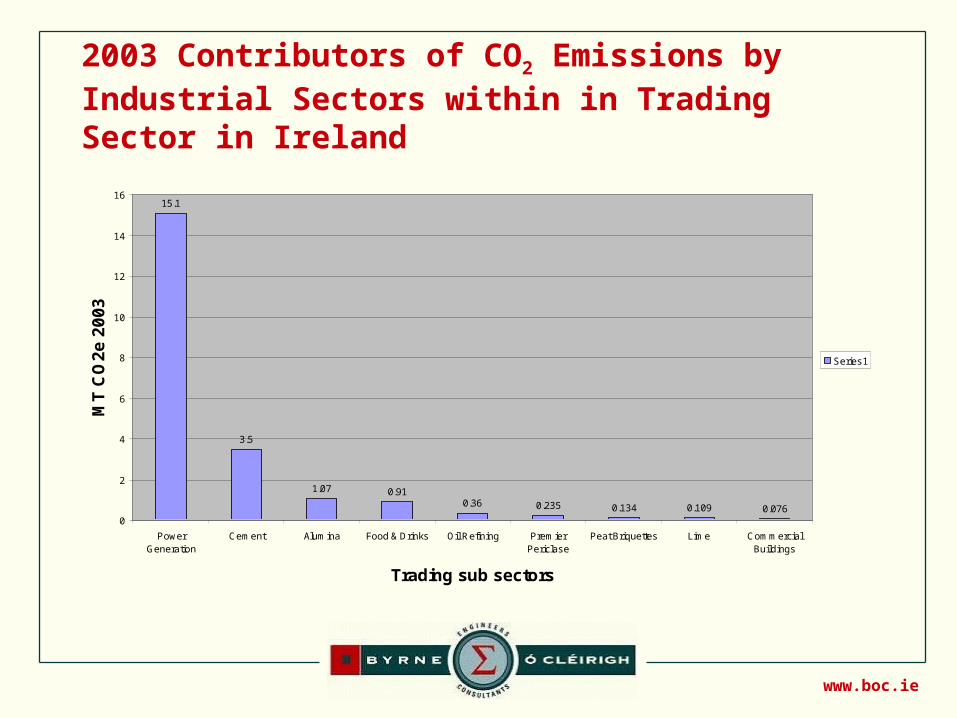
2003 Contributors of CO2 Emissions by Industrial Sectors within in Trading Sector in Ireland
15.1
3.5
1.07 0.910.36 0.235 0.134 0.109 0.076
0
2
4
6
8
10
12
14
16
PowerGeneration
Cement Alumina Food & Drinks Oil Refining PremierPericlase
Peat Briquettes Lime CommercialBuildings
Trading sub sectors
MT
CO
2e
20
03
Series1

www.boc.ie
1990 Emissions Contribution Total 53.974 MT CO2e
ENERGY22%
AGRICULTURE36%
TRANSPORT10%
INDUSTRIAL AND Commercial
17%
RESIDENTIAL13%
WASTE2%
"F" GASES0% SOLVENT AND OTHER
PRODUCT USES0% ENERGY
AGRICULTURE
TRANSPORT
INDUSTRIAL AND Commercial
RESIDENTIAL
WASTE
"F" GASES
SOLVENT AND OTHER PRODUCTUSES

www.boc.ie
2003 Contributors of CO2 Emissions by Industrial Sectors in Trading in EU ETS in Ireland
RE by Sector
73%
1%1%
3%
0%1%
14%
0%1%4%
1% 1%0%0%
Power
Pharmachem
Food and Drink Dairy
Other Food and Drink
Healthcare
Other Industry
Cement
Lime
Other Ind & Process
Alumina
Energy
Oil Refining
Energy Distribution
Commercial
Cement 17.1%
Power 66%
Alumina 5.2%
Food & Drinks

www.boc.ie
Trading Sector – Manufacturing Industry
Some highly energy intensive firms At least 2 sectors and several installations with
emissions > 1 million tonnes CO2e pa 2003 total of non power generation CO2 emissions in
trading sector (industry plus a small number of commercial / institutional buildings) ~ 6.8 million tonnes (including direct emissions from fossil fuels and process emissions)
www.boc.ie
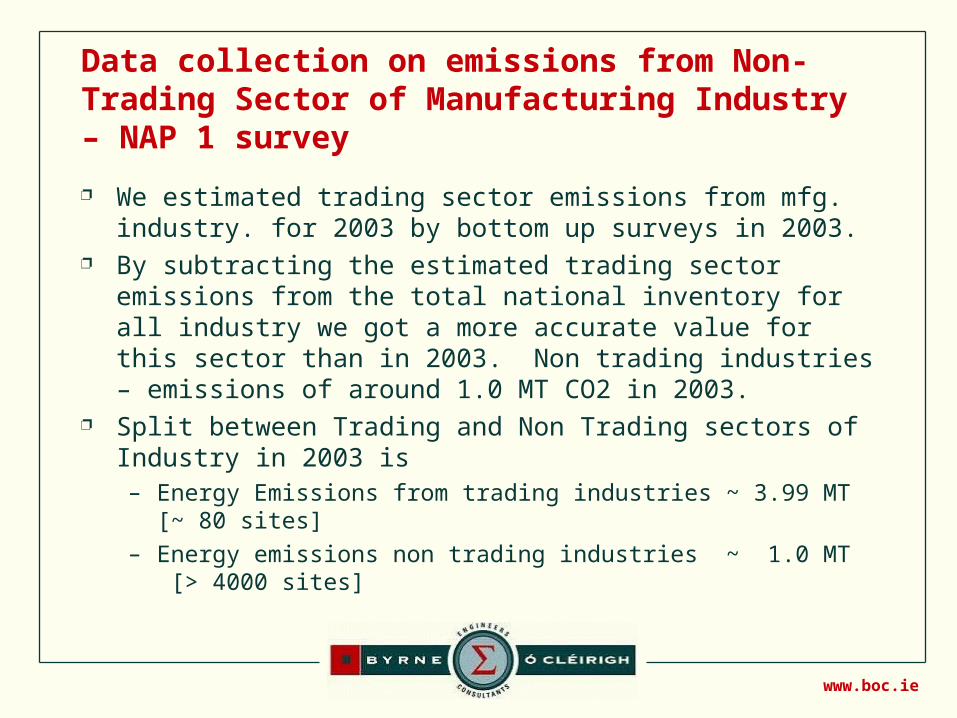
Data collection on emissions from Non-Trading Sector of Manufacturing Industry – NAP 1 survey
We estimated trading sector emissions from mfg. industry. for 2003 by bottom up surveys in 2003.
By subtracting the estimated trading sector emissions from the total national inventory for all industry we got a more accurate value for this sector than in 2003. Non trading industries – emissions of around 1.0 MT CO2 in 2003.
Split between Trading and Non Trading sectors of Industry in 2003 is – Energy Emissions from trading industries ~ 3.99 MT [~ 80 sites]
– Energy emissions non trading industries ~ 1.0 MT [> 4000 sites]

www.boc.ie
Why the Need for IS 393 at this time
In 2003 SEI had reported on potential for negotiated agreements for Industries outside EU ETS. Identified potential energy savings of ~ 640,000 tonnes per annum in 650 firms the non trading sector based on a carbon energy tax of €17.5 and an 80% rebate for undertaking a programme of measures
Carbon tax has been scrapped in meantime

www.boc.ie
Clear from This Mornings Speakers that IS 393 could be an important part of a Suite of Measures
Identification of need for and benefits from IS 393 addressed by other speakers
Other SEI initiatives to assist firms e.g. LIEN, EMAP We in BOC have Identified several groups of
organisations for which IS 393 may be appropriate– Firms and Commercial Sites in EU ETS– High Electricity users whether in EU ETS or not– The largest firms in Non trading sector of industry– Members of LIEN (big overlap with EU ETS firms)– IPC Licensed Sites (480 excluding agricultural sector)

www.boc.ie
IS 393 and IPPC Directive’s Requirement for Efficient Resources Use
EU IPPC Directive 96/61 is concerned with integrated pollution prevention and control
Implemented in Ireland via Protection of the Environment Act 2003
Sections 82(10)(a) and 82 (11) provide power to EPA to review IPC licence and update them to IPPC licence
IPPC Directive has requirements under the headings of Resource Use and importantly Energy Efficiency

www.boc.ie
IS 393 and IPPC Requirements for Efficient Resources Use – Current Position
In 2003 EPA asked BOC to draw up a template for energy auditing in preparation for IPPC
Energy Auditing now a condition of many IPC and all IPPC licences – by June 2005 the energy efficiency condition had been included in 120 IPC licences.
The audit template is now on EPA web site Letters with conditions to create many IPPC Licences have
been issued in the last few months Oct/Nov 2005 Where these letter contain Amendments to older IPC licences
the requirement for energy management is now explicitly listed as is a similar requirement for efficiency water use and efficient use of raw materials.
www.boc.ie
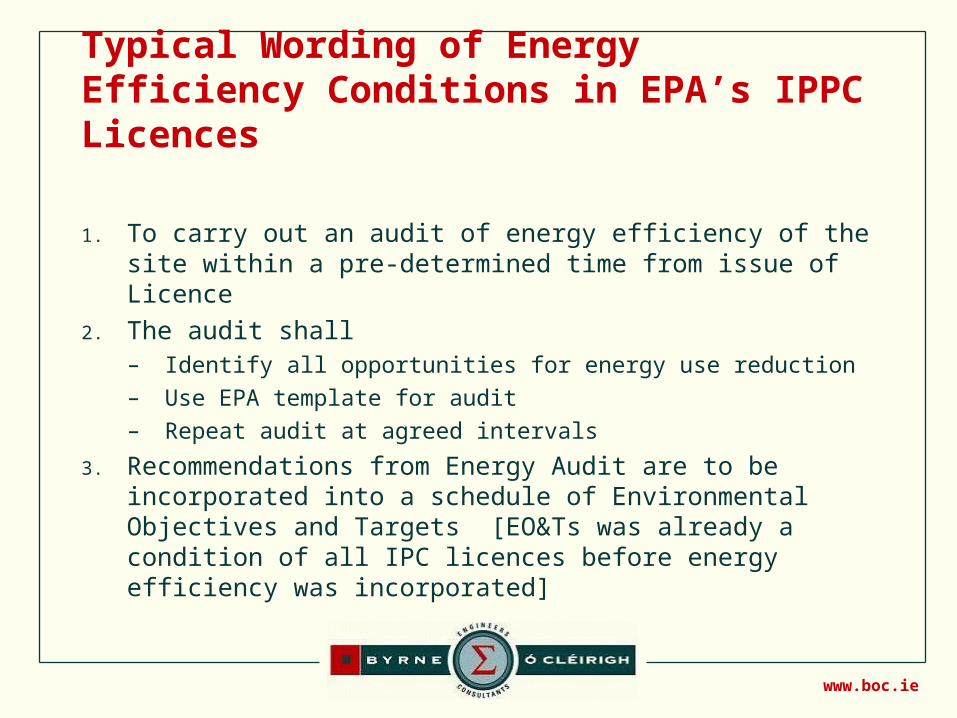
Typical Wording of Energy Efficiency Conditions in EPA’s IPPC Licences
1. To carry out an audit of energy efficiency of the site within a pre-determined time from issue of Licence
2. The audit shall– Identify all opportunities for energy use reduction
– Use EPA template for audit
– Repeat audit at agreed intervals
3. Recommendations from Energy Audit are to be incorporated into a schedule of Environmental Objectives and Targets [EO&Ts was already a condition of all IPC licences before energy efficiency was incorporated]

www.boc.ie
How do Key Requirements of IPPC and IS 393 Compare?
Energy Conditions of IPPC Licences
IS 393 Requirement
Carry Out Energy Audit Covered by Requirement to Review of Energy Aspects
Identify all opportunities for energy use reduction
Explicitly part of review of Energy Aspects
Incorporate recommendations from audit into Objectives and Targets in AER – Annual Environmental Report
Audit to be conducted in accordance with EPA audit template
IS 393 has comprehensive requirements covering all topics in EPA template

www.boc.ie
Reminder of National Projections of BAU Emissions as of Feb 2004 – ICF-BOC – Gap to Kyoto Target 9.1 MT CO2e – latest refinements may reduce slightly
Base Case Scenario - Emission Projections 2002-2012
50
52
54
56
58
60
62
64
66
68
70
72
74
2002 2003 2004 2005 2006 2007 2008 2009 2010 2011 2012
Year
MT
CO
2e
Emissions Excl LUCF
Emissions net LUCF
Kyoto Target
Kyoto Limit 2008-2012 60.365 MT CO2e

www.boc.ie
Most Recent Work in Preparation for NAP 2
New work by EPA and FAPRI on emission factors and activity levels in Agriculture
Recent review by DoEHLG on emissions from waste New work by ESRI on Mid Term Review and Energy
Use Projection New work by COFORD on sequestration New work by EPA on historical emission of “F” gases Transport 21 – will need to ascertain how massive
investment will impact on national emissions
www.boc.ie
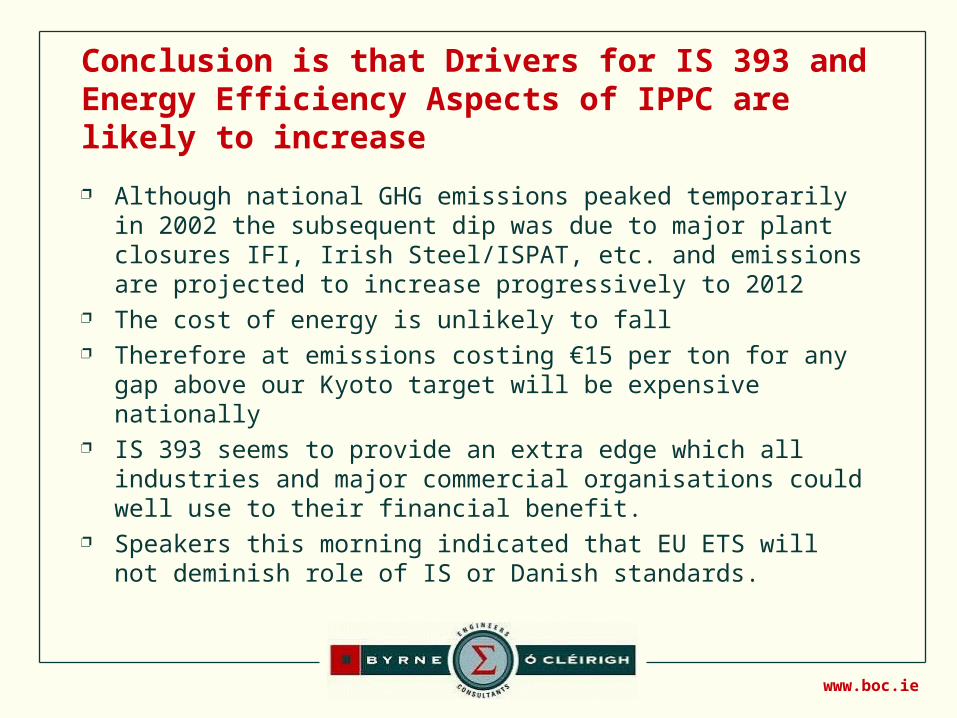
Conclusion is that Drivers for IS 393 and Energy Efficiency Aspects of IPPC are likely to increase
Although national GHG emissions peaked temporarily in 2002 the subsequent dip was due to major plant closures IFI, Irish Steel/ISPAT, etc. and emissions are projected to increase progressively to 2012
The cost of energy is unlikely to fall Therefore at emissions costing €15 per ton for any gap above
our Kyoto target will be expensive nationally IS 393 seems to provide an extra edge which all industries and
major commercial organisations could well use to their financial benefit.
Speakers this morning indicated that EU ETS will not deminish role of IS or Danish standards.
www.boc.ie
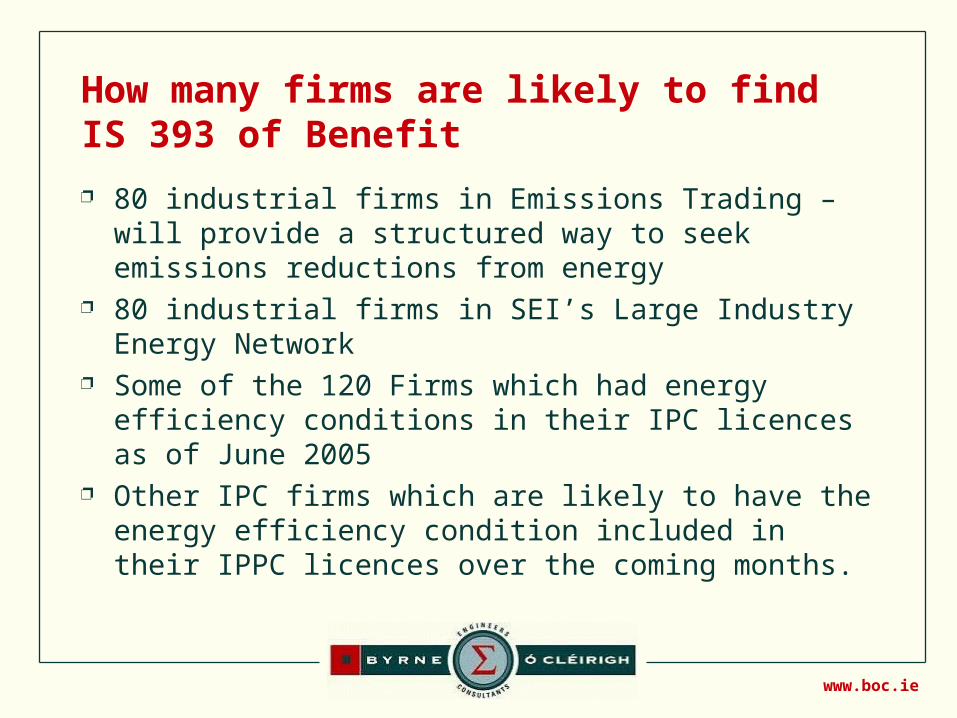
How many firms are likely to find IS 393 of Benefit
80 industrial firms in Emissions Trading – will provide a structured way to seek emissions reductions from energy
80 industrial firms in SEI’s Large Industry Energy Network
Some of the 120 Firms which had energy efficiency conditions in their IPC licences as of June 2005
Other IPC firms which are likely to have the energy efficiency condition included in their IPPC licences over the coming months.

www.boc.ie
Summary
There will be serious and sustained drivers to increase energy efficiency driven by– EU ETS and Kyoto Protocol– Higher energy prices– New EU Directives such as IPPC Directive.
Industries will need a range of initiatives to counter these challenges
IS 393 holds the prospects of providing a structured approach to energy management which will help to meet these challenges.

www.boc.ie
Emission Trends by Sector and Relative Importance of Sectors
Emission Trends by Sector 2003 to 2012
0.000
5.000
10.000
15.000
20.000
25.000
EnergySector
(Pow er,Refining)
Agricultural TransportSector
Residential IndustrialSectorEnergy
(Trading)
Commercial IndustryProcess
Emissions(Trading)
IndustrialSector
Energy (NonTrading)
Waste sector F Gases(Some from
tradingsector)
Solvents &Other
Products
Allow ancefor new
greenfieldindustry(Trading)
Sectors / Emission Types
MT
CO
2e p
er a
nn
um
2003
2004
2005
2006
2007
2008
2009
2010
2011
2012

www.boc.ie
September 2005 ICF-BOC Projection of Distance to Kyoto Target 2008-2012
60.991 60.991 60.991 60.991 60.991 60.991 60.991 60.991 60.991 60.991
67.555
68.684
69.848
68.932 69.17569.778
70.278
71.10371.475
72.101
67.555
68.684
69.848
68.932 69.175
68.05868.558
69.38369.755
70.381
54.000
56.000
58.000
60.000
62.000
64.000
66.000
68.000
70.000
72.000
74.000
2003 2004 2005 2006 2007 2008 2009 2010 2011 2012
KT
CO
2e Kyoto
Excl LUCF
Incl. LUCF
Kyoto Target based on updated 1990 base
Emissions Excl. LUCF
Emissions Incl. LUCF