www.lirneasia.net teleuse@bop teleuse@bop : implications for civil society capacity building and...
TRANSCRIPT

ww
w.li
rnea
sia.
net
Teleuse@BOP: Implications for Civil Society Capacity Building and Democracy
Lorraine Carlos SalazarVisiting Research Fellow
Institute of Southeast Asian Studies (ISEAS)&
Senior ResearcherLirneasia
[email protected], [email protected]
ww
w.li
rnea
sia.
net

ww
w.li
rnea
sia.
net
Outline
Findings from Lirneasia’s 2006 Multi-country Study Background & methodology Everyone has access, but not ownership Usage patterns Who owns phones? Why? BOP is prepaid SMS use and its relative cost Missed calls Internet…what Internet?
Examples of SMS use in the Philippines Akbayan’s use of SMS in election monitoring Among Ed and Grace Padaca, the good and the bad OFW SOS
Reflections and Conclusion

ww
w.li
rnea
sia.
net
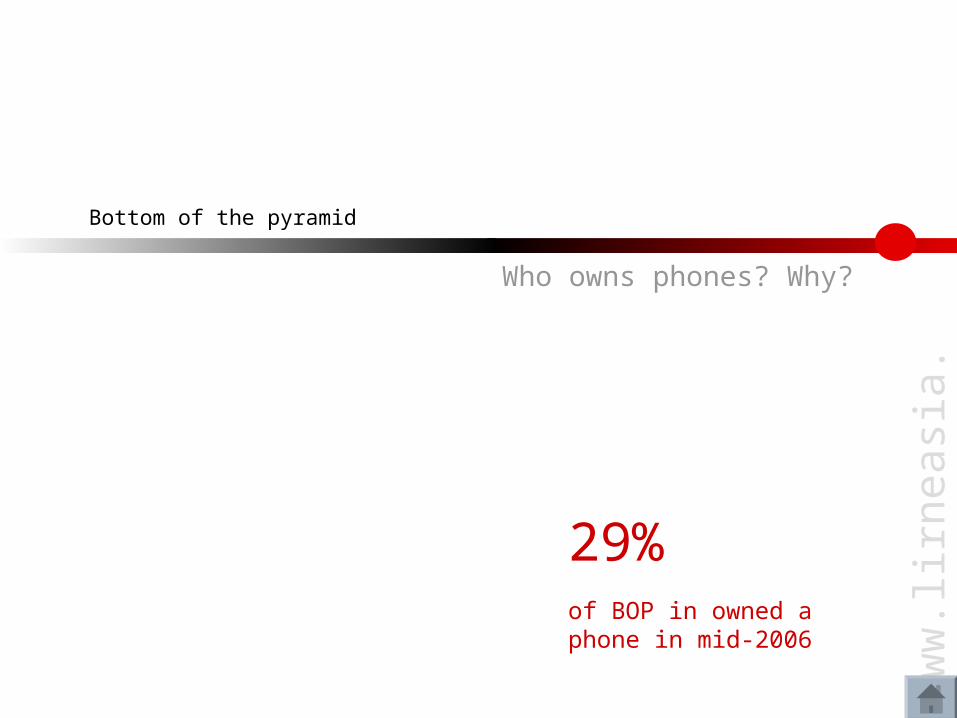
Bottom of the pyramid
Background & methodology
ww
w.li
rnea
sia.
net
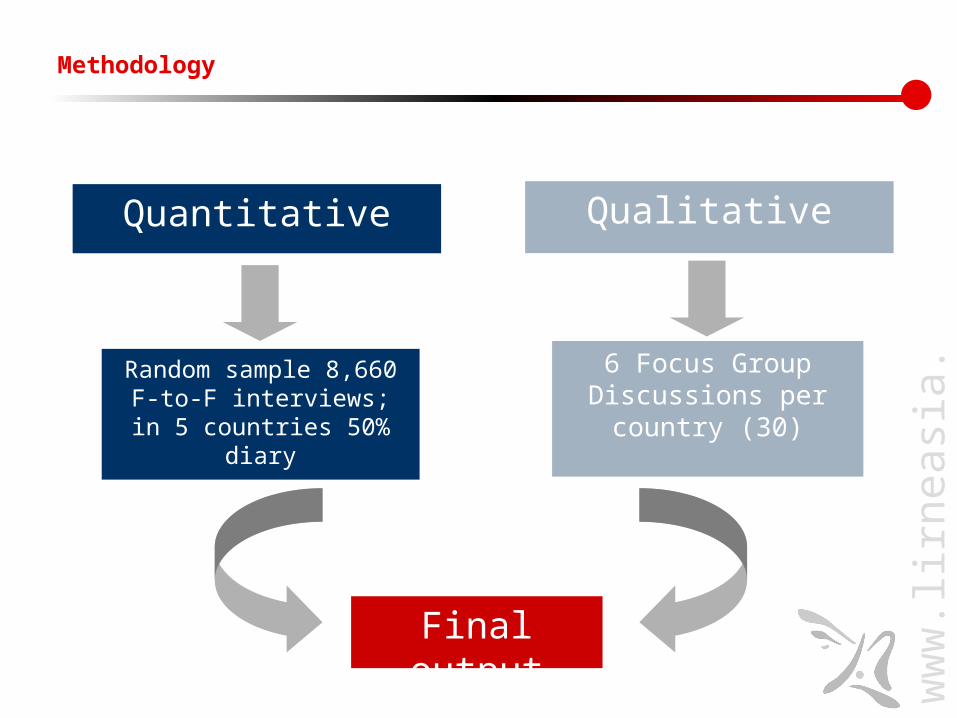
Methodology
6 Focus Group Discussions per
country (30)
Random sample 8,660 F-to-F interviews; in 5 countries 50% diary
Final output
QualitativeQuantitative

ww
w.li
rnea
sia.
net
*excluding FANA/FATA – Tribal Areas; **excluding N&E Provinces
Bottom of the Pyramid (BOP) defined
Many definitions of poverty, but this study uses SEC D and E; between ages 18-60
SEC does not take into account income, but it is closely related to income levels
Pakistan India Sri Lanka Philippines Thailand
Population (million) 165 1,095 20 89 64
Target population of study (million)
77* 260 4** 41 15
SEC D & E
SEC A, B & C

ww
w.li
rnea
sia.
net
Quantitative sample
BOP segment is representative of the BOP population Diary respondents also representative of BOP
Small (non-representative sample) taken of SEC groups A, B & C
SAMPLE
South Asia South East Asia TOTAL
Pakistan India Sri Lanka Philippines Thailand
TOP (SEC A, B & C)
731 652 596 92 348 2,420
BOP (SEC D & E)
1,081 3,348 481 1,008 352 6,269
Total 1,812 4,000 1,077 1,100 700 8,689
Error margin at 95 percent CI
2.7% 1.5% 3.0% 3.0% 7.0%

ww
w.li
rnea
sia.
net
Teleuse@BOP
~9,000 sample survey in five countries India, Pakistan, Sri Lanka, Philippines & Thailand
Understand telecom use at the BOP (= SEC Groups D &E) in Developing Asia
Representative of target population SEC D&E, ages 18-60

ww
w.li
rnea
sia.
net
Country profiles
South Asia South East Asia
Pakistan India Sri Lanka Philippines Thailand
Population165
million 1,095 million
19.6 million
89 million
64 million
GNI per capita (2005), USD (Atlas)
690 720 1,160 1,300 2,750
GNI per capita (2005), USD (PPP)
2350 3460 4,520 5,300 8,440
Population below Poverty Line
32%(est. 2001)
25%(est. 2001)
23%(est. 2005)
40%(est. 2001)
10%(est. 2004)
Fixed teledensity (2006) 4.16(2006 Q4)
4.58(2006 Q1)
9.50(2006 Q4)
4.07(2005 Q4)
10.25(2005 Q4)
Mobile teledensity (2006) 25.22(2006 Q4)
8.82(2006 Q1)
27.1(2006 Q4)
41.30(2005 Q4)
46.45(2005 Q4)
Internet Users7.5
million 50.6
million 0.3
million 7.8
million 8.4
million
Notes: India on an April – March reporting period ; Pakistan on a July – June reporting period; Other countries follow Jan – Dec (calendar year) reporting periods. Sources: India-COAI, TRAI; Thailand–Company Reports; Pakistan–PTA; Philippines–NTC; Sri Lanka- TRC; 2000 onwards from company reports; World Bank (2006); CIA Fact Book (2005)

ww
w.li
rnea
sia.
net
Bottom of the Pyramid
Everyone has access, but not ownership

ww
w.li
rnea
sia.
net
Access (used a phone in the preceding 3 months)
South Asia South East Asia
Pakistan India Sri Lanka Philippines Thailand
Used phone in last 3 months(% of those randomly approached (all SEC groups) who have used a phone in the preceding 3 months)
98% 94% 92% 93% 95%
Most have used a phone in the last 3 months
Kofi Annan’s statement in 1999 that “half of the world’s population has not made a phone call” was not true then and absolutely wrong now

ww
w.li
rnea
sia.
net
Time it takes to reach nearest phone
0%
10%
20%
30%
40%
50%
60%
70%
80%
90%
100%
Pakistan India Sri Lanka Philippines Thailand
% o
f n
on
-ow
ne
rs a
t th
e B
OP
>60 minutes
45-60 minutes
30-45 minutes
15-30 minutes
10-15 minutes
5-10 minutes
3-5 minutes
< 3 minutes
Time to reach nearest phone the BOP
Most can get to a phone in less than 30 minutes

ww
w.li
rnea
sia.
net
Urban-rural divide: Mostly in Pakistan & India
Time to nearest phone: urban vs. rural: Sri Lanka
0%
10%
20%
30%
40%
50%
60%
70%
80%
90%
100%
Urban Rural
Sri Lanka
% o
f n
on
ow
ner
s at
BO
P Betw een 45 - 60 minutes
Betw een 30 - 45 minutes
Betw een 15 - 30 minutes
Betw een 10 - 15 minutes
Betw een 5 - 10 minutes
Betw een 3 - 5 minutes
Less than 2 - 3 minutes
Time to nearest phone: urban vs. rural: Philippines
0%
10%
20%
30%
40%
50%
60%
70%
80%
90%
100%
Urban Rural
Philippines
% o
f n
on
ow
ners
at
BO
P More than an hour
Betw een 45 - 60 minutes
Betw een 30 - 45 minutes
Betw een 15 - 30 minutes
Betw een 10 - 15 minutes
Betw een 5 - 10 minutes
Betw een 3 - 5 minutes
Less than 2 - 3 minutes
0%
10%
20%
30%
40%
50%
60%
70%
80%
90%
100%
Urban Rural
Pakistan
% o
f n
on
ow
ner
s at
BO
P More than an hour
Betw een 45 - 60 minutes
Betw een 30 - 45 minutes
Betw een 15 - 30 minutes
Betw een 10 - 15 minutes
Betw een 5 - 10 minutes
Betw een 3 - 5 minutes
Less than 2 - 3 minutes
0%
10%
20%
30%
40%
50%
60%
70%
80%
90%
100%
Urban Rural
India%
of
no
n o
wn
ers
at
BO
P More than an hour
Betw een 45 - 60 minutes
Betw een 30 - 45 minutes
Betw een 15 - 30 minutes
Betw een 10 - 15 minutes
Betw een 5 - 10 minutes
Betw een 3 - 5 minutes
Less than 2 - 3 minutes
Time to nearest phone
0%
10%
20%
30%
40%
50%
60%
70%
80%
90%
100%
Urban Rural
Thailand
% o
f n
on
ow
ner
s at
BO
P

ww
w.li
rnea
sia.
net
Most frequently used mode
0%
10%
20%
30%
40%
50%
60%
70%
80%
90%
100%%
at
BO
P
Public phone 35% 71% 30% 8% 7%
Relative / friend's phone 10% 1% 12% 14% 6%
Neighbours phone 8% 7% 14% 7% 1%
Mobile of another householdmember
12% 4% 6% 11% 5%
Household fixed phone 14% 9% 21% 4% 8%
Own mobile 21% 9% 17% 56% 73%
Pakistan India Sri Lanka Philippines Thailand
Access modes among BOP phone users
S Asia BOP mainly used public phones; SE Asia mobiles

ww
w.li
rnea
sia.
net
Ownership and GDP per capita (USD, PPP)
23%
9%
22%
60%
11%
23%
7%
14%
64%
81%
59%
38%
23%
76%
18%
0%
10%
20%
30%
40%
50%
60%
70%
80%
90%
Pakistan India Sri Lanka Philippines Thailand
% a
t b
ott
om
of
pyr
amid
0
1,000
2,000
3,000
4,000
5,000
6,000
7,000
8,000
9,000
GD
P p
er c
apit
a, U
SD
(P
PP
)
Own a mobile Own a fixed phone (household)
Own nothing (but use something) Per Capita GDP PPP (USD)
High access, but low ownership levels at BOP
Phone ownership is low in South Asia, higher in Philippines and Thailand

ww
w.li
rnea
sia.
net
How often phone owners allow others to use their phones
How often other people (excluding family members) use your mobile
62%54%
66%
35%
55%
0%
10%
20%
30%
40%
50%
60%
70%
80%
90%
100%
Pakistan India Sri Lanka Philippines Thailand
% o
f m
ob
ile o
wn
ers
Never
A few times in a year
Once a month
Once a week
2-3 times per week

ww
w.li
rnea
sia.
net
Number of mobiles in the household
76%
93%84%
57%
79%
15%
6%13%
26%
15%
5%1% 2%
11%
4%3% 1% 1%
3%1%3% 1%
0%
10%
20%
30%
40%
50%
60%
70%
80%
90%
100%
Pakistan India Sri Lanka Philippines Thailand
% o
f h
ou
se
ho
lds
at
BO
P
5 mobiles in the house
4 mobiles in the house
3 mobiles in the house
2 mobiles in the house
1 mobile in the house
Number of mobiles within the respondent’s household

ww
w.li
rnea
sia.
net
Bottom of the pyramid
Usage patterns
ww
w.li
rnea
sia.
net
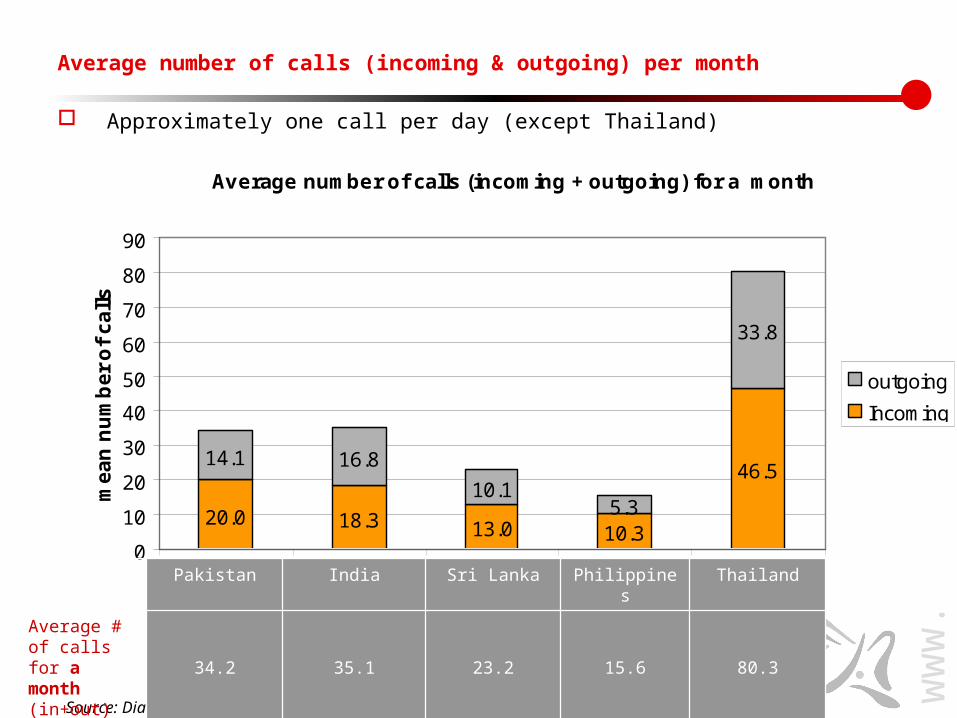
Average number of calls (incoming + outgoing) for a month
20.0 18.3 13.0 10.3
46.514.1 16.8
10.15.3
33.8
0
10
20
30
40
50
60
70
80
90
Pakistan India Sri Lanka Philippines Thailand
me
an
nu
mb
er
of
ca
lls
outgoing
Incoming
Source: Diary
Average number of calls (incoming & outgoing) per month
Approximately one call per day (except Thailand)
Pakistan India Sri Lanka Philippines Thailand
Average # of calls for a month (in+out)
34.2 35.1 23.2 15.6 80.3

ww
w.li
rnea
sia.
net
Average call durations
Average call durations
0%
10%
20%
30%
40%
50%
60%
<1 minute 2-3minutes
About 5minutes
About 10minutes
>15minutes
Duration of the call
% o
f c
alls
Pakistan
India
Sri Lanka
Philipines
Thailand
Source: Diary

ww
w.li
rnea
sia.
net
Call destination (type of call)
Type of call (local, long distance, international)
71%78%
62%
88% 84%
28%22%
34%
6% 16%
1% 0% 4% 6% 1%
0%10%20%30%40%50%60%70%80%90%
100%
Pakistan India Sri Lanka Philipines Thailand
% o
f c
alls International call
Long distance call
Local call
Source: Diary

ww
w.li
rnea
sia.
net
Source: Diary
Call purposes (primary)
Main purpose of call
82%72% 65% 64% 70%
4%14% 27%
21%
14% 14%8%
15%29%
2%
0%
20%
40%
60%
80%
100%
Pakistan India Sri Lanka Philipines Thailand
% o
f al
l cal
ls
Keeping in touch with family & friends To check something / Deliver message
Business
ww
w.li
rnea
sia.
net
Bottom of the pyramid
Who owns phones? Why?
29%of BOP in owned a phone in mid-2006

ww
w.li
rnea
sia.
net
Phone ownership: urban vs. rural
48%
22%
50%
63%
88%
24%16%
39%
61%
78%
0%
10%
20%
30%
40%
50%
60%
70%
80%
90%
100%
Pakistan India Sri Lanka Philippines Thailand
Country
Urban Rural
ww
w.li
rnea
sia.
net
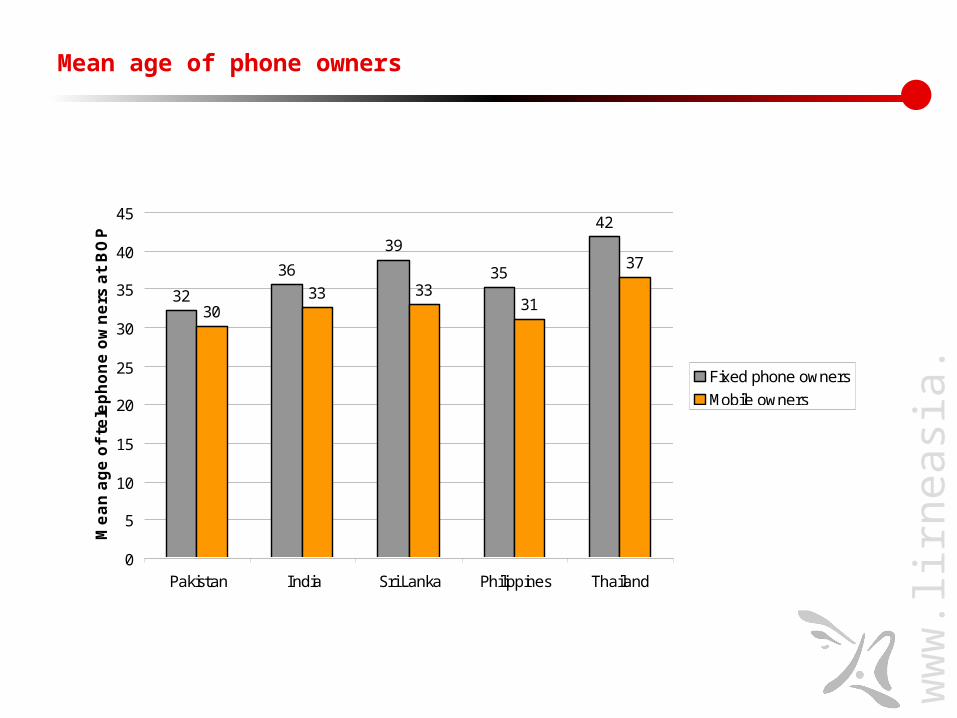
Mean age of phone owners
32
36
39
35
42
3033 33
31
37
0
5
10
15
20
25
30
35
40
45
Pakistan India Sri Lanka Philippines Thailand
Mean a
ge o
f te
lephone o
wners
at
BO
P
Fixed phone owners
Mobile owners

ww
w.li
rnea
sia.
net
Why own a mobile phone?
Convenience is key
Primary reason for choosing to own a mobile
64%71% 66% 68%
92%
11%6%
9% 5%
7% 4%
20%17%
18% 16%
4%10%
3%7%
1%1%
0%
20%
40%
60%
80%
100%
Pakistan India Sri Lanka Philippines Thailand
% o
f mob
ile o
wne
rs a
t the
BO
P Other
It is cheaper
For privacy
So I don’t depend onothers
Convenience: accessibileat any time

ww
w.li
rnea
sia.
net
Growth in mobile phone ownership at BOP since 2001
23%
9%22%
60%
76%
0%
20%
40%
60%
80%
100%
before2001
2001 2002 2003 2004 2005 2006(Q1&2)
Year during which connection was obtained
%(c
um
ula
tive
) at
BO
P
Pakistan India Sri LankaPhilippines Thailand

ww
w.li
rnea
sia.
net
Handsets: brand new vs. second-hand
36%28% 28%
40% 34%
64%72% 72%
60% 66%
0%
10%
20%
30%
40%
50%
60%
70%
80%
90%
100%
Pakistan India Sri Lanka Philippines Thailand
% o
f m
ob
ile o
wn
ers
at B
OP
USD 0
USD 20
USD 40
USD 60
USD 80
USD 100
USD 120
USD 140
USD 160
Ave
. pri
ce p
aid
fo
r h
and
set
using second-hand using brand new
ave.price paid for second hand ave. price paid for brand new
Handsets

ww
w.li
rnea
sia.
net
Who decides female ownership of phone at BOP? Patriarchal South Asia, more empowered women in Southeast Asia!
74%
9%
26%
91%
0%
20%
40%
60%
80%
100%
South Asia South East Asia
Male Female
% o
f fe
male
mob
ile o
wn
ers
at
BO
P
Who makes the decision to obtain a mobile
(among female mobile owners)?

ww
w.li
rnea
sia.
net
Primary reason for choosing to own a fixed phone
55%65%
60% 63%
80%
24%
18%
14% 8%
11%10%
7%6%
7%6%
17% 22%
1%
0%
16%
3%
0%
20%
40%
60%
80%
100%
Pakistan India Sri Lanka Philippines Thailand
% o
f fix
ed o
wne
rs a
t th
e B
OP Other
For privacy
So I don’t depend on others
It is cheaper
Convenience: accessibile at anytime
Why own a fixed phone?

ww
w.li
rnea
sia.
net
Older fixed connections
18%
11%
23%
7%
14%
0%
20%
40%
60%
80%
100%
before2001
2001 2002 2003 2004 2005 2006(Q1&2)
Year during which connection was obtained
%(c
um
ula
tive
) a
t B
OP
Pakistan India Sri LankaPhilippines Thailand

ww
w.li
rnea
sia.
net
Bottom of the Pyramid
BOP is prepaid

ww
w.li
rnea
sia.
net
Prepaid vs. postpaid mobile packages (among mobile owners)
Pakistan India Sri Lanka Philippines Thailand
Pre Paid 99% 95% 92% 99% 96%
Post Paid 1% 4% 8% 1% 4%

ww
w.li
rnea
sia.
net
Reason for choosing prepaid (rather than post-paid)
0%
10%
20%
30%
40%
50%
60%
70%
80%
90%
100%
Pakistan India Sri Lanka Philippines Thailand
% o
f p
rep
aid
mo
bile
ow
ner
s at
BO
P
Other
Lower per-minutecharges
No billing procedures
No monthly rentalcharge
To controlexpenditures
Reasons for choosing prepaid
Prepaid helps to ‘control expenditure;’ reasons are largely cost-related

ww
w.li
rnea
sia.
net
Time to travel to location where mobile owner can re-credit mobile
0%
10%
20%
30%
40%
50%
60%
70%
80%
90%
100%
Pakistan India Sri Lanka Phillipines Thailand
% o
f p
rep
aid
mo
bil
e o
wn
ers
at
BO
P
More than anhour
About 60minutes
About 30minutes
About 15minutes
About 10minutes
About 5 minutes
About 2 minutes

ww
w.li
rnea
sia.
net
Bottom of the pyramid
SMS use and its relative cost

ww
w.li
rnea
sia.
net
Use of SMS at the bottom of the pyramid
50
35
60
100
30
0102030405060708090
100
% o
f m
ob
ile o
wn
ers
at
BO
P t
ha
t u
se
SM
S
Pakistan India Sri Lanka Philippines Thailand
Lowest SMS prices ‘SMS capital of the world’

ww
w.li
rnea
sia.
net
Frequency of SMS use
Frequency of SMS use (DE)
50%
65%
40%
70%
0%
0%
10%
20%
30%
40%
50%
60%
70%
80%
90%
100%
Pakistan India Sri Lanka Philippines Thailand
% o
f m
ob
ile
ow
ner
s
Never
Less than once a month
At least once a month
At least once a w eek
Daily
ww
w.li
rnea
sia.
net
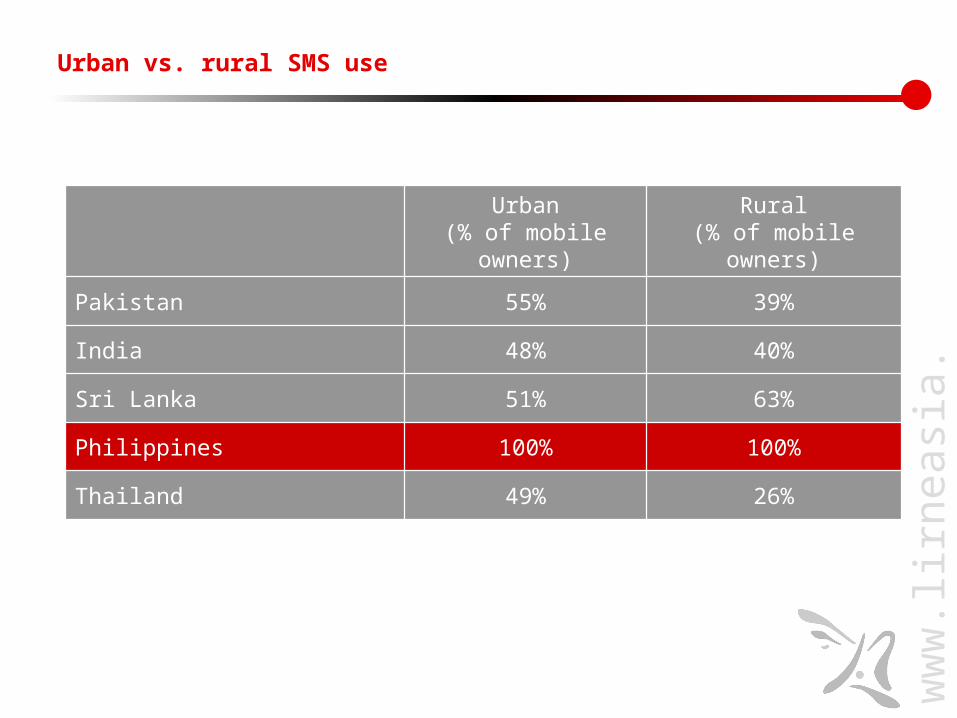
Urban vs. rural SMS use
Urban(% of mobile
owners)
Rural(% of mobile
owners)
Pakistan 55% 39%
India 48% 40%
Sri Lanka 51% 63%
Philippines 100% 100%
Thailand 49% 26%

ww
w.li
rnea
sia.
net
Call vs. SMS charges: Prepaid
Prepaid charges (USD)
Pakistan: Jazz Budget*
India: Airtel regular*
Sri Lanka: Dialog KIT standard
Philippines: Smart TnT
Charge per minute
Call to mobile on-net 0.030 0.030 0.063 0.119
Call to mobile off-net 0.041 0.049 0.063 0.141
Charge per SMS 0.014 0.030 0.018 0.022
* Call charges weighted for local and national calls
•Charges as at June 2007
•Packages selected based on lowest connection charge package of the largest operator
Low cost of SMS in the Philippines compared to India, but also higher literacy, Roman-based language and facility in using SMS

ww
w.li
rnea
sia.
net
Bottom of the pyramid
Missed calls

ww
w.li
rnea
sia.
net0%
20%
40%
60%
80%Pakistan
India
Sri LankaPhilippines
Thailand
Use of missed calls by mobile ow nersat BOP
Use of missed calls by f ixed phoneow ners at BOP
Use of missed calls: by mobile and fixed phone owners!
Missed calls used just as much in the SEC A,B & C samples

ww
w.li
rnea
sia.
net
Use of 'missed calls' to minimise communication costs
0%
10%
20%
30%
40%
50%
60%
70%
Pakistan India Sri Lanka Philippines Thailand
% o
f B
OP Male
Female
Use of missed calls: Males vs. females

ww
w.li
rnea
sia.
net
Other strategies
Use of 'strategies' to minimise call costs
0%
5%
10%
15%
20%
25%
30%
35%
40%
45%
50%
Make calls at off-peak hours (allowners)
Use phone as an incoming deviceonly (all owners)
Mobile to mobile calls only (all owners)
Fixed to fixed calls only (all owners)
Pakistan India Sri Lanka Philippines Thailand

ww
w.li
rnea
sia.
net
Bottom of the Pyramid
Getting connected
115 millionfrom BOP will get connected between mid-2006 & mid-2008

ww
w.li
rnea
sia.
net
Don't own and don't
plan to buy: 41.7%
(165 m)
Don't own but plan to buy:
28.9 %(115 m)
Already own a phone 29.4 %(116 m)
Those that planned to get connected between mid-2006-2008
Prospective owners

ww
w.li
rnea
sia.
net
Projected BOP penetration
36%
19%
41%
62%
77%
70%
50%
72%78%
86%
0
25
50
75
100
125
150
Pakistan India Sri Lanka Philippines Thailand
Con
nect
ion
s at
BO
P (
mill
ions
)
0%
20%
40%
60%
80%
100%
% o
f ho
useh
olds
at
BO
P w
ith a
tel
epho
ne
Already own something Don't own but plan to buy
Current ownership at BOP (%) Penetration at BOP by mid 2008

ww
w.li
rnea
sia.
net
Most would use phone for emergency communication & keeping in touch
What respondent would use the phone for if given one at an affordable rate
84%
69%
44%
58%
50% 52%57%
17%13%
26%
11%
21%
10%
18%
5% 3%2% 1% 2% 1%0%
10%
20%
30%
40%
50%
60%
70%
80%
90%
Pakistan India Sri Lanka Philippines
% o
f re
spo
nd
ents
To keep in touch with family andfriends
Only in an emergency
For networking
To enhance my income
Other

ww
w.li
rnea
sia.
net
Type of phone prospective owners would buy
23% 29%
52%
8%
68%67%
40%
91%
9% 4% 7% 1%
0%
10%
20%
30%
40%
50%
60%
70%
80%
90%
100%
Pakistan India Sri Lanka Philippines
Not decided yet
Mobile
Fixed phone
Type of phone that prospective owner would buy

ww
w.li
rnea
sia.
net
Bottom of the Pyramid
Not getting connected
165 millionfrom BOP will not get connected between mid-2006 & mid-2008

ww
w.li
rnea
sia.
net
The biggest barrier to ownership at the BOP is affordability
29% plan to get connected between mid-2006 and mid-2008
Potential primary
market for telecenters
BUT, 42% will not
Don't own and don't
plan to buy: 41.7%
(165 m)
Don't own but plan to buy:
28.9 %(115 m)
Already own a phone 29.4 %(116 m)

ww
w.li
rnea
sia.
net
What do we know about this group?
The large majority will be rural
42%53%
14%
46%
8%
58%47%
86%
54%
92%
0%
10%
20%
30%
40%
50%
60%
70%
80%
90%
100%
Pakistan India Sri Lanka Philippines Thailand% o
f non-o
wners
at
BO
P w
ho d
o n
ot
pla
n t
o b
uy
a
phone
Rural
Urban

ww
w.li
rnea
sia.
net
50%
67%
45%57%
16%
13%
19%
39% 22%
79%
25%
12%15%
13% 14%4% 7% 6%
0%
10%
20%
30%
40%
50%
60%
70%
80%
90%
100%
Pakistan India Sri Lanka Philippines Thailand% o
f non-o
wners
at
BO
P w
ho d
o n
ot
pla
n t
o b
uy
a
phone Above 3rd quartile
Median-3rd quartile
1st Quartile-median
Below 1st Quartile
What do we know about this group?
Poorer. E.g. The large majority will have monthly household incomes below USD 75.81

ww
w.li
rnea
sia.
net
Bottom of the pyramid
Benefits of access to telecom?

ww
w.li
rnea
sia.
net
Efficiency of daily activities
BOP in all countries sees efficiency
Efficiency of daily activities
1 2 3 4 5
India (3.90)
Sri Lanka (3.98)
Pakistan (4.17) Thailand (4.37)
Philippines (4.40)
worsened slightly worsened
no change somewhat improved
improved
ww
w.li
rnea
sia.
net
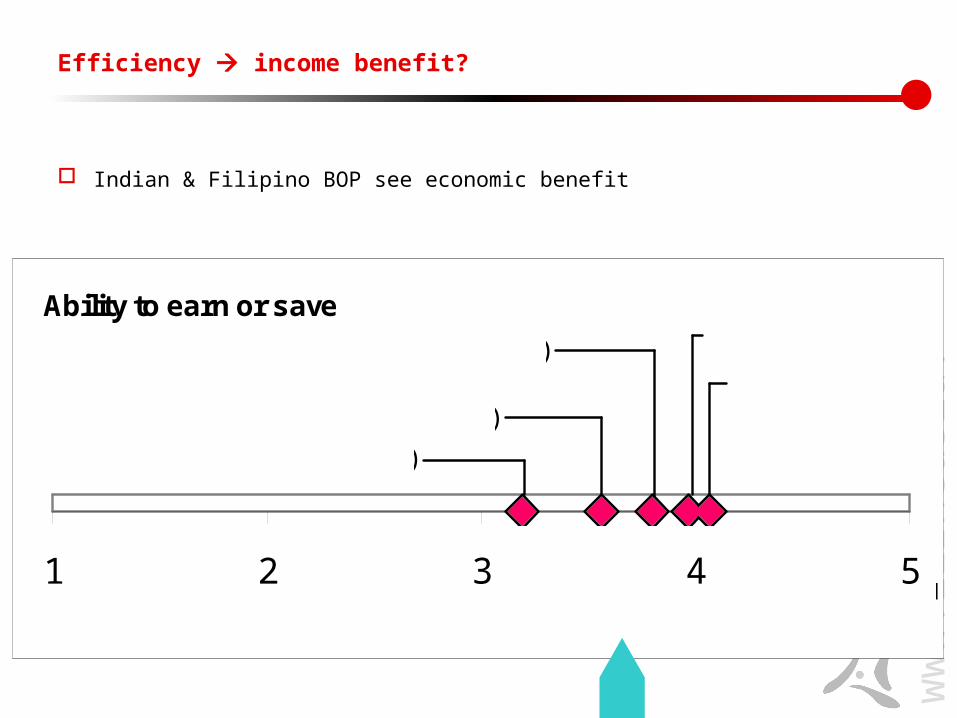
Efficiency income benefit?
Indian & Filipino BOP see economic benefit
Ability to earn or save
1 2 3 4 5
Sri Lanka (3.19)
Thailand (3.56)
Pakistan (3.80) India (3.97)
Philippines(4.07)
worsened slightly worsened
no change somewhat improved
improved

ww
w.li
rnea
sia.
net
But, sense of security is main perceived benefit
Ability to act in an emergency is key
Ability to act in emergency
1 2 3 4 5
India (4.28)
Pakistan (4.48)
Sri Lanka (4.58)
Philippines (4.63)
Thailand(4.83)
worsened slightly worsened
no change somewhat improved
improved

ww
w.li
rnea
sia.
net
Keeping in touch is important
Family and social relations
1 2 3 4 5
India (4.14)
Pakistan (4.30)
Sri Lanka (4.35)
Philippines (4.45)
Thailand(4.66)
worsened slightly worsened
no change somewhat improved
improved

ww
w.li
rnea
sia.
net
Social status and recognition improves in all countries except LK
Social status and recognition
1 2 3 4 5
Sri Lanka(3.47)
India(4.03)
Pakistan(4.05)
Thailand
(4.28)
Philippines(4.29)
worsened slightly worsened
no change somewhat improved
improved
`
ww
w.li
rnea
sia.
net
Bottom of the pyramid
Internet…what Internet?

ww
w.li
rnea
sia.
net
Internet use at the BOP
Pakistan India Sri Lanka Philippines Thailand
Use the Internet1.9% 0.3% 1.5% 8.8% 10.4%
Large gender divide exists, even in South East Asia: for e.g.11.9% of Filipino men at BOP use the internet, but only 5.7 of Filipino women at BOP use the internet
0.5%
2.2%
11.9%
13.6%
0.8%0.1%
2.9%
0.9%
5.7%
7.3%
0%
2%
4%
6%
8%
10%
12%
14%
16%
Pakistan India Sri Lanka Philippines Thailand
% a
t B
OP
Male
Female

ww
w.li
rnea
sia.
net
Internet use at the BOP cont’d
3.0%
0.2%
2.1%
12.8%
22.0%
0.7%0.1%
1.4%
4.3%
2.3%
0.0%
5.0%
10.0%
15.0%
20.0%
25.0%
Pakistan India Sri Lanka Philippines Thailand
% a
t B
OP
UrbanRural
Large urban-rural divide also exists in Internet use at the BOP across all five countries

ww
w.li
rnea
sia.
net
Internet awareness at the BOP
Internet awareness at the BOP is poor, especially in South Asia; 36% of Pakistanis at the BOP have not heard of the Internet before.
36.0%
71.9%
28.6%
14.3%
35.7%
0%
10%
20%
30%
40%
50%
60%
70%
80%
Pakistan India Sri Lanka Philippines Thailand
% o
f bo
ttom
of th
e py
ram
id
Not heard of Internet

ww
w.li
rnea
sia.
net
To Sum up
Access to telecoms is high, though ownership is low
People at the BOP are creative and have various strategies in using telecoms: SMS, missed calls, prepaid, use of second hand handsets, etc
Many people at the BOP prefer the mobile, and use prepaid
High access and use means people are familiar with the technology and thus a platform that can be used in developing services that targets people at the BOP
Examples of SMS use from the Philippines

ww
w.li
rnea
sia.
net
Examples of SMS Use in the Philippines
DOST’s ICT4D cases on Governance Education Social services Commerce
Institute of Popular Democracy’s use of SMS in election monitoringAmong Ed and Grace Padaca, the good and the badOverseas Filipino Workers SOS Project

ww
w.li
rnea
sia.
net
SMS use in the Philippines

ww
w.li
rnea
sia.
net
SMS use in the Philippines
Institute for Popular Democracy’s SMS-based system for anti-poll fraud and election monitoring (May 2007 elections) In the context of rampant vote-buying and cheating, make citizens
guard their votes and return credibility to the system AppliedTechnologies and Information Solutions (ATIS) at
www.atis.com.ph Citizens registered before the elections and send SMS to a designated
number, which are complied in a data base On election day, about almost a hundred messages from local
partners in different provinces were registered in the system. Half of these were verified to contain reliable information on vote-buying, ballot snatching, and election-related threats and violence.
Reports complied in a database and forwarded to the Commission of Elections (COMELEC) and other concerned agencies for action

ww
w.li
rnea
sia.
net
SMS use in the Philippines
Among’s Ed’s (Eddie Panlilio) gubernatorial campaign http://amonged.org/

ww
w.li
rnea
sia.
net

ww
w.li
rnea
sia.
net
SMS Use in the Philippines
Grace Padaca’s campaign
ww
w.li
rnea
sia.
net
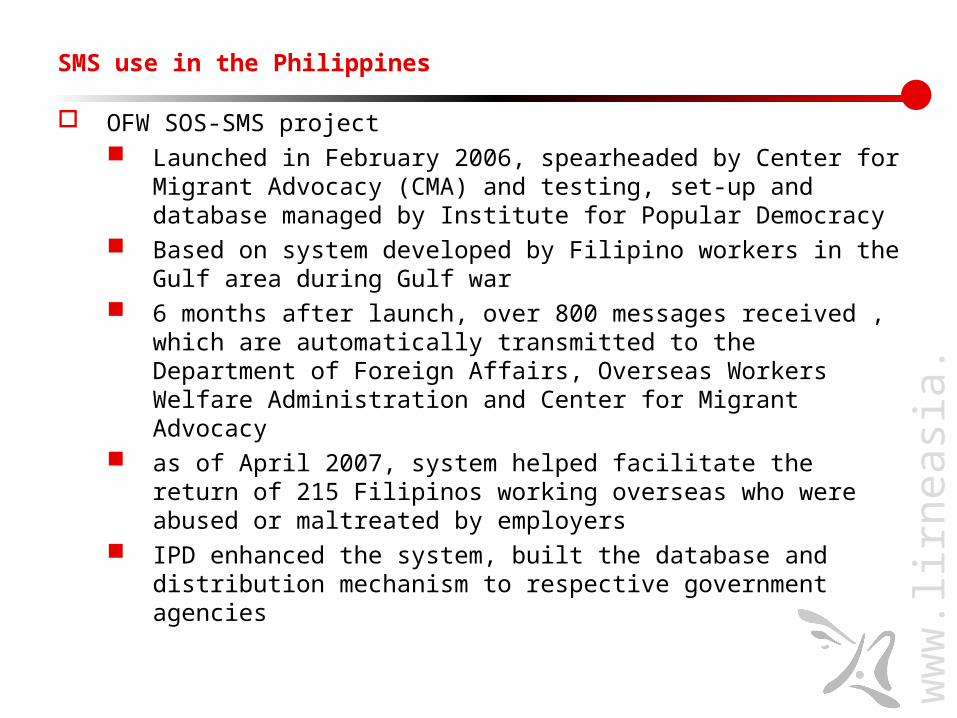
SMS use in the Philippines
OFW SOS-SMS project Launched in February 2006, spearheaded by Center for
Migrant Advocacy (CMA) and testing, set-up and database managed by Institute for Popular Democracy
Based on system developed by Filipino workers in the Gulf area during Gulf war
6 months after launch, over 800 messages received , which are automatically transmitted to the Department of Foreign Affairs, Overseas Workers Welfare Administration and Center for Migrant Advocacy
as of April 2007, system helped facilitate the return of 215 Filipinos working overseas who were abused or maltreated by employers
IPD enhanced the system, built the database and distribution mechanism to respective government agencies

ww
w.li
rnea
sia.
net
In sum…
People at the BOP uses telecoms, frugally, intelligently and creatively
Many are using mobile phones and are planning to get connected
Philippines – SMS use in mobilisation, empowering people, connecting people But same tools can also be used for rumor
mongering and to sow misinformation
ww
w.li
rnea
sia.
net
Conclusions
Thus, activists, NGOs, governments should creatively think of how to incorporate the use of mobiles and appropriate ICTs in their work, projects, and campaigns
Bearing in mind of course that social and cultural contexts frame how people adopt and utilise technologies

ww
w.li
rnea
sia.
net
Thank you very much for your attention!
Comments and questions?