www.ucd.ie/foodandhealth personalised nutrition eileen r gibney ucd institute of food and health
TRANSCRIPT

www.ucd.ie/foodandhealth
Personalised Nutrition
Eileen R GibneyUCD Institute of Food and Health

2002: Institute of the Future Palo Alto

2002: Institute of the Future Palo Alto
“The Direct Market Will be Sizeable…Our conservative forecast indicates that at least one third of consumers will be making some changes in their nutrient intake in response to personalised nutrition by 2010”.

Personalised Nutrition
Using knowledge to optimise an individuals diet

Populationdietary advice
Gene based individualdietary advice
Clustereddietary advice

Genetic variation
Height
Eye Colour
Hair Colour
Nutrient requirements

Nutrient-gene examples
• Association studies:– Linking a genetic variation to a physical trait
• FTO gene and body composition• TAS2R38 taste receptor and food intake
• Intervention studies– Where we can demonstrate that response to specific
interventions vary according to genotype• Weight loss• Salt sensitivity• Lipid metabolism

Association studies
• Genetic variation in taste– Influence of genotype on food choice
– TAS2R38 gene
• Genetic variation in body composition– Influence of genotype on adiposity levels
– FTO gene

Genetic variation in TAS2R38?
• TAS2R38• Bitter receptor gene in FP in
tongue• 3 SNPs polymorphisms result in
amino acid substitutions At position 49-amino acid
encoded is either proline or alanine
At position 262-amino acid encoded is either alanine or valine
At position 296-amino acid encoded is either valine or isoleucine
PP AA
AA VV
VV II
Tasters Non-tasters
PP PA AA
AA AV VV
VV VI II
Super Tasters
Medium-tasters
Non-tasters
Table 1- amino acids substitutions giving rise to variations
Table 2- Taster sub-groups

TAS2R38 genetic variation
• Supertasters V Non / Medium tasters:– More sensitive to taste of sugar– Find fats creamier– Detect / Bitter substances at lower levels
• Suggested effect on– Fruit and veg intake (bitter)– Fat intake– Alcohol intake
• Examine effect of genetic variation on habitual food intake (F & V) in Irish children (FIRM 2006-2010)
Feeney et al, Proc Nut Soc 2011

Anthropometry breakdown
Children n 525 Adults n 165
Males n 225
Females n 300
Malesn 39
Females n 126
Mean S.D Mean S.D. Mean S.D. Mean S.D.
Age / years 10.48 1.56 10.09 1.31 45.56 6.24 39.57 9.03
Weight / kg 38.94 10.79 38.20 10.54 84.36 11.70 68.99 14.62
Height / cm 143.66 10.96 140.72 9.88 176.99 7.92 163.08 7.63
BMI / kg m-2 18.58 3.34 19.01 3.39 26.96 3.68 25.91 5.16
Characteristics of participants
Feeney et al (in prep)

Significant Differences* in Food Group Intake in Children
*Denotes significances of p≤0.05
Total children
• Rice, pasta, grains & starches (NT > MT)• Processed potato products (ST > MT & NT)• Carrots (NT > ST)
• Yoghurts (NT > MT)
Boys • Rice, pasta, grains & starches (NT > MT & ST)• Biscuits & cakes (ST > MT & NT)
Girls • Yoghurts (NT & ST > MT)• Fish (MT > ST) • High-calorie beverages
(ST >MT & NT)
Genotype PROP Taster Status
O’Brien et al (in prep)

Dietary cluster analysis
• 2-Cluster Solution
• “High Fruit & Vegetable” and “Low Fruit & Vegetable”
• Genotype / Taster Status no influence on Cluster Membership
• “High F&V” cluster sig. higher mean daily intakes of many nutrients
O’Brien et al (in prep)

9 year old fat mass via
DEXA scan
9 year old lean mass via
DEXA scan

Intervention studies
• Examine whether responsiveness to a particular nutrient / diet is influenced by a particular genotype
– Weight loss responsiveness
– Salt restriction
– n-3 PUFA intake

Joint Conference - 50th Cardiovascular Disease Epidemiology and Prevention - and - Nutrition, Physical
Activity and Metabolism – 2010
Genetic Phenotype Predicts Weight Loss Success: The Right Diet Does Matter

101 Caucasian women on one of 4 diets over one year
• Low CHO, high protein diet
• Very low carbohydrate diet
• Low fat diet
• Very low fat diet
3 genotypes were tested based on an array of genes
• Low CHO responsive genotype
• Low fat diet responsive genotype
• Balanced diet responsive genotype


Salt sensitivity
Natural variation in response of BP to changes in salt intake – genetic variation in enzymes responsible for hypertension.
Obarzanek et al; Hypertension. 2003 Oct;42(4):459-67.

Variation according to genotype of Angiotension geneRR of intervention versus usual care
Hunt et al; Hypertension. 1998 Sep;32(3):393-401

FP6 Lipgene study“Lipids, genetics & the metabolic syndrome”
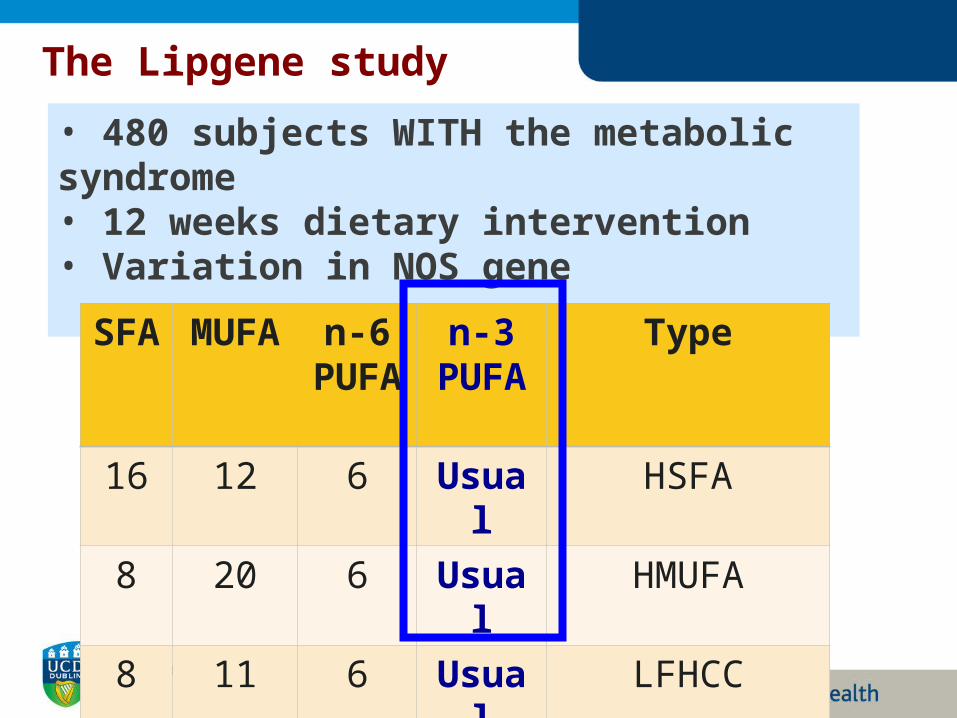
The Lipgene study
• 480 subjects WITH the metabolic syndrome• 12 weeks dietary intervention• Variation in NOS gene
SFA
MUFA
n-6PUF
A
n-3PUFA
Type
16 12 6 Usual HSFA
8 20 6 Usual HMUFA
8 11 6 Usual LFHCC
8 11 6 +1.24 LFHCC n-3


Many pathways
Multiple enzymes in each pathway
Multiple genetic variations in each enzyme
Nothing works in isolation
Interaction of enzymes and variations due to genetic variation


Personalised dietary analysis: A question of balance
Ease of use
Accuracy


• UCD Institute of Food and Health– National Nutrition Phenotype Database
– JINGO • (Joint Irish Nutrigenomic Organisation www.ucd.ie/jingo/)
Personalised Nutrition at UCD
Joint Irish Nutrigenomics Organisation
University College Cork
University College Dublin
Trinity College Dublin
University of Ulster

“Personalised Nutrition: An integrated analysis of opportunities and challenges”
€9m 2011-2014Coordinated by University College Dublin
22 partners


2002: Institute of the Future Palo Alto
“The Direct Market Will be Sizeable…Our conservative forecast indicates that at least one third of consumers will be making some changes in their nutrient intake in response to personalised nutrition by 2010”.