wyoming online reporting suite (ors) user’s guide · permissions in the wyoming online reporting...
TRANSCRIPT
Wyoming Online Reporting Suite (ORS)
User’s Guide

2
CONTACT INFORMATION
If you have questions about using the Online Reporting Suite (ORS), please contact: Wyoming Customer Support 1-877-327-9415 Customer Support hours: During the administration window: Monday – Friday 7:30 a.m. to 6:00 p.m., Mountain Standard Time Non-administration window: Monday – Friday 8:30 a.m. to 5:00 p.m., Mountain Standard Time

3
Contents About this Guide ............................................................................................................................... 4
Introduction ...................................................................................................................................... 4
Online Reporting Suite (ORS) .................................................................................................................. 4
ORS User Roles ........................................................................................................................................ 4
Logging into TOMS ............................................................................................................................ 5
Permissions and User Roles ............................................................................................................... 8
Permissions in the Wyoming Online Reporting Suite (ORS) ................................................................... 8
Accessing the Online Reporting Suite (ORS) ....................................................................................... 9
Selecting Your Reports .......................................................................................................................... 10
Using the Dashboard ....................................................................................................................... 11
Search Functionality .............................................................................................................................. 12
Other System Icons ............................................................................................................................... 13
Aggregate Reports .......................................................................................................................... 14
Understanding the Average Scale Score Reports ................................................................................. 14
Navigating Between Organization Levels ............................................................................................. 16
Additional Sorting Options .................................................................................................................... 21
Navigating Down to a Student .............................................................................................................. 21
Understanding Performance Reports ................................................................................................... 22
Navigating between Average Scale Score and Performance Reports .................................................. 26
Student Reports .............................................................................................................................. 27
Disaggregated Reports .................................................................................................................... 30
Filtering the Data Display in the Reporting Suite ................................................................................. 30
Exporting Reports ........................................................................................................................... 31
PDF or CSV Export from Reporting Suite Screen .................................................................................. 31
Comparison Reports ........................................................................................................................ 32
Overview ............................................................................................................................................... 32
Accessing the Comparison Reports ...................................................................................................... 32
Navigating the Comparison Report ...................................................................................................... 33
Viewing Comparisons to District and State .......................................................................................... 39
Selecting a Student Group .................................................................................................................... 44
Protecting Personal Identifiable Information ....................................................................................... 44

4
About this Guide This guide provides instructions on how to use the Wyoming Online Reporting Suite (ORS). You may notice slight differences in what is displayed on the Online Reporting Suite and what is shown in this manual. The screenshots used in this guide are for demonstration purposes only. All data provided in this guide is fictional. The view may appear differently in Mac or Windows browsers. This section lists abbreviations and icons you may see in this guide and in the Test Operations Management System (TOMS).
Table 1: Icons found in Wyoming Online Reporting Suite Guide
Icon Description
Notes: This symbol appears next to text that indicates important information related to a task or ORS feature.
Step number: These circled numbers appear on screenshots of the Wyoming Online Reporting Suite (ORS) and correspond to descriptions or step-by-step instructions in the manual.
Introduction Online Reporting Suite (ORS)
The Wyoming Online Reporting Suite (ORS) is a comprehensive, secure online reporting system that is interactive and allows users to create customized reports to display aggregate data at the state, district, building, and student level. The reports are cumulative, and provide student data with relevant score measures. As with the TOMS portion of the system, the reporting features are role‐based, allowing access to and creation of reports based on roles and access features. These reports incorporate text and graphics to assist understanding of the information presented. Our student-level reports are available on demand so users can share pertinent information about student performance when needed. These reports include the student’s scale score, current performance level, and percentile information. Additionally, the reports provide performance information by domain to allow users to quickly identify areas of strength as well as areas where the student needs additional learning opportunities. The ORS delivers reports in both Adobe Acrobat PDF and CSV formats for convenience and flexibility in printing and sharing. ORS User Roles
ORS functions are available to users according to the role assigned to them in TOMS. Your user role dictates your level of access to the ORS. The roles are:
Wyoming Department of Education (WDE)
5
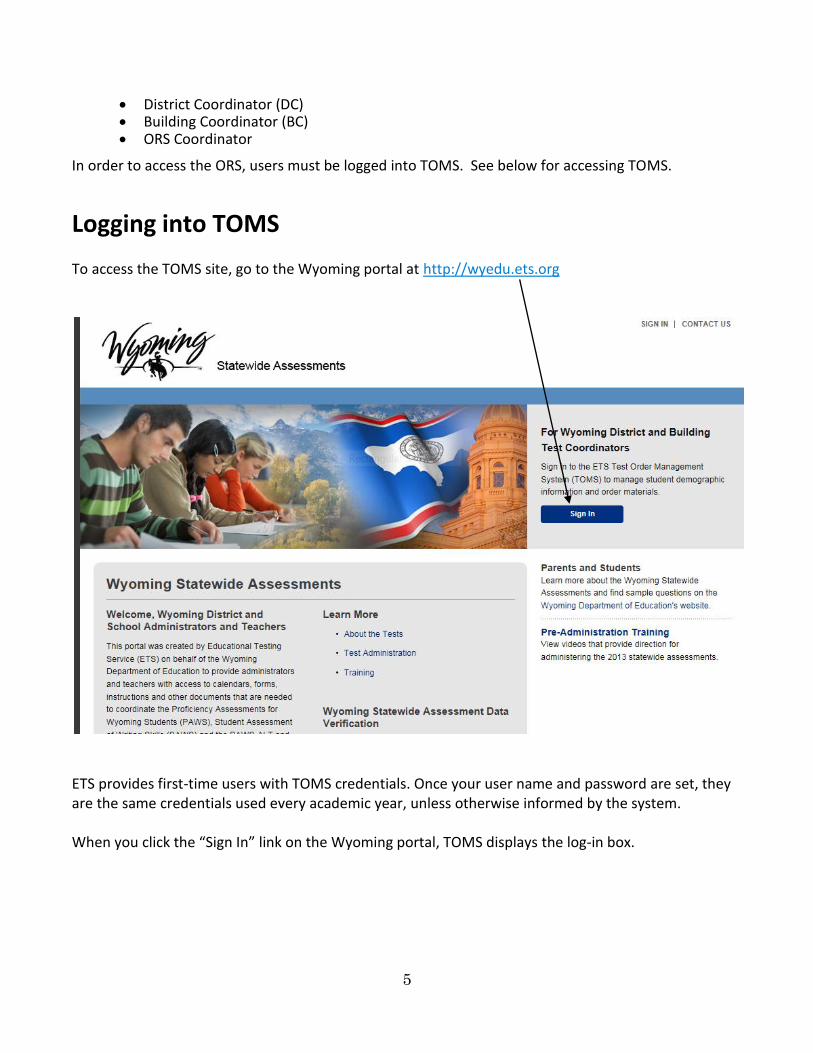
District Coordinator (DC) Building Coordinator (BC) ORS Coordinator
In order to access the ORS, users must be logged into TOMS. See below for accessing TOMS.
Logging into TOMS To access the TOMS site, go to the Wyoming portal at http://wyedu.ets.org
ETS provides first-time users with TOMS credentials. Once your user name and password are set, they are the same credentials used every academic year, unless otherwise informed by the system. When you click the “Sign In” link on the Wyoming portal, TOMS displays the log-in box.

6
1. Enter the username and password that was sent via e-mail. 2. Click Login. 3. First time users will be prompted to change their temporary password.
Enter and confirm your new password and click “SUBMIT.” NOTE: Passwords must be a minimum of 8 characters and contain all of the following:
A minimum of one upper case letter
A minimum of one number
A minimum of one special character

7
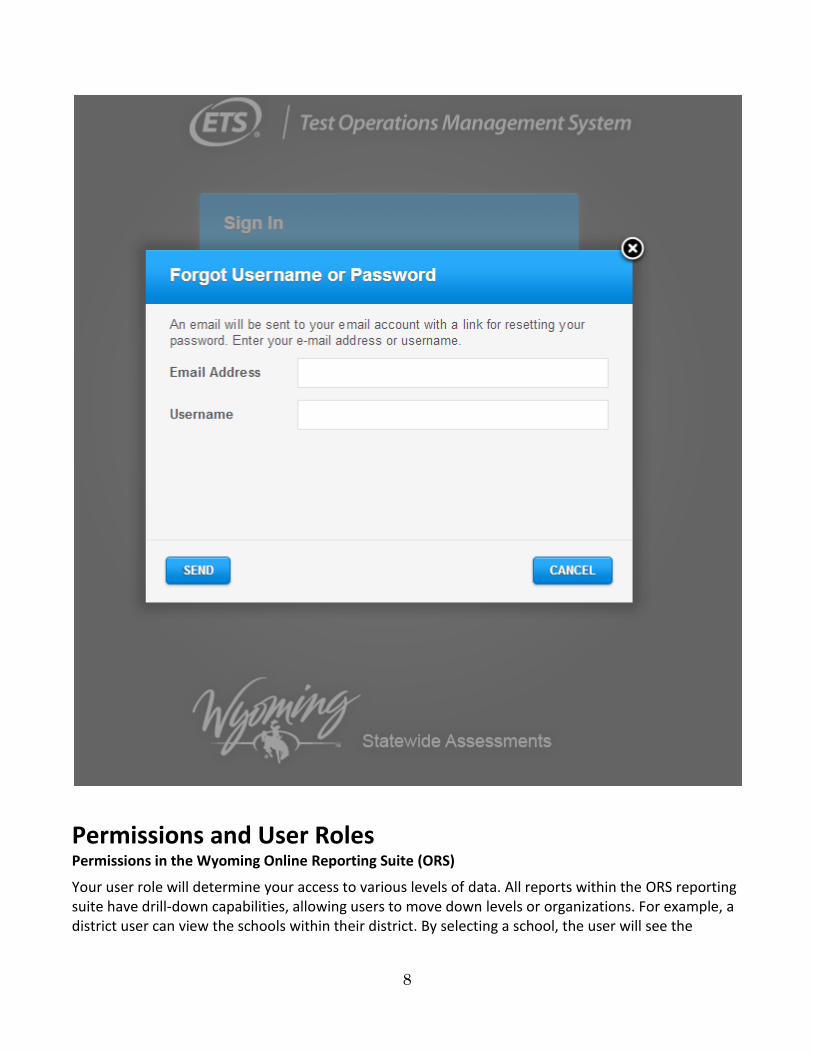
Retrieving Lost Information for Logging In
Should you forget your user name or password on subsequent logins, click the link under the “LOGIN” button.
A pop-up allows you to direct the system where to e-mail your user name or steps for resetting your password. Enter your e-mail address and user name and click “SEND.” You will receive a temporary password via e-mail.
8
Permissions and User Roles Permissions in the Wyoming Online Reporting Suite (ORS)
Your user role will determine your access to various levels of data. All reports within the ORS reporting suite have drill-down capabilities, allowing users to move down levels or organizations. For example, a district user can view the schools within their district. By selecting a school, the user will see the

9
students’ scores within the school. To view an individual student’s results, select a student’s name within a school report.
Table 2: User Role Permissions
User Role State-level Reports (all districts)
District-level Reports (all schools)
School-level Reports (all students)
Student PDF of ISR
State (WDE)
District Coordinator
Building Coordinator
PAWS ORS Coordinator
Accessing the Online Reporting Suite (ORS) Selecting “Reports” from the left-hand navigation buttons in TOMS will allow you to select the “Reporting Suite” link that will direct you to the ORS landing page.
1. Click on the “Reports” tab in the left navigation menu of TOMS. 2. Then click on the “Reporting Suite” tab. You will be presented with a link to “View Reporting
Suite.”
10
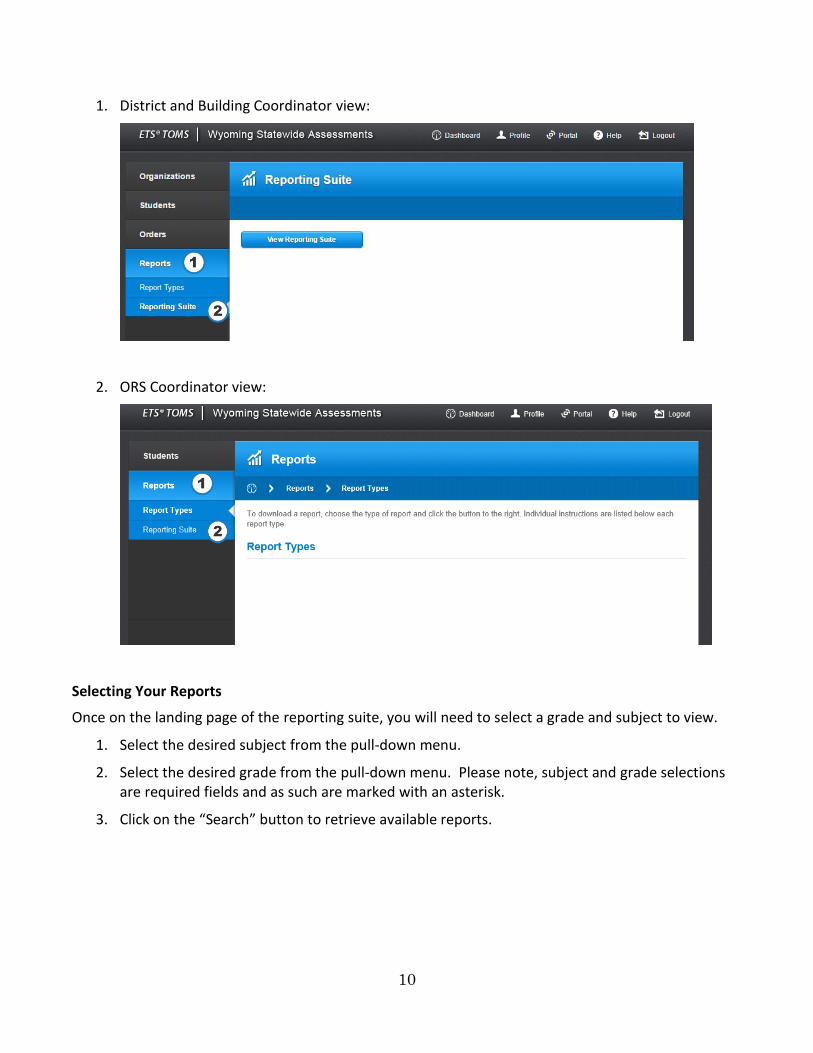
1. District and Building Coordinator view:
2. ORS Coordinator view:
Selecting Your Reports
Once on the landing page of the reporting suite, you will need to select a grade and subject to view.
1. Select the desired subject from the pull-down menu.
2. Select the desired grade from the pull-down menu. Please note, subject and grade selections are required fields and as such are marked with an asterisk.
3. Click on the “Search” button to retrieve available reports.

11
Once you have selected the subject and grade, you will be presented with a list of available reports (i.e. administrations), see Figure 1. Select the administration you are interested in from the list. Note that in 2016, only one administration will be available.
Figure 1: Report Selection List of Administrations
Using the Dashboard When you access reports, a list of scores based on your user level and the filters chosen will appear. The top portion of each report (Summative or Comparison) is known as the report dashboard. From

12
this dashboard, you can quickly identify where you are in the reporting suite, including: aggregation level, administration, grade, content, and any selected student filters. From your report dashboard, you can access the links shown in Figure 2:
1. Summative: Click to return to the report selection page from anywhere within the reporting suite. 2. Filters: Click on “All Students Group” to select student demographic filters to view reports based
on a desired student group. 3. Navigation Buttons: Click to navigate between Average Scale Score and Performance reports. By
default you will view the Performance Reports section of the ORS.
Figure 2: Working in the Dashboard
Search Functionality
The lookup functionality within the reporting suite allows you to quickly locate and navigate to a specific district, school, or student depending on user role. For example, district-level users will be able to search for a particular school within their district, whereas from the school level, users are able to search for a student within their school by using the search function. As you type within the search box, the system will begin to populate a list of available options to choose.
To ensure proper use of the search option, you must select the name of the district, school, or student from the populated list.

13
Other System Icons
There are icons within the ORS designed to support user understanding and report interpretation.
The information icon is located at the bottom of all reports within the ORS. When a user clicks this icon, a pop-up window appears outlining the report purpose, common legend, and onscreen icon descriptions.
To further assist users in interpreting the information presented within the reports, there are tool tips throughout the reporting suite. When the user hovers over an icon, report-specific text will display on screen.

14
Aggregate Reports Aggregate score reports are available at the state, district, and school level by grade and subject. All aggregate score reports can be disaggregated into student demographic categories for detailed analysis. Understanding the Average Scale Score Reports
All of the average scale score reports are available by administration, grade, and subject and have similar layouts. At the top of the reports are the navigation buttons (Figure 3) which display the current organization level’s average scale score, percent of students at the proficient and advanced performance levels, and the number of students with completed tests included within that grade and subject. For example, a district user viewing 3rd grade mathematics results will see the district average scale score and the percent of 3rd grade students within the district that are categorized as proficient and advanced on that mathematics assessment, in addition to the number of 3rd grade students that are included in the data.
Figure 3: Dashboard Navigation Buttons
State and district average scale score reports display a distribution of average scale scores (Figure 4). To see this display, click on the “Average Scale Score” box. From this distribution, you can hover over any bar and see the number of districts or schools (depending on organization level you are viewing)

15
that had an average score in that scale score range. Once you determine the scale score range you are interested in, simply select the bar in the distribution. This will allow you to see the districts or schools within that range.
Figure 4: Selecting a Portion of a District Scale Score Range
When you select a scale score range in the distribution (as seen in Figure 4), a subsequent report will display another distribution of organizations that is restricted to that range. This report also contains a listing of the organizations within that range and corresponding test completion status, average scale score, number of students completed, and the performance level based on the average scale score (Figure 5).

16
Figure 5: Deeper Detail of a District Scale Score Range
1. Comparison information 2. State and District Average (Note, in many instances, these lines are very close to one another.) 3. Performance Level bar
Navigating Between Organization Levels
From the restricted score range report, you are able to navigate down to the next organization level by simply clicking on the corresponding bar in the distribution or on the organization name in the list as shown in Figure 6.

17
Figure 6: Navigating to the Next Organizational Level

18
Figure 7: Drilling Down to the School
To navigate back up a level, use the dashboard and click the desired level at the top of the page.
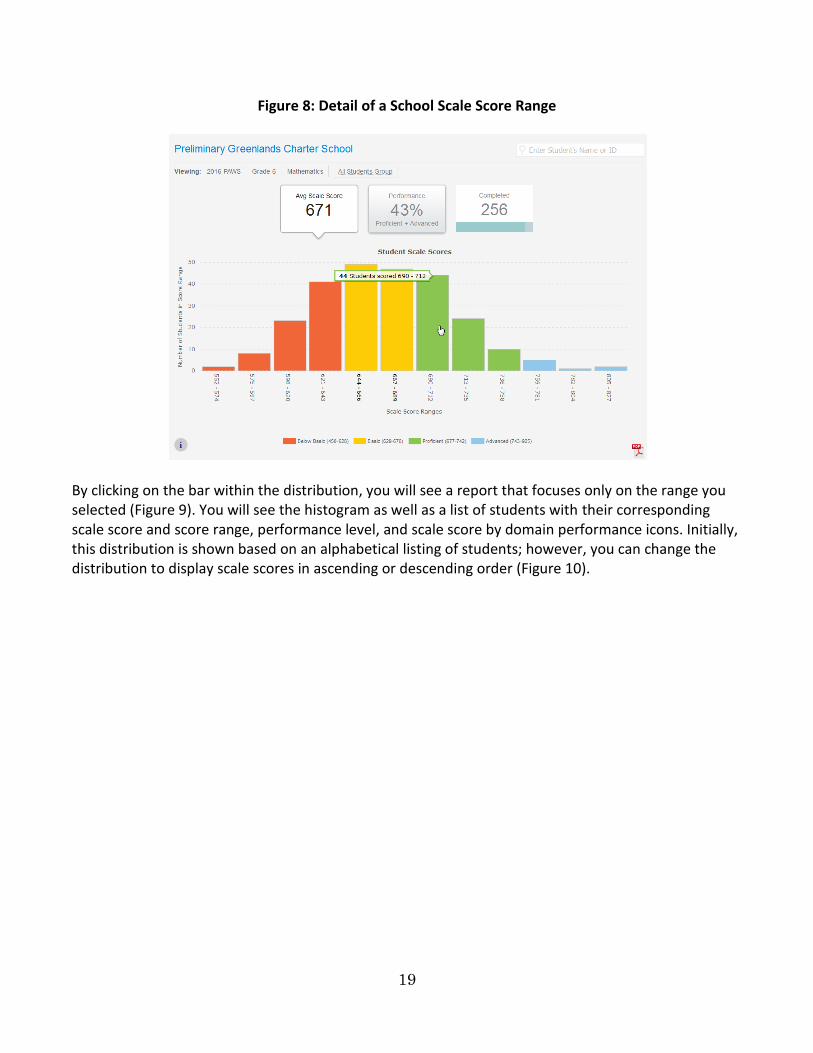
School-level scale score reports follow a similar layout and functionality; however, the distribution shows student scale scores within a grade and content of the school (Figure 8). From the initial distribution you can filter to a specific score range by clicking on the bar representing the range of interest to see a listing of students within that range.
19
Figure 8: Detail of a School Scale Score Range
By clicking on the bar within the distribution, you will see a report that focuses only on the range you selected (Figure 9). You will see the histogram as well as a list of students with their corresponding scale score and score range, performance level, and scale score by domain performance icons. Initially, this distribution is shown based on an alphabetical listing of students; however, you can change the distribution to display scale scores in ascending or descending order (Figure 10).

20
Figure 9: Deeper Detail of a School Scale Score Range

21
Figure 10: Ability to sort students based on score
Additional Sorting Options
A user can sort students based on name, score, or by any domain score. This allows you to quickly identify students that are excelling or struggling with content of a specific domain. Navigating Down to a Student
Should you want to see score results at the student level, simply click on the student’s name or the bar in the distribution that represents that student and you will be redirected to that student’s score results (Figure 11).

22
Figure 11: Student-level detail from School Scale Score Range
Understanding Performance Reports
The performance reports provide information on the percent of students at the proficient and advanced performance levels by administration, grade and subject, and demographic characteristics (displayed in the performance navigation button on the dashboard). Like the scale score reports, these are organization-specific, yet have similar views.

23
At the top of the report are the navigation buttons (Figure 12). The navigation buttons display the organization level average scale score, percent at or above proficient, and the number of students included within that grade and content area. For example, a district user viewing 3rd grade mathematics results will see the district average scale score and the percent of the 3rd grade students within the district that are categorized as at or above proficient on that mathematics assessment, in addition to the number of 3rd grade students that are included in the data.
Figure 12: Dashboard Navigation Buttons
State and district performance reports provide a listing of districts or schools (depending on the organization level you have access to and are viewing), status, average scale score, and the percentage of students within each performance level (Figure 13). As with previous examples, to drill down to the next organizational level, in this case a school district, click on the district name in the list (Figure 13).
Figure 13: State Performance Reports
24
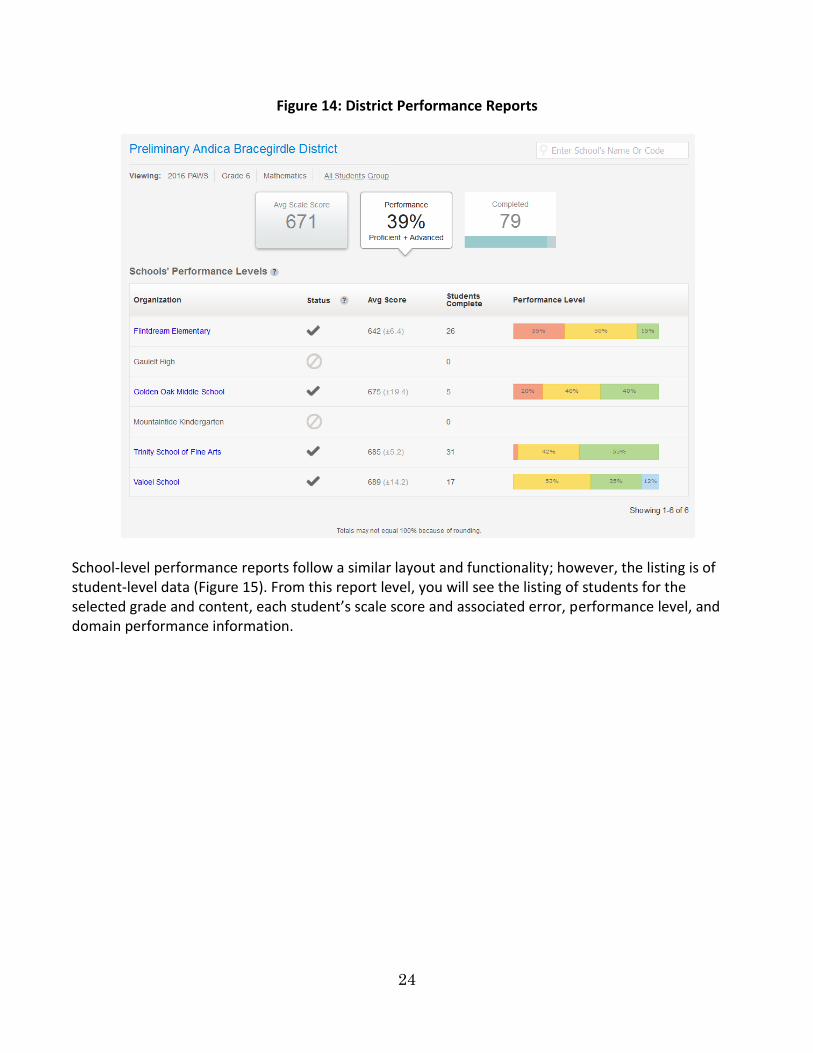
Figure 14: District Performance Reports
School-level performance reports follow a similar layout and functionality; however, the listing is of student-level data (Figure 15). From this report level, you will see the listing of students for the selected grade and content, each student’s scale score and associated error, performance level, and domain performance information.

25
Figure 15: School Performance Reports
To see an individual student’s score results, click on the student’s name (Figure 16). Remember you can search for a specific student at any time by using the search feature in the top right portion of all reports.

26
Figure 16: Student-level Results
Navigating between Average Scale Score and Performance Reports
You can move between the average scale score and performance reports by selecting one of the navigation buttons. The button for the report that is shown will appear white in color, while the other report appears light grey in color (Figure 17 and 18). Simply clicking on the button for the report data will change the report that is visable. Note that these navigation buttons function within the organization level; therefore, selecting a button will take you to the other report for that organization. To move back up an organization level, click on the desired drill down level displayed on the header line. This line expands as you drill down the available levels of reporting. To move down an

27
organization level, select the organization from within the report. For example, a district user that is evaluating a school’s scale score report can quickly switch to view the school’s performance report by selecting the performance box.
Figure 17: Dashboard Navigation Buttons
Figure 18: Dashboard Navigation Buttons
Student Reports The student report displays several components that are intended to outline student performance in comparison to school, district, and state averages as well as provide performance information at the domain level. The following components are outlined below (Figure 19).
1. Scale Score a. Shows the student’s scale score and associated variability.
2. Performance Bar a. Highlights the scale range in relation to the performance categories and corresponding
cut scores.
28
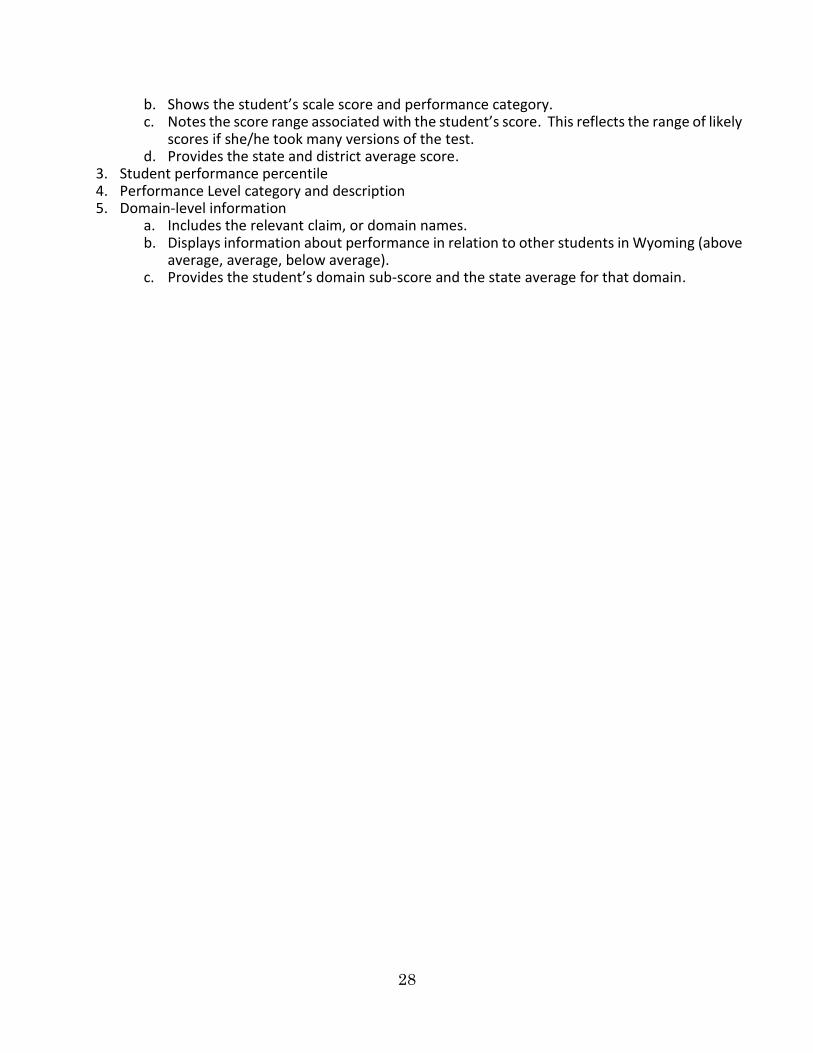
b. Shows the student’s scale score and performance category. c. Notes the score range associated with the student’s score. This reflects the range of likely
scores if she/he took many versions of the test. d. Provides the state and district average score.
3. Student performance percentile 4. Performance Level category and description 5. Domain-level information
a. Includes the relevant claim, or domain names. b. Displays information about performance in relation to other students in Wyoming (above
average, average, below average). c. Provides the student’s domain sub-score and the state average for that domain.

29
Figure 20: Student-level Reports
Please note, this report is a student-level report within the ORS and is not intended to be as comprehensive as the Individual Student Report (ISR).
30
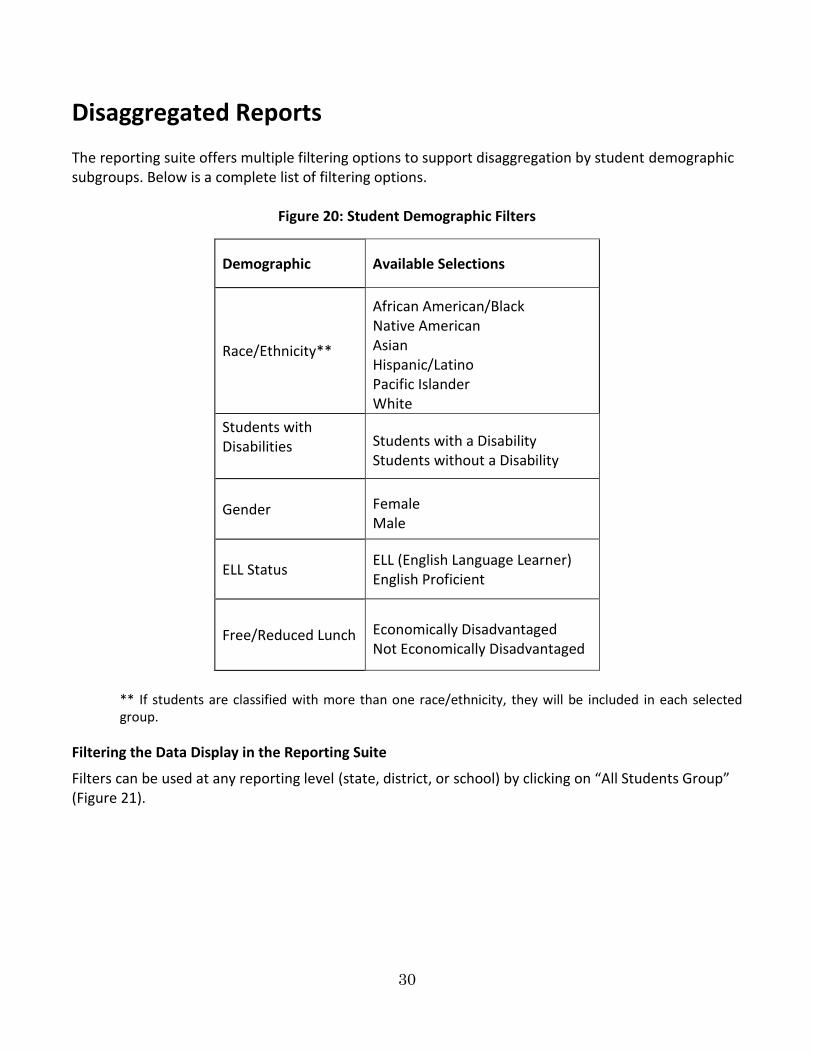
Disaggregated Reports The reporting suite offers multiple filtering options to support disaggregation by student demographic subgroups. Below is a complete list of filtering options.
Figure 20: Student Demographic Filters
Demographic Available Selections
Race/Ethnicity**
African American/Black Native American Asian Hispanic/Latino Pacific Islander White
Students with Disabilities
Students with a Disability Students without a Disability
Gender Female Male
ELL Status ELL (English Language Learner) English Proficient
Free/Reduced Lunch Economically Disadvantaged Not Economically Disadvantaged
** If students are classified with more than one race/ethnicity, they will be included in each selected group.
Filtering the Data Display in the Reporting Suite
Filters can be used at any reporting level (state, district, or school) by clicking on “All Students Group” (Figure 21).
31
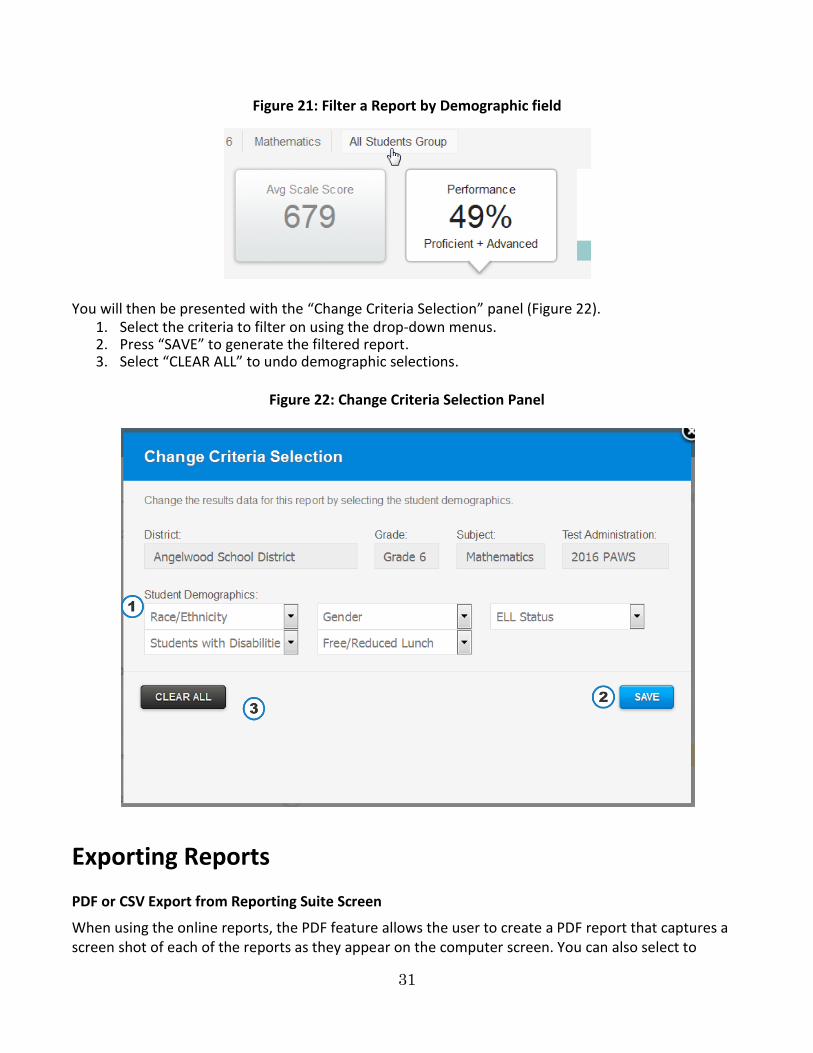
Figure 21: Filter a Report by Demographic field
You will then be presented with the “Change Criteria Selection” panel (Figure 22).
1. Select the criteria to filter on using the drop-down menus. 2. Press “SAVE” to generate the filtered report. 3. Select “CLEAR ALL” to undo demographic selections.
Figure 22: Change Criteria Selection Panel
Exporting Reports PDF or CSV Export from Reporting Suite Screen
When using the online reports, the PDF feature allows the user to create a PDF report that captures a screen shot of each of the reports as they appear on the computer screen. You can also select to

32
export data in a CSV file format for reports that present table information (Figure 23). These export options are always located in the lower right-hand corner of an online reports screen. Click on the ‘ ’ for a PDF and the ‘ ’ symbol for to download a CSV file.
Figure 23: PDF or CSV Export from a Reporting Suite Screen
Comparison Reports Overview
The Comparison Report was designed to be a public-facing report, so nopersonally identifiable student information is contained within the report and a suppression rule is in effect. Student data will show as “not enough data” when fewer than 11 students are within the selected filters. In addition to providing a quick report for users to evaluate the average information for the state, district, or school, the report provides a menu for users to select a similar district or school for more meaningful comparisons. For example, if a district user would like to see how their students are performing compared to another district that has similar student demographics, the user could select that district and examine any performance differences. Accessing the Comparison Reports
The Comparison Reports are accessed on the same landing page as the Summative Reports; simply click on “Comparison” on the top bar and you will be directed to the report (Figure 24).

33
Figure 24: Accessing Comparison Reports
Navigating the Comparison Report
The report lands at the state level and provides aggregate performance information across tested grades (Figure 25). Initially, you will see the overall performance information reported as the number of students, percent of students at the proficient and advanced performance levels, and the percentage of students in each performance level.
Figure 25: State View of Comparison Report
34
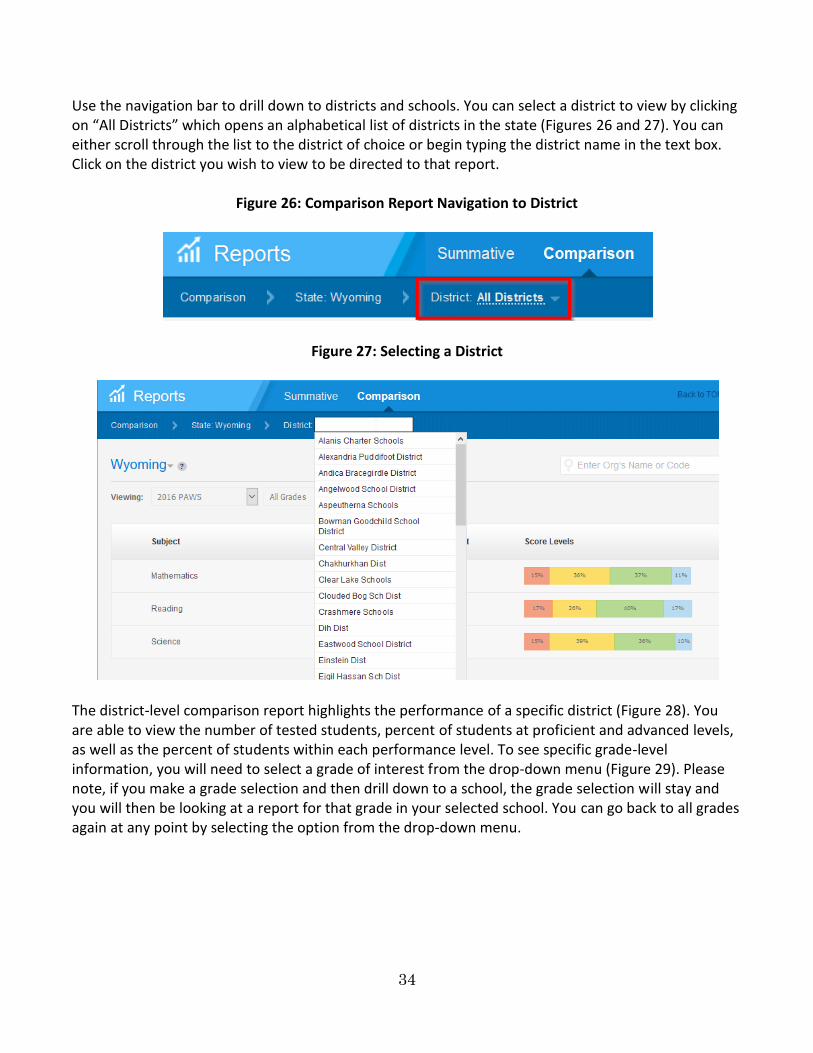
Use the navigation bar to drill down to districts and schools. You can select a district to view by clicking on “All Districts” which opens an alphabetical list of districts in the state (Figures 26 and 27). You can either scroll through the list to the district of choice or begin typing the district name in the text box. Click on the district you wish to view to be directed to that report.
Figure 26: Comparison Report Navigation to District
Figure 27: Selecting a District
The district-level comparison report highlights the performance of a specific district (Figure 28). You are able to view the number of tested students, percent of students at proficient and advanced levels, as well as the percent of students within each performance level. To see specific grade-level information, you will need to select a grade of interest from the drop-down menu (Figure 29). Please note, if you make a grade selection and then drill down to a school, the grade selection will stay and you will then be looking at a report for that grade in your selected school. You can go back to all grades again at any point by selecting the option from the drop-down menu.

35
Figure 28: District-level Comparison Report
Figure 29: Selecting a Grade
Once you have navigated to a specific grade, you will see average score information in addition to the performance percentages (Figure 30).

36
Figure 30: Grade-specific Comparison Report
To navigate to a specific school, use the top navigation bar (Figure 31). Click on “All Schools” and an alphabetized list of schools within the previously selected district will appear. You can either scroll to the school of choice or begin typing the school name in the text box and select the school from the list (Figure 32).
Figure 31: Comparison Report Navigation to School

37
Figure 32: Selecting a School
As with the previous reports, the initial report will provide information across tested grades (Figure 33). You may select a specific grade in the same manner as done previously (Figure 34). Please keep in mind, if you selected a specific grade in a district and then moved down to a school, the report will be for the grade selected at the district level. Should you want to go to a view of all grades for the school, you will need to select “All Grades” in the dropdown.

38
Figure 33: School-level Comparison Report
Figure 34: Grade-specific Comparison Report

39
Viewing Comparisons to District and State
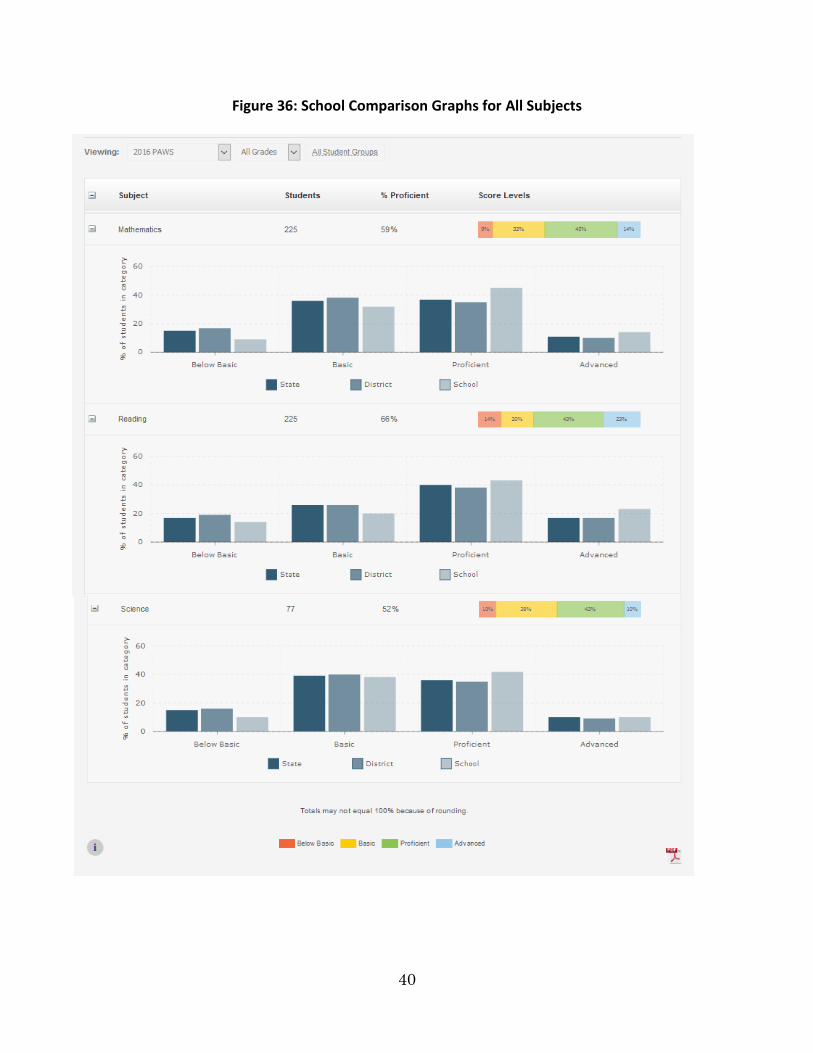
To see how a district compares to the state averages, or how a school compares to its district and state, click on the + icon next to “Subject” to open a comparison graph for each subject (Figure 35). You can also view one subject area by clicking on the + next to that subject. The comparison graph at a school level displays the percentage of students in each performance level against their district and to the state (Figure 36). The comparison graphs at a district level will show the percentage of students in each performance level against the state (Figure 37).
Figure 35: Accessing Comparison Graphs for All Subjects
40
Figure 36: School Comparison Graphs for All Subjects

41
Figure 37: Accessing School Comparison Graphs for One Subject
42
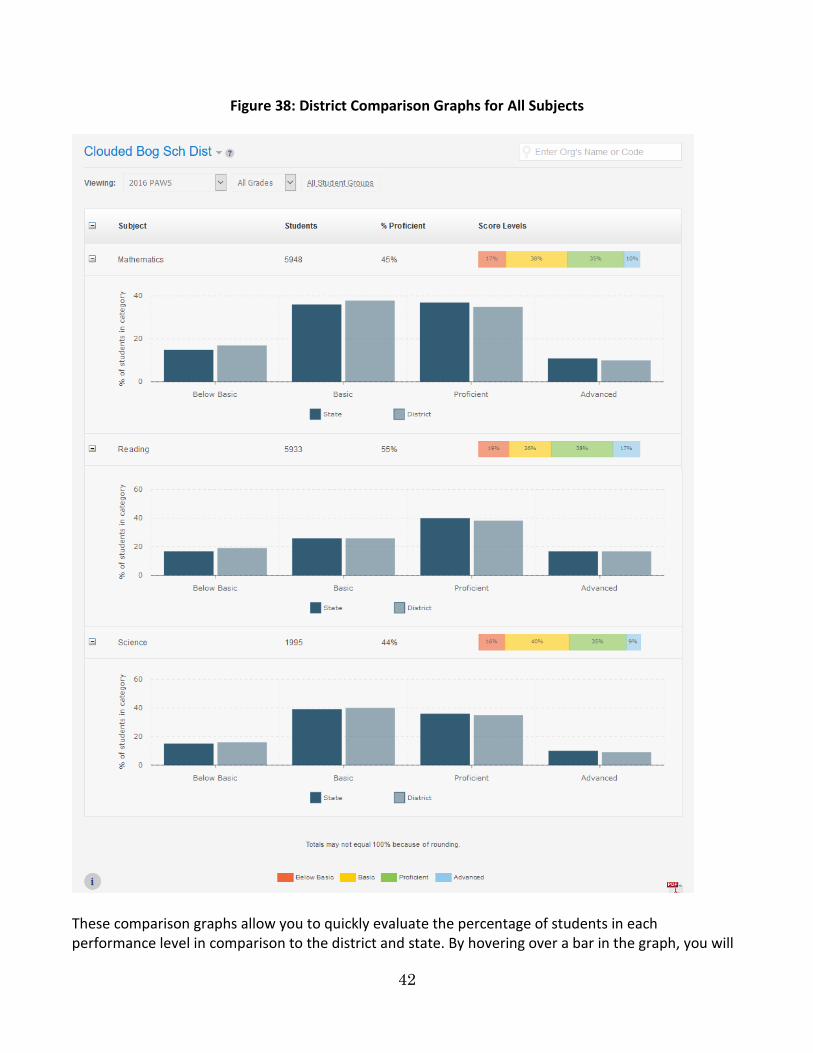
Figure 38: District Comparison Graphs for All Subjects
These comparison graphs allow you to quickly evaluate the percentage of students in each performance level in comparison to the district and state. By hovering over a bar in the graph, you will

43
see the percentage value for that bar (Figure 39). You can also remove a comparison organization by clicking on the box in the legend below the graph (Figure 40). Once turned off, the selected organization is no longer visible in the graph. In Figure 41, you can see district has been checked off and the comparison is now only for the school and the state.
Figure 39: Hover Information Display
Figure 40: Removing a Comparison Reference
Figure 41: Displaying School to State Comparison

44
Selecting a Student Group
As with the summative reports, you can view information about a specific student group by using the filter options (Figure 42).
Figure 41: Selecting Student Filters
Figure 43: Criteria Selection Box
Protecting Personal Identifiable Information
Because the comparison reports are viewable across districts and schools, it is important to note that there is a suppression rule in place. Within these reports, if you make a selection that results in fewer than 11 students, the resulting report will show icons to indicate there is not enough data (Figure 44).

45
Figure 44: Not Enough Data
I don’t remember reading anything here about clicking on the iBox for information. Maybe I missed it.