x-band photonic bandgap (pbg) accelerator structure ... · x-band photonic bandgap (pbg)...
TRANSCRIPT
X-Band Photonic Bandgap (PBG) Accelerator Structure Breakdown Experiment
Roark A. Marsh∗Plasma Science and Fusion Center, Massachusetts Institute of Technology, Cambridge, MA 02139, USA and
NIF & Photon Science and Applications, Lawrence Livermore National Laboratory, Livermore, CA 94550, USA
Michael A. Shapiro, Richard J. TemkinPlasma Science and Fusion Center, Massachusetts Institute of Technology, Cambridge, MA 02139, USA
Valery A. Dolgashev, Lisa L. Laurent, James R. Lewandowski, A. Dian Yeremian, Sami G. TantawiSLAC National Accelerator Laboratory, Menlo Park, CA 94025, USA
(Dated: October 8, 2010)
In order to understand the performance of photonic bandgap (PBG) structures under realistichigh gradient, high power, high repetition rate operation, a PBG accelerator structure was designedand tested at X-Band (11.424 GHz). The structure consisted of a single test cell with matching cellsbefore and after the structure. The design followed principles previously established in testing aseries of conventional pillbox structures. The PBG structure was tested at an accelerating gradientof 65 MV/m yielding a breakdown rate of two breakdowns per hour at 60 Hz. An acceleratinggradient above 110 MV/m was demonstrated at a higher breakdown rate. Significant pulsed heatingoccurred on the surface of the inner rods of the PBG structure, with a temperature rise of 85 Kestimated when operating in 100 ns pulses at a gradient of 100 MV/m and a surface magnetic fieldof 890 kA/m. A temperature rise of up to 250 K was estimated for some shots. The iris surfaces,the location of peak electric field, surprisingly had no damage, but the inner rods, the locationof the peak magnetic fields and a large temperature rise, had significant damage. Breakdown inaccelerator structures is generally understood in terms of electric field effects. These PBG structureresults highlight the unexpected role of magnetic fields in breakdown. The hypothesis is presentedthat the moderate level electric field on the inner rods, about 14 MV/m, is enhanced at small tipsand projections caused by pulsed heating, leading to breakdown. Future PBG structures should bebuilt to minimize pulsed surface heating and temperature rise.
PACS numbers: 29.20.Ej, 52.80.Pi, 52.80.Vp
I. INTRODUCTION
Photonic crystals or photonic bandgap (PBG) stuc-tures provide a groundbreaking starting point for ad-vanced accelerator structure design. Photonic crystalsare made up of an array of varying dielectric or metallicstructures that affect frequency bands of electromagneticwaves passing through them, prohibiting all propagationwithin a bandgap when it exists [1, 2]. In application toaccelerator structures, PBG structures have the ability toconfine modes in a frequency band of interest, and dampmodes of higher (or lower) frequencies. This allows PBGstructures to be fabricated as a novel accelerator conceptincorporating simultaneous damping of all higher ordermodes (HOMs). The use of a metallic PBG structureas an accelerator was first proposed based on a squaremetallic lattice in [3]. A structure with a triangular lat-tice has improved symmetry for accelerators and goodagreement has been observed between network analyzermeasurements and simulations [4]. A six cell travelingwave structure has also been built, based on this first de-sign [5]. This PBG structure demonstrated accelerationusing a photonic structure for the first time [6]. HOMs
∗Electronic address: [email protected]
in PBGs have been simulated, and PBG wakefields havealso been measured [7–9].
Recent advances in the study of photonic structuresfor accelerator applications include research on hybridstructures consisting of metallic and dielectric compo-nents [10, 11]; research on quasi-crystals [12]; researchon disordered photonic structures [13]; research on trun-cated, optimized photonic structures [14]; and theoreticalresearch on wakefields [15].
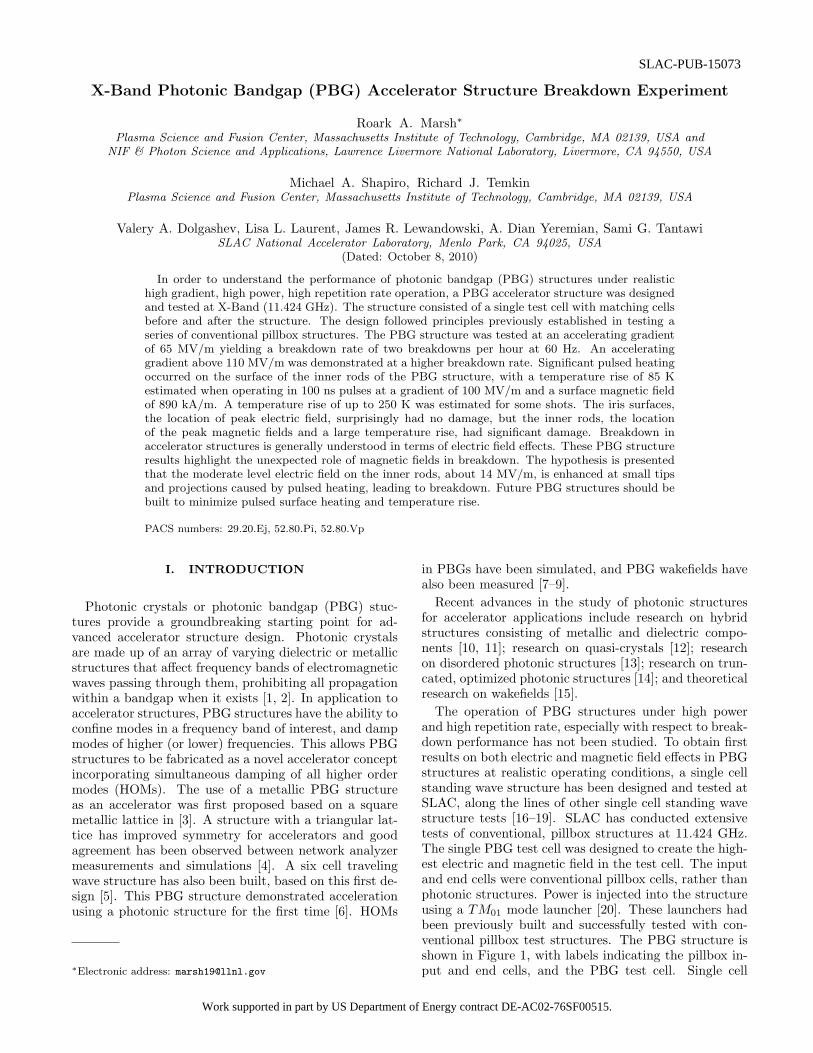
The operation of PBG structures under high powerand high repetition rate, especially with respect to break-down performance has not been studied. To obtain firstresults on both electric and magnetic field effects in PBGstructures at realistic operating conditions, a single cellstanding wave structure has been designed and tested atSLAC, along the lines of other single cell standing wavestructure tests [16–19]. SLAC has conducted extensivetests of conventional, pillbox structures at 11.424 GHz.The single PBG test cell was designed to create the high-est electric and magnetic field in the test cell. The inputand end cells were conventional pillbox cells, rather thanphotonic structures. Power is injected into the structureusing a TM01 mode launcher [20]. These launchers hadbeen previously built and successfully tested with con-ventional pillbox test structures. The PBG structure isshown in Figure 1, with labels indicating the pillbox in-put and end cells, and the PBG test cell. Single cell
SLAC-PUB-15073
Work supported in part by US Department of Energy contract DE-AC02-76SF00515.
2
EndCell
InputCell
PBGTest Cell
PowerInput
EndCell
InputCell
PBGTest Cell
PowerInput
FIG. 1: Single cell standing wave PBG structure.
testing has advantages over testing extended structures,e.g. the smaller structures require less power for testing,and are much easier to fabricate and tune. To date, morethan thirty structures have been tested at SLAC, of vary-ing iris aperture and geometry, different materials, andwidely diverging geometries including choke mode struc-tures [21] and this first PBG structure test.
II. DESIGN OF THE PHOTONIC BANDGAP(PBG) STRUCTURE
The PBG test structure shown in Figure 1 was de-signed using HFSS [22]. The structure was made tobe as similar to standard pillbox structures as possiblein order to compare with conventional structures. Thespecific pillbox cavity that was used as a starting pointof the PBG design is designated as structure 1C-SW-A5.65-T4.6-Cu. It includes elliptical irises, which de-crease the peak surface electric field to accelerating gra-dient ratio [23, 24]. The iris geometry of the PBG struc-ture, which is designated 1C-SW-A5.65-T4.6-PBG-Cu,was made identical to that of 1C-SW-A5.65-T4.6-Cu, sothat the PBG cell impact on structure performance couldbe isolated.
A. PBG Accelerator Structure
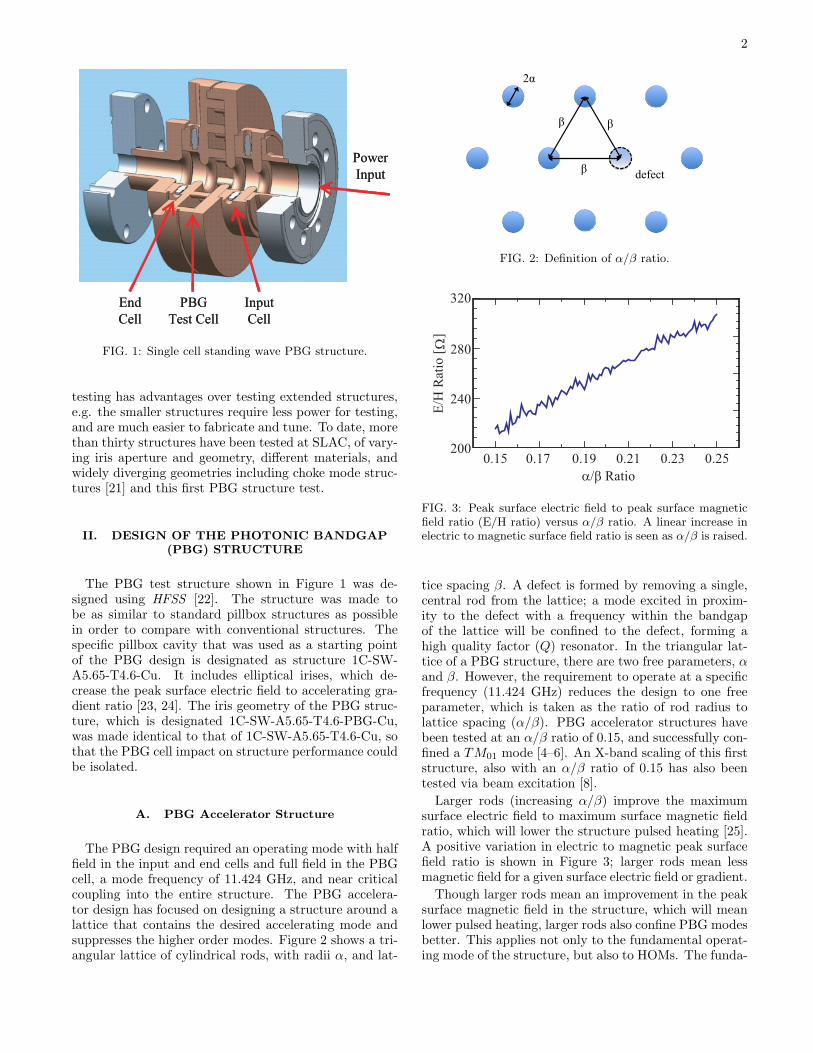
The PBG design required an operating mode with halffield in the input and end cells and full field in the PBGcell, a mode frequency of 11.424 GHz, and near criticalcoupling into the entire structure. The PBG accelera-tor design has focused on designing a structure around alattice that contains the desired accelerating mode andsuppresses the higher order modes. Figure 2 shows a tri-angular lattice of cylindrical rods, with radii α, and lat-
2α
β
defect
β
β
FIG. 2: Definition of α/β ratio.
0.15 0.17 0.19 0.21 0.23 0.25200
240
280
320
E/H
Rat
io [!
]
"/# Ratio
FIG. 3: Peak surface electric field to peak surface magneticfield ratio (E/H ratio) versus α/β ratio. A linear increase inelectric to magnetic surface field ratio is seen as α/β is raised.
tice spacing β. A defect is formed by removing a single,central rod from the lattice; a mode excited in proxim-ity to the defect with a frequency within the bandgapof the lattice will be confined to the defect, forming ahigh quality factor (Q) resonator. In the triangular lat-tice of a PBG structure, there are two free parameters, αand β. However, the requirement to operate at a specificfrequency (11.424 GHz) reduces the design to one freeparameter, which is taken as the ratio of rod radius tolattice spacing (α/β). PBG accelerator structures havebeen tested at an α/β ratio of 0.15, and successfully con-fined a TM01 mode [4–6]. An X-band scaling of this firststructure, also with an α/β ratio of 0.15 has also beentested via beam excitation [8].
Larger rods (increasing α/β) improve the maximumsurface electric field to maximum surface magnetic fieldratio, which will lower the structure pulsed heating [25].A positive variation in electric to magnetic peak surfacefield ratio is shown in Figure 3; larger rods mean lessmagnetic field for a given surface electric field or gradient.
Though larger rods mean an improvement in the peaksurface magnetic field in the structure, which will meanlower pulsed heating, larger rods also confine PBG modesbetter. This applies not only to the fundamental operat-ing mode of the structure, but also to HOMs. The funda-
3
0.15 0.17 0.19 0.21 0.23 0.250
3000
6000
9000
12000
0
1500
3000
4500
6000M
od
e Q
!/" Ratio
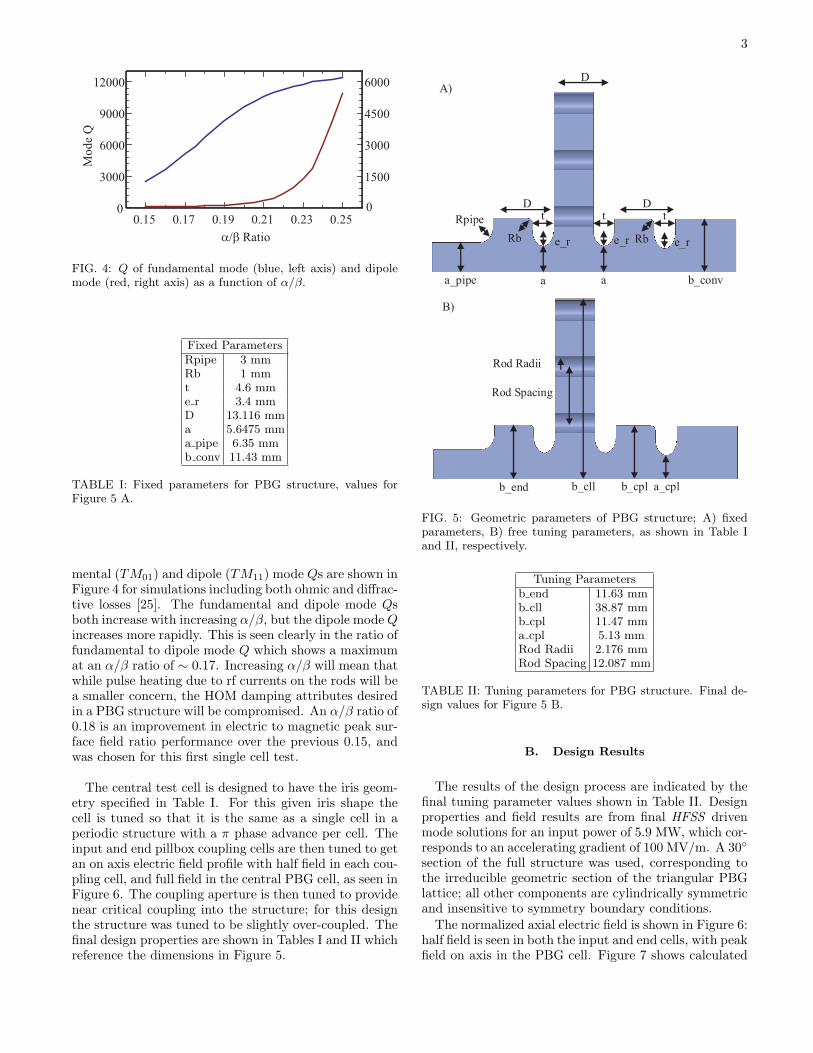
FIG. 4: Q of fundamental mode (blue, left axis) and dipolemode (red, right axis) as a function of α/β.
Fixed ParametersRpipe 3 mmRb 1 mmt 4.6 mme r 3.4 mmD 13.116 mma 5.6475 mma pipe 6.35 mmb conv 11.43 mm
TABLE I: Fixed parameters for PBG structure, values forFigure 5 A.
mental (TM01) and dipole (TM11) mode Qs are shown inFigure 4 for simulations including both ohmic and diffrac-tive losses [25]. The fundamental and dipole mode Qsboth increase with increasing α/β, but the dipole mode Qincreases more rapidly. This is seen clearly in the ratio offundamental to dipole mode Q which shows a maximumat an α/β ratio of ∼ 0.17. Increasing α/β will mean thatwhile pulse heating due to rf currents on the rods will bea smaller concern, the HOM damping attributes desiredin a PBG structure will be compromised. An α/β ratio of0.18 is an improvement in electric to magnetic peak sur-face field ratio performance over the previous 0.15, andwas chosen for this first single cell test.
The central test cell is designed to have the iris geom-etry specified in Table I. For this given iris shape thecell is tuned so that it is the same as a single cell in aperiodic structure with a π phase advance per cell. Theinput and end pillbox coupling cells are then tuned to getan on axis electric field profile with half field in each cou-pling cell, and full field in the central PBG cell, as seen inFigure 6. The coupling aperture is then tuned to providenear critical coupling into the structure; for this designthe structure was tuned to be slightly over-coupled. Thefinal design properties are shown in Tables I and II whichreference the dimensions in Figure 5.
a_cpl
Rod Spacing
Rod Radii
b_cplb_cllb_end
B)
aaa_pipe b_conv
D
e_r
D
D
Rpipe
A)
Rb Rb e_re_r
tt t
FIG. 5: Geometric parameters of PBG structure; A) fixedparameters, B) free tuning parameters, as shown in Table Iand II, respectively.
Tuning Parametersb end 11.63 mmb cll 38.87 mmb cpl 11.47 mma cpl 5.13 mmRod Radii 2.176 mmRod Spacing 12.087 mm
TABLE II: Tuning parameters for PBG structure. Final de-sign values for Figure 5 B.
B. Design Results
The results of the design process are indicated by thefinal tuning parameter values shown in Table II. Designproperties and field results are from final HFSS drivenmode solutions for an input power of 5.9 MW, which cor-responds to an accelerating gradient of 100 MV/m. A 30section of the full structure was used, corresponding tothe irreducible geometric section of the triangular PBGlattice; all other components are cylindrically symmetricand insensitive to symmetry boundary conditions.
The normalized axial electric field is shown in Figure 6:half field is seen in both the input and end cells, with peakfield on axis in the PBG cell. Figure 7 shows calculated

4
0 1 2 3 4 5 60
50
100
150
200
250| E|
[MV
/m]
Axial Distance [cm]
FIG. 6: Electric field relative magnitude on axis of PBG struc-ture. Power is coupled in from the left; half field is seen ineach coupling cell, relative to the central PBG cell.
11.420 11.425 11.430-25
-20
-15
-10
-5
0
S
[
mag
nit
ud
e dB
]
Frequency [GHz]
11
FIG. 7: Reflection as a function of frequency for PBG struc-ture, as calculated.
reflection (S11) as a function of frequency, showing a goodmatch of -24 dB at 11.4236 GHz. Structure is slightlyovercoupled, as preferred.
Field plots are shown in Figure 8 for the electric andmagnetic fields as viewed along a radial cut of the struc-ture through the nearest rod, for 5.9 MW input power.The electric field is strongest in the central cell, withpeaks on axis and on the structure irises. The magneticfield is strongly peaked on the inner edge of the first rowof rods. Top views of the electric and magnetic fields areshown in Figure 9, for 5.9 MW input power. The peakfields at the structure wall are listed in Table III.
C. HFSS Analysis Simulations
1. PBG Simulations
In the experiment, breakdown rates are measured as afunction of input power levels to the structure. Break-down rates are of interest not with regard to power levels,but with respect to the field properties (maximum sur-face electric and magnetic fields) of the accelerator struc-
FIG. 8: Electric and magnetic field for PBG structure. Sideviews.
FIG. 9: Electric and magnetic field for PBG structure. Topviews.
tures. To convert from power level to field properties,HFSS simulations are used with an increased focus onfield convergence. Driven mode solutions in HFSS allowpower levels to be calibrated with surface fields; a singlecalibration point suffices as the field scales as the squareroot of the power. The simulation for this calibration isrun with as detailed a mesh as possible.
The accelerating gradient is calculated using the HFSSfield calculator. Field convergence is a serious concernfor such a critical field parameter, and this was insuredby steadily finer mesh operations. The suitability of thismesh was confirmed by calculating the gradient on a large

5
Structure PBG PillboxPower 5.9 MW 4.6 MWGradient 100 MV/m 100 MV/mSurface Electric Field Maximum 208 MV/m 211 MV/mSurface Magnetic Field Maximum 890 kA/m 418 kA/mRod Surface Electric Field 14 MV/m —
TABLE III: HFSS simulation field calibration numbers forPBG structure.
number of slightly off axis lines. The gradient calcula-tions were nearly constant, with small fluctuations as aresult of field sampling.
The peak surface fields, both electric and magnetic,are also of interest for breakdown statistics. These arecalculated using the eigenmode HFSS simulations anddetermining the maximum field value on the surface.
Cross-calibration of driven and eigenmode HFSS sim-ulations combine all of these field and power numbers sothat the power coupled into the structure can be scaledinto accelerating gradient, peak surface electric field, orpeak surface magnetic field. A summary of the calibra-tion parameters is given in Table III.
The electric field on the inner rod is of interest becausethat is the location where effects from both magnetic andelectric fields interact. The peak electric field amplitudeis much lower than on the structure iris. This can be com-pared by the values in Table III: for 100 MV/m gradient,the peak surface electric field on the iris is 208 MV/m,and on the rod it is 14 MV/m.
2. Pillbox Simulations
This simulation process was repeated for the SLAC1C-SW-A5.65-T4.6-Cu baseline pillbox structure. Thesesimulations were more straightforward than the PBGsimulations because of the cylindrical symmetry of thepillbox structure; very fine meshes were possible with lessreliance on meshing operations and sensitivity to fieldconvergence. The calibration results are shown in Ta-ble III.
3. Temperature Rise Calculation
Comparison of the fields in the PBG and pillbox struc-tures indicates design dictated similarities, along withsome important differences. Comparing the maximumfield values in Table III shows that the PBG structure hasa higher peak surface magnetic field, so that for the sameinput power, a lower accelerating gradient is achieved.The increased power required for the PBG structure toreach the same accelerating gradient as the pillbox struc-ture will not be a problem in breakdown testing becausethe power requirement is relatively low, and additionalpower is easily accommodated. Increased peak surface
ρ Density 8.95× 10³kg/m3
cε Specific heat at constant strain 385J/kgKαd Linear thermal expansion coefficient 1.65× 10⁻⁵K−1
RS Surface resistance 0.0279 Ω (at 11.424 GHz)
TABLE IV: Material properties of oxygen free high conduc-tivity copper for insertion into Equation 1.
magnetic field, however, will result in higher pulsed heat-ing on the structure.
The effect of magnetic field on predicted pulsed heatinginduced temperature rise can be described mathemati-cally. For realistic pulse shapes, the exact pulsed heatingtemperature rise can be calculated using the general in-tegral formulation shown in Equation 1 [26].
∆T =1
ρcε√παd
∫ t
0
1√t− t′
12RS |H (t′)|2 dt′ (1)
Equation 1 relates the temperature rise, ∆T , to the timeintegral of the surface magnetic field as a function oftime, H (t′), with the values for ρ, cε, αd, and RS givenin Table IV [26]. Equation 1 simplifies to Equation 2 fora square pulse of magnitude Hpeak and duration tP [27].
∆T = 430√tP [µs] |Hpeak [MA/m] |2K (2)
In the PBG structure, for 100 MV/m gradient and a100 ns square pulse a temperature rise of 85 K is esti-mated.
D. Fabrication
The PBG cell was machined from a single block ofoxygen free high conductivity copper including one of thecell iris plates. The other iris was included in the facingcell piece, into which the PBG lattice rods were brazed.The machined parts, prior to copper brazing and flangewelding are shown in Figure 10.
III. COLD TEST
The single cell standing wave PBG structure, identi-fied by SLAC code as 1C-SW-A5.65-T4.6-PBG-Cu, wasmatched with a TM01 mode launcher, T52219-1, for allcold testing, and the same launcher remained connectedfor high power testing, and final cold testing. A vectornetwork analyzer (VNA) was used for to measure thecomplex reflection. A dry nitrogen flow was providedthrough a straight length of WR-90 waveguide to pre-serve structure cleanliness, and limit measurement fluc-tuations due to humidity. Temperature of the PBG struc-ture was monitored by a sensor lead attached to its body.
The PBG structure is a one port device and so non-resonant perturbation technique was adopted in whichthe reflection from the structure was measured in order
6
FIG. 10: PBG structure copper parts prior to brazing. A152.4 mm ruler is located next to the structure to indicatethe scale.
to calculate the electric field profile [28, 29]. This methodinvolves the suspension of a small dielectric perturbation,or “bead”, on a thin dielectric wire. A mounting allowsthe smooth draw of the bead through the structure closeto on axis. The mounting was attached with three bolts,threaded through springs, so that they can be adjustedto center the bead. The wire used was Ashaway 10/0black monofilament 2 lb Trilene; the bead was made of asmall drop of superglue.
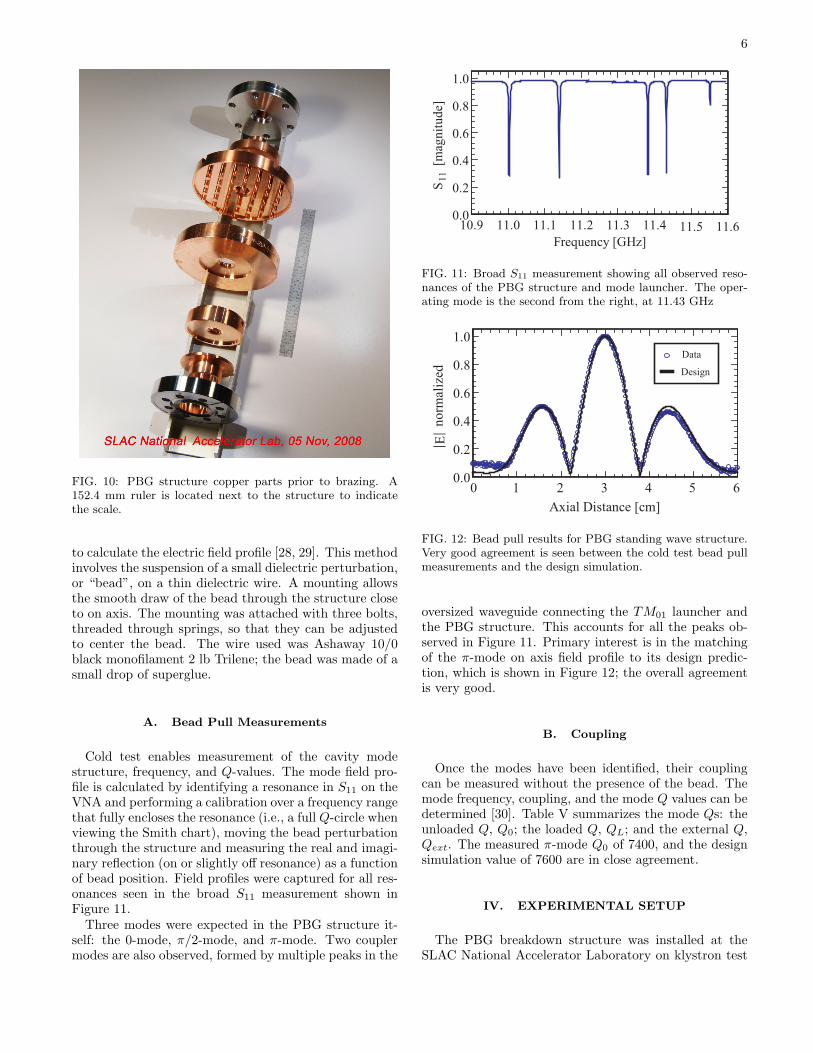
A. Bead Pull Measurements
Cold test enables measurement of the cavity modestructure, frequency, and Q-values. The mode field pro-file is calculated by identifying a resonance in S11 on theVNA and performing a calibration over a frequency rangethat fully encloses the resonance (i.e., a full Q-circle whenviewing the Smith chart), moving the bead perturbationthrough the structure and measuring the real and imagi-nary reflection (on or slightly off resonance) as a functionof bead position. Field profiles were captured for all res-onances seen in the broad S11 measurement shown inFigure 11.
Three modes were expected in the PBG structure it-self: the 0-mode, π/2-mode, and π-mode. Two couplermodes are also observed, formed by multiple peaks in the
10.9 11.0 11.1 11.2 11.3 11.4 11.5 11.60.0
0.2
0.4
0.6
0.8
1.0
S
[
mag
nit
ud
e]
Frequency [GHz]
11
FIG. 11: Broad S11 measurement showing all observed reso-nances of the PBG structure and mode launcher. The oper-ating mode is the second from the right, at 11.43 GHz
0 1 2 3 4 5 60.0
0.2
0.4
0.6
0.8
1.0
| E|
no
rmal
ized
Axial Distance [cm]
Design
Data
FIG. 12: Bead pull results for PBG standing wave structure.Very good agreement is seen between the cold test bead pullmeasurements and the design simulation.
oversized waveguide connecting the TM01 launcher andthe PBG structure. This accounts for all the peaks ob-served in Figure 11. Primary interest is in the matchingof the π-mode on axis field profile to its design predic-tion, which is shown in Figure 12; the overall agreementis very good.
B. Coupling
Once the modes have been identified, their couplingcan be measured without the presence of the bead. Themode frequency, coupling, and the mode Q values can bedetermined [30]. Table V summarizes the mode Qs: theunloaded Q, Q0; the loaded Q, QL; and the external Q,Qext. The measured π-mode Q0 of 7400, and the designsimulation value of 7600 are in close agreement.
IV. EXPERIMENTAL SETUP
The PBG breakdown structure was installed at theSLAC National Accelerator Laboratory on klystron test
7
Mode Frequency Q[GHz] Q0 QL Qext
0 11.0036 8347 3390 5708π/2 11.1397 9044 3796 6541
Coupler 11.3819 8299 4304 8941π 11.4323 7401 4695 12844
Coupler 11.5517 12746 11224 9395
TABLE V: Table of measured Q values for PBG structuremodes.
5
10
15
20
25
30
Pow
er [
MW
]
2 10 10-7x4 6 8Time [seconds]
Reverse Power
Klystron PowerForward Power
0
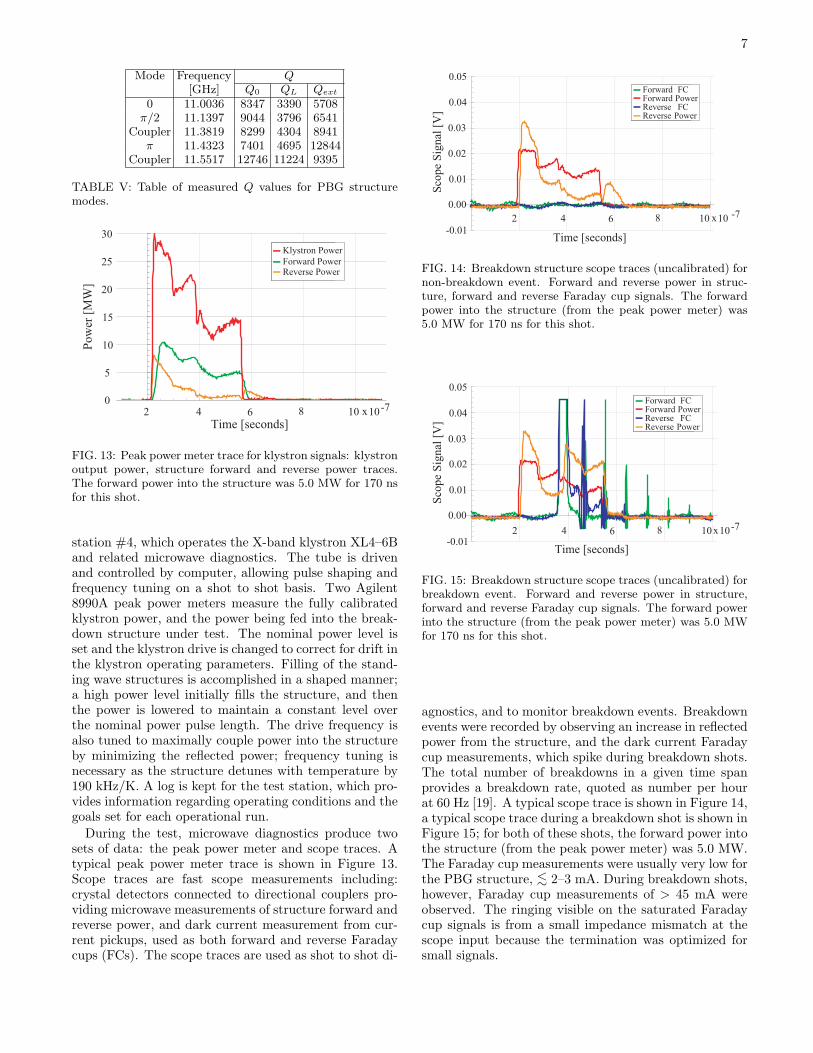
FIG. 13: Peak power meter trace for klystron signals: klystronoutput power, structure forward and reverse power traces.The forward power into the structure was 5.0 MW for 170 nsfor this shot.
station #4, which operates the X-band klystron XL4–6Band related microwave diagnostics. The tube is drivenand controlled by computer, allowing pulse shaping andfrequency tuning on a shot to shot basis. Two Agilent8990A peak power meters measure the fully calibratedklystron power, and the power being fed into the break-down structure under test. The nominal power level isset and the klystron drive is changed to correct for drift inthe klystron operating parameters. Filling of the stand-ing wave structures is accomplished in a shaped manner;a high power level initially fills the structure, and thenthe power is lowered to maintain a constant level overthe nominal power pulse length. The drive frequency isalso tuned to maximally couple power into the structureby minimizing the reflected power; frequency tuning isnecessary as the structure detunes with temperature by190 kHz/K. A log is kept for the test station, which pro-vides information regarding operating conditions and thegoals set for each operational run.
During the test, microwave diagnostics produce twosets of data: the peak power meter and scope traces. Atypical peak power meter trace is shown in Figure 13.Scope traces are fast scope measurements including:crystal detectors connected to directional couplers pro-viding microwave measurements of structure forward andreverse power, and dark current measurement from cur-rent pickups, used as both forward and reverse Faradaycups (FCs). The scope traces are used as shot to shot di-
2 10 10 -7
-0.01
0.01
0.02
0.03
0.04
0.05
x4 6 8
Time [seconds]
Sco
pe
Sig
nal
[V
]
0.00
Reverse PowerReverse FCForward PowerForward FC
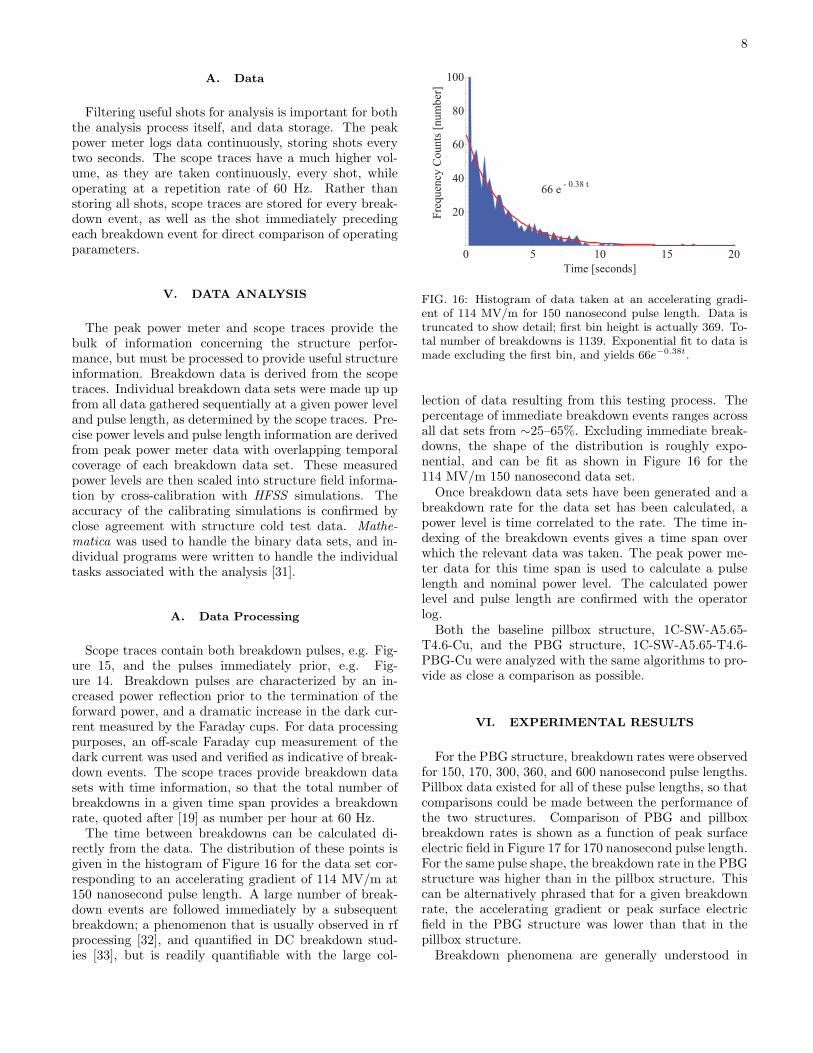
FIG. 14: Breakdown structure scope traces (uncalibrated) fornon-breakdown event. Forward and reverse power in struc-ture, forward and reverse Faraday cup signals. The forwardpower into the structure (from the peak power meter) was5.0 MW for 170 ns for this shot.
-0.01
0.01
0.02
0.03
0.04
0.05
Sco
pe
Sig
nal
[V
]
2 10 10-7x4 6 8
Time [seconds]
Reverse PowerReverse FCForward PowerForward FC
0.00
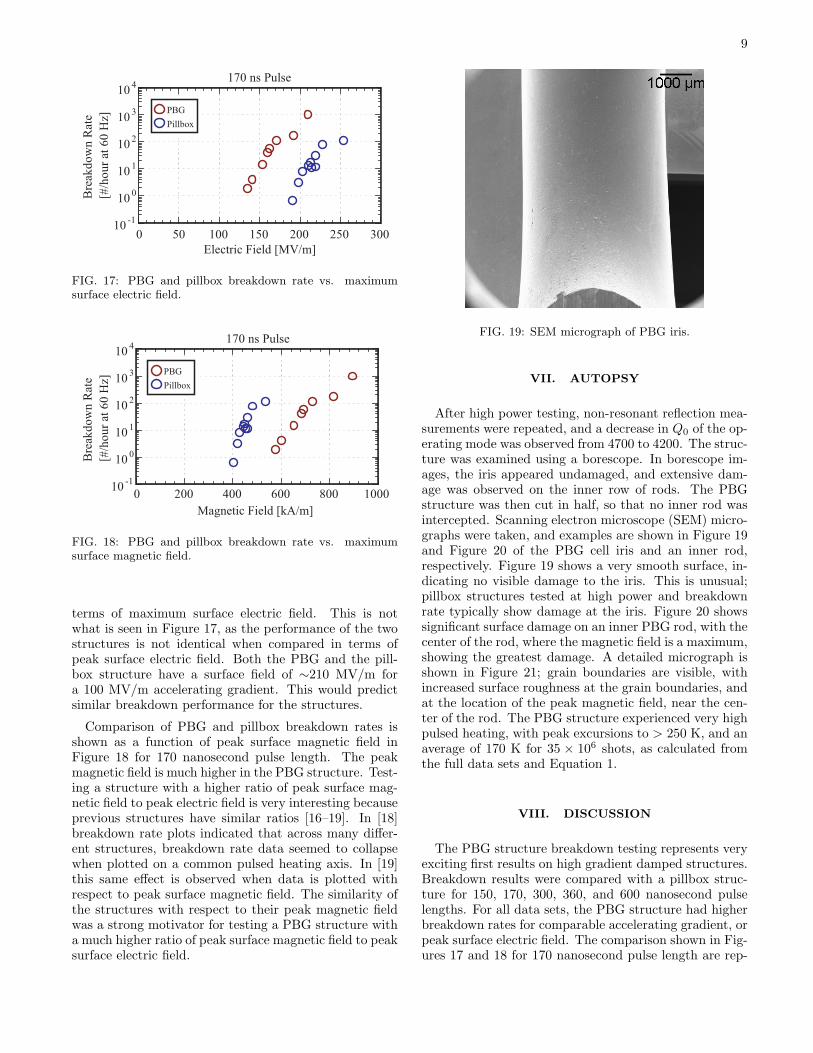
FIG. 15: Breakdown structure scope traces (uncalibrated) forbreakdown event. Forward and reverse power in structure,forward and reverse Faraday cup signals. The forward powerinto the structure (from the peak power meter) was 5.0 MWfor 170 ns for this shot.
agnostics, and to monitor breakdown events. Breakdownevents were recorded by observing an increase in reflectedpower from the structure, and the dark current Faradaycup measurements, which spike during breakdown shots.The total number of breakdowns in a given time spanprovides a breakdown rate, quoted as number per hourat 60 Hz [19]. A typical scope trace is shown in Figure 14,a typical scope trace during a breakdown shot is shown inFigure 15; for both of these shots, the forward power intothe structure (from the peak power meter) was 5.0 MW.The Faraday cup measurements were usually very low forthe PBG structure, <∼ 2–3 mA. During breakdown shots,however, Faraday cup measurements of > 45 mA wereobserved. The ringing visible on the saturated Faradaycup signals is from a small impedance mismatch at thescope input because the termination was optimized forsmall signals.
8
A. Data
Filtering useful shots for analysis is important for boththe analysis process itself, and data storage. The peakpower meter logs data continuously, storing shots everytwo seconds. The scope traces have a much higher vol-ume, as they are taken continuously, every shot, whileoperating at a repetition rate of 60 Hz. Rather thanstoring all shots, scope traces are stored for every break-down event, as well as the shot immediately precedingeach breakdown event for direct comparison of operatingparameters.
V. DATA ANALYSIS
The peak power meter and scope traces provide thebulk of information concerning the structure perfor-mance, but must be processed to provide useful structureinformation. Breakdown data is derived from the scopetraces. Individual breakdown data sets were made up upfrom all data gathered sequentially at a given power leveland pulse length, as determined by the scope traces. Pre-cise power levels and pulse length information are derivedfrom peak power meter data with overlapping temporalcoverage of each breakdown data set. These measuredpower levels are then scaled into structure field informa-tion by cross-calibration with HFSS simulations. Theaccuracy of the calibrating simulations is confirmed byclose agreement with structure cold test data. Mathe-matica was used to handle the binary data sets, and in-dividual programs were written to handle the individualtasks associated with the analysis [31].
A. Data Processing
Scope traces contain both breakdown pulses, e.g. Fig-ure 15, and the pulses immediately prior, e.g. Fig-ure 14. Breakdown pulses are characterized by an in-creased power reflection prior to the termination of theforward power, and a dramatic increase in the dark cur-rent measured by the Faraday cups. For data processingpurposes, an off-scale Faraday cup measurement of thedark current was used and verified as indicative of break-down events. The scope traces provide breakdown datasets with time information, so that the total number ofbreakdowns in a given time span provides a breakdownrate, quoted after [19] as number per hour at 60 Hz.
The time between breakdowns can be calculated di-rectly from the data. The distribution of these points isgiven in the histogram of Figure 16 for the data set cor-responding to an accelerating gradient of 114 MV/m at150 nanosecond pulse length. A large number of break-down events are followed immediately by a subsequentbreakdown; a phenomenon that is usually observed in rfprocessing [32], and quantified in DC breakdown stud-ies [33], but is readily quantifiable with the large col-
0 5 10 15 20
20
40
60
80
100
- 0.38 t66 e
Time [seconds]
Fre
qu
ency
Co
un
ts [
nu
mb
er]
FIG. 16: Histogram of data taken at an accelerating gradi-ent of 114 MV/m for 150 nanosecond pulse length. Data istruncated to show detail; first bin height is actually 369. To-tal number of breakdowns is 1139. Exponential fit to data ismade excluding the first bin, and yields 66e−0.38t.
lection of data resulting from this testing process. Thepercentage of immediate breakdown events ranges acrossall dat sets from ∼25–65%. Excluding immediate break-downs, the shape of the distribution is roughly expo-nential, and can be fit as shown in Figure 16 for the114 MV/m 150 nanosecond data set.
Once breakdown data sets have been generated and abreakdown rate for the data set has been calculated, apower level is time correlated to the rate. The time in-dexing of the breakdown events gives a time span overwhich the relevant data was taken. The peak power me-ter data for this time span is used to calculate a pulselength and nominal power level. The calculated powerlevel and pulse length are confirmed with the operatorlog.
Both the baseline pillbox structure, 1C-SW-A5.65-T4.6-Cu, and the PBG structure, 1C-SW-A5.65-T4.6-PBG-Cu were analyzed with the same algorithms to pro-vide as close a comparison as possible.
VI. EXPERIMENTAL RESULTS
For the PBG structure, breakdown rates were observedfor 150, 170, 300, 360, and 600 nanosecond pulse lengths.Pillbox data existed for all of these pulse lengths, so thatcomparisons could be made between the performance ofthe two structures. Comparison of PBG and pillboxbreakdown rates is shown as a function of peak surfaceelectric field in Figure 17 for 170 nanosecond pulse length.For the same pulse shape, the breakdown rate in the PBGstructure was higher than in the pillbox structure. Thiscan be alternatively phrased that for a given breakdownrate, the accelerating gradient or peak surface electricfield in the PBG structure was lower than that in thepillbox structure.
Breakdown phenomena are generally understood in
9
0 50 100 150 200 250 30010
-1
100
101
102
103
104
Bre
akd
ow
n R
ate
[#/h
ou
r at
60
Hz]
Electric Field [MV/m]
170 ns Pulse
PBG
Pillbox
FIG. 17: PBG and pillbox breakdown rate vs. maximumsurface electric field.
0 200 400 600 800 100010
-1
100
101
102
103
104
Bre
akd
ow
n R
ate
[#/h
ou
r at
60
Hz]
Magnetic Field [kA/m]
170 ns Pulse
PBG
Pillbox
FIG. 18: PBG and pillbox breakdown rate vs. maximumsurface magnetic field.
terms of maximum surface electric field. This is notwhat is seen in Figure 17, as the performance of the twostructures is not identical when compared in terms ofpeak surface electric field. Both the PBG and the pill-box structure have a surface field of ∼210 MV/m fora 100 MV/m accelerating gradient. This would predictsimilar breakdown performance for the structures.
Comparison of PBG and pillbox breakdown rates isshown as a function of peak surface magnetic field inFigure 18 for 170 nanosecond pulse length. The peakmagnetic field is much higher in the PBG structure. Test-ing a structure with a higher ratio of peak surface mag-netic field to peak electric field is very interesting becauseprevious structures have similar ratios [16–19]. In [18]breakdown rate plots indicated that across many differ-ent structures, breakdown rate data seemed to collapsewhen plotted on a common pulsed heating axis. In [19]this same effect is observed when data is plotted withrespect to peak surface magnetic field. The similarity ofthe structures with respect to their peak magnetic fieldwas a strong motivator for testing a PBG structure witha much higher ratio of peak surface magnetic field to peaksurface electric field.
FIG. 19: SEM micrograph of PBG iris.
VII. AUTOPSY
After high power testing, non-resonant reflection mea-surements were repeated, and a decrease in Q0 of the op-erating mode was observed from 4700 to 4200. The struc-ture was examined using a borescope. In borescope im-ages, the iris appeared undamaged, and extensive dam-age was observed on the inner row of rods. The PBGstructure was then cut in half, so that no inner rod wasintercepted. Scanning electron microscope (SEM) micro-graphs were taken, and examples are shown in Figure 19and Figure 20 of the PBG cell iris and an inner rod,respectively. Figure 19 shows a very smooth surface, in-dicating no visible damage to the iris. This is unusual;pillbox structures tested at high power and breakdownrate typically show damage at the iris. Figure 20 showssignificant surface damage on an inner PBG rod, with thecenter of the rod, where the magnetic field is a maximum,showing the greatest damage. A detailed micrograph isshown in Figure 21; grain boundaries are visible, withincreased surface roughness at the grain boundaries, andat the location of the peak magnetic field, near the cen-ter of the rod. The PBG structure experienced very highpulsed heating, with peak excursions to > 250 K, and anaverage of 170 K for 35 × 106 shots, as calculated fromthe full data sets and Equation 1.
VIII. DISCUSSION
The PBG structure breakdown testing represents veryexciting first results on high gradient damped structures.Breakdown results were compared with a pillbox struc-ture for 150, 170, 300, 360, and 600 nanosecond pulselengths. For all data sets, the PBG structure had higherbreakdown rates for comparable accelerating gradient, orpeak surface electric field. The comparison shown in Fig-ures 17 and 18 for 170 nanosecond pulse length are rep-
10
FIG. 20: SEM micrograph of inner rod.
FIG. 21: SEM micrograph showing detail of inner rod pulsedheating damage.
resentative of the results at the other pulse lengths. ThePBG structure was tested under the same conditions asall other structures [16–19]. If the performance of thesingle cell breakdown structures depended only on theiris geometry, or the peak surface electric field, then theperformance of the PBG structure should have been iden-tical to that of a similar pillbox, which it was not. Thesignificant discrepancy between pillbox and PBG perfor-mance points very strongly to fundamental differences inthe breakdown process in the two structures.
The PBG structure had much higher peak surface mag-netic fields than a pillbox structure with similar iris ge-ometry for the same gradient. These high magnetic fieldsproduced large pulsed heating in the structure surface,
and damage as probed by SEM. As commonly believed,pulsed heating is a disparate phenomenon, and does notdrive breakdown processes. Pulsed heating is a physicallimit on accelerating structure lifetime, requiring themto be designed with modest pulsed heating temperaturerises of <150K [26, 34]. The performance of PBG struc-tures should be on par with what has been achievedin pillbox structures, specifically the structure to whichthe single cell PBG structure has been compared in Fig-ures 17 and 18. The disparity in breakdown performancepoints to new physics, or new overlap in the physical pro-cesses involved in structure breakdown and pulsed heat-ing, limits that are understood to be dominated by elec-tric and magnetic fields respectively.
One hypothesis for the PBG performance involvespulsed heating damage creating breakdown sites. Pulsedheating damage on the inner rods is observed over thepeak magnetic field region, which is the high field facingsurface of the inner row of rods; for 100 MV/m gradient,a peak magnetic field of 890 kA/m is present over thisregion. This high magnetic field results in pulsed heat-ing temperature rises, in accordance with Equation 1.The heating of the surface will cause cracking and anincrease in the rod surface roughness. The increased sur-face roughness seen on the surface in Figure 20 and Fig-ure 21 lead to a local concentration of the electric fieldon the roughened surface. The enhanced electric fieldmay allow the surface electric field at the rods, whichis only 14 MV/m at 100 MV/m accelerating gradient,to initiate breakdown at the rod. The combined effectsof both high peak surface electric fields and high peaksurface magnetic fields are responsible for structure per-formance [27].
Future linear accelerators will use damped structuresto reach very high beam quality and luminosity. In theend it will be the performance of damped structures thatwill need to meet a breakdown rate specification, whichrequires further breakdown testing of damped structures.Improved PBG structures have been designed, with de-creased peak pulsed heating, and will be tested in aneffort to both confirm these results and improve the highgradient performance of PBG structures [25].
IX. ACKNOWLEDGEMENTS
Work supported by the Department of Energy HighEnergy Physics, under contract DE-FG02-91ER40648.The authors gratefully acknowledge useful discussionswith Brian Munroe, Evgenya Smirnova, and Jake Haim-son. R. A. Marsh would especially like to thank theMEGa-Ray team at LLNL and Director George Millerfor providing support to complete this paper.
[1] E. Yablonovitch, Phys. Rev. Lett. 58, 2059–2062 (1987). [2] S. John, Phys. Rev. Lett. 58, 2486–2489 (1987).
11
[3] D. R. Smith, S. Schultz, N. Kroll, M. Sigalas, K. M. Ho,and C. M. Soukoulis, Appl. Phys. Lett. 65, 645–647(1994).
[4] M. A. Shapiro, W. J. Brown, I. Mastovsky, J. R. Sirigiri,and R. J. Temkin, Phys. Rev. ST Accel. Beams 4, 042001(2001).
[5] E. I. Smirnova, I. Mastovsky, M. A. Shapiro,R. J. Temkin, L. M. Earley, and R. L. Edwards, Phys.Rev. ST Accel. Beams, 8, 091302 (2005).
[6] E. I. Smirnova, A. S. Kesar, I. Mastovsky, M. A. Shapiro,and R. J. Temkin, Phys. Rev. Lett. 95, 074801 (2005).
[7] R. A. Marsh, M. A. Shapiro, R. J. Temkin, andE. I. Smirnova, “Observation of Wakefields in a 17 GHzMetallic Photonic Bandgap (PBG) Structure”, Proceed-ings of the 2007 Particle Accelerator Conference, Albu-querque, New Mexico, USA, pages 2430–2432 (2007).
[8] C. Jing, F. Gao, S. Antipov, Z. Yusof, M. Conde,J. G. Power, P. Xu, S. Zheng, H. Chen, C. Tang, andW. Gai, Phys. Rev. ST Accel. Beams, 12, 121302 (2009).
[9] R. A. Marsh, M. A. Shapiro, R. J. Temkin,E. I. Smirnova, and J. F. DeFord, Nucl. Instrum. Meth-ods Phys. Res., Sect. A 618, 16–21 (2010).
[10] M. R. Masullo, A. Andreone, E. Di Gennaro et al., Mi-crowave and Opt. Tech. Lett., Vol. 48, No. 12, 2486–2491(2006).
[11] E. Di Gennaro, C. Zannini, S. Savo, et al., New Journalof Physics, Vol. 11, Article No. 113022 (2009).
[12] E. Di Gennaro, S. Savo, A. Andreone, et al., Appl. Phys.Lett., Vol. 93, No. 16, Article Number: 164102 (2008).
[13] C. J. Matthews, R. Seviour, Appl. Phys. B Lasers andOptics, Vol. 94, No. 3, 381–388 (2009).
[14] C. A. Bauer, G. R. Werner, J. R. Cary, J. Appl. Phys.Vol. 104 No. 5 Article Number: 053107 (2008)
[15] G. R. Werner, C. A. Bauer, J. R. Cary, Phys. Rev. STAccel. Beams, 12, 071301 (2009).
[16] V. A. Dolgashev, S. G. Tantawi, C. D. Nantista, Y. Hi-gashi, and T. Higo, “Traveling wave and standing wavesingle cell high gradient tests”, Proceedings of the 2004Linear Accelerator Conference, Lubeck, Germany, pages766–768 (2004).
[17] V. A. Dolgashev, S. G. Tantawi, C. D. Nantista, Y. Hi-gashi, and T. Higo, “RF breakdown in normal conduct-ing single-cell structures”, Proceedings of the 2005 Parti-cle Accelerator Conference, Knoxville, Tennessee, USA,pages 595–599 (2005).
[18] V. A. Dolgashev, S. G. Tantawi, C. D. Nantista, Y. Hi-gashi, and T. Higo, “High power tests of normal conduct-ing single-cell structures”, Proceedings of the 2007 Par-ticle Accelerator Conference, Albuquerque, New Mexico,USA, pages 2430–2432 (2007).
[19] V. A. Dolgashev, S. G. Tantawi, Y. Higashi, and T. Higo,“Status of high power tests of normal conducting single-cell structures”, Proceedings of The 2008 European Par-ticle Accelerator Conference, Genoa, Italy, pages 742–744(2008).
[20] C. Nantista, S. Tantawi, and V. Dolgashev, Phys. Rev.ST Accel. Beams 7, 072001 (2004).
[21] T. Shintake, Jpn. J. Appl. Phys., 31, Part2(11A):L1567–L1570 (1992).
[22] High Frequency Structure Simulator, Ansoft Corpora-tion, www.hfss.com
[23] B. Spataro, INFN, Frascati, private communication.[24] O. Nezhevenko, D. Myakishev, V. Tarnetsky, and
V. Yakovlev, “TW Accelerating Structures with Mini-mal Surface Electric Field” Proceedings of the 1995 Par-ticle Accelerator Conference, Dallas, Texas, USA, pages1076–1078 (1995).
[25] R. A. Marsh, B. J. Munroe, M. A. Shapiro, andR. J. Temkin, “Design of advanced photonic bandgap(PBG) structures for high gradient accelerator applica-tions”, Proceedings of the 2009 Particle Accelerator Con-ference, Vancouver, BC, Canada, WE6RFP081 (2009).
[26] D. P. Pritzkau and R. H. Siemann, Phys. Rev. ST Accel.Beams 5, 112002 (2002).
[27] V.A. Dolgashev, “High magnetic fields in couplers of X-band accelerating structures”, Proceedings of the 2003Particle Accelerator Conference, Portland, Oregon, USA,pages 1267–1269 (2003).
[28] L. C. Maier Jr. and J. C. Slater, J. Appl. Phys., 23(1):68–77 (1952).
[29] C. W. Steele, IEEE Trans. Microwave Theory Tech.,14(2):70–74 (1966).
[30] David M. Pozar, Microwave Engineering, John Wiley &Sons, Inc., New York, 3rd edition (2005).
[31] Mathematica 7, Wolfram Research, www.wolfram.com[32] C. Adolphsen, W. Baumgartner, K. Jobe, F. Le Pim-
pec, R. Loewen, D. McCormick, M. Ross, T. Smith,J. W. Wang, and T. Higo, “Processing studies of X-band accelerator structures at the NLCTA”, Proceedingsof The 2001 Particle Accelerator Conference, Chicago,Illinois, USA, pages 478–480 (2001).
[33] A. Descoeudres, Y. Levinsen, S. Calatroni, M. Taborelli,and W. Wuensch, Phys. Rev. ST Accel. Beams 12,092001 (2009).
[34] O. A. Nezhevenko, “On the limitations of acceleratinggradient in linear colliders due to the pulsed heating”,Proceedings of the 1997 Particle Accelerator Conference,Vancouver, BC, Canada, pages 3013–3014 (1997).