x-ray photoelectron spectroscopy of fast-frozen hematite ...645225/fulltext01.pdf · x-ray...
TRANSCRIPT
X-Ray Photoelectron Spectroscopy of Fast-Frozen Hematite Colloids
Interaction of Ammonium Ions with the Surface of Hematite
Océane Louppe
Degree Project in Chemistry 15 ECTS Bachelor´s level Report passed: June 2013
Supervisor: Andrey Shchukarev

2 | P a g e

3 | P a g e
Abstract
Fast-frozen wet hematite pastes equilibrated in aqueous solution of 100mM NH4Cl have been investigated with XPS. Two hematite preparations containing flat with basal <001> plane exposed or spherical micrometer-sized particles have been used. Hematite pastes gave different reactions through the pH range (4.02 - 9.7) with ammonium ions at the interface. The study of the survey spectra, particularly the high resolution spectra of N 1s photoelectron lines allowed to get the interface reactions and the pH value(s) where amine group, -NH2, is formed. Flat hematite survey spectrum showed that the lines for Cl 2p and N 1s have a higher intensity than in the case of spheroids hematite particles and possessed energy loss features. The excess of electrolyte ions at the surface of flat hematite particles has been related to an amount of water retained at the surface of fast-frozen wet pastes. The atomic ratio H2O/(N+Cl) close to 1 under pH 9 suggests the formation of a surface phase: a new interface compound called ammonium hydrohalite -NH4Cl x H2O. At high pH, the hydrohalite phase does not form and amine groups are formed at room temperature. Contrary to flat hematite particles, amine groups are formed through all pH range at room temperature thanks to the formation of ion pairs (Fe-OH + NH4
+ + Cl- ↔ Fe-NH3+--Cl-+
H2O) and ligand exchange (Fe-OH + Cl-↔Fe-Cl + OH-).

4 | P a g e

5 | P a g e
List of Abbreviations
EDL
XPS
eV
BE, EB
KE
Ф
hν
UHV
ESCA
pKa
Electrical Double Layer
X-Ray Photoelectron Spectroscopy
electron Volt
Binding energy
Kinetic Energy
Work function
energy of X-ray photon
Ultra High Vacuum
Electron Spectroscopy for Chemical Analysis
Protonation Constant

6 | P a g e
7 | P a g e
Table of Contents
I. INTRODUCTION ..................................................................................................................................... 9
II. MATERIALS AND METHODS .................................................................................................................. 9
1. Hematite ........................................................................................................................................... 9
2. XPS................................................................................................................................................... 10
3. Preparation of samples ................................................................................................................... 12
4. XPS Measurements ......................................................................................................................... 13
III. RESULTS AND DISCUSSION .............................................................................................................. 14
1. XPS of Hematite wet pastes ............................................................................................................ 14
a. Colloidal hematite spheroids ...................................................................................................... 14
b. Flat hematite ............................................................................................................................... 18
IV. CONCLUSIONS ................................................................................................................................. 23
V. REFERENCES ........................................................................................................................................ 23

8 | P a g e

9 | P a g e
I. INTRODUCTION
Properties of mineral/water interfaces are important to understand because they are common in nature and in many technological processes. The key is to study the interaction between electrolyte ions from aqueous solution and solid surface. The interaction of mineral surface and aqueous electrolyte solution results in formation of the Electrical Double Layer (EDL). Simplest EDL structure can be considered as a plate capacitor where one side is presented by charged solid surface and another side consists of different counter-ions compensating the surface charge. The composition and structure of EDL is significantly dependent on the adsorption of electrolyte ions. These interface reactions can influence or even determine surface charge development, catalytic reactivity, water exchange, ion exchange and coordination of ligands.
In a previous study [1], it was shown that ammonium ions adsorbed at the surface of colloidal hematite spheroids are partly converted to amine group.
The aim of this study is to determine the preferable conditions where NH4+ion is
converted into amine group, -NH2: solution pH and ionic strength. It is also interesting to know if this reaction takes place at the basal <001> plane of hematite. The flat hematite particles have a different surface structure than the spherical ones, so their reactivity towards the ammonium ions is expected to be different.Cryogenic X-Ray Photoelectron Spectroscopy (XPS) has been used to provide information about the composition of the hematite – aqueous NH4Cl solution interface and to follow chemical speciation of ammonium ion.
II. MATERIALS AND METHODS
1. Hematite
The hematite is the mineral form of iron oxide (α-Fe2O3). Two different hematite suspensions have been used:
- flat hematite particles (identification number: H090720A) with basal plane exposed (Figure 1.a)
- hematite spheroids (Figure 1.b)
SEM images (Fig. 1) showed particles from each suspension. As it can be seen, particles have homogeneous size distribution. The average size of flat particles is 0.5 µm wide and 0.3 µm thickwith basal plane <001> exposed. This plane contains neutrally charged µ-OH groups (doubly coordinated to Fe) only and is acid-base inactive.The spheroid particles have a diameter of 0.03 µm.Their surface is acid-base reactive with all kind of -OH groups present (singly, doubly or triply coordinated).

10 | P a g e
For each initial hematite suspension in distilled water, the mass concentration has been determined. Then, a dilution of each suspension has been done with doubly distilled deionized water in order to get 5g/L hematite concentration. Final concentration of hematite particles in suspensions used for further experiments was 4.38g/L for colloidal hematite spheroids suspension and 5.09g/L for the flat hematite particles.
The point of zero charge of colloidal hematite spheroids is at pH 9.5 ± 0.4.
Figure 1SEM images of a) flat hematite particles with basal <001> plane exposed and b) hematite spheroids (same magnification)
2. XPS
XPS is a surface characterization method. The first name of this technique was ESCA (Electron Spectroscopy for Chemical Analysis) because the kinetic energy of photoelectrons provides direct information about chemical valence state of the emitting atom. It has been developed by Kai Siegbahn at the University of Uppsala, and he received a Nobel Prize for this discover. XPS is one of the UHV (Ultra High Vacuum) techniques. The surface to be analyzed is placed in vacuum and irradiated by X-Ray photons. The sample is placed in vacuum for three main reasons:
-the emitted photoelectrons must be able to travel from the sample through the analyzer to the detector without contact with gas phase molecules
-some components (like X-Ray source) need this condition to be used
-the surface composition has to stay unchanged during the whole measurement time[2].
Under X-Rays irradiation, the interaction between X-Rays and atoms in the solid results in energy transfer from the photon to core-level electrons. Then, the photoelectrons emitted near the surface escape into the vacuum chamber (sample analysis chamber),are separated according to their kinetic energy, and counted. An

11 | P a g e
Auger electron can be emitted resulting from the filling of an atom core hole (Auger transition). XPS measures the kinetic energy of the photoelectrons (related to the emitting atoms in the sample) and finally allows us to calculate their binding energies. The base of XPS is the energy conservation law, which can be written as:
hν = EB+KE + Φ
hν is the energy of the X-Ray photon (in our experiments monochromated Al Kα at 1486.6 eV), EB is binding energy of the electron in atom, KE is the kinetic energy of the emitted electron and Φ corresponds to the work function (this value is calibrated). The work function can be determined as the minimum energy required to eject an electron from the highest occupied level in vacuum [2]. From chemical point of view, the binding energy of core electrons in atom is most important, and it can be calculated as:
EB = hν – KE – Φ
With XPS, the identification of all the elements (except H and He) can be done if they are present at an atomic concentration >0.1 %. XPS gives the elemental surface composition (error < ±10%), the molecular environment and chemical states of the elements at the surface[2]. This is a surface sensitive technique because it deals with photoelectrons which do not lose their kinetic energy travelling through the solid. These photoelectrons originate from surface layer (up to 10 nm) and the photoelectrons which lose their kinetic energy (on the way to be escaped) create spectral background. XPS spectrum is a plot of number of photoelectrons (counts per second, Y-axis) against their binding energy (eV, X-axis). The photoelectron lines and Auger electron transitions (for example O KLL) can be seen, like for example on typical survey spectrum shown in figure 2.

12 | P a g e
Figure 2 Typical survey spectra for hematite spheroids
3. Preparation of samples
Sample preparation is aimed to obtain hematite suspensions in 100 mM NH4Cl and pH values between 4 and 10. Ammonium chloride salt was first weighted and hematite suspensions were added after. Final NH4Cl concentration in hematite suspensions prepared is 104.42mM for hematite platelets and 102.21mM for colloidal hematite spheroids.
For each experiment, 4 ml (in a 15 ml polyethylene tube) of 100mM NH4Cl hematite suspension were purged with N2(g) overnight in a room at 25°C. This step enables to remove CO2 from the suspension. In addition, a protection film was disposed at the top of the tube to avoid carbon contamination.pH values were adjusted between 4.4-9.7 using NH4OH 100mM and HCl 100mM solutions to keep the same ionic strength. After pH adjustment, samples were equilibrated (45-60min). A first pH measure has been taken before each XPS experiment, and then samples were centrifuged 15 min at 5000 rpm. The supernatant was poured to check the final pH. Both pH values were close. Thus obtained wet hematite paste was used immediately for cryogenic XPS measurements.
0
20000
40000
60000
80000
100000
120000
140000
160000
180000
200000
-1001003005007009001100
Inte
nsi
ty (
cps)
Binding energy (eV)
O (KLL)
Fe (LMM)
Fe 2p 1/2
Fe 2p 3/2 O 1s
N 1s C 1s Cl 2s
Cl 2p
Fe 3sFe 3p
O 2s

13 | P a g e
Glass electrode used for pH control was calibrated before each measurement with pH buffers (pH 3, 7, 10). Acid-base equilibrium of the suspension considered to be reached when electromotive force of the electrode didn’t change more than 0.3 mV/min.
4. XPS Measurements
All XPS spectra were recorded with Kratos Axis Ultra electron spectrometer equipped with a delay line detector. A monochromated Al Kα source operated at 150 W, a hybrid lens with a magnetic lens, providing an analysis area of 0.3 mm x 0.7 mm, and a charge neutralizer were used for measurements. The binding energy (BE) scale was referenced to the O 1s line in hematite, set at 530.0 eV [1]. All the spectra have been processed with Kratos software.
Spectrometer sample introduction and analysis chambers were pre-cooled respectively to -170°C and -155°C with liquid nitrogen, N2(l). The centrifuged wet hematite paste has been placed on a sample holder made of copper and molybdenum and was transferred to the pre-cooled claw of the sample transfer rod in the introduction chamber. Then, the paste is visibly frozen within 10-14s. It was kept under dry N2(g) during 45s allowing to be cooled enough, and then pumping of the chamber is started again. When the vacuum reached 10-6-10-7Torr(approximately 20min), fast-frozen sample has been transferred into the analysis chamber.
The first measurements were done under liquid nitrogen cooling (cryogenic XPS) to study fast-frozen wet sample without altering the interface (which contains volatile species) during the measurements.In order to monitor the changes in interface chemical composition caused by water and other volatile species losses, the sample was left in analysis chamber without cooling allowing to be warmed to room temperature overnight. XPS measurements were repeated next day with the sample at the same analytical position. During the measurements, UHV in the analysis chamber was 10-
9Torr.
For each sample, the wide spectrum and the high resolution spectra for all photoelectron lines detected(N 1s, Fe 2p, C 1s, O 1s, Cl 2p) have been acquired.

14 | P a g e
III. RESULTS AND DISCUSSION
1. XPS of Hematite wet pastes
a. Colloidal hematite spheroids
The survey spectrum (Fig. 2) shows which elements are present at the surface of the spherical hematite particles: N 1s, Fe 2p, C 1s, O 1s and Cl 2p. All elements were expected to be at the surface except carbon, which results from surface contamination. Because the aim of our study is interactions of ammonium ions at the surface of hematite, the discussion will be focused on high resolution spectra of N 1s photoelectron lines. A typical N 1s spectrum is shown on figure 3.
Figure 3 N 1s XPS spectrum taken with fast-frozen paste of hematite spheroids at pH 7.6
Table 1 Atomic ratio NH4/NH3 for hematite spheroids
pH value 4,46 5,9 6,01 7,6 9,24 NH4
+/NH3 ∞ 8,96 12,42 3,68 0,88
In the case of fast-frozen pastes, high resolution N 1s spectrum is fitted with two components (Fig. 3). The resulting binding energies are 401.9eV(401.1 ± 0.3 eV) and 400.1eV (399.1 ± 0.4 eV), which respectively correspond to NH4
+ and NH3. Reference BE values taken from the handbook of X-Ray photoelectron spectroscopy [4] are shown in parentheses. Relative intensity of these lines depends on the suspension pH.Table 1

15 | P a g e
shows how the atomic ratioNH4+/ NH3 is influenced by the pH. pH dependence of the
atomic ratio NH4+/ NH3 clearly demonstrates co-existence of both protonated and
non-protonated species with clear dominance of ammonium ion at the particles surface in acidic (at pH 4.46 only NH4
+ is present) and neutral suspensions. At pH value 9.24, this ratio becomes lower than 1 indicating that NH3 specie prevails.
According to the chemical reaction NH4+� NH3 + H+, the protonation constant
(pKa) can be written as:
��� ���3 . � ��
NH4��
At equilibrium, atomic concentrations ratio of NH4+/NH3is equal to 1.Then, pH
value is obtained for the pKa from the atomic ratio NH4+/NH3.
NH4+/NH3 atomic ratios given in the table 1, indicate that the protonation
constant can be expected to be between pH 7.6 and pH 9.24, and the last pH value is closer to that constant (0.88) than the value at pH 7.6 (3.68). This is consistent to a previous study which proves that the protonation constant of ammonium at the interface is 8.4[1].
Figure 4 High resolution spectra of N 1s photoelectron line for hematite spheroids at pH 7.6 (room temperature)
NH3

16 | P a g e
Then, with water losses (XPS at room temperature), the ammonium ions lose their protonation. The component at 401.9 eV disappears, and new line is fitted in the N 1s high resolution spectrum (Fig. 4). This line corresponds to amine group, NH2 with binding energy equal to 398.6eV (398.9 eV [4]). pH dependence of the atomic ratio NH3/NH2 (table 2) indicates that the conversion of ammonium ion into amine is preferable at basic conditions.
Table 2 Atomic ratio NH3/NH2 for hematite spheroids
pH value 4,46 5,9 6,01 7,6 9,24 NH3/NH2 10,60 8,67 9,80 6,22 5,50 Table 3 Atomic ratio N/Fe for hematite spheroids (Frozen pastes)
pH value 4,46 5,9 6,01 7,6 9,24 N/Fe 0,06 0,07 0,08 0,08 0,04
In addition, the atomic concentration of each electrolyte ions obtained by XPS of fast-frozen wet pastes allows determining the surface charge of hematite particles.The electrolyte ions used there are NH4
+ and Cl-. If their atomic concentrations at the interface are equal (the atomic concentration ratio between these two ions is 1), the surface is neutral (no charge). However, if the atomic ratio is higher (less) than 1 it means that the surface have attracted more NH4
+(Cl-) ions at the surface and so the surface is negatively (positively) charged. Figure 5 is a plot of the atomic ratio NH4
+/Cl- (Y-axis) against the pH (X-axis). Value pH 9.24, where this ratio is equal to 1, corresponds to the point of zero charge of the spherical hematite particles. This pH is consistent to the value determined in a previous study: 9.5 ± 0.4.
Figure 5 NH4/Cl atomic ratio for spherical hematite particles at -170 ˚C
Analysis of surface charge and concentration of total nitrogen at the interface (ratio N/Fe) allow obtaining some additional information about the surface interactions.
0,00
0,20
0,40
0,60
0,80
1,00
1,20
3 5 7 9pH
Ato
mic
ra
tio
NH
4+/C
l-

17 | P a g e
At low pH values (up to 7.6; table 3) the surface is positively charged (Fig. 5), which involves the attraction of chloride ions. The surface charge development and the chemical reaction between NH4
+/NH3 are moreover related to each other. At the surface, there are more ammonium ions than NH3.The ammonium ions then consist of a layer above chloride ions to compensate the excess of negative charge.
Athigh pH (9.24), however, the atomic ratio NH4+/Cl- is equal to 1 indicating the
surface is neutrally charged. Theatomic ratio N/Fe dropscorrespondingly because of two main factors: the surface has no charge and the amount of cations (NH4
+) is equal to the half of total nitrogen concentration. So, there is less NH4
+in the aqueous phase and fewer cations can be attracted by the surface.
At room temperature, volatile species must be pumped out from the surface
under UHV conditions in analysis chamber (here the volatile species are HCl, NH3 and water). Nevertheless, at low pH (up to 7.6), the chloride ion is still present. Moreover, its concentration is much higher than nitrogen species (table 4). Cl- can stay at the surface as a result of two processes: precipitation of Cl- containing compound, and direct chemical interaction with hematite functional groups. The atomic ratios given in table 4provide a clue for two surface reactions possible: formation of ion pair (Fe-OH + NH4
+ + Cl- ↔ Fe-NH3
+--Cl-+ H2O) and ligand exchange reaction (Fe-OH + Cl-↔ Fe-Cl + OH-). Formation of the ion pair results in the atomic ratio N/Cl=1:1. The rest of Cl- ions seem to be included in the ligand exchange reaction. The atomic ratio Cl/Fe is equal to 0.06 and the atomic ratio N/Fe is equal to 0.01, which indicates that the second reaction prevails.
Table 4Atomic ratio N/Fe and Cl/Fe for hematite spheroids (room temperature)
pH value 4,46 5,9 6,01 7,6 9,24 N/Fe 0,01 0,01 0,01 0,02 0,02 Cl/Fe 0,06 0,07 0,06 0,06 0,03
Using XPS with fast-frozen samples, the protonation of ammonium ions at the surface of hematite can be followed. The conversion of ammonium ions into amine group is favored under high pH.

18 | P a g e
b. Flat hematite
The survey spectrum showed the same lines as in hematite spheroids spectrum (Fig. 6). The lines for Cl 2p and N 1s have nevertheless a higher intensity than in the case of spheroids hematite particles (Fig. 2). As previously, N 1s high resolution lines will be discussed to see if the same reaction takes place at the surface of flat hematite.
Figure 6 Survey spectra of flat hematite at pH 4 (frozen paste)
At low temperature (Fig. 7a), there are two peaks with binding energies 401.6eV and 399.9eV. These two binding energies respectively correspond to NH4
+ and NH3.
0
20000
40000
60000
80000
100000
120000
140000
-1001003005007009001100
Inte
nsi
ty (
cps)
Binding Energy (eV)
O (KLL)
Fe (LMM)
Fe 2p 1/2
Fe 2p 3/2
O 1s
N 1s
C 1s
Cl 2sCl 2p
Fe 3s
Fe 3p
O 2s

19 | P a g e
Figure 7 N 1s XPS spectra of hematite spheroids at pH 4,02 a) taken with fast frozen paste and b) taken with room temperature sample
The atomic ratio of NH4+/NH3 decreases with the pH increasing but is always
over 1. As it can be seen on the table 5, the protonation reaction between NH4+ and
NH3cannot be totally followed. In addition to the protonation reaction, another process
seems to proceed causing the excess of ammonium ions at the interface.
Table 5 Atomic ratio NH4/NH3 for flat hematite (frozen pastes)
pH value 4,02 5,99 7,49 9,08 9,6 9,7 NH4
+/NH3 12,02 16,04 6,88 3,40 1,33 1,61
Table 6 Atomic ratio NH4/NH3 for flat hematite at room temperature
pH value 4,02 5,99 7,49 9,08 9,6 9,7 NH4
+/NH3 4,20 7,51 3,03 2,32 5,73(NH3/NH2) 5 (NH3/NH2)
At room temperature, contrary to the case of spheroidal hematite particles, there is still the coexistence of NH4
+ and NH3, except high pH (table 6). It can be seen on the figure 7b, where only two main lines corresponding to NH4
+ and NH3are observed in high resolution N 1s spectrum.
a)
b)
20 | P a g e
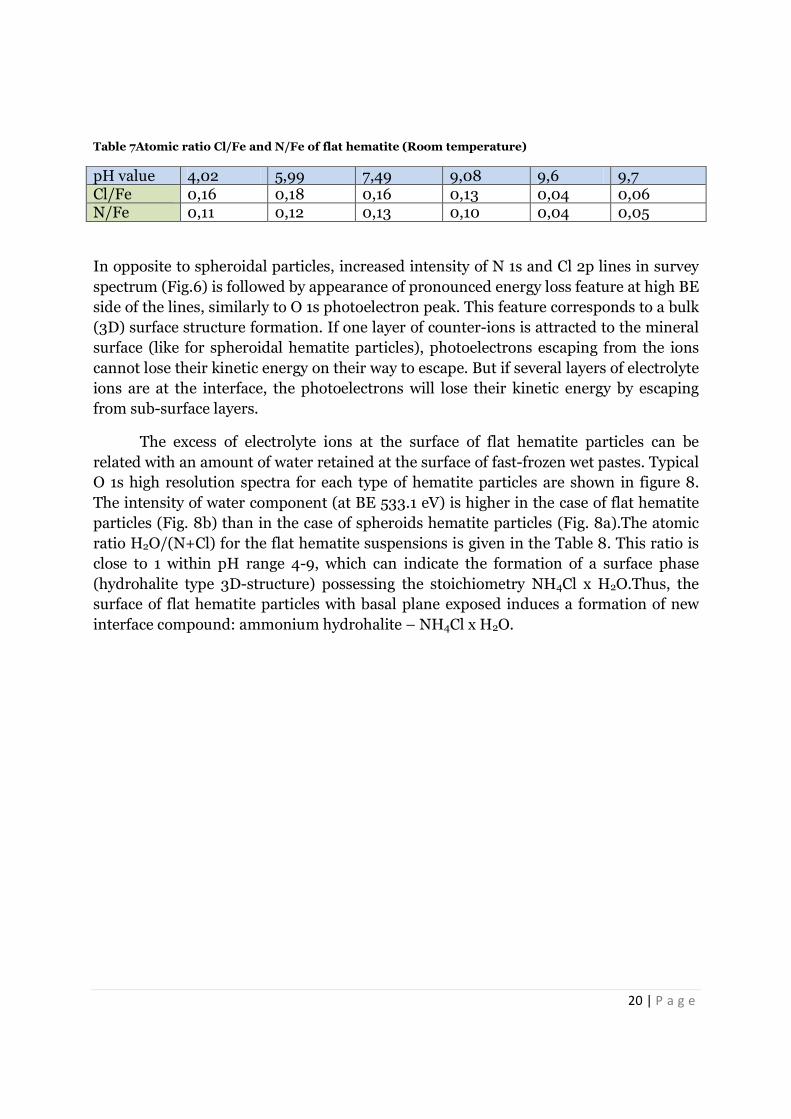
Table 7Atomic ratio Cl/Fe and N/Fe of flat hematite (Room temperature)
pH value 4,02 5,99 7,49 9,08 9,6 9,7 Cl/Fe 0,16 0,18 0,16 0,13 0,04 0,06 N/Fe 0,11 0,12 0,13 0,10 0,04 0,05
In opposite to spheroidal particles, increased intensity of N 1s and Cl 2p lines in survey
spectrum (Fig.6) is followed by appearance of pronounced energy loss feature at high BE
side of the lines, similarly to O 1s photoelectron peak. This feature corresponds to a bulk
(3D) surface structure formation. If one layer of counter-ions is attracted to the mineral
surface (like for spheroidal hematite particles), photoelectrons escaping from the ions
cannot lose their kinetic energy on their way to escape. But if several layers of electrolyte
ions are at the interface, the photoelectrons will lose their kinetic energy by escaping
from sub-surface layers.
The excess of electrolyte ions at the surface of flat hematite particles can be
related with an amount of water retained at the surface of fast-frozen wet pastes. Typical
O 1s high resolution spectra for each type of hematite particles are shown in figure 8.
The intensity of water component (at BE 533.1 eV) is higher in the case of flat hematite
particles (Fig. 8b) than in the case of spheroids hematite particles (Fig. 8a).The atomic
ratio H2O/(N+Cl) for the flat hematite suspensions is given in the Table 8. This ratio is
close to 1 within pH range 4-9, which can indicate the formation of a surface phase
(hydrohalite type 3D-structure) possessing the stoichiometry NH4Cl x H2O.Thus, the
surface of flat hematite particles with basal plane exposed induces a formation of new
interface compound: ammonium hydrohalite – NH4Cl x H2O.

21 | P a g e
Figure 8 O 1s spectrum for a) fast- frozen spheroidal hematite particles at pH 7.6 and b) fast-frozen flat particles at pH 7.49
Table 8 Atomic ratio H2O/(Cl+N) at the surface of fast-frozen flat hematite particles
pH value 4,02 5,99 7,49 9,08 9,6 9,7 H2O/(N+Cl) 1,62 1,11 1,12 1,17 4,73 4,48
Due to the formation of ammonium hydrohalite at the surface of the flat
hematite, the surface charge of hematite cannot be followed using the atomic ratio
NH4+/Cl-. Theoretical atomic ratio NH4
+/Cl- of the new surface compound is 1:1, which
corresponds to the values calculated from XPS data (Table 9). Through whole pH range,
the atomic ratio NH4+/Cl- is equal to 1,except a slight increase of this ratio at high pH.
Table 9 Atomic ratio NH4/Cl of flat hematite (Frozen pastes)
pH value 4,02 5,99 7,49 9,08 9,6 9,7 NH4
+/Cl- 1,02 1,04 1,04 1,13 1,34 1,19
Similar to the spheroidal particles, the amount of NH4+ and Cl- ions remarkably
decreases at highest pH. Corresponding atomic ratios N/Fe and Cl-/Fe, given in tables 7
and 4are equal to 0.05 (0.02) and 0.04 (0.03). The numbers given in parenthesis
correspond to the values for spheroidal hematite particles. The decreased amount of
electrolyte ions at the interface of flat hematite particles indicates that hydohalite phase
H2O
H2O
OH
OH
Oxide Oxide
a) b)

22 | P a g e
is not formed at high pH. Under water loss, therefore, it becomes possible to detect a
formation of NH2 specie at the surface.
As a consequence, the ammonium ions at the surface of flat hematite are only converted into amine group at high pH. Two main reactions can be responsible for the conversion: hydrogen bonding between the surface and NH3 (Fe – OH—NH3) followed by direct NH2 coordination to Fe with the loss of water (Fe – NH2 + H2O). The second reaction is the one which allows the conversion of ammonium ions into amine groups.
It can also be noticed that the same amount of amine group is obtained at the
surface of spheroidal hematite particles at high pH. One of the reasons to explain this
fact is the amount of NH4+ and Cl- at the surface of each type of hematite. Indeed, at
high pH, the same amount is obtained. In the table10, the atomic ratios NH4+/Fe and Cl-
/Fe are given for both hematite particles, at room temperature. There is no NH4+ ions at
the surface (atomic ratio NH4+/Fe equal to 0 for both hematites) and approximately the
same amount of Cl- ions (atomic ratio Cl-/Fe is equal to 0,05 for flat particles and 0,03
for spheroidal ones).
Table 10 Atomic ratios at room temperature for flat hematite (F) and spheroidal hematite (S)
pH value 9,6 9,7 9,24 NH4
+/Fe 0 (F) 0 (F) 0 (S) Cl-/Fe 0,04 (F) 0,06 (F) 0,03 (S)

23 | P a g e
IV. CONCLUSIONS
Reactions of ammonium ions with the surface of flat and spheroidal hematite particles have been studied. XPS with fast-frozen hematite pastes allowed following the protonation of ammonium ions. Two types of hematite particles studied have different surface structures which involve different reactions at their surface. The formation of ion pairs (Fe-OH + NH4
+ + Cl- ↔ Fe-NH3+--Cl-+ H2O) and ligand exchange (Fe-OH + Cl-
↔Fe-Cl + OH-) reaction were noted for spheroidal particles. In the case of flat hematite particles, the formation of an ammonium hydrohalite phase,NH4Cl x H2O,consisting of multiple layers of NH4
+ and Cl- ions,was observed at low and neutral pHs. This phase does not form at high pH.
For both types of hematite particles, the formation/coordination of amine group at the surface is observed only at room temperature when interface water is removed. In the case of spheroidal hematite particles, their acid-base active surface allows the formation of amine group in the whole pH range. The largest amount of NH2 group is obtained at highest pH. In the case of flat hematite particles with basal plane exposed, amine groups are only detected at high pH where the hydrohalite phase does not form at the interface.
V. REFERENCES
[1] K. Shimizu, A. Shchukarev, J-F.Boily, X-Ray Photoelectron Spectroscopy of Fast-Frozen Hematite Colloids in Aqueous Solution, J. Phys. Chem. C 2011, 115, 6796-6801
[2] J. Vickerman, I. Gilmore, Surface Analysis – The Principal Techniques 2nd Edition, 2009, 47-112
[3] A. Shchukarev, J-F Boily, A. R. Felmy, XPS of Fast-Frozen Hematite Colloids in NaCl
Aqueous Solutions, J. Phys. Chem. C 2007, 111, 18307-18316
[4] J. F. Moulder, W. F. Stickle, P. E. Sobol, K. D. Bomben, Handbook of X-Ray
Photoelectron Spectroscopy, 1995