x-shooter survey of disk accretion in upper scorpius
TRANSCRIPT
Astronomy & Astrophysics manuscript no. usco_survey_lang_edited c©ESO 2020May 21, 2020
X-Shooter survey of disk accretion in Upper Scorpius
I. Very high accretion rates at age>5 Myr?
C.F. Manara1,??, A. Natta2, G.P. Rosotti3, J.M. Alcalá4, B. Nisini5, G. Lodato6, L. Testi1, 7, I. Pascucci8,L. Hillenbrand9, J. Carpenter10, A. Scholz11, D. Fedele7, A. Frasca12, G. Mulders13, E. Rigliaco14,
C. Scardoni6, 15, and E. Zari16
1 European Southern Observatory, Karl-Schwarzschild-Strasse 2, 85748 Garching bei München, Germanye-mail: [email protected]
2 School of Cosmic Physics, Dublin Institute for Advanced Studies, 31 Fitzwilliams Place, Dublin 2, Ireland3 Leiden Observatory, Leiden University, PO Box 9513, 2300 RA Leiden, The Netherlands4 INAF – Osservatorio Astronomico di Capodimonte, via Moiariello 16, 80131 Napoli, Italy5 INAF – Osservatorio Astronomico di Roma, via di Frascati 33, 00078 Monte Porzio Catone, Italy6 Dipartimento di Fisica, Universitá degli Studi di Milano, Via Giovanni Celoria 16, I-20133 Milano, Italy7 INAF – Osservatorio Astrofisico di Arcetri, L.go E. Fermi 5, 50125 Firenze, Italy8 Lunar and Planetary Laboratory, The University of Arizona, Tucson, AZ 85721, USA9 California Institute of Technology, 1200 East California Blvd, Pasadena, CA 91125, USA
10 Joint ALMA Observatory, Avenida Alonso de Córdova 3107, Vitacura, Santiago, Chile11 SUPA, School of Physics & Astronomy, University of St Andrews, North Haugh, St Andrews, KY16 9SS, United Kingdom12 INAF – Osservatorio Astrofisico di Catania, via S. Sofia, 78, 95123 Catania, Italy13 Department of the Geophysical Sciences, The University of Chicago, 5734 South Ellis Avenue, Chicago, IL 60637, USA14 INAF – Osservatorio Astronomico di Padova, Vicolo dell’Osservatorio 5, I-35122, Padova, Italy15 Institute of Astronomy, University of Cambridge, Madingley Road, Cambridge CB3 OHA, UK16 Max Planck Institute for Astronomy, Königstuhl 17, 69117 Heidelberg, Germany
Received Mar 13, 2020; accepted May 11, 2020
ABSTRACT
Determining the mechanisms that drive the evolution of protoplanetary disks is a necessary step toward understanding how planetsform. For this work, we measured the mass accretion rate for young stellar objects with disks at age >5 Myr, a critical test for thecurrent models of disk evolution. We present the analysis of the spectra of 36 targets in the ∼5-10 Myr old Upper Scorpius star-formingregions for which disk masses were measured with ALMA. We find that the mass accretion rates in this sample of old but still survivingdisks are similarly high as those of the younger (∼ 1− 3 Myr old) star-forming regions of Lupus and Chamaeleon I, when consideringthe dependence on stellar and disk mass. In particular, several disks show high mass accretion rates & 10−9 M�/yr while having lowdisk masses. Furthermore, the median values of the measured mass accretion rates in the disk mass ranges where our sample iscomplete at a level ∼ 60−80% are compatible in these three regions. At the same time, the spread of mass accretion rates at any givendisk mass is still >0.9 dex, even at age>5 Myr. These results are in contrast with simple models of viscous evolution, which wouldpredict that the values of the mass accretion rate diminish with time, and a tighter correlation with disk mass at age>5 Myr. Similarly,simple models of internal photoevaporation cannot reproduce the observed mass accretion rates, while external photoevaporationmight explain the low disk masses and high accretion rates. A possible partial solution to the discrepancy with the viscous models isthat the gas-to-dust ratio of the disks at ∼5-10 Myr is significantly different and higher than the canonical 100, as suggested by somedust and gas disk evolution models. The results shown here require the presence of several interplaying processes, such as detaileddust evolution, external photoevaporation, and possibly MHD winds, to explain the secular evolution of protoplanetary disks.
Key words. Accretion, accretion disks - Protoplanetary disks - Stars: pre-main sequence - Stars: variables: T Tauri, Herbig Ae/Be
1. Introduction
The study of the evolution of planet-forming disks around youngstars and their ability and modality to form planets strongly relieson describing how the main disk properties evolve with time anddepend on the properties of the central star.
From a theoretical viewpoint, the evolution of the disk and itsdispersal is commonly described as an interplay between accre-
? Based on observations collected at the European Southern Obser-vatory under ESO programmes 097.C-0378(A) and 0101.C-0866(A).?? ESO Fellow
tion of material through the disk and onto the central star (e.g.,Hartmann et al. 2016), dispersal of material through winds (e.g.,Ercolano & Pascucci 2017), and internal processes leading tograin growth and planet formation (e.g., Testi et al. 2014; Mor-bidelli & Raymond 2016). On top of that, external processes,such as external photoevaporation and dynamical interactions,can also affect the evolution of disks (e.g., Winter et al. 2018).
A number of disk properties, such as the mass accretion rateonto the central star (Macc), the mass-loss rate in winds, and thedisk mass (Mdisk), can now be measured in a large number ofobjects in different evolutionary stages. This is made possible
Article number, page 1 of 18
arX
iv:2
004.
1423
2v3
[as
tro-
ph.S
R]
19
May
202
0

A&A proofs: manuscript no. usco_survey_lang_edited
thanks to the availability of sensitive optical spectrographs, suchas the X-Shooter instrument on the Very Large Telescope (VLT),and millimeter intereferometers, in particular the Atacama LargeMillimeter and sub-millimeter Array (ALMA).
It is the combination of these instruments that allowed usto establish that the disk mass and Macc are correlated (Manaraet al. 2016b; Mulders et al. 2017). This relation is predicted bythe viscous evolution model (e.g., Lynden-Bell & Pringle 1974;Hartmann et al. 1998; Dullemond et al. 2006; Lodato et al. 2017;Mulders et al. 2017; Rosotti et al. 2017). However, the correla-tion measured in the young star populations of the ∼1-3 Myr oldLupus and Chamaeleon I star-forming regions is in line with theexpectations of viscous evolution theory only if the typical vis-cous timescales have a large spread of values and are typicallyof the order of the age of the region ∼1 Myr (Lodato et al. 2017;Mulders et al. 2017). Such a long viscous timescale is neededto explain the observed scatter of the relation (∼1 dex), muchlarger than what is predicted using shorter viscous timescales(e.g., Dullemond et al. 2006; Mulders et al. 2017; Manara etal. 2019). Assuming purely viscous evolution, a tight correlationwith a much smaller spread of Macc at any Mdisk is expected atolder ages >5 Myr. At this time, the spread in this relation shouldbe dominated by uncertainties on the Macc estimates if viscousaccretion is the driver of the evolution of disks.
On the other hand, other processes can also affect the ratiobetween Mdisk and Macc at different ages. Rosotti et al. (2017)expanded the work of Jones et al. (2012) to show that internalprocesses, such as internal photoevaporation, planet formation,or the presence of dead zones, would make the Macc/Mdisk ratiosmaller than what is expected by pure viscous evolution. Thiswas recently confirmed by more detailed description of the evo-lution of Macc and Mdisk in the case of internal photoevaporationby Somigliana et al. (2020). On the contrary, external photoevap-oration would remove material from the disk causing an increaseof the Macc/Mdisk ratio with respect to pure viscous evolution.
All the aforementioned processes can be critically tested bylooking at the Mdisk-Macc relation in different samples of youngstellar objects at different ages and in different environments.Here we present the results of the first survey of accretion ratesin the disk-bearing stars of the ∼5-10 Myr old (Pecaut, & Ma-majek 2016; Feiden 2016; David et al. 2019) Upper Scorpiusstar-forming region. Our initial aim is to establish, for the firsttime, the nature of the relation between Macc and Mdisk at ages>5 Myr, and, secondly, to provide a measurement of the typi-cal median values of Macc and of the scatter of this relation. Theempirical constraints on the time evolution of the Macc-Mdisk re-lation will allow us to further constrain how protoplanetary disksevolve.
The paper is structured as follows. Section 2 presents thesample selection, observations, and the data reduction procedure.The analysis of the spectra is then presented in Sect. 3, while theresults of our analysis are described in Sect. 4. We then discussour findings in Sect. 5 and outline the conclusions of this workin Sect. 6.
2. Sample, observations, and data reduction
2.1. Sample
We selected our sample starting from the ALMA observations byBarenfeld et al. (2016), which included all the objects known atthe time to have infrared excess, and therefore a disk, and withspectral types from G2 to M4.75 (Luhman & Mamajek 2012;Carpenter et al. 2006). Additional candidate members of the re-
gion were found later on (e.g., Wilkinson et al. 2018). Of the 106targets observed by Barenfeld et al. (2016), we excluded the 31“debris/evolved transitional sources”, as they probably representeither young debris disks composed of second-generation dust,or amorphous disks (which are not the targets of this study), aswell as the 22 ALMA nondetections of “primordial” disks. Thelatter are excluded as their disk masses are lower than those con-sidered in the analysis of this work, as discussed in the follow-ing. The values of disk dust masses (Mdisk,dust) were obtainedby Barenfeld et al. (2016) from the millimeter flux, assuming adisk temperature dependent on the stellar luminosity and a sin-gle opacity and distance (d = 145 pc) for all disks, and with theassumption that the disk thermal emission is optically thin at thewavelength of the observations (0.88 mm, Barenfeld et al. 2016).We revisit these estimates based on the individual distances ob-tained from the parallaxes provided by the Gaia data release 2(DR2, Gaia Collaboration et al. 2016, 2018, see Table 2).
Our main goal is to quantify the median values and thespread of Macc in the Macc-Mdisk relation. For this reason, andgiven the allocated telescope time, we selected the stars withdisks in two representative bins of Mdisk,dust for which we havean almost complete sample (Fig. 1) compared to the Barenfeldet al. (2016) one. When we originally selected the sample, GaiaDR2 was not yet available. As a result of the revised distances,the completeness of our sample is not 100% in the two disk massbins 0.16.Mdisk,dust/M⊕ .0.563 and 0.75≤Mdisk,dust/M⊕ ≤1.957.On top of the targets in these two mass bins, we include in theanalysis stars in Upper Scorpius that were observed in our previ-ous observing run, as described in the next subsection. The diskmass of these additional targets is outside the boundaries of thetwo disk mass bins just introduced, and are mainly at higher diskmasses.
Considering the samples from the two programs and the cor-rection done using the information from Gaia, the complete-ness of our sample is as follows. Among the whole populationof disks observed by Barenfeld et al. (2016) in Upper Scor-pius with 0.16. Mdisk,dust/M⊕ .2.153, we obtained spectra for28/36 of them. On top of that, we also observed 6/10 of themore massive disks. The sample includes two IR-classified tran-sition disks (2MASS J16042165-2130284, 2MASS J16062196-1928445) and one additional transition disk resolved by ALMA(2MASS J15583692-2257153, Andrews et al. 2018; Ansdell etal. 2020), five “evolved” disks, meaning those with little infraredexcess, and 26 full disks. Morever, one target that was not in-cluded in the sample of Barenfeld et al. (2016) was observed inour previous program. The latter is analyzed here, but cannot beincluded in the discussion due to the lack of a measured diskmass. Finally, one target (2MASSJ15354856-2958551) is a bi-nary system that we resolved for the first time, and we associatethe disk mass with both components. Therefore, the total numberof targets for which we obtained the stellar and accretion proper-ties here is 36, but the disk masses are available only for 35 ofthese. We verified that all the targets discussed here have paral-laxes and proper motions compatible with being members of theUpper Scorpius association using the Gaia DR2 data.
2.2. Observations
All observations have been carried out with the X-Shooter spec-trograph (Vernet et al. 2011) on the VLT. Out of the 36 targets,eight were observed during our previous service mode programPr.Id. 097.C-0378 (PI Manara), and 28 in the visitor mode pro-gram Pr.Id. 0101.C-0866 (PI Manara). In both programs, we ob-tained spectra both with narrow slits, to ensure a spectral reso-
Article number, page 2 of 18

Manara et al.: X-Shooter survey of disk accretion in Upper Scorpius
1.0 0.5 0.0 0.5log(M /M )
1
0
1
2
log(
Mdi
sk,d
ust/M
)
Not observedUSco
Fig. 1. Disk mass vs stellar mass after correcting the disk masses for theGaia estimated distances and using the stellar masses derived here. Or-ange circles are used for targets observed with X-Shooter, gray symbolsfor targets not observed, circles for ALMA detections, downward facingtriangles for ALMA upper limits. The shaded regions delimit the diskmass ranges where the sample is complete with respect to the Baren-feld et al. (2016) one. The dashed gray lines delimit the bins used in thediscussion. For the objects not observed with X-Shooter, the distances,disk, and stellar masses from the literature are adopted.
lution R & 10000 in the VIS and NIR arm (λ > 500nm), andR & 5500 in the UVB arm (300. λ . 500 nm), as well as with5.0′′ wide slits to correct the narrow slit spectra for slit losses.The slit was always oriented at parallactic angle, apart from thevisual binary system where the slit was aligned to include bothcomponents. The log of the observations is discussed in App. Aand presented in Table A.1.
2.3. Data reduction
Data reduction was carried out with the X-Shooter pipelinev2.9.3 (Modigliani et al. 2010) using the Reflex workflow v2.8.5(Freudling et al. 2013). The pipeline carries out the standardsteps of flat, bias, and dark correction, wavelength calibration,spectral rectification and extraction of the 1D spectrum, and fluxcalibration using a standard star obtained in the same night. The1D extraction of the spectra was carried out with IRAF from therectified 2D spectrum in cases where the S/N of the UVB armwas low, and for resolved binaries. Telluric correction was doneusing telluric standard stars observed close in time and airmassfor the VIS arm, and molecfit (Smette et al. 2015; Kausch et al.2015) for the NIR arms for both single stars and binaries. Fi-nally, the spectra obtained with the narrow slits were rescaled tothe wide slit ones to correct for slit losses. This procedure is thesame as that used in previous works, for example, Alcalá et al.(2017) and Manara et al. (2017a).
3. Data analysis
The analysis of the spectra to derive their stellar and accretionproperties was carried out with the method described by Man-ara et al. (2013a). In short, the observed spectrum is dereddenedand fit with the sum of a photospheric template spectrum anda slab model to reproduce the continuum excess emission dueto accretion. The grid of models used to find the best fit com-
3.53.63.7logTeff [K]
2
1
0
1
logL
[L]
0.02 M
0.05 M0.10 M
0.2 M
0.4 M0.6 M
0.8 M1.0 M1.2 M1.4 M
1.2 Myr
10 Myr30 Myr
Upper Sco
Fig. 2. HR diagram for objects in Upper Scorpius observed here. Theevolutionary tracks are from Baraffe et al. (2015), with isochrones for1.2, 3, 5, 10, and 30 Myr. The red line is the median of the L? in differentTeff bins.
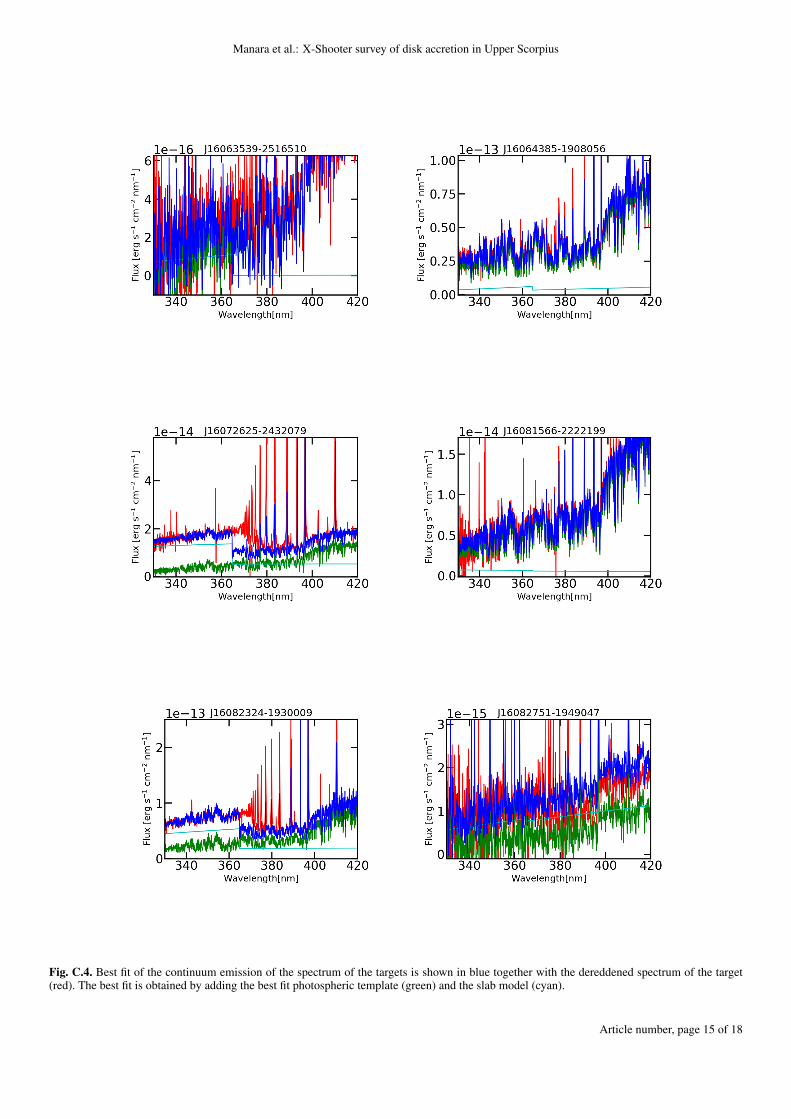
prises various Class III photospheric templates with differentspectral types (SpT) from G- to late M-type taken from Manaraet al. (2013a, 2017b), different slab models, and extinction val-ues (AV ), assuming the reddening law by Cardelli et al. (1989)and RV = 3.1. The best fit of the Balmer continuum emissionare shown in Figs. C.1-C.6. The integrated flux of the best fitslab models gives an estimate of the excess luminosity due toaccretion (Lacc), and the best fit normalization of the Class IIItemplates gives an estimate of the stellar luminosity (L?). Byconverting the SpT to Teff using the relation by Luhman et al.(2003), we are able to position the targets on the HR diagram(see Fig. 2) and obtain the stellar mass (M?) using the evolution-ary models by Baraffe et al. (2015) or Siess et al. (2000) (seeTable 2). We note that our targets are located on the HRD typi-cally between the 3 Myr and 10 Myr isochrones of the Baraffe etal. (2015) models, with large spread at M?.0.4 M�. The locationof the targets on the HRD is thus in line with an age of ∼5-10Myr for the region, and with an older age than other well-knownstar-forming regions, such as Lupus and Chamaeleon I, whichshow typically higher values of L? at any Teff for objects withdisks. Finally, Macc was obtained from the relation Macc= 1.25 ·LaccR?/(GM?). All the stellar and accretion values are given inTable 2.
As several emission lines are present in the spectra, we mea-sure their luminosity and convert them in Lacc using the relationsby Alcalá et al. (2017). For the stronger accretors (Lacc& 10−4
L�), the values of Lacc obtained from the fit described above orfrom the emission line fluxes are similar within the uncertainties,as is usually found in accreting young stellar objects (e.g., Her-czeg, & Hillenbrand 2008; Alcalá et al. 2014, 2017). For lowervalues of Lacc and for ∼20% of the targets, instead, the accretionluminosity inferred from the line luminosities are systematicallyhigher than those derived from the excess continuum lumino-sity, typically by a factor ∼5-10. This is in line with what wasalready observed by Alcalá et al. (2014); that the line emissionis a higher fraction of the excess continuum emission for targetswith low Lacc, with the total line emission being comparable tothe continuum emission at Lacc. 10−4 L�. We defer discussingthis point to a future paper. In the following, we assume that Laccis the one measured from the excess continuum emission. Here,it is sufficient to say that if we were to replace the continuumexcess luminosity with the sum of the continuum excess plus
Article number, page 3 of 18
A&A proofs: manuscript no. usco_survey_lang_edited
1.5 1.0 0.5 0.0 0.5logM [M ]
12
11
10
9
8
7lo
gMac
c [M
/yr]
USco
1.5 1.0 0.5 0.0 0.5logM [M ]
12
11
10
9
8
7
logM
acc [
M/y
r]
LupusChaIUSco
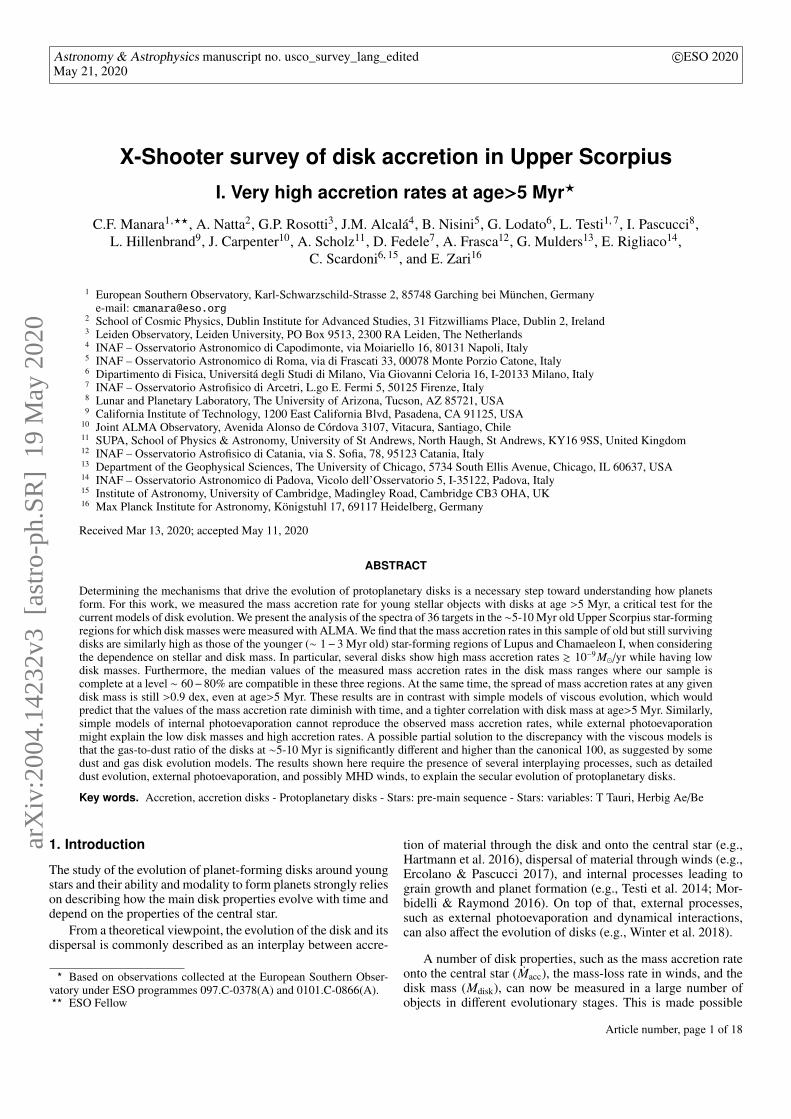
Fig. 3. Mass accretion rate vs stellar mass for the targets in the UpperScorpius region (orange points, both in the upper and bottom panels)and for the targets in the Lupus and Chamaeleon I regions (gray sym-bols, bottom panel). The downward facing triangles are used for non-accreting objects, transition disk objects are highlighted with a circlearound their symbols. The cross indicates the typical errors on the mea-surements.
line emission the results discussed in the following would notbe affected. We nevertheless note that Macc could be underesti-mated for the objects with the lowest accretion rates, which aretypically below the chromospheric noise.
For some of the targets with the lowest measured accretionrates, the ratio Lacc/L? falls below the typical values for chromo-spheric emission for their spectral type (Manara et al. 2013a,2017b). In particular, five targets are significantly below thischromospheric emission noise when considering the continuumemission, and below or compatible with this noise when consid-ering the line emission. We define these five targets as possiblenon-accretors (see Table 2), in line with previous work (e.g., Al-calá et al. 2014, 2017; Manara et al. 2016a, 2017a). The mea-sured excess emission in these objects is considered in the ana-lysis as an upper limit on the accretion rate, however, as dis-cussed by Manara et al. (2017a), the measured excess emissioncould be contaminated by other processes, in particular chro-mospheric emission. No excess in the Balmer continuum regionwith respect to a photosphere is detectable for these targets (see
4 2log(100 Mdisk, dust/M )
12
10
8
logM
acc [
M/y
r]
1 Myr0.1 Myr
10 Myr
USco
4 2log(100 Mdisk, dust/M )
12
10
8lo
gMac
c [M
/yr]
1 Myr0.1 Myr
10 Myr
LupusChaIUSco
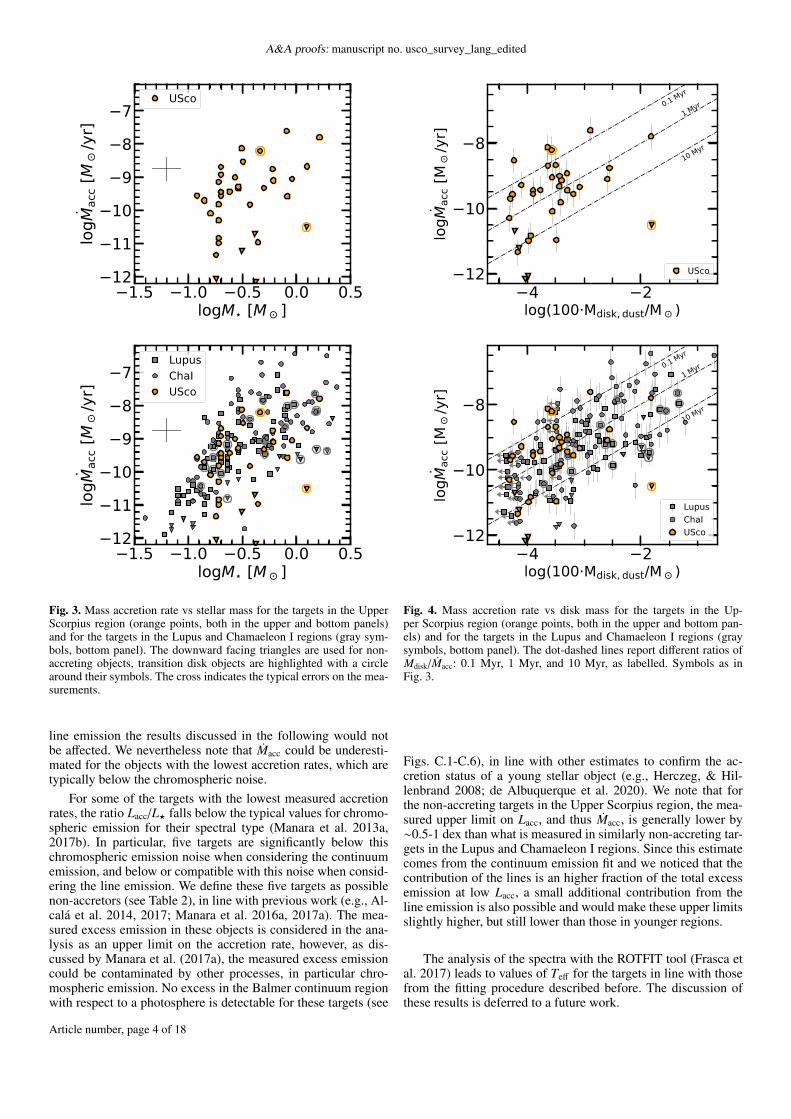
Fig. 4. Mass accretion rate vs disk mass for the targets in the Up-per Scorpius region (orange points, both in the upper and bottom pan-els) and for the targets in the Lupus and Chamaeleon I regions (graysymbols, bottom panel). The dot-dashed lines report different ratios ofMdisk/Macc: 0.1 Myr, 1 Myr, and 10 Myr, as labelled. Symbols as inFig. 3.
Figs. C.1-C.6), in line with other estimates to confirm the ac-cretion status of a young stellar object (e.g., Herczeg, & Hil-lenbrand 2008; de Albuquerque et al. 2020). We note that forthe non-accreting targets in the Upper Scorpius region, the mea-sured upper limit on Lacc, and thus Macc, is generally lower by∼0.5-1 dex than what is measured in similarly non-accreting tar-gets in the Lupus and Chamaeleon I regions. Since this estimatecomes from the continuum emission fit and we noticed that thecontribution of the lines is an higher fraction of the total excessemission at low Lacc, a small additional contribution from theline emission is also possible and would make these upper limitsslightly higher, but still lower than those in younger regions.
The analysis of the spectra with the ROTFIT tool (Frasca etal. 2017) leads to values of Teff for the targets in line with thosefrom the fitting procedure described before. The discussion ofthese results is deferred to a future work.
Article number, page 4 of 18
Manara et al.: X-Shooter survey of disk accretion in Upper Scorpius
4. Results
Our analysis of the X-Shooter spectra of the targets allowed us toderive their stellar parameters, and, for the first time, their massaccretion rates. In this section, we discuss the relation betweenthe following three parameters: the disk dust mass (Mdisk,dust),which is also a proxy of the total disk mass (Mdisk) assuming aconstant gas-to-dust ratio of 100, the stellar mass (M?), and themass accretion rate (Macc).
The distribution of the measured Lacc as a function of L?(see App. C.2), as well as the one of Macc vs M? (Fig. 3) revealsa great similarity with the relations observed in the younger Lu-pus and Chamaeleon I star-forming regions (Alcalá et al. 2014,2017; Manara et al. 2016a, 2017a). Indeed, the values of Maccmeasured in accreting objects with disks in the Upper Scorpiusregion show both similar values and a similar large (∼1-2 dex)spread of Macc at any M? to the ones in these younger regions.One difference we note is that the maximum values of Maccmeasured in the Upper Scorpius sample (Macc∼ 3 · 10−8M�/yr)is in line with the maximum values measured in Lupus, butlower than the maximum values measured in Chamaeleon I(Macc∼ 3 · 10−7M�/yr). However, as we discuss in the follow-ing, this might be an effect of the incompleteness of our sampleat any given M?, as we only selected the targets based on theirdisk masses.
Similarly, the distribution of the data for the Upper Scorpiustargets on the Macc-Mdisk plane (Fig. 4) is in overall agreementwith the values measured in the younger star-forming regions ofLupus and Chamaeleon I (Manara et al. 2016b; Mulders et al.2017). A linear fit with the linmix tool, which considers uncer-tainties on both axes and nondetections (Kelly 2007), derives asimilar slope (0.8±0.4) and spread (σ = 1.3) on the Upper Scor-pius sample as the relation found in the younger regions (Manaraet al. 2016b; Mulders et al. 2017; Manara et al. 2019). However,the different level of completeness in the various bins of Mdiskcanimpact this result.
The samples in the younger Chamaeleon I and Lupus star-forming regions include >90% of the objects with IR-excess,such as a disk, in these regions (Alcalá et al. 2017; Manara et al.2017a; Pascucci et al. 2016; Ansdell et al. 2016, 2018). On theother hand, our sample in the Upper Scorpius region is, by con-struction, not similarly complete. Indeed, we selected only themost massive objects with IR-excess, making the sample com-plete at a similar level only in small ranges of Mdisk (see Sect. 2).In order to minimize the effects of incompleteness on the sam-ple, we compared the median values and the spread of the Macc-Mdisk relation in the range of Mdisk, where the sample in the Up-per Scorpius region is ∼80% complete with respect to the initialsample of Barenfeld et al. (2016). We thus selected the bins ofMdisk to carry out the analysis as reported in Table 1 and shownon Fig. 1 , such that three of these bins cover the Mdisk range withthe highest completeness for the sample in the Upper Scorpiusregion. In the first and second of the chosen bins, the sample inthe Upper Scorpius region is ∼80% complete; in the third one,the sample completeness is 60%. These bins were then used tocalculate the medians for the observed Macc, shown in Fig. 5.
The comparison between the three datasets, presented inFig. 5 and reported also in Table 1, shows that the median val-ues of Macc are similar in the three regions, although typicallyslightly smaller for Lupus. The spread of Macc, measured as thedifference between the 84th and 16th percentile of the distribu-tion in any bin, is typically slightly larger in the Chamaeleon Iand Upper Scorpius regions (∼ 1.6 − 1.7 dex) than in the Lupusregion (∼ 1 dex).
5. Discussion
The results presented here show that the values of Macc measuredin disk-hosting stars in a star-forming region with age∼5-10 Myrare typically similar to those measured in disk-hosting stars inyounger (age<3 Myr) regions. This is true both for the medianvalues of Macc at given M? and/or Mdisk, and the spread of Maccvalues at given M? and/or Mdisk, which varies from one regionto another but does not decrease with time. In particular, thereare disks with high Macc> 10−9M�/yr and low disk masses, thuswith Mdisk/Macc ∼0.1 Myr at all ages, even at ∼ 5−10 Myr. In thefollowing, we discuss this result in light of some of the currentmodels of disk evolution.
5.1. The comparison with viscous evolution models
The results shown here, taken at face value, are in contrast witha simple prescription of viscously evolving disks. A purely vis-cously evolving disk should have a value of Macc of the orderof Mdisk divided by the age of the disk, as shown by Jones etal. (2012) and Rosotti et al. (2017). This implies a tight corre-lation between these two quantities at ages much longer thanthe viscous timescale (e.g., Dullemond et al. 2006; Lodato et al.2017; Mulders et al. 2017). In our data, both the values of Maccare higher in several targets than those expected given Mdisk ina viscous framework for disks of age >5 Myr, and the values ofMacc are more spread than the tight correlation expected. Theseresults are solid even when considering our selection biases, aswe consider, in each Mdisk bin, a close to complete fraction ofthe known objects still retaining a disk – traced by IR excess andALMA detection.
To be able to reproduce the observed spread of the relationbetween Macc and Mdisk in the Lupus and Chamaeleon I star-forming regions with viscous evolution models, both Lodato etal. (2017) and Mulders et al. (2017) needed to make several as-sumptions. First of all, the viscous timescale needed to be of theorder of the age of the regions (∼1 Myr). If this viscous timescaleof ∼1 Myr were to be a universal value, this would imply that thecorrelation must be tight at ages> 5 Myr. This is not observedhere. Secondly, they needed to postulate a large dispersion ofthe model parameters; an age spread in the region, a distributionof initial conditions and of viscous timescales (or equivalentlyα-viscosity parameter). When then the models were convolvedwith the observational uncertainties, both the observed slope andspread of the Macc-Mdisk relation were reproduced.We tested our results against the best fitting viscous models forthe Lupus star-forming regions obtained by Lodato et al. (2017).These were described by a value of the exponent of the radialdependence of viscosity γ=1.5, a mean value of the viscositytimescale (tν) of 〈log(tν/yr)〉 = 5.8 with σtν = 1 dex, a mean ageof the disks 〈log(t/yr)〉 = 5.9 with σt = 0.3 dex, and furtherassuming 〈log(M0/M�)〉 = −2.2, with M0 being the initial diskmass of the models, and σM0 = 0.2 dex. We let these viscousmodels evolve in time until an age of 8 Myr. The expectationsfrom these models are shown in Fig. 6 and reported in Table 1.While the models predict a lower Macc at any Mdisk at 8 Myrcompared to 1 Myr, the data show that the measured values ofMacc in the Upper Scorpius region are closer to the expectationsfrom models of 1 Myr old viscously evolving disks. In partic-ular, the 84th percentile of the distribution of Macc expected bythe models is always lower than the median value measured inthe disks in the Upper Scorpius region. Also, as noted in Sect. 4,the spread of the values of Macc at any given Mdisk are simi-larly large in the older Upper Scorpius region as in the younger
Article number, page 5 of 18

A&A proofs: manuscript no. usco_survey_lang_edited
4 212
10
8
logM
acc [
M/y
r]
Lupus
4 2log(100 Mdisk, dust/M )
Chamaeleon I
4 2Upp. Scorpius
Fig. 5. Mass accretion rates vs disk dust masses for the targets in the Lupus and Chamaeleon I star-forming regions, and in the Upper Scorpiusregion. The dashed lines report the 16th and 84th percentiles, and the solid line the median of the distributions.
Table 1. Median values for the Macc- Mdisk relation
Disk mass bin Lupus Chamaeleon I Upper Sco Viscous 1 Myr Viscous 8 Myr
Median Spr. Ndata Median Spr. Ndata Median Spr. Ndata Median Spr. Median Spr.
4.8 · 10−5 − 1.7 · 10−4 −9.77 0.55 5/0/1 −10.26 1.22 14/0/11 −10.30 1.87 15/4/0 −10.01 1.11 −11.04 1.56
1.7 · 10−4 − 6.47 · 10−4 −9.94 1.58 15/0/0 −9.48 2.56 20/4/4 −9.10 1.12 14/0/0 −9.53 0.76 −10.50 1.18
6.47 · 10−4 − 1.55 · 10−2 −9.17 1.13 32/4/0 −8.39 1.93 36/1/0 −8.93 1.81 6/1/0 −8.91 1.35 −9.65 1.08
Notes. Mdisk= 100 * Mdisk,dustin M�. The table reports the values of logMacc, reported in M�/yr, for the median, and for the spread of the distribution,defined as the difference between the 16th and 84th percentile of the distribution in a given bin of Mdisk. The latter is equivalent to a 2σ spread. TheNdata columns report the total number of tagets included in the bin / the number of non accretors in the bin / the number of undetected disks in thebin.
region of Chamaeleon I, and larger than the viscous evolutionmodel evolved at 8 Myr. This is particularly true when we com-pare the spread obtained fitting the model at 8 Myr using thelinmix tool, σ = 0.4 dex, with the data in the Upper Scorpiusregion, that have a spread with this method of σ = 1.3 dex (seeSect. 4). We thus observe that the models able to reproduce theobserved Macc-Mdisk relation with pure viscous evolution for theLupus region are not in agreement with the observations in theUpper Scorpius region, assuming only an age evolution from oneregion to another.
5.2. The impact of photoevaporation and variable accretion
The observations are even more discrepant from models predict-ing the Macc-Mdisk relation by means of both viscous evolutionand internal photoevaporation. As shown by Somigliana et al.(2020), the effect of photoevaporation is the reduction in thenumber of accreting targets at low disk masses and mass ac-cretion rates to an extent that, by ∼10 Myr, only a fraction ofmassive disks still survive. This is not observed here, where wesee low-mass disks with high Macc. It is unclear whether thisdisagreement is due to the fact that the models assume only onestellar mass and two fixed mass-loss rates, or whether this is anissue of internal photoevaporation models in general.
On the other hand, external photoevaporation would pre-dict that the disks have low mass, while still low values ofMdisk/Macc∼0.1 Myr (see Fig. 4, and Rosotti et al. 2017; Selleket al. 2020), more in line with what is observed here. In this con-text, it is worth mentioning that the environment of Upper Scor-pius is different than the one of Chamaeleon I and Lupus, havingmore nearby massive stars (e.g., de Zeeuw et al. 1999). In suchan environment, the effect of external photoevaporation couldhave been relevant for the evolution of disks, possibly more thandynamical interactions (e.g., Winter et al. 2018). Whether thiseffect has been dominant for the evolution of the disks observedhere is still an open question. Further modeling is mandatoryhere, but it is nevertheless puzzling how the mass accretion ratescan be retained for such long time with so little disk mass avail-able.
A possible solution to the fact that the accretion rates mea-sured here are high given the measured Mdisk might be vari-able accretion. However, studies in younger star-forming regionshave shown that, in general, typical variation of Macc are <0.4dex in most disks (e.g., Costigan et al. 2014; Venuti et al. 2014),with only a small fraction of targets showing extreme variabil-ity of Macc>1-2 dex (e.g., Audard et al. 2014). We could imag-ine that the variability is larger in the old region of Upper Scor-pius, but in this case we could expect a larger dispersion in ac-cretion rates than in younger regions, which, however, was not
Article number, page 6 of 18

Manara et al.: X-Shooter survey of disk accretion in Upper Scorpius
4 212
10
8lo
gMac
c [M
/yr]
LupusUSco
4 2log(100 Mdisk, dust/M )
Visc 1 MyrVisc 8 Myr
Fig. 6. Comparison between median and percentiles of the mass accretion rates as a function of disk mass for the Lupus and Upper Scorpiusregions (left), and for the Upper Scorpius region and the expectations from viscous models at 1 Myr and 8 Myr (right).
observed. Further studies on variability in older star-forming re-gions is needed. The mass-budget issue given the observed Maccand Mdisk is therefore important. Indeed, under the assumptionthat Macc is constant with time, these high values of Macc wouldimply that over the lifetime of the disk 10−8M�/yr ·107 yr ∼ 0.1M� of disk gas mass is accreted from the disk onto the star.Assuming a gas-to-dust ratio of 100, this means that a total ofMdisk,dust∼ 10−3 M� was accreted. This value is in line with themost massive disks observed in the Lupus and Chamaeleon Idisks, which could indeed be the progenitors of the surviveddisks observed here. Such high mass would probably imply thatthese disks were gravitationally unstable at the beginning of theirlives (e.g., Kratter & Lodato 2016). One possibility could bethat accretion becomes active at later ages, as predicted by somemodels of MHD disk winds driven accretion (e.g., Armitage etal. 2013, for the case of a constant differential magnetic flux).
5.3. The need to account for dust evolution
It is worth mentioning again that the assumption Mdisk=100·Mdisk,dust even after ∼5-10 Myr of disk evolution is possiblyincorrect. As shown by global models of dust and gas evolution(e.g., Birnstiel et al. 2010; Rosotti et al. 2019), dust radial driftis in general more efficient than gas accretion, implying that thedust-to-gas ratio is a decreasing function of time. Depending onthe disk parameters (such as the efficiency of grain growth andthe disk size), there can be an initial period of time, lasting ∼1-2 Myr, in which the assumption Mdisk∼ 100·Mdisk,dust is almostreasonable. However, this could not be the case for the UpperScorpius targets, which are significantly older.
At an age of ∼5-10 Myr, models tend to predict that the dustis depleted by a factor ranging from ∼10 to ∼100 (e.g., Birn-stiel et al. 2010; Rosotti et al. 2019). Such an increase in thegas-to-dust ratio to 1000 or more would make the median valuesof Mdisk/Macc more in line with expectations from viscous evo-lution by implying that the disks are substantially more massivethan assumed here. A dedicated modeling effort would be neededto assess whether this is indeed a viable explanation, but thisfalls outside the scope of this paper. While this could reconcilethe median values of Macc with viscous evolution models while
making the disks in Upper Scorpius as massive as the youngerdisks in Chamaeleon I and Lupus, it is unclear whether a bettermatch with the observed age-independent spread could be ob-tained with such models. Mulders et al. (2017) already showedthat a simple scatter in the values of the gas-to-dust ratio alonecannot reproduce the observed scatter in the Macc-Mdisk relationwith no need for other sources of scatter, such as accretion vari-ability.
5.4. Does the mass accretion rate decrease with time?
The detection of strong accretors at later ages, and the connectedhint of a lack of a general decrease of accretion rates with timewhen the targeted stars are still hosting a disk, has already beenobserved in different older star-forming regions: the nearby looseassociations TWA (Venuti et al. 2019) and η-Cha (Rugel et al.2018), the more distant γ-Velorum cluster (Frasca et al. 2015),Orion OB1b and Orion OB1a associations (Ingleby et al. 2014),and even the very massive regions like NGC3603 or 30 Doradus(De Marchi et al. 2017). Individual targets have also been foundto be still accreting at age>20 Myr (e.g., Mamajek et al. 2002;Zuckerman et al. 2014; Murphy et al. 2018; Lee et al. 2020).While this appears to be in contrast with evidence of a decreaseof Macc with individual ages of young stars (e.g., Hartmann et al.1998; Sicilia-Aguilar et al. 2010; Antoniucci et al. 2014; Hart-mann et al. 2016), it should be noted that Da Rio et al. (2014)showed that correlated uncertainties on the determination of stel-lar parameters from the HR diagram can lead to spurious corre-lations between Macc and individual ages. Also, it is well knownthat the exact values of individual ages suffer from many uncer-tainties (e.g., Soderblom et al. 2014). The incompleteness of oursample does not allow us to draw final statements on this finding.
We nevertheless would like to stress that we sampled onlythe older surviving disks. Indeed, it is well known that the frac-tion of disks and accretors decreases with time (e.g., Haisch et al.2001; Hernández et al. 2007; Fedele et al. 2010). Here, we canonly consider the accretion rates of those disks that have sur-vived until the age of the Upper Scorpius region, while the massaccretion rates of the other targets without IR- or mm-detecteddisk is by this age probably below the chromospheric activity
Article number, page 7 of 18

A&A proofs: manuscript no. usco_survey_lang_edited
limits of these old stars. While this is not an issue for the Macc-Mdisk relation, unless there is a population of massive disks withno accretion, it can impact measurements of typical Macc at dif-ferent ages in populations of stars (see e.g., Sicilia-Aguilar et al.2010).
6. Conclusions
We presented the analysis of the X-Shooter spectra of 36 youngstellar objects with disks detected with ALMA in the ∼5-10 Myrold Upper Scorpius region. For the first time, the accretion ratesfor these targets were derived, together with their stellar proper-ties. After re-scaling the values of the stellar, accretion, and diskproperties with the new distances of the individual targets in-ferred from the Gaia DR2 parallaxes, we obtained the followingresults. The dependence of Macc with M? and with Mdisk is si-milar in the Upper Scorpius region and in younger regions, suchas Lupus and Chamaeleon I. In particular, the median values ofMacc at any given Mdisk are similar in the three regions, whilethe scatter of Macc varies from one region to another, but doesnot diminish with the age of the region. Both facts are in markeddisagreement with simple predictions of viscous evolution mod-els. The higher Macc values than predicted by viscous models fora given Mdisk could maybe be explained if the gas-to-dust ratioincreases with time, as is expected by a radial-drift-dominateddust evolution process.
The difficulties of simple disk viscous evolution models toexplain our results stress the need to develop alternative mod-els in more detail, such as those where the accretion through thedisk is driven by MHD disk winds (e.g., Armitage et al. 2013;Bai & Stone 2013) coupled with global models of dust evolu-tion, so that they could be validated against the existing body ofobservations.
On the observational side, future work should focus on com-pleting the survey of Macc in older regions even in targets whosedisks are not detected at millimetre wavelengths. At the sametime, deep surveys of the gas emission in both young (∼1-2Myr) disks and disks with age >5 Myr are mandatory to establishwhether the results presented here are due to a different processthan viscous evolution, or to the outcome of the evolution of dustin disks.
Acknowledgements. We thank the anonymous referee for a detailed and con-structive report that allowed us to improve the clarity of the paper. We thankS. Barenfeld and P. Cazzoletti for their help in the selection of the targets forthe observations that were used for this work. CFM acknowledges an ESO fel-lowship. This project has received funding from the European Union’s Hori-zon 2020 research and innovation programme under the Marie Sklodowska-Curie grant agreement No 823823 (DUSTBUSTERS). This work was partlysupported by the Deutsche Forschungs-Gemeinschaft (DFG, German ResearchFoundation) - Ref no. FOR 2634/1 TE 1024/1-1. This work has made use ofdata from the European Space Agency (ESA) mission Gaia (https://www.cosmos.esa.int/gaia), processed by the Gaia Data Processing and Ana-lysis Consortium (DPAC, https://www.cosmos.esa.int/web/gaia/dpac/consortium). Funding for the DPAC has been provided by national institu-tions, in particular the institutions participating in the Gaia Multilateral Agree-ment. This work is part of the research programme VENI with project num-ber 016.Veni.192.233, which is (partly) financed by the Dutch Research Coun-cil (NWO). This work has been supported by the project PRIN-INAF MainStream 2018 "Protoplanetary disks seen through the eyes of new generation in-struments".
ReferencesAlcalá, J. M., Natta, A., Manara, C. F., et al. 2014, A&A, 561, A2Alcalá, J. M., Manara, C. F., Natta, A., et al. 2017, A&A, 600, A20Andrews, S. M., Huang, J., Pérez, L. M., et al. 2018, ApJ, 869, L41
Ansdell, M., Williams, J. P., van der Marel, N., et al. 2016, ApJ, 828, 46Ansdell, M., Williams, J. P., Manara, C. F., et al. 2017, AJ, 153, 240Ansdell, M., Williams, J. P., Trapman, L., et al. 2018, ApJ, 859, 21Ansdell, M., Gaidos, E., Hedges, C., et al. 2020, MNRAS, 492, 572Antoniucci, S., García López, R., Nisini, B., et al. 2014, A&A, 572, A62Armitage, P. J., Simon, J. B., & Martin, R. G. 2013, ApJ, 778, L14Audard, M., Ábrahám, P., Dunham, M. M., et al. 2014, Protostars and Planets
VI, 387Bai, X.-N., & Stone, J. M. 2013, ApJ, 769, 76Baraffe, I., Homeier, D., Allard, F., & Chabrier, G. 2015, A&A, 577, A42Barenfeld, S. A., Carpenter, J. M., Ricci, L., et al. 2016, ApJ, 827, 142Barenfeld, S. A., Carpenter, J. M., Sargent, A. I., et al. 2017, ApJ, 851, 85Birnstiel, T., Dullemond, C. P., & Brauer, F. 2010, A&A, 513, A79Cardelli, J. A., Clayton, G. C., & Mathis, J. S. 1989, ApJ, 345, 245Carpenter, J. M., Mamajek, E. E., Hillenbrand, L. A., et al. 2006, ApJ, 651, L49Costigan, G., Vink, J. S., Scholz, A., et al. 2014, MNRAS, 440, 3444Da Rio, N., Jeffries, R. D., Manara, C. F., et al. 2014, MNRAS, 439, 3308David, T. J., Hillenbrand, L. A., Gillen, E., et al. 2019, ApJ, 872, 161de Albuquerque, R. M. G., Gameiro, J. F., Alencar, S. H. P., et al. 2020, arXiv
e-prints, arXiv:2003.09511De Marchi, G., Panagia, N., & Beccari, G. 2017, ApJ, 846, 110Dullemond, C. P., Natta, A., & Testi, L. 2006, ApJ, 645, L69Ercolano, B. & Pascucci, I. 2017, Royal Society Open Science, 4, 170114Fedele, D., van den Ancker, M. E., Henning, T., et al. 2010, A&A, 510, A72Feiden, G. A. 2016, A&A, 593, A99Frasca, A., Biazzo, K., Lanzafame, A. C., et al. 2015, A&A, 575, A4Frasca, A., Biazzo, K., Alcalá, J. M., et al. 2017, A&A, 602, A33Freudling, W., Romaniello, M., Bramich, D. M., et al. 2013, A&A, 559, A96Gaia Collaboration, Prusti, T., de Bruijne, J. H. J., et al. 2016, A&A, 595, A1Gaia Collaboration, Brown, A. G. A., Vallenari, A., et al. 2018, A&A, 616, A1Haisch, K. E., Lada, E. A., & Lada, C. J. 2001, ApJ, 553, L153Hartmann, L., Calvet, N., Gullbring, E., et al. 1998, ApJ, 495, 385Hartmann, L., Herczeg, G., & Calvet, N. 2016, ARA&A, 54, 135Herczeg, G. J., & Hillenbrand, L. A. 2008, ApJ, 681, 594Hernández, J., Hartmann, L., Megeath, T., et al. 2007, ApJ, 662, 1067Ingleby, L., Calvet, N., Hernández, J., et al. 2014, ApJ, 790, 47Jones, M. G., Pringle, J. E., & Alexander, R. D. 2012, MNRAS, 419, 925Kausch, W., Noll, S., Smette, A., et al. 2015, A&A, 576, A78Kelly, B. C. 2007, ApJ, 665, 1489Kratter, K., & Lodato, G. 2016, ARA&A, 54, 271Lee, J., Song, I., & Murphy, S. 2020, MNRAS, 494, 62Lodato, G., Scardoni, C. E., Manara, C. F. et al. 2017, MNRAS, 472, 4700.Luhman, K. L., Stauffer, J. R., Muench, A. A., et al. 2003, ApJ, 593, 1093Luhman, K. L., & Mamajek, E. E. 2012, ApJ, 758, 31Lynden-Bell, D., & Pringle, J. E. 1974, MNRAS, 168, 603Mamajek, E. E., Meyer, M. R., & Liebert, J. 2002, AJ, 124, 1670Manara, C. F., Testi, L., Rigliaco, E., et al. 2013a, A&A, 551, A107Manara, C. F., Beccari, G., Da Rio, N., et al. 2013b, A&A, 558, A114Manara, C. F., Testi, L., Natta, A., et al. 2014, A&A, 568, A18Manara, C. F., Fedele, D., Herczeg, G. J. et al. 2016a, A&A, 585, A136.Manara, C. F., Rosotti, G., Testi, L. et al. 2016b, A&A, 591, L3Manara, C. F., Testi, L., Herczeg, G. J. et al. 2017a, A&A, 604, A127.Manara, C. F., Frasca, A., Alcalá, J. M., et al. 2017b, A&A, 605, A86Manara, C. F., Morbidelli, A., & Guillot, T. 2018, A&A, 618, L3Manara, C. F., Mordasini, C., Testi, L., et al. 2019, A&A, 631, L2Modigliani, A., Goldoni, P., Royer, F., et al. 2010, Proc. SPIE, 773728Morbidelli, A., & Raymond, S. N. 2016, Journal of Geophysical Research (Plan-
ets), 121, 1962Mulders, G. D., Pascucci, I., Manara, C. F., et al. 2017, ApJ, 847, 31Murphy, S. J., Mamajek, E. E., & Bell, C. P. M. 2018, MNRAS, 476, 3290Pascucci, I., Testi, L., Herczeg, G. J., et al. 2016, ApJ, 831, 125Pecaut, M. J., & Mamajek, E. E. 2016, MNRAS, 461, 794Rosotti, G. P., Clarke, C. J., Manara, C. F., & Facchini, S. 2017, MNRAS, 468,
1631Rosotti, G. P., & Clarke, C. J. 2018, MNRAS, 473, 5630Rosotti, G. P., Tazzari, M., Booth, R. A., et al. 2019, MNRAS, 486, 4829Rugel, M., Fedele, D., & Herczeg, G. 2018, A&A, 609, A70Sellek, A. D., Booth, R. A., & Clarke, C. J. 2020, MNRAS, 492, 1279Sicilia-Aguilar, A., Henning, T., & Hartmann, L. W. 2010, ApJ, 710, 597Siess, L., Dufour, E., & Forestini, M. 2000, A&A, 358, 593Smette, A., Sana, H., Noll, S., et al. 2015, A&A, 576, A77Soderblom, D. R., Hillenbrand, L. A., Jeffries, R. D., Mamajek, E. E., & Naylor,
T. 2014, Protostars and Planets VI, 219Somigliana, A., Toci, C., Lodato, G., et al. 2020, MNRAS, 492, 1120Testi, L., Birnstiel, T., Ricci, L., et al. 2014, Protostars and Planets VI, 339Venuti, L., Bouvier, J., Flaccomio, E., et al. 2014, A&A, 570, A82Venuti, L., Stelzer, B., Alcalá, J. M., et al. 2019, A&A, 632, A46Vernet, J., Dekker, H., D’Odorico, S., et al. 2011, A&A, 536, A105Winter, A. J., Clarke, C. J., Rosotti, G., et al. 2018, MNRAS, 478, 2700Wilkinson, S., Merín, B., & Riviere-Marichalar, P. 2018, A&A, 618, A12de Zeeuw, P. T., Hoogerwerf, R., de Bruijne, J. H. J., et al. 1999, AJ, 117, 354Zuckerman, B., Vican, L., & Rodriguez, D. R. 2014, ApJ, 788, 102
Article number, page 8 of 18

Manara et al.: X-Shooter survey of disk accretion in Upper Scorpius
Table 2. Stellar, disk, and accretion properties for the targets in the Upper Scorpius region
Name disk dist SpT Teff AV L? logLacc M? Macc Acc? Mdisk,dusttype [pc] [K] [mag] L� L� M� M�/yr M�
2MASSJ15534211-2049282 Full 136 ± 4 M4 3270 1.2 0.09 -2.6 0.24 3.66·10−10 Y 1.69·10−06
2MASSJ15583692-2257153 Full 166 ± 4 K0 5110 0.0 2.57 -0.5 1.63∗ 1.59·10−08 Y 1.51·10−04
2MASSJ16001844-2230114 Full 138 ± 9 M4.5 3200 0.8 0.08 -1.9 0.20 2.03·10−09 Y 2.31·10−06
2MASSJ16035767-2031055 Full 143 ± 1 K6 4205 0.7 0.48 -1.8 0.91 8.81·10−10 Y 2.74·10−06
2MASSJ16035793-1942108 Full 158 ± 2 M2 3560 0.3 0.13 -5.1 0.42 6.69·10−13 N 9.16·10−07
2MASSJ16041740-1942287 Full 161 ± 2 M3 3415 0.7 0.14 -4.3 0.31 6.04·10−12 N 7.26·10−07
2MASSJ16041893-2430392 ... 145 M2 3560 0.3 0.45 -3.1 0.37 1.48·10−10 Y ...2MASSJ16042165-2130284 Transitional 150 ± 1 K3 4730 1.4 0.90 -3.2 1.24 3.09·10−11 N 1.55·10−04
2MASSJ15354856-2958551_E Full (binary) 145 M4.5 3200 0.0 0.10 -2.8 0.20 3.53·10−10 Y 1.27·10−06
2MASSJ15354856-2958551_W ... (binary) 145 M4.5 3200 0.0 0.10 -2.9 0.20 2.73·10−10 Y 1.27·10−06
2MASSJ15514032-2146103 Evolved 142 ± 2 M4.5 3200 0.3 0.05 -3.5 0.19 5.01·10−11 Y 4.82·10−07
2MASSJ15530132-2114135 Full 146 ± 2 M4.5 3200 0.8 0.05 -3.0 0.19 1.52·10−10 Y 3.88·10−06
2MASSJ15582981-2310077 Full 147 ± 3 M4.5 3200 1.0 0.05 -2.3 0.19 7.16·10−10 Y 4.00·10−06
2MASSJ16014086-2258103 Full 145 M3 3415 1.2 0.12 -1.2 0.31 7.42·10−09 Y 2.28·10−06
2MASSJ16020757-2257467 Full 140 ± 1 M2 3560 0.4 0.08 -3.8 0.44 1.08·10−11 Y 3.25·10−06
2MASSJ16024152-2138245 Full 142 ± 2 M5.5 3060 0.6 0.03 -2.9 0.12 2.76·10−10 Y 6.46·10−06
2MASSJ16054540-2023088 Full 145 ± 2 M4.5 3200 0.6 0.10 -2.8 0.20 3.58·10−10 Y 5.05·10−06
2MASSJ16062196-1928445 Transitional 145 M1 3705 0.8 0.34 -1.3 0.46 6.13·10−09 Y 2.69·10−06
2MASSJ16063539-2516510 Evolved 139 ± 3 M4.5 3200 0.0 0.03 -5.1 0.18 8.62·10−13 N 1.03·10−06
2MASSJ16064385-1908056 Evolved 144 ± 7 K7 4060 0.4 0.29 -2.3 0.82 2.65·10−10 Y 5.48·10−07
2MASSJ16072625-2432079 Full 143 ± 2 M3 3415 0.7 0.18 -2.6 0.29 4.56·10−10 Y 8.39·10−06
2MASSJ16081566-2222199 Full 140 ± 2 M2 3560 0.5 0.15 -3.7 0.41 1.99·10−11 N 5.98·10−07
2MASSJ16082324-1930009 Full 138 ± 1 M0 3850 1.1 0.32 -2.0 0.61 7.90·10−10 Y 2.58·10−05
2MASSJ16082751-1949047 Evolved 145 M5.5 3060 0.6 0.06 -3.1 0.14 1.97·10−10 Y 5.01·10−07
2MASSJ16090002-1908368 Full 139 ± 3 M4.5 3200 0.3 0.05 -4.2 0.19 1.02·10−11 Y 1.05·10−06
2MASSJ16090075-1908526 Full 138 ± 1 M0 3850 1.0 0.32 -1.7 0.60 1.74·10−09 Y 2.81·10−05
2MASSJ16095361-1754474 Full 158 ± 5 M4.5 3200 0.5 0.04 -4.5 0.18 4.54·10−12 Y 6.78·10−07
2MASSJ16104636-1840598 Full 143 ± 3 M4.5 3200 1.2 0.04 -3.9 0.19 1.45·10−11 Y 1.14·10−06
2MASSJ16111330-2019029 Full 155 ± 1 M3.5 3340 0.6 0.03 -1.9 0.27 9.77·10−10 Y 3.69·10−06
2MASSJ16123916-1859284 Full 139 ± 2 M1 3705 0.6 0.22 -2.3 0.50 4.75·10−10 Y 3.65·10−06
2MASSJ16133650-2503473 Full 145 M3 3415 1.0 0.11 -1.6 0.32 2.93·10−09 Y 5.80·10−07
2MASSJ16135434-2320342 Full 145 M4.5 3200 0.3 0.12 -2.3 0.20 1.18·10−09 Y 4.97·10−06
2MASSJ16141107-2305362 Full 145 K4 4590 0.3 1.05 -1.4 1.25 2.09·10−09 Y 3.15·10−06
2MASSJ16143367-1900133 Full 142 ± 2 M3 3415 1.9 0.52 -2.7 0.29 5.17·10−10 Y 7.84·10−07
2MASSJ16154416-1921171 Full 132 ± 2 K7 4060 2.8 0.30 -0.3 0.81 2.44·10−08 Y 1.28·10−05
2MASSJ16181904-2028479 Evolved 138 ± 2 M5 3125 1.6 0.05 -3.4 0.16 8.05·10−11 Y 2.76·10−06
Notes. Disk type from Barenfeld et al. (2016); Luhman & Mamajek (2012); Carpenter et al. (2006). Stellar properties obtained using the Baraffe etal. (2015) evolutionary models, apart from the target 2MASSJ15583692-2257153, for which Siess et al. (2000) models were used since the stellarmass was higher than the maximum one modeled by Baraffe et al. (2015). Disk masses are updated from Barenfeld et al. (2016) using the distanceinferred from the Gaia DR2 (Gaia Collaboration et al. 2018) parallaxes. When no uncertainties on the distance is reported, the mean distance tothe targets of 145 pc was adopted. Possible non-accretors are reported with "N" in the Acc? column. The values reported here for the accretionrate of non-accretors are considered in this work as upper limits.
Appendix A: Log of the observations
The observations were carried out in two different observing pro-grams. Eight targets were observed in the Service Mode programPr.Id. 097.C-0378 (PI Manara) in the period from July to August2016. Typically, these observations were carried out with imagequality in the VIS arm of ∼1′′ (see Table A.1). The standard starobserved at the beginning of the night as part of the standard ca-libration plan for X-Shooter was used for the flux calibration ofthe spectra.
The remaining 28 targets discussed here were observed dur-ing the Visitor Mode program Pr.Id. 0101.C-0866 (PI Manara)carried out during the nights of May 19 and 20, 2018. Bothnights had very good seeing, typically <0.5′′, leading to imagequalities in the VIS arm better than 1′′ in all cases but two. Smallclouds (THN conditions) were present at the beginning of thenights, otherwise the nights were clear. We observed flux stan-
dard stars at the beginning and at the end of the night during thefirst night, and at the beginning, in the middle, and at the end ofthe night during the second night. The reduction led to consistentresults with all standard stars. For the reduction of the data ob-tained in the first night, we adopted the standard star observed atthe end of the night. For the data obtained in the first part of thesecond night we used the standard star observed in the middle ofthe night, while we used the one observed at the end of the nightfor the spectra obtained in the second half of the night, startingfrom and including 2MASS J16072625-2432079.
Appendix A.1: Resolved binaries
During the visitor mode observations, we resolved two close-by stars: 2MASS J15354856-2958551 and 2MASS J16054540-2023088. The former system is composed of two stars at about
Article number, page 9 of 18

A&A proofs: manuscript no. usco_survey_lang_edited
Table A.1. Night log of the observations
2MASS Date of observation [UT] Exp. Time Slit width [′′] I.Q.[Nexp x (s)] UVB VIS NIR [′′]
J15534211-2049282 2016-07-24T04:02:25.209 4x450 1.0 0.4 0.4 1.07J15583692-2257153 2016-07-25T03:37:53.376 4x120 0.5 0.4 0.4 1.15J16001844-2230114 2016-08-09T01:56:46.720 4x450 1.0 0.4 0.4 0.91J16035767-2031055 2016-08-18T02:04:50.750 4x150 0.5 0.4 0.4 1.03J16035793-1942108 2016-08-09T00:06:57.436 4x450 1.0 0.4 0.4 0.72J16041740-1942287 2016-08-07T23:57:24.090 4x450 1.0 0.4 0.4 1.02J16041893-2430392 2016-08-26T02:20:38.193 4x150 0.5 0.4 0.4 1.02J16042165-2130284 2016-08-18T02:43:53.101 4x150 0.5 0.4 0.4 0.9J15354856-2958551_E 2018-05-19T23:39:04.373 4x300 1.0 0.4 0.4 0.42J15354856-2958551_W 2018-05-19T23:39:04.373 4x300 1.0 0.4 0.4 0.42J15514032-2146103 2018-05-21T02:38:56.215 4x675 1.0 0.9 0.9 0.75J15530132-2114135 2018-05-20T02:06:26.327 4x675 1.0 0.9 0.9 0.9J15582981-2310077 2018-05-20T03:07:24.550 4x630 1.0 0.9 0.9 0.86J16014086-2258103 2018-05-20T08:38:14.117 4x150 1.0 0.4 0.4 0.97J16020757-2257467 2018-05-20T00:39:53.156 4x195 1.0 0.4 0.4 0.93J16024152-2138245 2018-05-21T05:22:25.139 4x675 1.0 0.9 0.9 0.77J16054540-2023088 2018-05-20T08:04:28.437 4x300 1.0 0.4 0.4 1.03J16062196-1928445 2018-05-20T00:15:54.949 4x120 0.5 0.4 0.4 0.9J16063539-2516510 2018-05-20T07:10:36.261 4x525 1.0 0.9 0.9 0.73J16064385-1908056 2018-05-21T00:37:34.606 4x120 1.0 0.4 0.4 0.84J16072625-2432079 2018-05-21T06:51:13.403 4x225 1.0 0.4 0.4 0.64J16081566-2222199 2018-05-21T01:11:07.195 4x195 1.0 0.4 0.4 0.96J16082324-1930009 2018-05-21T07:19:48.545 4x120 1.0 0.4 0.4 0.7J16082751-1949047 2018-05-21T01:39:00.144 4x450 1.0 0.4 0.4 1.J16090002-1908368 2018-05-21T03:39:56.012 4x600 1.0 0.9 0.9 0.7J16090075-1908526 2018-05-20T09:34:05.964 4x75 1.0 0.4 0.4 0.9J16095361-1754474 2018-05-20T05:17:57.934 4x600 1.0 0.9 0.9 0.46J16104636-1840598 2018-05-20T06:14:36.404 4x600 1.0 0.9 0.9 0.74J16111330-2019029 2018-05-20T01:07:08.211 4x195 1.0 0.4 0.4 0.99J16123916-1859284 2018-05-20T01:34:34.877 4x120 1.0 0.4 0.4 1.09J16133650-2503473 2018-05-21T06:22:13.098 4x225 1.0 0.4 0.4 0.63J16135434-2320342 2018-05-20T09:02:41.397 4x150 1.0 0.4 0.4 0.9J16141107-2305362 2018-05-21T00:21:01.107 4x140 0.5 0.4 0.4 1.38J16143367-1900133 2018-05-21T04:45:56.354 4x300 1.0 0.4 0.4 0.62J16154416-1921171 2018-05-21T07:41:25.241 4x120 1.0 0.4 0.4 0.71J16181904-2028479 2018-05-20T04:17:13.271 4x675 1.0 0.9 0.9 0.82
Notes. Typical resolutions in the UVB arm are R ∼9700 for 0.5′′ wide slits, R ∼5400 for 1.0′′ wide slits; in the VIS arm R ∼18400 for 0.4′′ wideslits, R ∼8900 for 0.9′′ slits; in the NIR arm R ∼11600 for 0.4′′ wide slits, and R ∼5600 for 0.9′′ wide slits. I.Q. is the airmass corrected seeing.
∼1′′ distance from each other in the west-east direction. Theywere observed by orienting the slit at position angle −105.27◦,while the parallactic angle was −104.85◦. The latter system iscomposed of two objects at 2.14′′ distance, and they were bothincluded in the slit oriented at position angle 54.4◦. The twotraces are resolved in both observations when using the narrowslits, while only for 2MASS J16054540-2023088 when usingthe wide slit. We manually extracted the two spectra from thepipeline reduced 2D spectra using IRAF1.
In the case of 2MASS J15354856-2958551, both spectra arethose of a young stellar object, showing clear Lithium absorptionlines and strong emission lines. We flux-calibrated the narrowslit spectra calculating the ratio between the combined ones inthe large slit exposure and the sum of the separated spectra inthe narrow slit exposure.
On the other hand, in the case of J16054540-2023088, onespectrum is the one of a young stellar object, while the other oneis an early-type background object. Indeed, the latter becomes
1 IRAF is distributed by the National Optical Astronomy Observatory,which is operated by the Association of Universities for Research inAstronomy (AURA) under a cooperative agreement with the NationalScience Foundation.
fainter in the optical and near-infrared than the YSO. The loca-tion of the YSO is at the correct 2MASS coordinates. We thusflux calibrate the YSO spectrum taken with the narrow slit usingthe one with the wide slit for this object alone.
Appendix B: Information from Gaia
We searched for the Gaia (Gaia Collaboration et al. 2016) coun-terpart for our targets in the Gaia DR2 catalog (Gaia Collabo-ration et al. 2018). Only six of our targets have no astrometricsolutions, and in one case no matching with Gaia is found. Inanother case, the parallax is negative and the proper motion verydifferent with respect to other objects in our sample (2MASSJ16141107-2305362). In two cases, the matching is with sepa-ration >0.7′′: one is for a component of the binary system, butin this case there is no astrometric solution, in the other case itis for 2MASS J16014086-2258103, and we do not consider theparallax value reliable.
We checked whether any of the targets shared similar as-trometric parameters (proper motion, parallax, coordinates) withyoung stars in the ρ-Ophiucus region. While the proper motionsare similar, the spatial location is different, and we consider all
Article number, page 10 of 18

Manara et al.: X-Shooter survey of disk accretion in Upper Scorpius
our targets bona-fide members of the Upper Scorpius associa-tion.
The distances to individual targets are reported in Table 2 andare obtained by inverting the parallaxes. When no Gaia parallaxis available we assumed d=145 pc.
Appendix C: Additional plots
Appendix C.1: Best fit of the Balmer continuum emission
In the following, we show the best fit of the Balmer continuumemission for the targets analyzed here.
Appendix C.2: Accretion luminosity vs stellar luminosity
We show the relation between the accretion and stellar lumino-sity for the targets analyzed here and those in the star-formingregions of Lupus and Chamaeleon I (Fig. C.7).
Article number, page 11 of 18

A&A proofs: manuscript no. usco_survey_lang_edited
Fig. C.1. Best fit of the continuum emission of the spectrum of the targets is shown in blue together with the dereddened spectrum of the target(red). The best fit is obtained by adding the best fit photospheric template (green) and the slab model (cyan).
Article number, page 12 of 18

Manara et al.: X-Shooter survey of disk accretion in Upper Scorpius
Fig. C.2. Best fit of the continuum emission of the spectrum of the targets shown in blue together with the dereddened spectrum of the target (red).The best fit is obtained by adding the best fit photospheric template (green) and the slab model (cyan).
Article number, page 13 of 18

A&A proofs: manuscript no. usco_survey_lang_edited
Fig. C.3. Best fit of the continuum emission of the spectrum of the targets is shown in blue together with the dereddened spectrum of the target(red). The best fit is obtained by adding the best fit photospheric template (green) and the slab model (cyan).
Article number, page 14 of 18
Manara et al.: X-Shooter survey of disk accretion in Upper Scorpius
Fig. C.4. Best fit of the continuum emission of the spectrum of the targets is shown in blue together with the dereddened spectrum of the target(red). The best fit is obtained by adding the best fit photospheric template (green) and the slab model (cyan).
Article number, page 15 of 18

A&A proofs: manuscript no. usco_survey_lang_edited
Fig. C.5. Best fit of the continuum emission of the spectrum of the targets is shown in blue together with the dereddened spectrum of the target(red). The best fit is obtained by adding the best fit photospheric template (green) and the slab model (cyan).
Article number, page 16 of 18

Manara et al.: X-Shooter survey of disk accretion in Upper Scorpius
Fig. C.6. Best fit of the continuum emission of the spectrum of the targets is shown in blue together with the dereddened spectrum of the target(red). The best fit is obtained by adding the best fit photospheric template (green) and the slab model (cyan).
Article number, page 17 of 18

A&A proofs: manuscript no. usco_survey_lang_edited
3 2 1 0 1logL [L ]
4
2
0
logL
acc [
L]
Lacc=L
Lacc=0.1× L
Lacc=0.01× L
UScoUSco - lowacc
3 2 1 0 1logL [L ]
4
2
0
logL
acc [
L]
Lacc=L
Lacc=0.1× L
Lacc=0.01× L
LupusChaIUSco
Fig. C.7. Accretion luminosity vs stellar luminosity for the targets in theUpper Scorpius star-forming region (upper panel), and for the targets inthe Upper Scorpius, Lupus, and Chamaeleon I regions (bottom panel).
Article number, page 18 of 18