x-trace: a pervasive network tracing framework
TRANSCRIPT

X-Trace: A Pervasive Network Tracing FrameworkRodrigo Fonseca George Porter Randy H. Katz Scott Shenker Ion Stoica
Computer Science DivisionUniv. of California, BerkeleyBerkeley, Calif. 94720-1776
{rfonseca,gporter,katz,shenker,istoica}@cs.berkeley.eduhttp://xtrace.cs.berkeley.edu
AbstractModern Internet systems often combine different ap-
plications (e.g., DNS, web, and database), span differ-ent administrative domains, and function in the contextof network mechanisms like tunnels, VPNs, NATs, andoverlays. Diagnosing these complex systems is a daunt-ing challenge. Although many diagnostic tools exist, theyare typically designed for a specific layer (e.g., tracer-oute) or application, and there is currently no tool forreconstructing a comprehensive view of service behav-ior. In this paper we propose X-Trace, a tracing frame-work that provides such a comprehensive view for sys-tems that adopt it. We have implemented X-Trace in sev-eral protocols and software systems, and we discuss howit works in three deployed scenarios: DNS resolution,a three-tiered photo-hosting website, and a service ac-cessed through an overlay network.
1 IntroductionInternet services are built out of distributed components(e.g., load balancer, web server, backend database), makeuse of sophisticated network mechanisms (e.g., VPNs,NATs, overlays, tunnels), and can span multiple admin-istrative domains (e.g., the client’s web proxy and theserver’s load balancer). When these complex systemsmisbehave, it is often quite difficult to diagnose thesource of the problem.
As an example, consider the infrastructure servingWikipedia [27]. As of June 2006, they had servers spreadacross 3 sites, comprising 33 web caches chosen viaDNS round-robin assignments, 4 load balancers, 105web servers, and 14 database servers. A user’s requesttransits a cache server, and may also transit a load bal-ancer, a web server, and a database. Caching is done ateach of these levels. Now suppose a user updates a pageon Wikipedia, and fails to see her updates upon reloadingthe page. It is difficult to identify which cache, at whichlevel, is returning stale data. Even if logs are kept, thereis no common mechanism to determine which logs to ex-amine, or to correlate entries across multiple logs. It mayalso not be possible for administrators to reproduce the
problem, since their requests would most likely take adifferent path through the system.
Diagnostic tools do exist, but many of them are lim-ited to a particular protocol. For instance, tracerouteis useful for locating IP connectivity problems, but can’treveal proxy or DNS failures. Similarly, there are numer-ous alarm and monitoring suites for HTTP, but they can-not diagnose routing problems. While these tools are un-doubtedly useful, they are also typically unable to diag-nose subtle interactions between protocols or provide acomprehensive view of the system’s behavior.
To this end, we have developed an integrated tracingframework called X-Trace. A user or operator invokesX-Trace when initiating an application task (e.g., a webrequest), by inserting X-Trace metadata with a task iden-tifier in the resulting request. This metadata is then prop-agated down to lower layers through protocol interfaces(which may need to be modified to carry X-Trace meta-data), and also along all recursive requests that resultfrom the original task. This is what makes X-Trace com-prehensive; it tags all network operations resulting froma particular task with the same task identifier. We call theset of network operations connected with an initial taskthe resulting task tree.
Constructing the task tree requires understanding thecausal paths in network protocols. While in general thismay be difficult, in most of the situations we have consid-ered so far this is relatively straightforward: for example,a recursive DNS query is clearly causally linked to theincoming request. X-Trace requires that network proto-cols be modified to propagate the X-Trace metadata intoall actions causally related to the original task. This in-volves both understanding calls to lower-level protocols(e.g., HTTP invoking TCP) and initiating forwarded orrecursive requests.
X-Trace-enabled devices log the relevant informationconnected with each tagged network operation, whichcan then be reported back. The trace information associ-ated with a task tree gives the user or operator a compre-hensive view of what network operations were executedas part of a task. To illustrate, Figure 1 shows an exam-ple of the task tree involved in a simple HTTP request
NSDI ’07: 4th USENIX Symposium on Networked Systems Design & ImplementationUSENIX Association 271

IPIP
Router
IP
RouterIP
TCP 1
Start
TCP 1
End
IPIP
RouterIP
TCP 2
Start
TCP 2
End
HTTP
Client
HTTP
Proxy
HTTP
Server
Figure 1: A proxied HTTP request and the logical causalrelations among network elements visited.
through a proxy, showing the causal relations betweenoperations in the HTTP, TCP, and IP layers. X-Trace tasktrees are runtime traces of a task execution, and so longas individual components are integrated into the frame-work, there is no need for prior configuration of their de-pendencies.
Diagnosing problems often requires tracing a taskacross different administrative domains (which we willcall ADs). ADs may not wish to reveal internal informa-tion to each other, or to end users. Accordingly, X-Traceincorporates a clean separation between the client (useror operator) that invokes X-Trace, and the recipient ofthe trace information. For instance, when an end user no-tices a problem and invokes X-Trace, the trace informa-tion from her home network is delivered to her locally,the trace information from her ISP is delivered to the ISPsupport center, and the trace information from the website she was accessing is sent to the web site operator.Each of these parties can then deal with the informationas they see fit; sharing it with others, keeping it private, oreven not collecting it at all. The fact that X-Trace givesthem a common identifier for the task enables them tocooperate effectively if they so choose.
Realistically, we know all layers in the stack and dif-ferent ADs will not deploy X-Trace-enabled protocolsand devices simultaneously. However, individual proto-cols, applications, or ADs can benefit immediately fromX-Trace if they support it. If a particular protocol orapplication gets instrumented alone, one gets horizontalslices of the task tree, which are useful for developers andusers. If an AD alone deploys it on multiple layers withinits network, it gets to internally visualize the portion ofthe task tree that happened inside of its domain. In ad-dition, there is a “network effect” for adoption: as moreprotocols and networks integrate into the framework, X-Trace offers a common framework for their sharing ofthis information, increasing the value for all parties.
There has been much prior work on the study of appli-cation behavior, network monitoring, and request track-ing. We discuss this related work in detail in Section7 and only note here that the main differentiating as-pect of X-Trace is its focus on tracing multiple applica-tions, at different network layers, and across administra-tive boundaries. Section 4 highlights these features in thecontext of three specific examples. However, X-Trace is
applicable to a wide variety of other protocols, such asSIP, RPC, and email.
While we feel that X-Trace provides a valuable ser-vice, it certainly has significant limitations. They are dis-cussed in detail in Section 6, but we note them brieflyhere. First, implementing X-Trace requires modificationsto clients, servers, and network devices; protocols thatcan’t already do so must be altered to carry X-Tracemetadata, and their implementations must log the rele-vant trace information. While these changes are concep-tually simple, in practice retrofitting X-Trace into exist-ing applications is a process of varying difficulty; ourexperiences in this regard ranged from trivial to quitechallenging. Second, when X-Trace is only partially de-ployed, the ability to trace those parts of the networkis impaired, sometimes entirely. Third, lost trace reportscan limit reconstruction of the request tree and can leadto false positives in diagnosing faults (i.e., the lack oftrace data may be interpreted as a failure). Fourth, ourenforcing a tree structure on the set of network oper-ations related to a particular task means that there aresome request topologies that we cannot capture. For ex-ample, X-Trace is not able to naturally capture requeststhat rendezvous at a node where they are merged into asingle request. It isn’t clear, for instance, what should beconsidered causally-related in a routing protocol.
Because X-Trace only records paths that were taken, itis not a tool to assert global invariants about all possiblepaths. There are many problems for which X-Trace willnot determine the cause, but will rather show the effect.While not an introspective debugger, it will point out thecomponents involved in the operation, guiding the use ofother tools to verify the cause. Examples of these casesare state corruptions that would cause a router to mis-route packets, or an overloaded CPU that would cause amessage to be dropped.
The rest of the paper is structured as follows. In Sec-tion 2, we describe the model and architecture of X-Trace. In Section 3, we describe our implementation ofthe X-Trace architecture. Section 4 describes three de-ployments of X-Trace and pinpoint six network errorconditions. Section 5 discusses other uses of the sys-tem. In Section 6, we discuss the limitations of and se-curity considerations raised by X-Trace. In Section 7, wediscuss at length how X-Trace relates to previous work.Lastly, we conclude in Section 8.
2 Design Principles and Architecture
2.1 Design Principles
A key function of X-Trace is to reconstruct the task treeof all sub-operations making up the task. We now con-sider three principles that guided our design:
NSDI ’07: 4th USENIX Symposium on Networked Systems Design & Implementation USENIX Association272

IP EndpointIP
RouterIP Endpoint
TCP 1Start
TCP 1End
HTTP
Client…
A- -ID:1
X-Trace Metadata
TCP 2
Start
IP Packet
ZYID:1
X-Trace Metadata …
… BAID:1
X-Trace Metadata
TaskID
ParentID
OpID
EdgeType
pushNext() pushNext()
pushNext()
pushDown()
pushDown()
pushDown()
IP Packet
YXID:1
X-Trace MetadataXMID:1
X-Trace Metadata
MAID:1
X-Trace Metadata
HTTP GET
BAID:1
X-Trace Metadata
TCP Control Frame
NMID:1
X-Trace MetadataQCID:1
X-Trace Metadata
HTTP GET
CBID:1
X-Trace Metadata
Legend:HTTP
Proxy
pushNext()
pushNext()
Causal Relation
X-Trace propagation
Figure 2: Propagation of X-Trace metadata in the example in Figure 1. Causal edges in the task tree are captured bythe ParentID, OpID, and EdgeType fields. The TaskID remains the same for all the operations that comprise the task.
1. The trace request should be sent in-band, rather thanin a separate probe message.
The first principle highlights our desire to probe whathappens on the actual datapath we want to diagnose. Out-of-band probes might not end up following the same pathas the original datapath. It follows that we need to addmetadata to the same datapath that we want to trace. InX-Trace this metadata contains an identifier common toall operations in a task tree, which is added to messagesand propagated by devices along the entire path.
2. The collected trace data should be sent out-of-band,decoupled from the original datapath.
This principle relates to gathering of trace informa-tion. If we appended trace information to the metadataencoded in the datapath, then we might lose this infor-mation in the event of network failure. Also, this wouldincrease the overhead of messages. Obtaining trace dataduring periods of failure is especially important to thiswork. It follows that we need an out-of-band, orthogonalmechanism to record and collect trace data. Addition-ally, by decoupling trace reporting from the datapath, welessen the impact of X-Trace on the datapath’s latency.
3. The entity that requests tracing is decoupled fromthe entity that receives the trace reports.
As we discuss in §2.3 below, separating the user whoinserts the X-Trace metadata in the datapath from thedestination of the trace reports generated by componentsalong the path allows for flexible disclosure policies ofthe trace information for each AD. Each AD keeps con-trol of the information, while the common identifier al-lows them to cooperate in solving problems if necessary.
X-Trace places the minimal necessary mechanismwithin the network, while still providing enough infor-mation to reconstruct the path. The data itself is not
kept in the network path, but rather reported to specificplaces determined by ADs. The X-Trace metadata con-tains enough information for ADs to communicate traceinformation back to the user if it so chooses.
2.2 X-Trace Metadata
In the following section, we describe the format andstructure of the tracing metadata introduced by our sys-tem, as well as the way that metadata is propagatedthrough applications.
Format and structure X-Trace metadata is the infor-mation placed into each layer to support the X-Traceframework. It is inserted into a network task by the client,if it is X-Trace capable. For legacy clients, devices in thenetwork can add them. Network operators can insert X-Trace metadata for operations traversing their AD.
Within that metadata is a task identifier, whichuniquely identifies each network task. This identifiershould be unique among all of the reports accessed byan X-Trace user. X-Trace metadata is carried by the ex-tension, option, or annotation fields within each networkprotocol. Examples of such fields are IP options, TCPoptions, and HTTP headers. It is replicated across layers,ensuring that devices on the path can access it withouthaving to violate layering.
The metadata contains an optional field, TreeInfo, usedby nodes to record causal relations between operations.It consists of a three-tuple: (ParentID, OpID, EdgeType).ParentID and OpID encode edges in the task tree. TheEdgeType field indicates the type of that edge: either con-necting two adjacent nodes at the same layer, or betweena node at one layer with a node at a lower layer. The Par-entID and OpID fields should be unique with respect toone task identifier. We describe how network devices ma-nipulate these fields below. An optional destination field
NSDI ’07: 4th USENIX Symposium on Networked Systems Design & ImplementationUSENIX Association 273
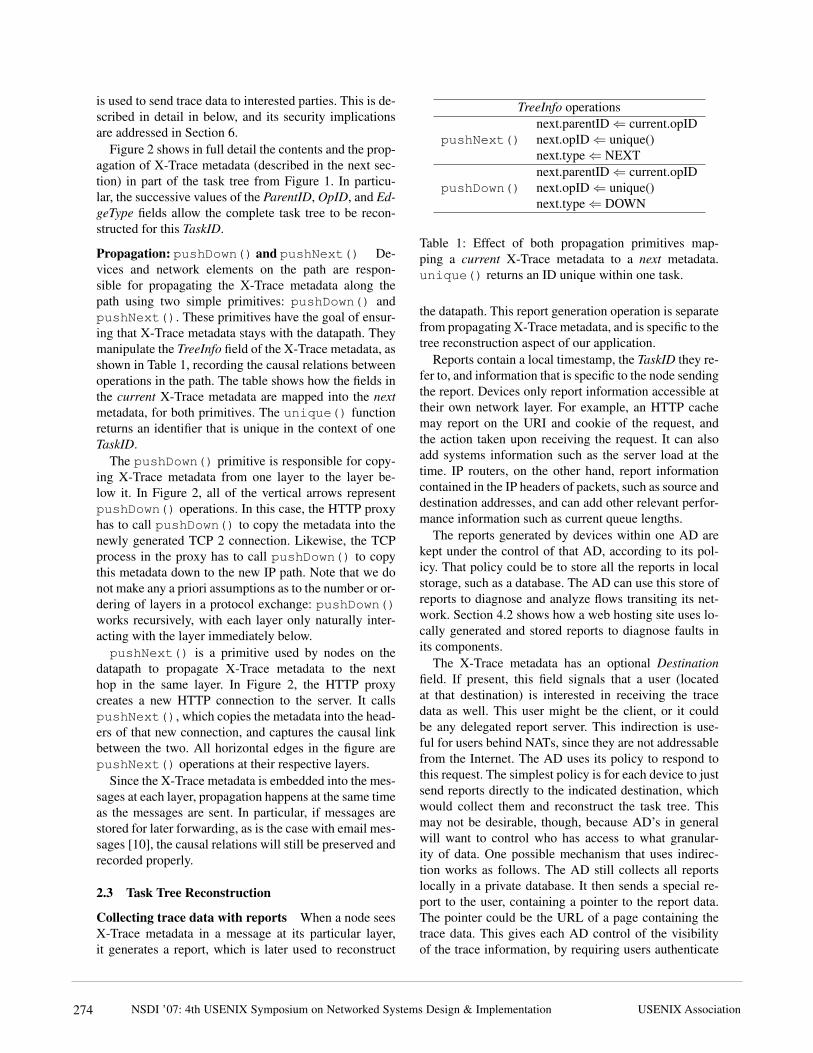
is used to send trace data to interested parties. This is de-scribed in detail in below, and its security implicationsare addressed in Section 6.
Figure 2 shows in full detail the contents and the prop-agation of X-Trace metadata (described in the next sec-tion) in part of the task tree from Figure 1. In particu-lar, the successive values of the ParentID, OpID, and Ed-geType fields allow the complete task tree to be recon-structed for this TaskID.
Propagation: pushDown() and pushNext() De-vices and network elements on the path are respon-sible for propagating the X-Trace metadata along thepath using two simple primitives: pushDown() andpushNext(). These primitives have the goal of ensur-ing that X-Trace metadata stays with the datapath. Theymanipulate the TreeInfo field of the X-Trace metadata, asshown in Table 1, recording the causal relations betweenoperations in the path. The table shows how the fields inthe current X-Trace metadata are mapped into the nextmetadata, for both primitives. The unique() functionreturns an identifier that is unique in the context of oneTaskID.
The pushDown() primitive is responsible for copy-ing X-Trace metadata from one layer to the layer be-low it. In Figure 2, all of the vertical arrows representpushDown() operations. In this case, the HTTP proxyhas to call pushDown() to copy the metadata into thenewly generated TCP 2 connection. Likewise, the TCPprocess in the proxy has to call pushDown() to copythis metadata down to the new IP path. Note that we donot make any a priori assumptions as to the number or or-dering of layers in a protocol exchange: pushDown()works recursively, with each layer only naturally inter-acting with the layer immediately below.pushNext() is a primitive used by nodes on the
datapath to propagate X-Trace metadata to the nexthop in the same layer. In Figure 2, the HTTP proxycreates a new HTTP connection to the server. It callspushNext(), which copies the metadata into the head-ers of that new connection, and captures the causal linkbetween the two. All horizontal edges in the figure arepushNext() operations at their respective layers.
Since the X-Trace metadata is embedded into the mes-sages at each layer, propagation happens at the same timeas the messages are sent. In particular, if messages arestored for later forwarding, as is the case with email mes-sages [10], the causal relations will still be preserved andrecorded properly.
2.3 Task Tree Reconstruction
Collecting trace data with reports When a node seesX-Trace metadata in a message at its particular layer,it generates a report, which is later used to reconstruct
TreeInfo operations
pushNext()next.parentID ⇐ current.opIDnext.opID ⇐ unique()next.type ⇐ NEXT
pushDown()next.parentID ⇐ current.opIDnext.opID ⇐ unique()next.type ⇐ DOWN
Table 1: Effect of both propagation primitives map-ping a current X-Trace metadata to a next metadata.unique() returns an ID unique within one task.
the datapath. This report generation operation is separatefrom propagating X-Trace metadata, and is specific to thetree reconstruction aspect of our application.
Reports contain a local timestamp, the TaskID they re-fer to, and information that is specific to the node sendingthe report. Devices only report information accessible attheir own network layer. For example, an HTTP cachemay report on the URI and cookie of the request, andthe action taken upon receiving the request. It can alsoadd systems information such as the server load at thetime. IP routers, on the other hand, report informationcontained in the IP headers of packets, such as source anddestination addresses, and can add other relevant perfor-mance information such as current queue lengths.
The reports generated by devices within one AD arekept under the control of that AD, according to its pol-icy. That policy could be to store all the reports in localstorage, such as a database. The AD can use this store ofreports to diagnose and analyze flows transiting its net-work. Section 4.2 shows how a web hosting site uses lo-cally generated and stored reports to diagnose faults inits components.
The X-Trace metadata has an optional Destinationfield. If present, this field signals that a user (locatedat that destination) is interested in receiving the tracedata as well. This user might be the client, or it couldbe any delegated report server. This indirection is use-ful for users behind NATs, since they are not addressablefrom the Internet. The AD uses its policy to respond tothis request. The simplest policy is for each device to justsend reports directly to the indicated destination, whichwould collect them and reconstruct the task tree. Thismay not be desirable, though, because AD’s in generalwill want to control who has access to what granular-ity of data. One possible mechanism that uses indirec-tion works as follows. The AD still collects all reportslocally in a private database. It then sends a special re-port to the user, containing a pointer to the report data.The pointer could be the URL of a page containing thetrace data. This gives each AD control of the visibilityof the trace information, by requiring users authenticate
NSDI ’07: 4th USENIX Symposium on Networked Systems Design & Implementation USENIX Association274

AD A
AD B
Local report
databaseData Traffic
Wide-area X-Trace Reports
Local X-Trace Reports
X-Trace Annotated Traffic
(report dest = R)
R: report server
S: sender
Local report
database
Figure 3: An example of wide-area reporting. The clientembeds X-Trace metadata with a message, setting the re-port destination to R. Different ISPs collect reports lo-cally, and send pointers to R so that the client can laterrequest the detailed reports.
themselves when they fetch the data. The AD can makeuse of this authentication information when choosing thelevel of detail of the report information returned to theuser. We describe this usage in more detail in Section 3.Note that all the information needed to get a report to auser is kept in the X-Trace metadata, meaning that nodesin the network do not need to keep any per-flow state toissue reports.
Figure 3 shows a sender S who sets the destinationfor reports as being the report server R. ADs A and Bsend pointer reports to R, and either the client or R itselffetches these reports later. A special case is when the userof X-Trace is in the same AD as the devices generatingreports, such as network operators performing internaltroubleshooting. X-Trace metadata gets added at the ADingress points. The network operators go directly to thelocal report databases, and there is no need to use thedestination field in the metadata.
Offline reconstruction of the task tree Task tree re-construction is an offline process performed by the userthat reconstructs the request path of the data connection.After the user collects reports from the reporting infras-tructure, they examine them to reconstitute the requesttree. Each of the reports is treated as a directed edge, ei-ther a “down” edge or a “next” edge, corresponding topushDown() and pushNext() operation. After re-constructing the tree, the client can examine the nodesand paths that the request took. For transitory errors, thistree serves as a permanent record of the conditions thatexisted at the time of the connection. Additionally, anyperformance data included by the devices in the reportscan be used to correlate failures in the datapath with de-vices that may be under-performing due to overload.
The reconstructed tree is the end product of the tracingprocess, and can be stored, associated with trouble ticketsystems, or used by operators as a record of individual
Flags
TaskI
D
Paren
tID
OpID
EdgeTyp
e
Type
Addre
ss
Optio
ns
TreeInfo Destination
Figure 4: The X-Trace metadata and its fields. Shadedfields are optional.
failure events for reliability engineering programs.
3 ImplementationIn this section we describe how we implemented the ar-chitecture described above. We discuss the representa-tion of the X-Trace metadata and its propagation, a lo-cal reporting infrastructure, and a prototype for inter-ADreporting, as well as a simple procedure to reconstruct atask tree from a series of reports. We present some micro-benchmarks, and close the section with a discussion ofissues that arise when integrating X-Trace into new andexisting protocols and applications.
3.1 Identifier format and semantics
Figure 4 shows the format with which we encode the X-Trace metadata. It consists of two required fields, andthree optional ones:
Flags: The flags field contains bits that specify whichof the three optional components of the X-Trace meta-data are present: TreeInfo, Destination, and Options.
TaskID: Our design supports 4, 8, 12, or 20 byte in-teger fields to represent the TaskID. The TaskID must beunique within 1) a window of time, and 2) a reporting do-main. The window of time must be long enough so thatno two tasks that overlap in time share the same ID.
TreeInfo: (Optional) The TreeInfo field holds threesubfields: ParentID, OpID, and EdgeType. ParentID andOpID are each 4 bytes long. These IDs must be uniquewithin the context of a single task ID. We implement theunique() function as a random number generator. TheEdgeType field is implemented as one byte, with onlytwo values currently encoded: NEXT and DOWN.
Destination: (Optional) X-Trace metadata can option-ally contain a destination, which is a network address thatX-Trace reports should be sent to, as described in Sec-tion 2.3. The Destination field consists of two portions,a type, and an address. Currently implemented types areshown in Table 2.
Options: (Optional) To accommodate future exten-sions to the X-Trace identifier format, we include an op-tions mechanism. The Options block, if present, consists
NSDI ’07: 4th USENIX Symposium on Networked Systems Design & ImplementationUSENIX Association 275

Type Protocol Destination
Explicit
UDP IPv4:portTCP IPv4:portI3 I3 idXMLRPC OpenDHT key
ImplicitLocal ConfiguredProxy Configured
Table 2: Types of X-Trace report destinations.
Application 1
libxtrreport XTR Report
Daemon
udp
tcp
i3
local
openDHT
Application 2
libxtrreport
xtrd proxy
Wide-area
X-Trace aware node
Neighbor XTR
Report Daemon
X-Trace ID embedded report destination
Administrator configured report destination
Figure 5: X-Trace reporting architecture.
of one or more individual options. Each consists of atype, a length, and then a variable length payload.
3.2 Reporting infrastructure
Report format A report is an ASCII message consist-ing of a header section followed by a body section. Thefirst line of the header identifies the layer issuing the re-port. The rest of the headers are specified as key-valuepairs, similar to headers in RFC 822 [10]. The body ofthe report is free-form, and the content is set by the de-vice issuing the report and other operator policy.
Reporting libraries and agents Included with X-Trace is libxtrreport, a reference implementationof a client library that can be linked into applications forissuing reports. This library is very thin, and simply re-lays reports to a locally running daemon process.
The report daemon (see Figure 5) uses a UDP socketto listen for reports from the libxtrreport library.A thread listens for these reports, and places them on aqueue. Another thread pulls reports off this queue, andsends them to the appropriate handler module. Thesemodules, which run in separate threads, can forward thereport to another report server, send it to a service likeOpenDHT [21], or send it to any of the other destina-tions listed in Table 2. For local destinations, we makeuse of a Postgres SQL database for report storage.
We also implemented a packet sniffing application thatcan send reports on behalf of services and applicationsthat cannot be modified to include libxtrreport.
This application snoops network traffic using thelibpcap library, sending reports for any protocols thatit supports. Currently, this application supports the IP andTCP protocols. Network switches can make use of portmirroring to mirror traffic to this agent.
Inter-AS reporting We implemented a special case ofInter-AS reporting in the web hosting scenario describedin Section 4.2. The front end webservers included twoHTTP headers in the response sent back to the client.The first contains a URL for collecting trace informa-tion about the request. The second is the X-Trace taskidentifier associated with the network operation. This isincluded to simplify handling at the client, as well as forenvironments in which the X-Trace metadata was addedby the frontend webservers. We wrote a Firefox exten-sion that reads these HTTP headers, and provides theuser with a visual indicator that the page they are vis-iting is “X-Trace enabled”, as well as a button they canclick to fetch the trace data from the provided URL.
3.3 Offline tree reconstruction
Our implementation of the task tree reconstruction isquite simple, and can serve as the foundation for other,more complex, visualizations. We initially start by build-ing a graph, G, consisting of the node represented bythe first report. For each additional report we receive,we look for its parent (given by its IDparent field) in thetree. If this new node’s edge type is NEXT, we attach thenode on the same level as the parent. If the node type isDOWN, we attach the node at the level below the parent.
3.4 Performance
We tested the performance of the metadata propagationand the reporting aspects of our reference implementa-tion of X-Trace. For the propagation, we measured the la-tency of pushNext(). This operation is blocking, andif implemented in a router, would have to be performedon a per-packet basis on the forwarding path.
We implemented pushNext() in the C language andtested it on a 64-bit Intel Pentium 4 CPU running at 3.2GHz. We applied pushNext() to 576-byte packets,and found the average time required to be 0.71µs. Takenin isolation, this processor could apply the operation toover 1.4 million packets per second. In fact, hardwareimplementations could be much faster.
To test the performance of the reporting infrastruc-ture, we used the Apache web benchmarking tool, ab,against two otherwise identical Apache websites: onewith reporting turned on and one without. The reportstore in this test was a separate Postgres database. Of the10,000 requests we issued to the site, none of the reportswere dropped by the reporting infrastructure. The regular
NSDI ’07: 4th USENIX Symposium on Networked Systems Design & Implementation USENIX Association276
server sustained 764 requests/sec, with a mean latency of1.309 ms. The X-Trace enabled server sustained 647 re-quests/sec, with mean latency of 1.544 ms, which showsa 15% decrease in total system throughput.
3.5 Providing Support for X-Trace
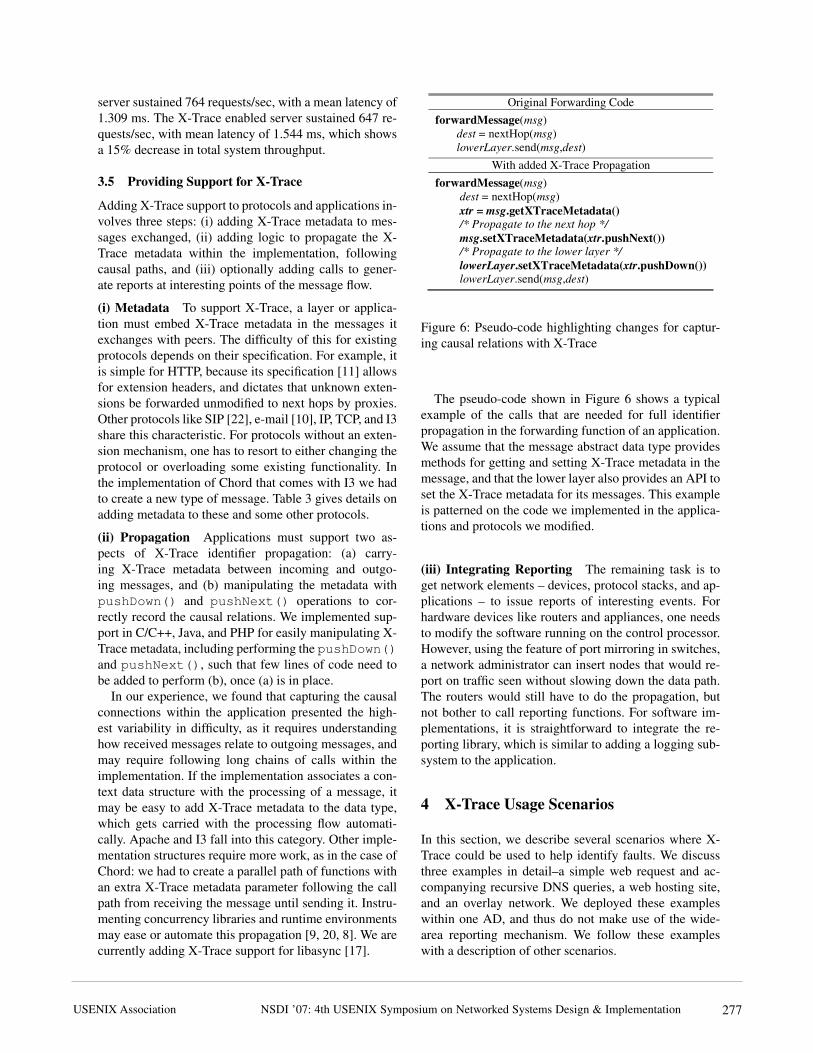
Adding X-Trace support to protocols and applications in-volves three steps: (i) adding X-Trace metadata to mes-sages exchanged, (ii) adding logic to propagate the X-Trace metadata within the implementation, followingcausal paths, and (iii) optionally adding calls to gener-ate reports at interesting points of the message flow.
(i) Metadata To support X-Trace, a layer or applica-tion must embed X-Trace metadata in the messages itexchanges with peers. The difficulty of this for existingprotocols depends on their specification. For example, itis simple for HTTP, because its specification [11] allowsfor extension headers, and dictates that unknown exten-sions be forwarded unmodified to next hops by proxies.Other protocols like SIP [22], e-mail [10], IP, TCP, and I3share this characteristic. For protocols without an exten-sion mechanism, one has to resort to either changing theprotocol or overloading some existing functionality. Inthe implementation of Chord that comes with I3 we hadto create a new type of message. Table 3 gives details onadding metadata to these and some other protocols.
(ii) Propagation Applications must support two as-pects of X-Trace identifier propagation: (a) carry-ing X-Trace metadata between incoming and outgo-ing messages, and (b) manipulating the metadata withpushDown() and pushNext() operations to cor-rectly record the causal relations. We implemented sup-port in C/C++, Java, and PHP for easily manipulating X-Trace metadata, including performing the pushDown()and pushNext(), such that few lines of code need tobe added to perform (b), once (a) is in place.
In our experience, we found that capturing the causalconnections within the application presented the high-est variability in difficulty, as it requires understandinghow received messages relate to outgoing messages, andmay require following long chains of calls within theimplementation. If the implementation associates a con-text data structure with the processing of a message, itmay be easy to add X-Trace metadata to the data type,which gets carried with the processing flow automati-cally. Apache and I3 fall into this category. Other imple-mentation structures require more work, as in the case ofChord: we had to create a parallel path of functions withan extra X-Trace metadata parameter following the callpath from receiving the message until sending it. Instru-menting concurrency libraries and runtime environmentsmay ease or automate this propagation [9, 20, 8]. We arecurrently adding X-Trace support for libasync [17].
Original Forwarding Code
forwardMessage(msg)
dest = nextHop(msg)
lowerLayer.send(msg,dest)
With added X-Trace Propagation
forwardMessage(msg)
dest = nextHop(msg)
xtr = msg.getXTraceMetadata()/* Propagate to the next hop */
msg.setXTraceMetadata(xtr.pushNext())/* Propagate to the lower layer */
lowerLayer.setXTraceMetadata(xtr.pushDown())
lowerLayer.send(msg,dest)
Figure 6: Pseudo-code highlighting changes for captur-ing causal relations with X-Trace
The pseudo-code shown in Figure 6 shows a typicalexample of the calls that are needed for full identifierpropagation in the forwarding function of an application.We assume that the message abstract data type providesmethods for getting and setting X-Trace metadata in themessage, and that the lower layer also provides an API toset the X-Trace metadata for its messages. This exampleis patterned on the code we implemented in the applica-tions and protocols we modified.
(iii) Integrating Reporting The remaining task is toget network elements – devices, protocol stacks, and ap-plications – to issue reports of interesting events. Forhardware devices like routers and appliances, one needsto modify the software running on the control processor.However, using the feature of port mirroring in switches,a network administrator can insert nodes that would re-port on traffic seen without slowing down the data path.The routers would still have to do the propagation, butnot bother to call reporting functions. For software im-plementations, it is straightforward to integrate the re-porting library, which is similar to adding a logging sub-system to the application.
4 X-Trace Usage Scenarios
In this section, we describe several scenarios where X-Trace could be used to help identify faults. We discussthree examples in detail–a simple web request and ac-companying recursive DNS queries, a web hosting site,and an overlay network. We deployed these exampleswithin one AD, and thus do not make use of the wide-area reporting mechanism. We follow these exampleswith a description of other scenarios.
NSDI ’07: 4th USENIX Symposium on Networked Systems Design & ImplementationUSENIX Association 277

Table 3: Support for adding metadata to some protocols. We have implementations for the protocols in italics.Protocol Metadata CommentHTTP, SIP, Email Extension Header Out-of-the box support for propagation. The only change is for causal relations.IP IP Option Automatic propagation. Dropped by some ASs, wide-area support varies [12].TCP TCP Option One-hop protocol, no next hop propagation. Linux kernel changes are needed.I3 I3 Option Support for options, but had to add handling code.Chorda No support Mirrored augmented call path for new X-Trace data message.DNS EDNS0 OPT-RR The EDNS0 [26] extension to DNS allows metadata to be added to messages.SQL SQL Comment Possible to encode X-Trace metatada within a SQL comment.UDP, Ethernet No support Must change protocol or use shim layer.
aThe Chord implementation bundled with the I3 distribution.
Browser
10.0.62.14343
00000000.C4C28B4F.next
URL: www.cs.berkeley.xtrace
/index.html
Browser
10.0.62.143
C4C28B4F.E8269F38.down
Lookup: www.cs.berkeley.xtrace
DNS Authoritative
10.0.62.223
8CFECDB5.A6BE651A.next
Delegate: xtrace.
Browser
10.0.62.143
C4C28B4F.00EDB8D3.down
HTTP-get: http://10.0.132.232
/index.html
DNS Recursor
10.0.62.222
E8269F38.8CFECDB5.next
Query: www.cs.berkeley.xtrace.
DNS Authoritative
10.0.62.224
8CFECDB5.0CD2FD05.next
Delegate: berkeley.xtrace.
DNS Authoritative
10.0.62.225
8CFECDB5.0481D249.next
Delegate:cs.berkeley.xtrace.
DNS Authoritative
10.0.62.226
8CFECDB5.F8655C76.next
Answer: 10.0.132.232
Apache
www.cs.berkeley.xtrace
00EDB8D3.B2852391.next
URL: /index.html
Figure 7: The complete HTTP and recursive DNS treerecovered by the X-Trace tool
4.1 Web request and recursive DNS queries
Overview The first scenario that we consider is thatof requesting a web page from a server. Figure 7 showsthe tree corresponding to a simple web request. The userstarts by typing a URL into her browser, in this casehttp://www.cs.berkeley.xtrace/index.html. The browser’shost first looks up the provided hostname using a nearbyDNS resolver, which returns the IP address of that host(10.0.132.232). If the resolver does not have the re-quested address in its cache, it will recursively contactother DNS servers until a match is found. It can then is-sue the HTTP request to the resolved IP address.
Tracing each of these “subtasks” is a challenge: HTTPrequests could be forwarded through proxies or caches,masking their ultimate destination. DNS requests are re-cursive in nature, are cached at intermediate servers, andspan different administrative domains. This can easilylead to misconfigurations and inconsistent views.
X-Trace support We added support for X-Trace tothe DNS protocol by using the EDNS0 [26] extensionmechanism. This backwards-compatible mechanism al-lows metadata to be associated with DNS messages, andis increasingly supported in the wide area. We modifieda DNS client library, an authoritative DNS server, as wellas a recursive DNS resolver to support X-Trace metadatapropagation and reporting.
We deployed this software in our local testbed, and
created a parallel top-level domain (.xtrace). Figure 7shows the final tree. In this example, the task hastwo subtasks, indicated by pushDown(): resolvingthe name, and fetching the page. A Java-based webbrowser issues the query to the DNS client library,which encapsulates the X-Trace metadata (after callingpushNext()) in an EDNS0 field of the query. Thisquery is forwarded to the resolver on 10.0.62.222, whichrecursively looks up the address in other, authoritativenameservers, after calling pushNext() at each stepof the recursion. Lastly, each of our authoritative name-servers issues reports when they receive queries with X-Trace/EDNS0 records in them. When the name resolu-tion is complete, the browser issues an X-Trace enabledHTTP query (after calling pushNext()).
Fault isolation An X-Trace enabled DNS might un-cover several faults that are difficult to diagnose today.At each step of the recursive resolution described above,servers cache entries to reduce load on the top-levelservers. A misconfigured or buggy nameserver mightcache these entries longer than it should. If a server’sIP address changes, these out-of-date servers might re-turn erroneous results. A trace like that in Figure 7 wouldpinpoint the server responsible for the faulty data.
Faults could occur in the HTTP portion of the task aswell. We describe the application of X-Trace to web traf-fic in the following section.
4.2 A web hosting site
Overview The second scenario that we consider is aweb hosting service that allows users to post and sharephotographs. We deployed an open-source photo appli-cation in our network on an IBM Bladecenter. The front-end webserver host Apache and PHP. The photos, meta-data, and comments are stored in a Postgres database.Also included are a cache and load-balancer. The photosite has attracted approximately 200 visitors a day for aperiod of two months.
For this site to support X-Trace, we implemented a re-porting module for Apache, and one for Postgres. To sup-port legacy web clients, we implemented an “X-Traceheaders” module that inserted X-Trace headers into re-
NSDI ’07: 4th USENIX Symposium on Networked Systems Design & Implementation USENIX Association278

quests from the legacy clients.X-Trace can be invoked by either end users or by the
operator. End users can invoke X-Trace in two ways: byusing an X-Trace-enabled web browser, or an X-Trace-equipped web page. We implemented an X-Trace toolbarfor the Firefox web browser that puts X-Trace metadatain requests. We also implemented a Javascript/PHP li-brary that added a feature to selected webpages in thesite that let the user report problems via an HTML form.These reports were internally coupled with the X-Tracemetadata of the user’s request, enabling the network op-erator to match their complaint with a trace of their ses-sion. This is a powerful mechanism to detect semanticfaults that would appear normal from the web site’s per-spective, such as stale pages or logic errors in a wellformed response. This is not necessary for all faults,since many requests might generate anomalous task treesthat can be analyzed with methods such as Pinpoint [9].
Tracing a request through the scenario The clientapplication (i.e., Firefox with our X-Trace extension) cre-ates a new X-Trace metadata and initializes its TreeInfofields. It issues an annotated request to the front-endcache. This cache issues a report based on fields in the re-quest and the X-Trace metadata. It calls pushNext()on the metadata, and forwards it on, possibly to othermiddleboxes such as load balancers that might also beon the path. When the Apache process on the front-endtier receives the request, it issues a report that includesthe URL, status code, and time of the request.
The PHP-based photo software creates SQL state-ments to retrieve images and metadata from the back-end database. We modified this code to retrieve the X-Trace metadata from the array of HTTP headers and callpushNext() on it. The new metadata is propagated tothe database by enclosing it in a SQL comment (i.e., /*X-Trace:023A2E... */). The query is sent to thedatabase, which looks for embedded X-Trace metadata.It calls xtr report()with the query as the payload ofthe report. When the webserver sends the response backto the client, it adds two headers to the response: one hasthe X-Trace metadata (in case it was generated by thewebserver), and the other has a URL that the client canaccess to examine the trace of the request.
If any additional requests are generated because of thatresponse (e.g., for images), the Firefox extension will usethe same TaskID. For clients that don’t support X-Trace,then each request (including images) will be consideredindependent.
Using X-Trace In this section we introduce severalfaults into the photo hosting site. These are based on first-hand experience that we had with our deployed system.
The first fault we consider is that of a malfunction-ing PHP script on the front-end web servers. From the
Apachextrace.cs.berkeley.edu
04E9E92A.C1B25697.next2006-09-26 13:23:42.801007
URL: /faults/query.php
Apacheweb1
C1B25697.72CBD74A.next2006-09-26 13:23:42.8085
URL: /faults/query.php
notifyProblem.cgi
C1B25697.72CBD74A.next2006-09-26 13:23:46.82021
<Problem Report>
Figure 8: A request fault, annotated with user input
Chord Ring
I3 Overlay Network
IP Network
Sender
Middlebox
Receiver
Figure 9: X-Trace on an I3 overlay scenario. A client anda server communicate over I3. Shown are the Chord net-work on top of which the I3 servers communicate, andthe underlying IP network.
user’s point of view, this could either be a fault in thePHP script, or a fault in the database. Examining Figure 8shows immediately that the fault is the former–there areno reports from the database, pinpointing the problem tothe PHP script. Figure 8 shows a square node that rep-resents a problem report issued by the user, using thePHP/Javascript web problem reporting tool. In additionto triggering an alarm for the operator, the report nodeindicates which page caused the problem, in this case,/faults/query.php, located on web1.
Next, based on the Wikipedia example, we imple-mented a web cache that inadvertently returns stale im-ages from its cache. Diagnosis in this case is simple. Therequest trace will include nodes up to and including thecache, but will not include the origin server.
The last fault we consider in this scenario is that ofa malfunctioning web load balancer, which sends trafficto a server that doesn’t contain the appropriate content.When users request pages from the site, they will some-times get the pages they wanted, while other times theywill get 404 File Not Found errors. In both cases,the load balancer issues a report with the request URL.Successful requests also include reports from the work-ing web server and backend database, while unsuccessfulrequests only include a report from the web server.
4.3 An overlay network
The third scenario we look at in some detail is an over-lay network. Overlay networks are routing infrastruc-tures that create communication paths by stitching to-
NSDI ’07: 4th USENIX Symposium on Networked Systems Design & ImplementationUSENIX Association 279
gether more than one end-to-end path on top of the un-derlying IP network. Overlays have been built to providemulticast [13], reliability [2], telephony [22], and datastorage [25] services. It is difficult to understand the be-havior and diagnose faults in these systems, as there areno tools or common frameworks to allow tracing of dataconnections through them.
In our example, we use the I3 overlay network [24].For our purposes, it suffices to say that I3 provides aclean way to implement service composition, by inter-posing middleboxes on the communication path. The im-plementation of I3 we used runs on top of the ChordDHT [25], which provides efficient routing to flat identi-fiers and is an overlay network on its own.
We added X-Trace metadata to the I3 and Chordprotocols, code to perform the pushNext() andpushDown() propagation operations, as well as callsto the X-Trace reporting library. The scenario topologyis shown in Figure 9, and consists, at the highest layer,of a very simple protocol involving a sender, a receiver,and a middlebox interposed in the path by the sender.We used a toy protocol we called SNP – Simple NumberProtocol – that is simply sending a number to the otherparty. The middlebox adds 10000 to any number it re-ceives and forwards the request on, but it could also be,say, an HTTP proxy or a video transcoder. SNP also car-ries X-Trace metadata in its header. Each segment of thepath in the SNP layer corresponds to a complete I3 path.Each I3 path, in turn, is formed by a combination of IPand Chord paths. Finally, each Chord path is formed bya combination of IP paths.
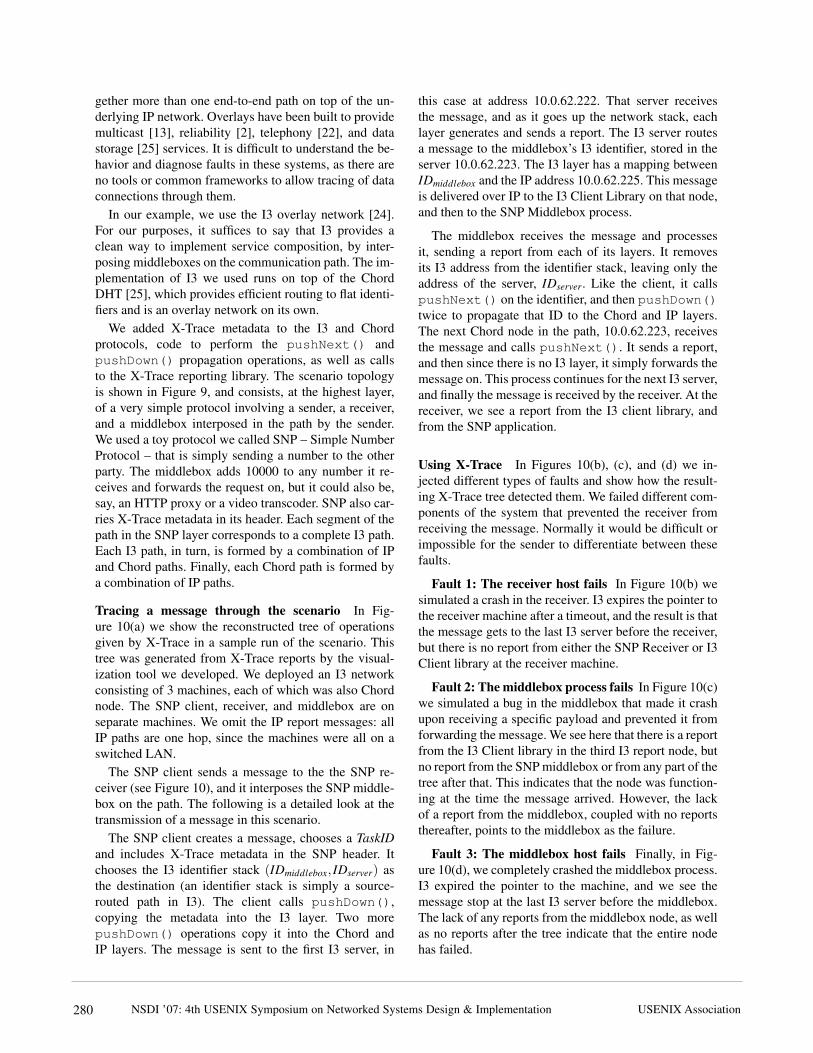
Tracing a message through the scenario In Fig-ure 10(a) we show the reconstructed tree of operationsgiven by X-Trace in a sample run of the scenario. Thistree was generated from X-Trace reports by the visual-ization tool we developed. We deployed an I3 networkconsisting of 3 machines, each of which was also Chordnode. The SNP client, receiver, and middlebox are onseparate machines. We omit the IP report messages: allIP paths are one hop, since the machines were all on aswitched LAN.
The SNP client sends a message to the the SNP re-ceiver (see Figure 10), and it interposes the SNP middle-box on the path. The following is a detailed look at thetransmission of a message in this scenario.
The SNP client creates a message, chooses a TaskIDand includes X-Trace metadata in the SNP header. Itchooses the I3 identifier stack (IDmiddlebox, IDserver) asthe destination (an identifier stack is simply a source-routed path in I3). The client calls pushDown(),copying the metadata into the I3 layer. Two morepushDown() operations copy it into the Chord andIP layers. The message is sent to the first I3 server, in
this case at address 10.0.62.222. That server receivesthe message, and as it goes up the network stack, eachlayer generates and sends a report. The I3 server routesa message to the middlebox’s I3 identifier, stored in theserver 10.0.62.223. The I3 layer has a mapping betweenIDmiddlebox and the IP address 10.0.62.225. This messageis delivered over IP to the I3 Client Library on that node,and then to the SNP Middlebox process.
The middlebox receives the message and processesit, sending a report from each of its layers. It removesits I3 address from the identifier stack, leaving only theaddress of the server, IDserver. Like the client, it callspushNext() on the identifier, and then pushDown()twice to propagate that ID to the Chord and IP layers.The next Chord node in the path, 10.0.62.223, receivesthe message and calls pushNext(). It sends a report,and then since there is no I3 layer, it simply forwards themessage on. This process continues for the next I3 server,and finally the message is received by the receiver. At thereceiver, we see a report from the I3 client library, andfrom the SNP application.
Using X-Trace In Figures 10(b), (c), and (d) we in-jected different types of faults and show how the result-ing X-Trace tree detected them. We failed different com-ponents of the system that prevented the receiver fromreceiving the message. Normally it would be difficult orimpossible for the sender to differentiate between thesefaults.
Fault 1: The receiver host fails In Figure 10(b) wesimulated a crash in the receiver. I3 expires the pointer tothe receiver machine after a timeout, and the result is thatthe message gets to the last I3 server before the receiver,but there is no report from either the SNP Receiver or I3Client library at the receiver machine.
Fault 2: The middlebox process fails In Figure 10(c)we simulated a bug in the middlebox that made it crashupon receiving a specific payload and prevented it fromforwarding the message. We see here that there is a reportfrom the I3 Client library in the third I3 report node, butno report from the SNP middlebox or from any part of thetree after that. This indicates that the node was function-ing at the time the message arrived. However, the lackof a report from the middlebox, coupled with no reportsthereafter, points to the middlebox as the failure.
Fault 3: The middlebox host fails Finally, in Fig-ure 10(d), we completely crashed the middlebox process.I3 expired the pointer to the machine, and we see themessage stop at the last I3 server before the middlebox.The lack of any reports from the middlebox node, as wellas no reports after the tree indicate that the entire nodehas failed.
NSDI ’07: 4th USENIX Symposium on Networked Systems Design & Implementation USENIX Association280

SNP Client
00000000.3CDD5536
.down
SNP Middlebox
3CDD5536.1BBCF8DD
.next
I3 Server
10.0.62.222
3CDD5536.9012FF3D
.down
SNP Receiver
1BBCF8DD.E78090F9
.next
I3 Server
10.0.62.222
1BBCF8DD.8B18C00D
.down
I3 Server
10.0.62.229
8B18C00D.29705F29
.next
I3 Client Lib
10.0.62.230
29705F29.0B709044
.next
Chord
10.0.62.222
9012FF3D.7F8FA730
.down
I3 Server
10.0.62.223
9012FF3D.23DB72B3
.next
Chord
10.0.62.223
7F8FA730.BEF6D392
.next
I3 Client Lib
10.0.62.225
23DB72B3.67230725
.next
Chord
10.0.62.229
7068868C.9BCD68AB
.next
Chord
10.0.62.223
F85AC7BF.7068868C
.next
Chord
10.0.62.222
8B18C00D.F85AC7BF
.down
(a) Tree for normal operation
SNP Client SNP Middlebox
I3 Server I3 Server I3 Server
Chord
I3 Server
Chord
I3 Client Lib
ChordChordChord
(b) Fault 1: The receiver host fails
SNP Client
I3 Server
Chord
I3 Server
Chord
I3 Client Lib
(c) Fault 2: Middlebox processcrash
SNP Client
I3 Server
Chord
I3 Server
Chord
(d) Fault 3: The mid-dlebox host fails
Figure 10: (a)X-Trace tree corresponding to the i3 example scenario with a sender, a receiver, and a sender-imposedmiddlebox. (b), (c) and (d) correspond respectively to faults: a receiver crash, a middlebox process crash, and a crashof the entire middlebox machine.
5 Additional X-Trace UsesHere we describe, in much briefer form, other scenarioswhere X-Trace could be used. This list isn’t meant to beexhaustive, merely illustrative.
Tunnels: IPv6 and VPNs A tunnel is a network mech-anism in which one data connection is sent in the payloadof another connection. Two common uses are IPv6 andVirtual Private Networks (VPNs). Typically, it is not pos-sible to trace a data path while it is in a tunnel. However,with X-Trace, the tunnel can be considered simply an ad-ditional layer. By calling pushDown(), the tunnel itselfwill contain the X-Trace identifier needed to send tracedata about the tunnel to the sender.
ISP Connectivity Troubleshooting For consumersconnecting to the Internet via an ISP, diagnosing connec-tivity problems can be quite challenging. ISP technicalsupport staff members have to spend time trying to de-termine the location of faults that prevent the user fromsuccessfully connecting. Complicating this process is themyriad of protocols necessary to bring the user online:DHCP, PPPoE, DNS, firewalls, NATs, and higher layerapplications such as E-mail and web caches.
By including X-Trace software in the client, as wellas X-Trace support in the equipment at the premises, theISP can determine the extent to which the user’s trafficentered the ISP. This can help quickly identify the loca-tion of the problem, and thus reduce support costs.
Link layer tracing An enterprise network might wantto trace the link layer, especially if there are highly lossylinks such as a wireless access network. The effect of
faults in these networks can have a profound effect onhigher layer protocols, especially TCP [5]. RetrofittingX-Trace into Ethernet is not possible, due to its lack ofextensibility. However, X-Trace metadata can easily bestored in a shim layer above Ethernet, but below otherprotocols. Since all of the hosts on a LAN make use ofthe same LAN protocol, it would be possible to deployX-Trace enabled network devices within one enterprisewithout requiring higher level changes.
Development Tracing tasks is needed at one point oranother in the development of distributed applicationsand protocols for debugging and verification. Like withstandard logging subsystems, developers can integrateX-Trace into their applications. It is actually being usedby the team developing DONA [16], a content-basedrouting scheme for the Internet.
6 DiscussionWhile X-Trace has many uses, it also has limitations. Wediscuss those here, as well as other interesting aspects.
Evaluation The examples and usage scenarios we im-plemented and described provide an indication of theusefulness of X-Trace in diagnosing and debugging dis-tributed systems. However, the ultimate measure of suc-cess for X-Trace is when it can measurably help usersand system administrators find problems faster than us-ing ordinary tools, or problems that they wouldn’t be ableto find otherwise. We are working on moving in this di-rection, but such an analysis was beyond our means forthis paper.
NSDI ’07: 4th USENIX Symposium on Networked Systems Design & ImplementationUSENIX Association 281

Report loss If the reporting infrastructure loses any re-ports, the effect to the graph will be the deletion of nodesand edges represented by that report. This might make itimpossible to reconstruct the causal connections. In thesecases, the reports sharing a common task identifier couldbe ordered temporally. Although not as descriptive, thislinear graph might still pinpoint certain faults.
Managing report traffic The structure and complex-ity of an application’s task trees have a strong bearing onthe amount of report traffic generated by X-Trace nodes.We mention three mechanisms that can limit the volumeof this traffic. Sampling can limit the number of requeststhat are tagged with X-Trace metadata to a rate speci-fied by policy. A low sampling rate is ideal for “always-on” tracing used to get a picture of the behavior of thenetwork. Differently from independent sampling at eachnode, using X-Trace, each “sample” is a complete tasktree. Since X-Trace reports are delivered out-of-band,they can be batched and compressed before transmission.Within our network we have observed a 10x compressionfactor for X-Trace generated reports. Finally, scoping canbe used to limit report generation to certain network lay-ers, devices, or parts of the network. Layers such as IPgenerate many reports per request, since reports are gen-erated on a per-packet basis. By limiting the scope ofreports to those layers above IP, a smaller volume of re-ports is generated. Of course, if a fault is suspected at thenetwork layer, the scope of reports could be widened toinclude IP packets of interest (say, from a client or subnetexperiencing the observed problem). Currently, supportfor scoping is statically configured into the reporting in-frastructure. Improving this support is considered futurework.
Non-tree request structures The X-Trace metadatadescribed in this work assumes that requests follow a treestructure. For the protocols and environments we con-sidered, this assumption generally holds. However, othertypes of requests may not be captured. Examples are quo-rum protocols, or a controller which sends jobs to manyworking nodes and waits for all to complete. We are cur-rently looking at extending the TreeInfo field to accom-modate this.
Partial deployment Thus far, our discussion has fo-cused on a comprehensive deployment of X-Tracethroughout the network. However, even when X-Traceis partially deployed within one particular application ornetwork layer, it still provides useful tracing benefits. Forexample, by integrating X-Trace into the I3 and Chordoverlay networks, users of those system can track themapping of I3 messages to Chord nodes. Alternatively,the developer of a middleware system could use X-Traceto follow requests from one node to another. In this spirit,researchers developing the DONA [16] project are mak-
ing use of X-Trace to aid in the development of their newrouting protocol.
Secondly, specific ADs can deploy X-Trace withintheir networks without requiring any cooperation or sup-port from other ADs. For example, a service providercould deploy X-Trace at strategic points within their dat-acenter. This provides the service provider with the tasktree within their network. We see the adoption of X-Tracefollowing this partial deployment strategy.
Security Considerations It is important to discuss thepotential for attacking the X-Trace infrastructure, as wellas using that infrastructure to attack others.
First, one could mount an attack against an infrastruc-ture that implements X-Trace by sending an inordinateamount of traffic with X-Trace metadata requesting re-ports. We argue that propagating metadata on its own isunlikely to become a bottleneck in this situation. Gener-ating reports, however, could become a significant sourceof load. A simple defense is for each device to rate-limitthe generation of reports. Still, malicious clients couldget more than their fair share of the reporting bandwidth.If this becomes a problem, and filtering specific sourcesof reports becomes an issue, providers might start requir-ing capabilities in the options part of X-Trace metadatato issue reports.
Another possible attack with the reporting infrastruc-ture is for a malicious user to send packets with X-Trace metadata, with the destination for reports set asanother user. In the worst case, many network devicesand hosts would send reports towards the attacked user.While this attack is possible, it will not have an exponen-tial growth effect on the attacker’s power, as legitimatereporting nodes will not place X-Trace metadata into X-Trace reports. Most important, however, is that we donot expect a large traffic of wide-area reports: as we de-scribe in Section 2.3, we expect ADs to generate veryfew wire-area reports with pointers to detailed, indepen-dent stores for local reports within each AD. Lastly, thisproblem is more prevalent when the destination for re-ports are IP addresses. Using wire-area destinations likeI3 or OpenDHT leverages these systems’ denial of ser-vice prevention features. X-Trace keeps control of reportgeneration rate and visibility with each report provider,which allows for defense mechanisms to be put in place.
7 Related WorkA number of tools focus on monitoring network sta-tus, aggregating data from many devices and layers. X-Trace differs from these tools in that it traces, across de-vices and layers, the actual paths taken by data messages,rather than trying to get snapshots of the network in-frastructure as a whole. One such tool is traceroute,which traces IP network paths. SNMP [7] is a protocol
NSDI ’07: 4th USENIX Symposium on Networked Systems Design & Implementation USENIX Association282

that lets operators inspect instrumentation data from net-work devices such as packet counts and error conditions.HP Openview is an example of an enterprise-wide net-work management tool that makes use of SNMP data.Openview can coordinate views at different granulari-ties, as well as coordinate network policy changes. CiscoSystems’ Netflows [18] also provides device instrumen-tation, although at a finer granularity than SNMP.
Splunk [23] is a commercial solution that collects andindexes all logs of an IT installation, allowing adminis-trators to interactively search these logs in a flexible way.With knowledge of common log formats it is usually pos-sible to follow tasks through the logs with hints such asIP addresses, user names, and timestamps. However, thisapproach is unlikely to work across organizations, and isnot guaranteed to have the relevant causal connections.Properly propagated X-Trace metadata added to logs cangreatly enhance the search power of such a tool.
Hussain et al. [14] present a system for performinghigh-speed network traces at a large scale. The purposeof their work is to collect the data, process it accord-ing to anonymization policies, and make it available formultiple users. That work focuses on traffic in the net-work, and not on capturing causal connections betweenrequests at different layers. Kompella et al. [15] presenta service for collecting “cross-layer information”. Thefocus of that work is on collecting control path state atdifferent layers. Using the information their system col-lects, one could identify how failures at one layer impactother layers. X-Trace differs from that work in that werequire widening the APIs at each layer, and focus on thedatapath, rather than the control path.
The Application Response Measurement (ARM) [3]project annotates transactional protocols in corporate en-terprises with identifiers. Devices in that system recordstart and end times for transactions, which can be rec-onciled offline. ARM targets the application layer, andits focus is to diagnose performance problems in nestedtransactions.
Pinpoint [9] detects faults in large, distributed sys-tems. The authors modified J2EE middleware to cap-ture the paths that component-based Java systems tookthrough that middleware. They can mine collections ofthese paths to infer which components are responsible forcausing faults. Our work focuses on recovering the tasktrees associated with multi-layer protocols, rather thanthe analysis of those recovered paths.
Aguilera et al., in [1], find anomalous behavior in dis-tributed systems by treating each component as a blackbox, and inferring the operation paths by only lookingat message traces. They present heuristics to recoverthe path given the timing relations among messages. Afollow-up work, Pip [20] is an infrastructure for com-paring actual and expected behavior of distributed sys-
tems by reasoning about paths through the application.They record paths by propagating path identifiers be-tween components, and can specify recognizers for pathsthat deal with system communication structure, timing,resource consumption. Pip is targeted at a single dis-tributed application, under the same AD, and does notcapture cross-layer correlations. X-Trace is complemen-tary to Pip in this sense. We believe that some of Pip’sanalysis can be performed on X-Trace’s task trees.
Magpie [6] is a toolchain that works with events gen-erated by operating system, middleware, and applicationinstrumentation, correlates them, and produces represen-tations of paths through a system by inferring causal re-lations from a total ordering of events. Instead of uniqueidentifiers, Magpie relies on experts with deep knowl-edge about the system to construct a schema of how tocorrelate events in different components. Like X-Trace,they correlate lower level events with a higher level task,but focus mostly on a single system or on distributed sys-tems that are highly instrumented in a compatible way.
The recent work in the AND and Constellationprojects [4], defines the Leslie Graph as the graph rep-resenting the dependencies a distributed system’s com-ponents. They use inference techniques to unobtrusivelyfind correlations in traffic entering and leaving each nodeor service, and combine these findings in a network-widegraph. This graph is similar to, but different from our tasktrees: X-Trace produces deterministic traces of individ-ual task executions, that are useful for examining theirindividual characteristics. In our ongoing work, we arelooking into aggregating several task trees to determineaggregate behavior and dependencies.
Finally, Causeway [8] and SDI [19] provide mecha-nisms for automating metadata propagation within op-erating system and application structures, and could beused in some scenarios to ease X-Trace metadaa propa-gation.
8 Conclusions
Internet applications are becoming increasingly dis-tributed and complex, taking advantage of new protocollayers and middlebox functionality. Current network di-agnostic tools only focus on one particular protocol layer,and the insights they provide on the application cannot beshared between the user, service, and network operators.We propose X-Trace, a cross-layer, cross-applicationtracing framework designed to reconstruct the user’s tasktree. This framework enables X-Trace enabled nodes toencode causal connections necessary for rebuilding thistree. The trace data generated by X-Trace is published toa reporting infrastructure, ensuring that different partiescan access it in a way that respects the visibility require-ments of network and service operators.
NSDI ’07: 4th USENIX Symposium on Networked Systems Design & ImplementationUSENIX Association 283

We deployed and evaluated X-Trace in two concretescenarios: a web hosting site and an overlay network. Wefound that with X-Trace, we were able to quickly iden-tify the location of six injected faults. These faults werechosen because they are difficult to detect using currentdiagnostic tools.
The data generated by X-Trace instrumented sys-tems can serve as the basis for more sophisticated anal-ysis than the simple visualization and fault detectionshown here. Using this data for new and existing algo-rithms [9, 20] is the object of our ongoing work. Giventhat the provider of reports ultimately controls how muchdata is generated, we are also investigating strategies topush filters on what to report as close to the sources ofdata as possible. For example, an AD could push a filterto all of its reporting daemons to not send reports on theIP layer.
AcknowledgmentsWe would like to thank our shepherd, Brad Karp, theanonymous NSDI reviewers, as well as Gautam Autekar,Matthew Caesar, Teemu Koponen, Armando Fox, JeffMogul, Sylvia Ratnasamy, Sean Rhea, Dick Sites, NinaTaft, and James Zhang for all the insightful commentsand discussions.
This work was supported by NSF Grant CNS-0526016(“NeTS-NBD: Collaborative Research: Intelligent andAdaptive Networking for the Next Generation Internet”),the California MICRO Program (“06-146: EnhancedNetworking Dependability via Programmable NetworkElements”), and with matching industrial support fromHewlett-Packard, Microsoft, and Sun Microsystems.
References[1] AGUILERA, M. K., MOGUL, J. C., WIENER, J. L., REYNOLDS,
P., AND MUTHITACHAROEN, A. Performance debugging fordistributed systems of black boxes. In Proc. SOSP ’03 (NewYork, NY, USA, 2003), ACM Press.
[2] ANDERSEN, D., BALAKRISHNAN, H., KAASHOEK, F., ANDMORRIS, R. Resilient overlay networks. In SOSP ’01: Pro-ceedings of the eighteenth ACM symposium on Operating systemsprinciples (New York, NY, USA, 2001), ACM Press.
[3] Application Response Measurement, http://www.opengroup.-org/tech/management/arm/.
[4] BAHL, P., BARHAM, P., BLACK, R., CHANDRA, R., GOLD-SZMIDT, M., ISAACS, R., KANDULA, S., LI, L., MAC-CORMICK, J., MALTZ, D. A., MORTIER, R., WAWRZONIAK,M., AND ZHANG, M. Discovering dependencies for networkmanagement. In Proc. V HotNets Workshop (Nov. 2006).
[5] BALAKRISHNAN, H., PADMANABHAN, V. N., SESHAN, S.,AND KATZ, R. H. A comparison of mechanisms for improv-ing tcp performance over wireless links. In Proc. SIGCOMM ’96(New York, NY, USA, 1996), ACM Press, pp. 256–269.
[6] BARHAM, P., DONNELLY, A., ISAACS, R., AND MORTIER, R.Using Magpie for Request Extraction and Workload Modeling.In Proc. USENIX OSDI (2004).
[7] CASE, J. D., FEDOR, M., SCHOFFSTALL, M. L., AND DAVIN,C. RFC 1157: Simple network management protocol (SNMP),May 1990.
[8] CHANDA, A., ELMELEEGY, K., COX, A. L., ANDZWAENEPOEL, W. Causeway: System support for control-ling and analyzing the execution of multi-tier applications. InProc. Middleware 2005 (November 2005), pp. 42–59.
[9] CHEN, M., KICIMAN, E., FRATKIN, E., BREWER, E., ANDFOX, A. Pinpoint: Problem Determination in Large, Dynamic,Internet Services. In Proc. International Conference on Depend-able Systems and Networks (2002).
[10] CROCKER, D. RFC 822: Standard for the format of ARPA Inter-net text messages, Aug. 1982.
[11] FIELDING, R., GETTYS, J., MOGUL, J., FRYSTYK, H., MAS-INTER, L., LEACH, P., AND BERNERS-LEE, T. HypertextTransfer Protocol – HTTP/1.1. RFC 2616 (Draft Standard), June1999. Updated by RFC 2817.
[12] FONSECA, R., PORTER, G., KATZ, R. H., SHENKER, S., ANDSTOICA, I. IP options are not an option. Tech. Rep. UCB/EECS-2005-24, EECS Department, UC Berkeley, December 9 2005.
[13] HUA CHU, Y., RAO, S. G., SESHAN, S., AND ZHANG, H. Acase for end system multicast. IEEE Journal on Selected Areasin Communication (JSAC) 20, 8 (2002).
[14] HUSSAIN, A., BARTLETT, G., PRYADKIN, Y., HEIDEMANN, J.,PAPADOPOULOS, C., AND BANNISTER, J. Experiences with acontinuous network tracing infrastructure. In Proc. MineNet ’05(New York, NY, USA, 2005), ACM Press.
[15] KOMPELLA, R. R., GREENBERG, A., REXFORD, J., SNOEREN,A. C., AND YATES, J. Cross-layer visibility as a service. In Proc.IV HotNets Workshop (November 2005).
[16] KOPONEN, T., CHAWLA, M., CHUN, B.-G., ERMOLINSKIY,A., KIM, K. H., SHENKER, S., AND STOICA, I. A Data-Oriented (and Beyond) Network Architecture. In submission.
[17] MAZIERES, D. A toolkit for user-level file systems. In USENIXConference (June 2001).
[18] Cisco NetFlow Services and Applications White Paper,http://www.cisco.com/go/netflow.
[19] REUMANN, J., AND SHIN, K. G. Stateful distributed interposi-tion. ACM Trans. Comput. Syst. 22, 1 (2004), 1–48.
[20] REYNOLDS, P., KILLIAN, C., WIENER, J., MOGUL, J., SHAH,M., AND VAHDAT, A. Pip: Detecting the Unexpected in Dis-tributed Systems. In Proc. USENIX NSDI (May 2006).
[21] RHEA, S., GODFREY, B., KARP, B., KUBIATOWICZ, J.,RATNASAMY, S., SHENKER, S., STOICA, I., AND YU, H.OpenDHT: a public DHT service and its uses. In Proc. SIG-COMM ’05 (New York, NY, USA, 2005), ACM Press, pp. 73–84.
[22] ROSENBERG, J., SCHULZRINNE, H., CAMARILLO, G., JOHN-STON, A., PETERSON, J., SPARKS, R., HANDLEY, M., ANDSCHOOLER, E. SIP: Session Initiation Protocol. RFC 3261 (Pro-posed Standard), June 2002.
[23] Splunk, http://www.splunk.com.[24] STOICA, I., ADKINS, D., ZHUANG, S., SHENKER, S., AND
SURANA, S. Internet indirection infrastructure. In Proc. SIG-COMM ’02 (New York, NY, USA, 2002), ACM Press, pp. 73–86.
[25] STOICA, I., MORRIS, R., KARGER, D., KAASHOEK, M. F.,AND BALAKRISHNAN, H. Chord: A scalable peer-to-peerlookup service for internet applications. In Proc. SIGCOMM ’01(New York, NY, USA, 2001), ACM Press, pp. 149–160.
[26] VIXIE, P. Extension Mechanisms for DSN (EDNS0). RFC 2671,Aug. 1999.
[27] Wikipedia Infrastructure, http://meta.wikimedia.org/wiki-/wikimedia servers.
NSDI ’07: 4th USENIX Symposium on Networked Systems Design & Implementation USENIX Association284

Friday: Global Comprehension for Distributed Replay
Dennis Geels∗, Gautam Altekar‡, Petros Maniatisφ, Timothy Roscoe†, Ion Stoica‡∗Google, Inc.,‡University of California at Berkeley, φIntel Research Berkeley, †ETH Zurich
AbstractDebugging and profiling large-scale distributed applica-tions is a daunting task. We present Friday, a systemfor debugging distributed applications that combines de-terministic replay of components with the power of sym-bolic, low-level debugging and a simple language for ex-pressing higher-level distributed conditions and actions.Friday allows the programmer to understand the col-lective state and dynamics of a distributed collection ofcoordinated application components.
To evaluate Friday, we consider several distributedproblems, including routing consistency in overlay net-works, and temporal state abnormalities caused by routeflaps. We show via micro-benchmarks and larger-scaleapplication measurement that Friday can be used inter-actively to debug large distributed applications under re-play on common hardware.
1 IntroductionDistributed applications are complex, hard to designand implement, and harder to validate once deployed.The difficulty derives from the distribution of applica-tion state across many distinct execution environments,which can fail individually or in concert, span large ge-ographic areas, be connected by brittle network chan-nels, and operate at varying speeds and capabilities. Cor-rect operation is frequently a function not only of single-component behavior, but also of the global collection ofstates of multiple components. For instance, in a mes-sage routing application, individual routing tables mayappear correct while the system as a whole exhibits rout-ing cycles, flaps, wormholes or other inconsistencies.
To face this difficulty, ideally a programmer would beable to debug the whole application, inspecting the stateof any component at any point during a debugging ex-ecution, or even creating custom invariant checkers onglobal predicates that can be globally evaluated continu-ously as the system runs. In the routing application ex-ample, a programmer would be able to program her de-
bugger to check continuously that no routing cycles existacross the running state of the entire distributed system,as easily as she can read the current state of program vari-ables in typical symbolic debuggers.Friday, the system we present in this paper, is a
first step towards realizing this vision. Friday (1) cap-tures the distributed execution of a system, (2) replaysthe captured execution trace within a symbolic debug-ger, and (3) extends the debugger’s programmability forcomplex predicates that involve the whole state of the re-played system. To our knowledge, this is the first replay-based debugging system for unmodified distributed ap-plications that can track arbitrary global invariants at thefine granularity of source symbols.
Capture and replay in Friday are performed usingliblog [8], which can record distributed executions andthen replay them consistently. Replay takes place underthe control of a symbolic debugger, which provides ac-cess to internal application state. But simple replay doesnot supply the global system view required to diagnoseemergent misbehavior of the application as a whole.
For global predicate monitoring or replayed applica-tions (the subject of this paper), Friday combines theflexibility of symbolic debuggers on each replayed node,with the power of a general-purpose, embedded script-ing language, bridging the two to allow a single globalinvariant checker script to monitor and control the globalexecution of multiple, distinct replayed components.
Contributions: Friday makes two contributions.First, it provides primitives for detecting events in thereplayed system based on data (watchpoints) or controlflow (breakpoints). These watchpoints and breakpointsare distributed, coordinating detection across all nodesin the replayed system, while presenting the abstractionof operating on the global state of the application.
Second, Friday enables users to attach arbitrarycommands to distributed watchpoints and breakpoints.Friday gives these commands access to all applicationstate as well as a persistent, shared store for saving de-
NSDI ’07: 4th USENIX Symposium on Networked Systems Design & ImplementationUSENIX Association 285

bugging statistics, building behavioral models, or shad-owing global state.
We have built an instance of Friday for the popu-lar GDB debugger, using Python as the script language,though our techniques are equally applicable to othersymbolic debuggers and interpreted scripting languages.
Applicability: Many distributed applications can ben-efit from Friday’s functionality, including both fullydistributed systems (e.g., overlays, protocols for repli-cated state machines) and centrally managed distributedsystems (e.g., load balancers, cluster managers, grid jobschedulers). Developers can evaluate global conditionsduring replay to validate a particular execution for cor-rectness, to catch inconsistencies between a central man-agement component and the actual state of the distributedmanaged components, and to express and iterate behav-ioral regression tests. For example, with an IP routingprotocol that drops an unusual number of packets, a de-veloper might hypothesize that the cause is a routing cy-cle, and use Friday to verify cycle existence. If the hy-pothesis holds true, the developer can further use Fridayto capture cycle dynamics (e.g., are they transient orlong-lasting?), identify the likely events that cause them(e.g., router failures or congestion), and finally identifythe root cause by performing step-by-step debugging andanalysis on a few instances involving such events, allwithout recompiling or annotating the source code.
Structure: We start with background on liblog inSection 2. Section 3 presents the design and implemen-tation of Friday, and also discusses the limitations of thesystem. We then present in Section 4 concrete usage ex-amples in the context of two distributed applications: theChord DHT [25], and a reliable communication toolkitfor Byzantine network faults [26]. We evaluate Friday
both in terms of its primitives and these case studies inSection 5. Finally, we present related work in Section 6and conclude in Section 7.
2 Background: liblogFriday leverages liblog [8] to deterministically andconsistently replay the execution of a distributed appli-cation. We give a brief overview here.liblog is a replay debugging tool for distributed
libc- and POSIX C/C++-based applications onLinux/x86 computers. To achieve deterministic replay,each application thread records the side-effects ofall nondeterministic system calls (e.g., recvfrom(),select(), etc.) to a local log. This is sufficient toreplay the same execution, reproducing race conditionsand non-deterministic failures, following the same codepaths during replay, as well as the same file and networkI/O, signals, and other IPC. liblog ensures causallyconsistent group replay, by maintaining Lamportclocks [16] during logging.
����������� ��
����������� ��
���
��������������
�����������������
������������������
����� ������
������������������
����� ������
Figure 1: Overall architecture of Friday
liblog is incrementally deployable—it allows instru-mented applications to communicate with applicationsthat are not instrumented (e.g., DNS). liblog also sup-ports replaying a subset of nodes without having togather the logs of all nodes in the distributed system.Both incremental deployment and partial replay call forlogging all incoming network traffic.
Finally, liblog’s library-based implementation re-quires neither virtualization nor kernel additions, result-ing in a small per-process CPU and memory footprint. Itis lightweight enough to comfortably replay 60 nodes ona Pentium D 2.8GHz machine with 2GB of RAM. Wehave also built a proof-of-concept cluster-replay mecha-nism that can scale this number with the size of the replaycluster to thousands of nodes.
While liblog provides the programmer with the ba-sic information and tools for debugging distributed ap-plications, the process of tracking down the root causeof a particular problem remains a daunting task. The in-formation presented by liblog can overwhelm the pro-grammer, who is put, more often than not, in the positionof finding a “needle in the haystack.” Friday enablesthe programmer to prune the problem search space byexpressing complex global conditions on the state of thewhole distributed application.
3 DesignFriday presents to users a central debugging console,which is connected to replay processes, each of whichruns an instance of a traditional symbolic debugger suchas GDB (see Figure 1). The console includes an embed-ded script language interpreter, which interprets actionsand can maintain central state for the debugging session.Most user input is passed directly to the underlying de-bugger, allowing full access to data analysis and controlfunctions. Friday extends the debugger’s commands tohandle distributed breakpoints and watchpoints, and toinspect the whole system of debugged processes.
3.1 Distributed Watchpoints and Break-points
Traditional watchpoints allow a symbolic debugger toreact—stop execution, display values, or evaluate a pred-
NSDI ’07: 4th USENIX Symposium on Networked Systems Design & Implementation USENIX Association286

icate on the running state—when the process updates aparticular variable location, named via a memory addressor a symbolic name from the application’s source.Friday’s distributed watchpoints extend this func-
tionality for variables and expressions from multiplenodes in the replayed distributed application. For ex-ample, a programmer debugging a ring network canuse Friday to watch a variable called successor onall machines by specifying “watch successor” or on asingle machine (here, #4) with “4 watch successor”.The command “[<node number>, ...] watch <variable>
[...]” specifies both a set of nodes on which to watchvariables (all by default), and a set of variables to watch.The node numbering is private to Friday; to identify aparticular node by another identifier such as an IP ad-dress, an appropriate mapping can be provided (Sec-tion 3.2).
Distributed breakpoints in Friday have a similar fla-vor. Like traditional breakpoints, they allow the debug-ger to react when the debugged process executes a par-ticular instruction, specified as a source line number ora function name. Friday allows the installation of suchbreakpoints on one, several, or all replayed nodes.
3.1.1 Implementation
Friday implements distributed watchpoints and break-points by setting local instances on each replay processand mapping their individual numbers and addresses toa global identifier. These maps are used to rewrite andforward disable/enable requests to a local instance, andalso to map local events back to the global index whenexecuting attached commands.
Local breakpoints simply use GDB breakpoints,which internally either use debugging registers on theprocessor or inject trap instructions into the code text.In contrast, Friday implements its own mechanism forlocal watchpoints. Friday uses the familiar technique ofwrite-protecting the memory page where the value corre-sponding to a given symbol is stored [29]. When a writeto the variable’s page occurs, the ensuing SEGV signal isintercepted, leading Friday to unprotect the page andcompletes the write, before evaluating any state manipu-lation scripts attached to the watchpoint.
This implementation can give rise to false positiveswhen an unwatched variable sharing the page with awatchpoint is written. The more densely populated amemory page, the more such false positives occur. Wedecided that protection-based watchpoints are preferableto alternative implementations.
We explored but rejected four alternatives: hardwarewatchpoints, single stepping, implementation via break-points, and time-based sampling.
Hardware watchpoints are offered by many processorarchitectures. They are extremely efficient, causing es-
sentially no runtime overhead, but most processors havesmall, hard limits on the number of watchpoint regis-ters (a typical value is 8), as well as on the width of thewatched variable (typically, a single machine word). Forinstance, watching for changes to a variable across tensof replayed nodes would not be possible if the replaymachine has only 8 watchpoint registers. These limitsare too restrictive for distributed predicates; however, wehave planned a hybrid system that uses hardware watch-points as a cache for our more flexible mechanism.
Single-stepping, or software watchpoints, execute onemachine instruction and check variable modifications ateach step. Unfortunately, single-stepping is prohibitivelyslow—we compare it to our method in Section 5.4 anddemonstrate that it is a few thousand times slower.
Local breakpoints can emulate watchpoints by iden-tifying the points where the watched variable could bemodified and only checking for changes there. Whenthis identification step is accurate the technique is highlyefficient, but unfortunately it requires comprehensiveknowledge of the program code and is prone to mistakes.
Periodic sampling of watched variables (e.g., everyk logical time ticks) enables a trade-off between replayspeedup and watchpoint accuracy: it is potentially fasterthan all the techniques described above, but it may be dif-ficult to pinpoint value changes. Combined with replaycheckpointing and backtracking, it might prove a valu-able but not complete alternative.
3.1.2 Implementation Complexity
Building a new watchpoint mechanism in Friday re-quired reconstructing some functionality normally pro-vided by the underlying symbolic debugger, GDB.Namely, debuggers maintain state for each watchedexpression, including the stack frame where the vari-able is located (for local variables) and any muta-ble subexpressions whose modification might affect theexpression’s value. For example, a watchpoint onsrv->successor->addr should trigger if the pointers srv orsrv->successor change, pointing the expression to a newvalue. Because GDB does not expose this functionalitycleanly, we replicated it in Friday.
Also, the new watchpoint mechanism conflicts withGDB’s stack maintenance algorithms. Friday’s manip-ulation of memory page protection on the stack (Sec-tion 3.1.1) conflicts with GDB’s initialization tasks whencalling application functions, causing mprotect failures.To resolve the conflict, we replace GDB’s calling facili-ties with our own, manipulating the application’s PC di-rectly, thereby complicating GDB’s breakpoint mainte-nance. Thankfully, these complications are not triggeredby any of our case studies presented in this paper.
NSDI ’07: 4th USENIX Symposium on Networked Systems Design & ImplementationUSENIX Association 287

3.2 CommandsThe second crucial feature of Friday is the ability toview and manipulate the distributed state of replayednodes. These actions can either be performed inter-actively or triggered automatically by watchpoints orbreakpoints. Interactive commands such as backtrace
and set are simply passed directly to the named set ofdebugger processes. They are useful for exploring thedistributed state of a paused system.
In contrast, automated commands are written in ascripting language for greater expressiveness. Thesecommands are typically used to maintain additionalviews of the running system to facilitate statistics gather-ing or to reveal complex distributed (mis)behaviors.Friday commands can maintain their own arbitrary
debugging state, in order to gather statistics or buildmodels of global application state. In the examples be-low, emptySuccessors and nodes are debugging state, de-clared in Friday via the python statement; e.g., python
emptySuccessors = 0. This state is shared among com-mands and is persistent across command executions.Friday commands can also read and write vari-
ables in the state of any replayed process, referringto symbolic names exposed by the local GDB in-stances. To simplify this access, Friday embeds intothe scripting language appropriate syntax for callingfunctions and referencing variables from replayed pro-cesses. For example, the statement “@4(srv.successor)== @6(srv.predecessor)” compares the successor vari-able on node 4 to the predecessor variable on node 6. Byomitting the node specifier, the programmer refers to thestate on the node where a particular watchpoint or break-point was triggered. For example, the following com-mand associated with a watchpoint on srv.successor in-crements the debugging variable emptySuccessors when-ever a successor pointer is set to null, and continues ex-ecution:
if not @(srv.successor):
emptySuccessors++
cont
For convenience, the node where a watchpoint orbreakpoint was triggered is also accessible within com-mand scripts via the NODE metavariable, and all nodesare available in the list ALL . For example, thefollowing command, triggered when a node updatesits application-specific identifier variable srv.node.id,maintains the global associative array nodes:
nodes[@(srv.node.id)] = __NODE__
cont
Furthermore, Friday provides commands with accessto the logical time kept by the Lamport clock exportedby liblog, as well as the “real” time recorded at eachlog event. Because liblog builds a logical clock that
is closely correlated with wall clock during trace ac-quisition, these two clocks are usually closely synchro-nized. Friday exposes the global logical clock as theLOGICALCLOCK metavariable and node i’s real clock at
the time of trace capture as @i( REALCLOCK ).Similarly to GDB commands, our language allows
setting and resetting distributed watchpoints and break-points from within a command script. Such nestedwatchpoints and breakpoints can be invaluable in selec-tively picking features of the execution to monitor in re-action to current state, for instance to watch a variableonly in between two breakpoints in an execution. Thiscan significantly reduce the impact of false positives, byenabling watchpoints only when they are relevant.
3.2.1 Language ChoiceThe Friday commands triggered by watchpoints andbreakpoints are written in Python, with extensions for in-teracting with distributed application state.
Evaluating Python inside Friday is straightforward,because the console is itself a Python application, anddynamic evaluation is well supported. We chose to de-velop Friday in Python for its high-level language fea-tures and ease of prototyping; these benefits also applywhen writing watchpoint command scripts.
We could have used the application’s native language(C/C++), in much the same way that C is used in In-troVirt [11]. Such an approach would allow the pro-grammer to inline predicate code in the language of theapplication, thereby simplifying the interface betweenC/C++ constructs and a higher-level language. It wouldalso eliminate the need to rely on GDB and Python forbreakpoint/watchpoint detection and predicate evalua-tion, thereby reducing IPC-related overhead during re-play. Unfortunately, this option calls for duplicatingmuch of the introspection functionality (e.g., inspectionof stack variables) already offered by GDB, and requiresrecompiling/reloading a C/C++ predicate library eachtime the user changes a predicate; we wanted to supporta more interactive usage model.
At the opposite end of the spectrum, we could haveused GDB’s “command list” functionality to expressdistributed watchpoints and breakpoints. UnfortunatelyGDB commands lack the expressiveness of Python, suchas its ability to construct new data structures, as well asthe wealth of useful libraries. Using a general-purposescripting framework like Python running at the consoleafforded us much more flexibility.
3.2.2 SyntaxWhen a distributed command is entered, Friday exam-ines every statement to identify references to the targetapplication state. These references are specified with thesyntax @<node>(<symbol>[=<value>]) where the node de-faults to that which triggered the breakpoint or watch-
NSDI ’07: 4th USENIX Symposium on Networked Systems Design & Implementation USENIX Association288

point. These references are replaced with calls to internalfunctions that read from or write to the application usingGDB commands print and set, respectively. Metavari-ables such as LOGICALCLOCK are interpolated similarly.Furthermore, Friday allows commands to refer to appli-cation objects on the heap whose symbolic names are notwithin scope, especially when stopped by a watchpointoutside the scope within which the watchpoint was de-fined. Such pointers to heap objects that are not alwaysnameable can be passed to watchpoint handlers as pa-rameters at the time of watchpoint definition, much likecontinuations (see Section 4.2.1 for a detailed example).The resulting statements are compiled, saved, and laterexecuted within the global Friday namespace and per-sistent command local namespace.
If the value specified in an embedded assignment in-cludes keyed printf placeholders, i.e., %(<name>)<fmt>, thevalue of the named Python variable will be interpolatedat assignment time. For example, the command
tempX = @(x)
tempY = @other(y)
@(x=%(tempY)d)
@other(y=%(tempX)d)
swaps the values of integer variables x at the current nodeand y at the node whose number is held in the pythonvariable other.
Commands may call application functions using simi-lar syntax:
@<node>(<function>(<arg>,....))
These functions would fail if they attempted to write to amemory page protected by Friday’s watchpoint mecha-nism, so Friday conservatively disables all watchpointsfor that replay process during the function call. Unfortu-nately that precaution may be very costly (see Section 5).If the user is confident that a function will not modifyprotected memory, she may start the command with thesafe keyword, which instructs Friday to leave watch-points enabled. This option is helpful, for example, ifthe invoked function only modifies the stack, and watch-points are only set on global variables.
The value returned by GDB using the @() operatormust be converted to a Python value for use by the com-mand script. Friday understands strings (type char*
or char[]), and coerces pointers and all integer typesto Python long integers. Any other type, including anystructs and class instances, are extracted as a tuple con-taining their raw bytes. This solution allows simple iden-tity comparisons, which was sufficient for all useful casestudies we have explored so far.
Finally, our extensions had to resolve some keywordconflicts between GDB and Python, such as cont andbreak. For example, within commands continue refers tothe Python keyword whereas cont to GDB’s keyword. In
the general case, we can prefix the keyword gdb in frontof GDB keywords within commands.
3.3 LimitationsWe have used Friday to debug large distributed applica-tions. Though still a research prototype with rough edgesand only a rudimentary user interface, we have foundFriday to be a powerful and useful tool; however, it hasseveral limitations that potential users should consider.
We start with limitations that are inherent to Friday.First, false positives can slow down application replay.False positive rates depend on application structure anddynamic behavior, which vary widely. In particular,watching variables on the stack can slow Friday downsignificantly. In practice we have circumvented this limi-tation by recompiling the application with directives thatspread the stack across many independent pages of mem-ory. Though this runs at odds with our goal of avoidingrecompilation, it is only required once per application, asopposed to requiring recompilations every time a mon-itored predicate or metric must change. Section 5 hasmore details on Friday performance.
The second Friday-specific limitation involves re-playing from the middle of a replay trace. Some Friday
predicates build up their debugging state by observingthe dynamic execution of a replayed application, andwhen starting from a checkpoint these predicates mustrebuild that state through observation of a static snap-shot of the application at that checkpoint. This pro-cess is straightforward for the applications we study inSection 4, but it may be more involved for applicationswith more complex data structures. We are working ona method for adding debugging state to liblog check-points at debug time, to avoid this complexity.
Thirdly, although we have found that Friday’s cen-tralized and type-safe programming model makes pred-icates considerably simpler than the distributed algo-rithms they verify, Friday predicates often require somedebugging themselves. For example, Python’s dynamictype system allows us to refer to application variablesthat are not in dynamic scope, causing runtime errors.
Beyond Friday’s inherent limitations, the system in-herits certain limitations from the components on whichit depends. First, an application may copy a watchedvariable and modify the copy instead of the original,which GDB is unable to track. This pattern is common,for example, in the collection templates of the C++ Stan-dard Template Library, and requires the user of GDB(and consequently Friday) to understand the programwell enough to place watchpoints on all such copies.The problem is exacerbated by the difficulty of access-ing these copies, mostly due to GDB’s inability to placebreakpoints on STL’s many inlined accessor functions.
A second inherited limitation is unique to stack-based
NSDI ’07: 4th USENIX Symposium on Networked Systems Design & ImplementationUSENIX Association 289

variables. As with most common debuggers, we haveno solution for watching stack variables in functions thathave not yet been invoked. To illustrate, it is difficultto set up ahead of time a watchpoint on the commandline argument variable argv of the main function acrossall nodes before we have entered the main at all nodes.Nested watchpoints are a useful tool in that regard.
Finally, Friday inherits liblog’s large storage re-quirements for logs and an inability to log or replaythreads in parallel on multi-processor machines.
4 Case StudiesIn this section, we present use cases for the new dis-tributed debugging primitives presented above. First,we look into the problem of consistent routing in thei3/Chord DHT [24], which has occupied networking anddistributed research literature extensively. Then we turnto debugging Tk, a reliable communication toolkit [26],and demonstrate sanity checking of disjoint path compu-tation over the distributed topology, an integral part ofmany secure-routing protocols. For brevity, most exam-ples shown omit error handling, which typically adds afew more lines of Python script.
4.1 Routing ConsistencyIn this section, we describe a usage scenario in whichFriday helps a programmer to drill down on a reportedbug with i3/Chord. The symptom is the loss of a valuestored within a distributed hash table: a user who dida put(key,value), doing a get(key) later did not receivethe value she put into the system before. We describe adebugging session for this scenario and outline specificuses of Friday’s facilities.
Our programmer, Frieda, starts with a set of logs givento her, and with the knowledge that two requests, a put
and a get that should be consistent with each other appearto be inconsistent: the get returns something other thanwhat the put placed into the system.
4.1.1 Identifying a distributed bug
Frieda would probably eliminate non-distributed kinds ofbugs first, by establishing for instance that a node-localstore does not leak data. To do that, she can monitor thatthe two requests are handled by the same node, and thatthe node did not lose the key-value pair between the tworequests.
py getNode = None
py putNode = None
break process_data
command
if @(packet_id) == failing id:
if is get(@(packet_header)):
getNode = @(srv.node.id)
else:
putNode = @(srv.node.id)
end
This breakpoint triggers every time a request is for-warded towards its final destination. Frieda will inter-actively store the appropriate message identifier in thePython variable failing id and define the Python methodis get. At the end of this replay session, the variablesgetNode and putNode have the identifiers of the nodes thatlast serviced the two requests, and Frieda can read themthrough the Friday command line. If they are the same,then she would proceed to debug the sequence of opera-tions executed at the common node between the put andthe get. However, for the purposes of our scenario weassume that Frieda was surprised to find that the put andthe get were serviced by different nodes. This leads herto believe that the system experienced routing inconsis-tency, a common problem in distributed lookup serviceswhere the same lookup posed by different clients at thesame time receives different responses.
4.1.2 Validating a HypothesisThe natural next step for Frieda to take is to build a mapof the consistent hashing offered by the system: whichpart of the identifier space does each node think it is re-sponsible for? If the same parts of the identifier space areclaimed by different nodes, that might explain why thesame key was serviced by different nodes for the put andthe get requests. Typically, a node believes that its im-mediate successor owns the range of the identifier spacebetween its own identifier and that of its successor.
The following breakpoint is set at the point that a nodesets its identifier (which does not change subsequently).It uses the ids associative array to map Friday nodes toChord IDs.py ids = {}break chord.c:58
command
ids[__NODE__] = @((char*)id)
cont
end
Now Frieda can use this information to check the correctdelivery of requests for a given key as follows:break process.c:69
command
if @(packet_id) != failing_id:
cont
for peer in __ALL__:
@((chordID)_liblog_workspace =
atoid("%(ids[peer])s"))
if @(is_between((chordID*)&_liblog_workspace,
@(packet_id), &successor->id)):
print "Request %s misdelivered to %s" %
(@(packet_id), @(successor->id))
break
cont
end
This breakpoint triggers whenever a node with IDsrv.node.id believes it is delivering a packet with desti-nation ID packet id to its rightful destination: the node’s
NSDI ’07: 4th USENIX Symposium on Networked Systems Design & Implementation USENIX Association290

�����������
�������
�������
����������
�������
����
�����������
���������
����
��
���
���
Figure 2: At the top, we show what node n believes the ring topologyto be around it. At the bottom, we see the relevant state as stored by theinvolved nodes n, s and p. The thick routing entry from node p to s
is inconsistent with n’s view of the ring, indicating a source of routingconsistency problems.
immediate successor with ID srv.successor->id, suchthat packet id is in between identifiers srv.node.id andsrv.successor->id. When that happens, this commandfigures out if the request in question is one of Frieda’sproblem requests, and if so, it finds out if there is a nodethat should be receiving the packet instead.
This check uses the native Chord function atoid
to load the peer’s ID into application scratch space( liblog workspace) and then invokes the Chord func-tion is between to perform the range check. Both ofthese functionalities could have been duplicated insteadin Python, if Frieda suspected their implementation asthe source of the problem.
This breakpoint command is a simple instance of avery powerful construct: a global index of all nodes inthe system is very easy for Friday to construct at replaytime but difficult or impossible to collect reliably and ef-ficiently at runtime. Doing so would require transmittingeach update (node insertion, etc.) to all nodes, presum-ably while all other communication is disabled to avoidinconsistencies. These updates would be expensive forlarge networks and could fail due to transient networkconditions. Conversely, Friday can maintain a globalview of the whole logged population, even if the nodesthemselves could not talk to each other at runtime.
4.1.3 Searching for a Root Cause
The identified inconsistency told Frieda that she has aproblem. Most likely, it tells her that part of her pur-ported ring topology looks like Figure 2, in which theculprit node, p, believes its successor to be node s anddelivers anything between identifiers p and s to s forprocessing, where instead all requests for identifiers be-tween p and n belong to node n instead.
To dig deeper, Frieda can monitor ring consistencymore closely, for instance by ensuring that ring edges aresymmetric. Checking that successor/predecessor consis-tency conditions hold at all times is unnecessary. Instead,it is enough to check the conditions when a successor orpredecessor pointer changes, and only check those spe-
cific conditions in which the changed pointers partici-pate. Frieda can encode this in Friday as follows:
watch srv.successor
command
successor_id = @(srv.successor->id)
if @(srv.node.id) !=
@nodes[successor_id](srv.predecessor->id):
print __NODE__, "’s successor link is asymmetric."
end
and symmetrically for the predecessor’s successor. Thiswould catch, for instance, the problem illustrated in Fig-ure 2, which caused Frieda’s problem.
4.1.4 How Often Is The Bad Thing Happening?
Such inconsistencies occur transiently even when thesystem operates perfectly while an update occurs, e.g.,when a new node is inserted into the ring. Without trans-actional semantics across all involved nodes in whichchecks are performed only before or after a transition,such warnings are unavoidable. Frieda must figure outwhether this inconsistency she uncovered occurs most ofthe time or infrequently; that knowledge can help her de-cide whether this is a behavior she should mask in herChord implementation (e.g., by sending redundant put
and get requests) or fix (e.g., by ensuring that nodes haveagreed on their topological neighborhood before actingon topology changes).
In Friday, Frieda can compute the fraction of timeduring which the ring topology lies in an inconsistentstate. Specifically, by augmenting the monitoring state-ments from Section 4.1.3, she can instrument transitionsfrom consistent to inconsistent state and back, to keeptrack of the time when those transitions occur, and aver-aging over the whole system.
watch srv.successor, srv.predecessor
command
myID = @(srv.node.id)
successorID = @(srv.successor->id)
predecessorID = @(srv.predecessor->id)
if not (@nodes[successorID](srv.predecessor->id)
== @nodes[predecessorID](srv.successor->id)
== myID): #inconsistent?
if consistent[myID]:
consistentTimes +=
(@(__REALCLOCK__) - lastEventTime[myID])
consistent[myID] = False
lastEventTime[myID] = @(__REALCLOCK__)
else: # converse: consistent now
if not consistent[myID]:
inconsistentTimes +=
@((__REALCLOCK__) - lastEventTime[myID])
consistent[myID] = True
lastEventTime[myID] = @(__REALCLOCK__)
cont
end
py consistent = {}py lastEventTime = {}py consistentTimes = inconsistentTimes = 0
NSDI ’07: 4th USENIX Symposium on Networked Systems Design & ImplementationUSENIX Association 291

This example illustrates how to keep track of how muchtime each replayed machine is in the consistent or incon-sistent state, with regards to its ring links. The monitor-ing specification keeps track of the amounts of time nodei is consistent or inconsistent in the debugging coun-ters consistentTimes and inconsistentTimes, respectively.Also, it remembers when the last time a node switchedto consistency or inconsistency in the debugging hash ta-bles consistent and inconsistent, respectively. When thedistributed commands are triggered, if the node is nowinconsistent but was not before (the last time of turningconsistent is non-empty), the length of the just-ended pe-riod of consistency is computed and added to the thus-farsum of consistency periods. The case for inconsistencyperiods is symmetric and computed in the “else” clause.
Periodically, or eventually, the relevant ratios can becomputed as the ratio of inconsistent interval sums overthe total time spent in the experiment, and the whole sys-tem might be characterized taking an average or medianof those ratios.
4.1.5 State Oscillation
If Frieda finds that most of the time such inconsistenciesexist, she may decide this is indeed a bug and move to fixit by ensuring a node blocks requests while it agrees onlink symmetry with its immediate neighbors.
In the unhappy case in which Frieda’s system is indeedintended to have no such inconsistencies (i.e., she hasalready written the code that causes nodes to agree onlink symmetry), she would like to determine what wentwrong. She can do by testing a series of hypotheses.
One such hypothesis—which is frequently the caseof inconsistencies in a broad range of distributedapplications—is a network link that, whether due to highloss rates or intermittent hardware failure, makes a ma-chine repeatedly disappear and reappear to its neigh-bor across the link. This oscillation may cause routesthrough the nodes to flap to backup links, or even createrouting wormholes and black holes. Frieda can analyzethe degree of oscillation in her network with the follow-ing simple Friday breakpoint commands.
break remove_finger
command
finger = @(f->node.addr) # f is formal parameter
events = routeEvents[@(srv.node.addr)]
if finger not in events:
events[finger] = []
events[finger].append(("DOWN",__LOGICALCLOCK__))
cont
end
break insert_finger
command
finger = @(addr) # addr is formal parameter
events = routeEvents[@(srv.node.addr)]
if finger in events:
lastEvent,time = events[finger][-1]
if lastEvent == "DOWN":
events[finger].append(("UP",__LOGICALCLOCK__))
cont
end
The first command adds a log entry to the debugging ta-ble routeEvents (initialized elsewhere) each time a rout-ing peer, or finger, is discarded from the routing table.The second command adds a complementary log entry ifthe node is reinserted. The two commands are asymmet-ric because insert finger may be called redundantly forexisting fingers, and also because we wish to ignore theinitial insertion for each finger. The use of virtual clockshere allows us to correlate log entries across neighbors.
4.2 A Reliable Communication ToolkitIn the second scenario, we investigate Tk [26], a toolkitthat allows nodes in a distributed system to communi-cate reliably in the presence of k adversaries. The onlyrequirement for reliability is the existence of at least k
disjoint paths between communicating nodes. To en-sure this requirement is met, each node pieces togethera global graph of the distributed system based on path-vector messages and then computes the number of dis-joint paths from itself to every other node using the max-flow algorithm. A bug in the disjoint path computationor path-vector propagation that mistakenly registers k ormore disjoint paths would seriously undermine the secu-rity of the protocol. Here we show how to detect such abug.
4.2.1 Maintaining a Connectivity Graph
When performing any global computation, includingdisjoint-path computation, a graph of the distributed sys-tem is a prerequisite. The predicate below constructssuch a graph by keeping track of the connection statusof each node’s neighbors.
py graph = zero_matrix(10, 10)
break server.cpp:355
command
neighbor_pointer = "(*(i->_M_node))"
neighbor_status_addr =
@(&(%(neighbor_pointer)s->status))
# Set a watchpoint dynamically
watchpoint(["*%d" % neighbor_status_addr],
np=@(%(neighbor_pointer)s))
command
status = @((((Neighbor*)(%(np)d))->status))
neighbor_id = @((((Neighbor*)(%(np)d))->id))
my_id = @(server->id)
if status > 0:
graph[my_id][neighbor_id] = 1
compute_disjoint_paths() # Explained below.
cont
end
cont
end
NSDI ’07: 4th USENIX Symposium on Networked Systems Design & Implementation USENIX Association292
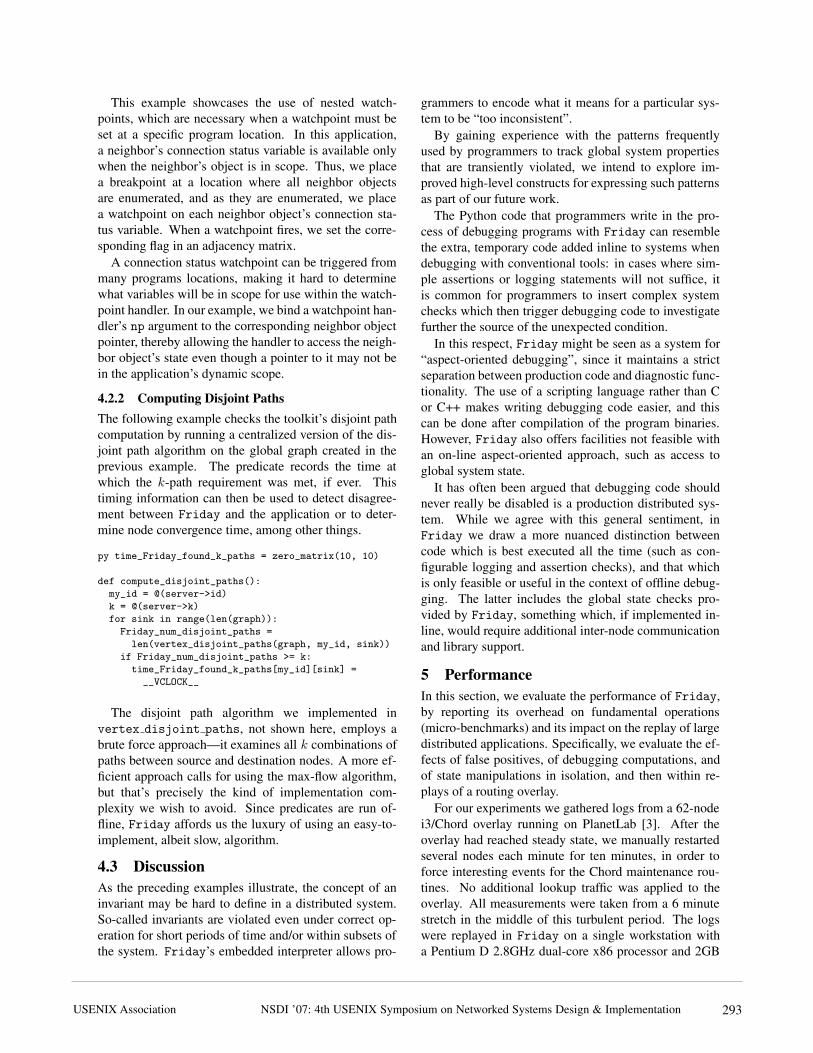
This example showcases the use of nested watch-points, which are necessary when a watchpoint must beset at a specific program location. In this application,a neighbor’s connection status variable is available onlywhen the neighbor’s object is in scope. Thus, we placea breakpoint at a location where all neighbor objectsare enumerated, and as they are enumerated, we placea watchpoint on each neighbor object’s connection sta-tus variable. When a watchpoint fires, we set the corre-sponding flag in an adjacency matrix.
A connection status watchpoint can be triggered frommany programs locations, making it hard to determinewhat variables will be in scope for use within the watch-point handler. In our example, we bind a watchpoint han-dler’s np argument to the corresponding neighbor objectpointer, thereby allowing the handler to access the neigh-bor object’s state even though a pointer to it may not bein the application’s dynamic scope.
4.2.2 Computing Disjoint Paths
The following example checks the toolkit’s disjoint pathcomputation by running a centralized version of the dis-joint path algorithm on the global graph created in theprevious example. The predicate records the time atwhich the k-path requirement was met, if ever. Thistiming information can then be used to detect disagree-ment between Friday and the application or to deter-mine node convergence time, among other things.
py time_Friday_found_k_paths = zero_matrix(10, 10)
def compute_disjoint_paths():
my_id = @(server->id)
k = @(server->k)
for sink in range(len(graph)):
Friday_num_disjoint_paths =
len(vertex_disjoint_paths(graph, my_id, sink))
if Friday_num_disjoint_paths >= k:
time_Friday_found_k_paths[my_id][sink] =
__VCLOCK__
The disjoint path algorithm we implemented invertex disjoint paths, not shown here, employs abrute force approach—it examines all k combinations ofpaths between source and destination nodes. A more ef-ficient approach calls for using the max-flow algorithm,but that’s precisely the kind of implementation com-plexity we wish to avoid. Since predicates are run of-fline, Friday affords us the luxury of using an easy-to-implement, albeit slow, algorithm.
4.3 DiscussionAs the preceding examples illustrate, the concept of aninvariant may be hard to define in a distributed system.So-called invariants are violated even under correct op-eration for short periods of time and/or within subsets ofthe system. Friday’s embedded interpreter allows pro-
grammers to encode what it means for a particular sys-tem to be “too inconsistent”.
By gaining experience with the patterns frequentlyused by programmers to track global system propertiesthat are transiently violated, we intend to explore im-proved high-level constructs for expressing such patternsas part of our future work.
The Python code that programmers write in the pro-cess of debugging programs with Friday can resemblethe extra, temporary code added inline to systems whendebugging with conventional tools: in cases where sim-ple assertions or logging statements will not suffice, itis common for programmers to insert complex systemchecks which then trigger debugging code to investigatefurther the source of the unexpected condition.
In this respect, Friday might be seen as a system for“aspect-oriented debugging”, since it maintains a strictseparation between production code and diagnostic func-tionality. The use of a scripting language rather than Cor C++ makes writing debugging code easier, and thiscan be done after compilation of the program binaries.However, Friday also offers facilities not feasible withan on-line aspect-oriented approach, such as access toglobal system state.
It has often been argued that debugging code shouldnever really be disabled is a production distributed sys-tem. While we agree with this general sentiment, inFriday we draw a more nuanced distinction betweencode which is best executed all the time (such as con-figurable logging and assertion checks), and that whichis only feasible or useful in the context of offline debug-ging. The latter includes the global state checks pro-vided by Friday, something which, if implemented in-line, would require additional inter-node communicationand library support.
5 PerformanceIn this section, we evaluate the performance of Friday,by reporting its overhead on fundamental operations(micro-benchmarks) and its impact on the replay of largedistributed applications. Specifically, we evaluate the ef-fects of false positives, of debugging computations, andof state manipulations in isolation, and then within re-plays of a routing overlay.
For our experiments we gathered logs from a 62-nodei3/Chord overlay running on PlanetLab [3]. After theoverlay had reached steady state, we manually restartedseveral nodes each minute for ten minutes, in order toforce interesting events for the Chord maintenance rou-tines. No additional lookup traffic was applied to theoverlay. All measurements were taken from a 6 minutestretch in the middle of this turbulent period. The logswere replayed in Friday on a single workstation witha Pentium D 2.8GHz dual-core x86 processor and 2GB
NSDI ’07: 4th USENIX Symposium on Networked Systems Design & ImplementationUSENIX Association 293

Benchmark Latency (ms)
False Positive 13.2
Null Command 15.6
Value Read 15.9
Value Write 15.9
Function Call 26.1
Safe Call 16.5
Table 1: Micro-benchmarks - single watchpoint
RAM, running the Fedora Core 4 OS with version 2.6.16of the Linux kernel.
5.1 Micro-benchmarks
Here we evaluate Friday on six micro-benchmarks thatillustrate the overhead required to watch variables andexecute code on replayed process state. Table 1 containslatency measurements for the following operations:• False Positive: A watchpoint is triggered by the
modification of an unwatched variable that occupiesthe same memory page as the watched variable.
• Null Command: The simplest command we canexecute once a watchpoint has passed control toFriday. The overhead includes reading the newvalue (8 bytes) of the watched variable and evalu-ating a simple compiled Python object.
• Value Read: A single fetch of a variable from one ofthe replayed processes. The overhead involves con-tacting the appropriate GDB process and reading thevariable’s contents.
• Value Write: Updates a single variable in a singlereplayed process.
• Function Call: The command calls an applicationfunction that returns immediately. All watchpoints(only one in this experiment) must be disabled be-fore, and re-enabled after the function call.
• Safe Call: The command is marked “safe” to obviatethe extra watchpoint management.
These measurements indicate that the latency of han-dling the segmentation faults dominates the cost of pro-cessing a watchpoint. This means our implementation ofwatchpoints is sensitive to the false positive rate, and wecould expect watchpoints that share memory pages withpopular variables to slow replay significantly.
Fortunately, the same data suggests that executing theuser commands attached to a watchpoint is inexpensive.Reading or writing variables or calling a safe functionadds less than a millisecond of latency over a null com-mand, which is only a few milliseconds slower than afalse positive. The safe function call is slightly slowerthan simple variable access, presumably due to the extrawork by GDB to set up a temporary stack, marshal data,and clean up afterward.
0
5
10
15
20
25
30
safecall
functioncall
valuewrite
valueread
nullcommand
falsepositive
Late
ncy
(ms)
otherreprotect
check/executestep
unprotect
Figure 3: Latency breakdown for various watchpoint events.
A normal “unsafe” function call, on the other hand, is50% slower than a safe one. The difference (9.6 ms) isattributed directly to the cost of temporarily disabling thewatchpoint before invoking the function.
We break down the processing latency into phases:• Unprotect: Temporarily disable memory protection
on the watched variable’s page, so that the faultinginstruction can complete. This step requires callingmprotect for the application, through GDB.
• Step: Re-execute the faulting instruction. This re-quires a temporary breakpoint, used to return to theinstruction from the fault handler.
• Reprotect: Re-enable protection with mprotect.• Check and Execute: If the faulting address falls in a
watched variable (as opposed to a false positive), itsnew value is extracted from GDB. If the value haschanged, any attached command is evaluated by thePython interpreter.
• Other: Miscellaneous tasks, including reading thefaulting address from the signal’s user context.
Figure 3 shows that a false positive costs the same asa watchpoint hit. The dark segments in the middle ofeach bar show the portion required to execute the usercommand. It is small except the unsafe function call,where it dominates.
5.2 Micro-benchmarks: Scaling of Com-mands
Next we explored the scaling behavior of the four com-mand micro-benchmarks: value read, value write, func-tion call, and safe call. Figure 4 shows the cost of pro-cessing a watchpoint as the command accesses an in-creasing number of nodes. Each data point is averagedover the same number of watchpoints; the latency in-creases because more GDB instances must be contacted.
The figure includes the best-fit slope for each curve,which approximates the overhead added for each addi-tional node that the command reads, writes, or calls. Formost of the curves this amount closely matches the dif-ference between a null command and the correspond-
NSDI ’07: 4th USENIX Symposium on Networked Systems Design & Implementation USENIX Association294

01020304050607080
0 25 50 75 100
Late
ncy
(ms)
% Processes Accessed
0.38 ms/node0.41 ms/node0.5
6 ms/nod
e
ReadWrite
Safe Call
0200400600800
1000120014001600
0 25 50 75 100% Processes Accessed
12.84
ms/nod
e
Function Call
Figure 4: Micro-benchmarks indicating latency and first standarddeviation (y axis), as a function of the percentage of nodes involved inthe operation (x axis). The population contains 62 nodes.
ing single-node reference. In contrast, the unsafe func-tion call benchmark increases at a faster rate—almostdouble—and with higher variance than predicted by thesingle node overhead. We attribute both phenomena togreater contention in the replay host’s memory hierarchydue to the extra memory protection operations.
5.3 Micro-benchmarks on ChordWe continue by evaluating how the same primitive op-erations described in the previous section affect a base-line replay of a distributed application. For each bench-mark, we average across 6 consecutive minute-long pe-riods from the i3/Chord overlay logs described above.Other applications would experience more or less over-head, depending on the relative frequency of libc callsand watchpoint triggers.
We establish a replay baseline by replaying all 62traced nodes in liblog without additional debuggingtasks. Average replay slowdown is 3.12x, with a stan-dard deviation of .08x over the 6 samples. liblog
achieves a slowdown less than the expected 62x by skip-ping idle periods in each process. For comparison, sim-ply replaying the logs in GDB, but without liblog, ran11 times faster, for a replay speedup of 3.5x. The dif-ference between GDB and liblog is due to the schedul-ing overhead required to keep the 62 processes replayingconsistently. liblog must continually stop the runningprocess, check its progress, and swap in a new process tokeep their virtual clocks synchronized. Without liblog,we let GDB replay each log fully before moving on.
To measure false positives, we add a dummy watch-point on a variable at a memory page written about 4.7
times per second per replayed node; the total averagereplay slowdown goes up to 7.95x (0.2x standard de-viation), or 2.55x slower than baseline replay. This isgreater than what our micro-benchmarks predict: 4.7
triggered watchpoints per second should expand everyreplayed second from the baseline 3.12 seconds by anadditional 4.7× 62× 0.0132 = 3.87 seconds for a slow-
Benchmark Slowdown (dev) Relative
No Watchpoints 3.12 (.08) 1
False Positives Only 7.95 (0.22) 2.55
Null Command 8.24 (0.24) 2.64
Value Read 8.25 (0.17) 2.65
Value Write 8.26 (0.21) 2.65
Function Call 9.01 (0.27) 2.89
Safe Call 8.45 (0.26) 2.71
Table 2: Micro-benchmarks: slowdown of Chord replay for watch-points with different commands.
down of 4.87x. We conjecture that the extra slowdownis due to cache contention on the replay machine, thoughfurther testing will be required to validate this.
To measure Friday’s slowdown for the various typesof watchpoint commands, we set a watchpoint on a vari-able that is modified once a second on each node. Thiswatchpoint falls on the same memory page as in the pre-vious experiment, so we now see one watchpoint hit and3.7 false positives per second. The slowdown for eachtype of command is listed in Table 2.
The same basic trends from the micro-benchmarks ap-pear here: function calls are more expensive than othercommands, which are only slightly slower than null com-mands. Significantly, the relative cost of the commandsis dwarfed by the cost of handling false positives. This isexpected, because the latency of processing a false pos-itive is almost as large as a watchpoint hit, and becausethe number of false positives is much greater than thenumber of hits for this experiment. We examine differ-ent workloads later, in Section 5.4.
Next, we scale the number of replayed nodes on whosestate we place watchpoints, to verify that replay perfor-mance scales with the number of watchpoints. These ex-periments complement the earlier set which verified thescalability of the commands.
As expected, as the number of memory pages incur-ring false positives grows, replay slows down. Fig-ure 5(a) shows that the rate at which watchpoints arecrossed—both hits and false positives—increases asmore processes enable watchpoints. The correlation isnot perfect, because some nodes were more active andexecuted the watched inner loop more often than others.
Figure 5(b) plots the relative slowdown caused by thedifferent types of commands as the watchpoint rate in-creases. These lines suggest that Friday does indeedscale with the number of watchpoints enabled and falsepositives triggered.
5.4 Case StudiesFinally, we return to the case studies from Section 4. Un-like the micro-benchmarks, these case studies include re-alistic and useful commands. They exhibit a range ofperformance, and two of them employ distributed break-
NSDI ’07: 4th USENIX Symposium on Networked Systems Design & ImplementationUSENIX Association 295

00.5
11.5
22.5
33.5
44.5
5
0 25 50 75 100
Wat
chpo
intC
ross
ings
/sec
% Watchpoints Enabled
(a)
allFPshits
1
1.5
2
2.5
3
0 25 50 75 100Re
play
Slow
down
(vs.
Basic
)% Watchpoints Enabled
(b)
CallSafe call
WriteReadNoop
All FPs
Figure 5: (a) Number of watchpoints crossed vs. percentage of nodeswith watchpoints enabled (i3/Chord logs). Approximately linear. (b)Replay slowdown vs. percentage of nodes with watchpoints enabled,relative to baseline replay (i3/Chord logs).
Predicate Slowdown
None 1.00
Ring Consistency Stat. 2.53
w/Software Watchpoints 8470.0
State Oscillation 1.48
Misdelivered Packets 9.05
Table 3: Normalized replay slowdown under three different casestudies. The last row gives the slowdown for the Ring ConsistencyStatistics predicate when implemented in GDB with single-stepping.
points instead of watchpoints.We replayed the same logs used in earlier experi-
ments with the predicates for Misdelivered Packets (Sec-tion 4.1.2), Ring Consistency Statistics (Section 4.1.4),and State Oscillation (Section 4.1.5). Figure 6 plots therelative replay speed against the percentage of nodes onwhich the predicates are enabled. Table 3 summarizesthe results. Results with the case studies from Section 4.2were comparable, giving a 100%-coverage slowdown ofabout 14 with a population of 10 nodes.
Looking at the table first, we see that the three casestudies range from 1.5 to 9 times slower than base-line replay. For comparison, we modified Friday touse software watchpoints in GDB instead of our mem-ory protection-based system, and reran the Ring Consis-tency Statistics predicate. As the table shows, that ex-periment took over 8000 times longer than basic replay,or about 3000 times slower than Friday’s watchpoints.GDB’s software watchpoints are implemented by single-stepping through the execution, which consumes thou-sands of instructions per step. The individual memoryprotection operations used by Friday are even more ex-pensive but their cost can be amortized across thousandsof non-faulting instructions.
Turning to Figure 6, the performance of the RingConsistency Statistics predicate closely matches that ofthe micro-benchmarks in the previous section (cf., Fig-ure 5(b)). This fact is not surprising: performance here is
0123456789
10
0 25 50 75 100
Repl
aySl
owdo
wn(v
s.Ba
sic)
% Watchpoints Enabled
(a)
consistencyoscillation
misdelivery
0
1
2
3
4
5
6
0 25 50 75 100
Occ
urre
nces
/sec
ond
% Watchpoints Enabled
(b)
cons. hits x 100cons. FPs
oscillation brkmisdelivery brk
Figure 6: (a) Replay slowdown statistics for case study predicateperformance vs. percentage of nodes with watchpoints enabled. (b)Watchpoint, breakpoint, and false positive rates vs. percentage of nodeswith watchpoints/breakpoints enabled.
dominated by the false positive rate, because these pred-icates perform little computation when triggered. Fur-thermore, both sets of predicates watch variables locatedon the same page of memory, due to the internal struc-ture of the i3/Chord application, so their false positiverates are the same.
The figure shows that the State Oscillation predicateencounters more breakpoints than the Ring Consistencypredicate does watchpoints. However, handling a break-point is almost free, and the commands are similar incomplexity, so Friday runs much faster for State Oscil-lation predicates.
The Misdelivered Packets case study hit even fewerbreakpoints, and ran the fewest number of commands.Those commands were very resource-intensive, however,requiring dozens of (safe) function calls each time. Over-all performance, as shown in Figure 6(a), is the slowestof the three predicates.
6 Related WorkFriday utilizes library interposition to obtain a re-playable deterministic trace of distributed executions.The WiDS Checker [17] has many similar characteris-tics with some notable differences: whereas Friday op-erates on unmodified applications and checks predicatesat single-machine-instruction granularity, the WiDSChecker is applicable only to applications developedwith the WiDS toolkit and checks predicates at event-handler granularity. Similarly to Friday, Jockey [20]and Flashback [23] use system call interposition, binaryrewriting, and operating system modifications to cap-ture deterministic replayable traces, but only for a singlenode. DejaVu [15] targets distributed Java applications,but lacks the state manipulation facilities of Friday.
Further afield, much research has gone into replay de-bugging via virtualization, which can capture system ef-fects below the system library level, first articulated byHarris [9]. Several projects have pursued that agenda
NSDI ’07: 4th USENIX Symposium on Networked Systems Design & Implementation USENIX Association296

since [11, 13, 23], albeit only for single-thread, single-process, or single-machine applications. Furthermore,symbolic debugging in such systems faces greater chal-lenges than with Friday, since the “semantic gap” be-tween application-defined symbols and the virtual ma-chine interface must be bridged at some computationaland complexity cost.
Moving away from replay debugging, many systemsfocus on extracting execution logs and then mining thoselogs for debugging purposes [1, 2, 5, 6, 10, 22]. Suchsystems face the challenge of reconstructing meaningfuldata- and control-flow from low-level logged monitoringinformation. Friday circumvents this challenge, sinceit can fully inspect the internal state of the nodes in thesystem during a replay of the traced execution and, asa result, need not guess at connections across layers (aswith black-box approaches) or recompile the system (aswith annotation-based systems).
Notable logging-based work in closer alignment withFriday comes from the Bi-directional, DistributedBackTracker (BDB) [14], XTrace [7], and Pip [19]. BDBand XTrace track and report causality among eventswithin a distributed system, e.g., to trace identified back-door programs backwards to their onset or, in the caseof XTrace, to identify problems along cross-layer paths.Pip [19] works by comparing actual behavior and ex-pected behavior to expose bugs. Such behaviors aredefined as orderings of logged operations at participat-ing threads and limits on the values of annotated andlogged performance metrics. In both cases, the kinds ofchecks performed can be readily encoded in Friday, ex-cept for those dependent on kernel-level sensors, whichlie beyond our library tracing granularity. However, thereplay-based nature of Friday allows programmers torefine checks after repeated replays without the need forrecompilation and fresh log extraction, as would be thecase for disambiguating noisy tasks (e.g., directory list-ing filesystem operations in BDB) or for creating newsensors (e.g., heap size monitors when none were ini-tially thought necessary in Pip).
At a more abstract level, model checking has been re-cently proposed as a tool for debugging distributed sys-tems. Most notably, MaceMC [12] is a heuristic modelchecker for finding liveness violations in distributed ap-plications built using the Mace language. As with modelchecking in general, MaceMC can exercise a distributedapplication over many more possible executions than anyreplay debugging system, include Friday, can. Howeverreplay systems, such as Friday, tend to capture more re-alistic problems than model checkers such as complexnetwork failures and hardware malfunctions, and cantypically operate on much longer actual executions thanthe combinatorial nature of model checking can permit.
A growing body of work is starting to look at on-line
debugging [27], in contrast to the off-line nature of de-buggers described above. The P2 debugger [21] operateson the P2 [18] system for the high-level specification andimplementation of distributed systems. Like Friday,this debugger allows programmers to express distributedinvariants in the same terms as the running system, al-beit at a much higher-level of abstraction than Friday’slibc-level granularity. Unlike Friday, P2 targets on-lineinvariant checking, not replay execution. As a result,though the P2 debugger can operate in a completely dis-tributed fashion and without need for log back-hauling,it can primarily check invariants that have efficient on-line, distributed implementations. Friday, however, cancheck expensive invariants such as the existence of dis-joint paths, since it has the luxury of operating outsidethe normal execution of the system.
More broadly, many distributed monitoring systemscan perform debugging functions, typically with a sta-tistical bend [4,28,30]. Such systems employ distributeddata organization and indexing to perform efficient dis-tributed queries on the running system state, but do notcapture control path information equivalent to that cap-tured by Friday.
7 Conclusion and Future WorkFriday is a replay-based symbolic debugger for dis-tributed applications that enables the developer to main-tain global, comprehensive views of the system state.It extends the GDB debugger and liblog replay li-brary with distributed watchpoints, distributed break-points, and actions on distributed state. Friday providesprogrammers with sophisticated facilities for checkingglobal invariants—such as routing consistency—on dis-tributed executions. We have described the design, im-plementation, usage cases, and performance evaluationfor Friday, showing it to be powerful and efficient fordistributed debugging tasks that were, thus far, under-served by commercial or research debugging tools.
The road ahead is ripe for further innovation in dis-tributed debugging. One direction of future work re-volves around reducing watchpoint overheads via thereimplementation of the malloc library call and mem-ory page fragmentation, or through intermediate binaryrepresentations, such as those provided by the Valgrindtool. Building a hybrid system that leverages the limitedhardware watchpoints, yet gracefully degrades to slowermethods, would also be rewarding.
Another high-priority feature is the ability to check-point Friday state during replay. This would allow aprogrammer to replay in Friday a traced session withits predicates from its beginning, constructing any de-bugging state along the way, but only restarting furtherdebugging runs from intermediate checkpoints, withoutthe need for reconstruction of debugging state.
NSDI ’07: 4th USENIX Symposium on Networked Systems Design & ImplementationUSENIX Association 297

We are considering better support for thread-level par-allelism in Friday and liblog. Currently threads exe-cute serially with a cooperative threading model, to orderoperations on shared memory. We have also designed amechanism that supports preemptive scheduling in user-land, and we are also exploring techniques for allowingfull parallelism in controlled situations.
We plan to expand our proof-of-concept cluster-replaymechanism to make more efficient use of the cluster’sresources. Our replay method was designed to ensurethat each replay process is effectively independent andrequires little external communication. Beyond cluster-parallelism, we are developing a version of liblog thatallows replay in-situ on PlanetLab. This technique in-creases the cost of centralized scheduling but avoids thetransfer of potentially large checkpoints and logs.
Further down the road, we want to improve the abilityof the system operator to reason about time. Perhaps ourvirtual clocks could be optimized to track “real” or av-erage time more closely when the distributed clocks arepoorly synchronized. Better yet, it could be helpful tomake stronger statements in the face of concurrency andrace conditions. For example, could Friday guaranteethat an invariant always held for an execution, given allpossible interleavings of concurrent events?
Growing in scope, Friday motivates a renewed lookat on-line distributed debugging as well. Our prior expe-rience with P2 debugging [21] indicates that a higher-level specification of invariants, e.g., at “pseudo-codelevel,” might be beneficially combined with systemlibrary-level implementation of those invariants, as ex-emplified by Friday, for high expressibility yet deep un-derstanding of the low-level execution state of a system.
Acknowledgments: We are indebted to SriramSankararaman for allowing us the use of his Tk imple-mentation, to the anonymous reviewers for their astutefeedback, and to Mike Dahlin for his shepherding efforts.This research was sponsored by NSF under grant numberANI-0133811, by the State of California under MICROgrants #05-060 and #06-150, and by a Fannie and JohnHertz Foundation Graduate Fellowship.
References[1] M. K. Aguilera, J. C. Mogul, J. L. Wiener, P. Reynolds, and
A. Muthitacharoen. Performance Debugging for Distributed Sys-tems of Black Boxes. In SOSP, 2003.
[2] P. Barham, A. Donnelly, R. Isaacs, and R. Mortier. Using Magpiefor Request Extraction and Workload Modelling. In OSDI, 2004.
[3] A. Bavier, M. Bowman, B. Chun, D. Culler, S. Karlin, S. Muir,L. Peterson, T. Roscoe, T. Spalink, and M. Wawrzoniak. Op-erating system support for planetary-scale network services. InNSDI, 2004.
[4] A. R. Bharambe, M. Agrawal, and S. Seshan. Mercury: support-ing scalable multi-attribute range queries. In SIGCOMM, 2004.
[5] A. Chanda, K. Elmeleegy, A. Cox, and W. Zwaenepoel. Cause-way: System Support for Controlling and Analyzing the Execu-tion of Distributed Programs. In HotOS, 2005.
[6] M. Y. Chen, A. Accardi, E. Kıcıman, J. Lloyd, D. Patterson,A. Fox, and E. Brewer. Path-based Failure and Evolution Man-agement. In NSDI, 2004.
[7] R. Fonseca, G. Porter, R. Katz, S. Shenker, and I. Stoica. XTrace:A Pervasive Network Tracing Framework. In NSDI, 2007.
[8] D. Geels, G. Altekar, S. Shenker, and I. Stoica. Replay Debug-ging for Distributed Applications. In USENIX Annual TechnicalConference, 2006.
[9] T. L. Harris. Dependable Software Needs Pervasive Debugging(Extended Abstract). In SIGOPS EW, 2002.
[10] J. Hollingsworth and B. Miller. Dynamic Control of PerformanceMonitoring of Large Scale Parallel Systems. In Super Computing,1993.
[11] A. Joshi, S. T. King, G. W. Dunlap, and P. M. Chen. DetectingPast and Present Intrusions through VulnerabilitySpecific Predi-cates. In SOSP, 2005.
[12] C. Killian, J. W. Anderson, R. Jhala, and A. Vahdat. Life, Death,and the Critical Transition: Finding Liveness Bugs in SystemsCode. In NSDI, 2007.
[13] S. T. King, G. W. Dunlap, and P. M. Chen. Debugging operatingsystems with time-traveling virtual machines. In USENIX AnnualTechnical Conference, 2005.
[14] S. T. King, Z. M. Mao, D. G. Lucchetti, and P. M. Chen. En-riching intrusion alerts through multi-host causality. In NDSS,2005.
[15] R. Konuru, H. Srinivasan, and J.-D. Choi. Deterministic replayof distributed java applications. In IPDPS, 2000.
[16] L. Lamport. Time, Clocks, and the Ordering of Events in a Dis-tributed System. Communications of the ACM, 21(7):558–565,1978.
[17] X. Liu, W. Lin, A. Pan, and Z. Zhang. WiDS Checker: CombatingBugs in Distributed Systems. In NSDI, 2007.
[18] B. T. Loo, T. Condie, J. M. Hellerstein, P. Maniatis, T. Roscoe,and I. Stoica. Implementing Declarative Overlays. In SOSP,2005.
[19] P. Reynolds, J. L. Wiener, J. C. Mogul, M. A. Shah, C. Killian,and A. Vahdat. Pip: Detecting the Unexpected in DistributedSystems. In NSDI, 2006.
[20] Y. Saito. Jockey: A user-space library for record-replay debug-ging. In International Symposium on Automated Analysis-DrivenDebugging, 2005.
[21] A. Singh, P. Maniatis, T. Roscoe, and P. Drushel. Using Queriesfor Distributed Monitoring and Forensics. In EuroSys, 2006.
[22] R. Snodgrass. A Relations Approach to Monitoring ComplexSystems. IEEE Transactions on Computer Systems, 6(2):157–196, 1988.
[23] S. M. Srinivashan, S. Kandula, C. R. Andrews, and Y. Zhou.Flashback: A lightweight extension for rollback and determinis-tic replay for software debugging. In USENIX Annual TechnicalConference, 2004.
[24] I. Stoica, D. Adkins, S. Zhuang, S. Shenker, and S. Surana. Inter-net indirection infrastructure. In SIGCOMM, 2002.
[25] I. Stoica, R. Morris, D. Liben-Nowell, D. R. Karger, M. F.Kaashoek, F. Dabek, and H. Balakrishnan. Chord: A Scal-able Peer-to-peer Lookup Protocol for Internet Applications.IEEE/ACM Transactions of Networking, 11(1):17–32, 2003.
[26] L. Subramanian. Decentralized Security Mechanisms for RoutingProtocols. PhD thesis, University of California at Berkeley, 2005.
[27] J. Tucek, S. Lu, C. Huang, S. Xanthos, and Y. Zhou. AutomaticOn-line Failure Diagnosis at the End-User Site. In HotDep, 2006.
[28] R. van Renesse, K. P. Birman, D. Dumitriu, and W. Vogel. Scal-able management and data mining using Astrolabe. In IPTPS,2002.
[29] R. Wahbe. Efficient data breakpoints. In ASPLOS, 1992.[30] P. Yalagandula and M. Dahlin. A Scalable Distributed Informa-
tion Management System. In SIGCOMM, 2004.
NSDI ’07: 4th USENIX Symposium on Networked Systems Design & Implementation USENIX Association298