_x0001_ · web viewapt report on spectrum monitoring methodology at the border areas no....
TRANSCRIPT
APT REPORT ON
SPECTRUM MONITORING METHODOLOGY AT THE BORDER AREAS
No. APT/AWG/REP-80Edition: September 2017
Adopted by
22nd Meeting of APT Wireless Group25 – 29 September 2017
Busan, Republic of Korea
(Source: AWG-22/OUT-23)

APT/AWG/REP-80
APT REPORT SPECTRUM MONITORING METHODOLOGY AT THE BORDER AREAS
1 Introduction and Scope
Radio spectrum are vital strategic resources for the sustainable development of the global economy and society. Despite the use of improved spectrum utilization techniques and new technologies, it is likely that more spectrum will need to make available to meet the increasing demand for new radio applications. All administrations have sovereign right to use the spectrum on the whole territory of their countries. However, radio wave propagation properties make it challenging to fully preclude signals radiation on the territory of other countries, especially when those signals are transmitted to and from the border area of the country. Therefore, the administrations develop effective bilateral or multilateral agreements on frequency use in border areas to promote efficient spectrum utilization and avoid interference. The AWG have developed one APT Recommendation on “Guidelines for the Frequency Coordination for the Terrestrial Services at the Border Areas between Administrations" in 2006 which was last updated in 2009.
Radio monitoring supports all these functions such as planning, coordination and regulation of the spectrum as it is an important part of spectrum management process, and it could be essential procedure to be used for aiding frequency coordination at the border areas. It is necessary to draft one APT report to serve as a useful reference for the administrations in this region to support frequency coordination affairs.
This report is developed in the effort to summarize the existing technical approaches which could be used by administration in APT countries for spectrum monitoring at the border areas to aid frequency coordination. The purpose of spectrum measurements at border areas is to verify the usage of frequency spectrum at border area in compliance with the frequency coordination agreement among administrations. It could provide the guidance for spectrum monitoring of the terrestrial radio services including fixed service, broadcasting service, land mobile service, maritime mobile service, aeronautical mobile service, and so on at the border areas, if mutual consent has been reached by the concerned administrations.
It should be noted that a number of administrations in this region have specific agreements with their neighbours on the use of frequencies to avoid mutual interference between stations of these services. This report is not intended to be a replacement for any part of the cross-border agreements between administrations. The technical and operational information from the point of view of spectrum monitoring contained herein could help facilitate the sharing of terrestrial services deployed in the neighbouring countries.
2 Requirement of monitoring system
The use of proper measurement instrument is critical to obtaining accurate, reproducible results. Various measuring accessories that may be needed depend on the particular measurement to be performed.
PAGE 2 OF 22
APT/AWG/REP-80
The monitoring equipment/system used in spectrum monitoring at the border areas could be divided into several categories:
- Emission identification equipment.
- Emissions measurement equipment.
- Direction finding system / emission locating system.
- Specialized mobile unit which could be used to check the state of cellular network.
2.1 Emissions measurement equipment
2.1.1 Frequency/bandwidth and RF level measurement
Both spectrum analyzers and radio monitoring receivers may be used for making emissions measurement. The equipment should perform high speed signal search in the spectrum and provides signal demodulation as well as spectrum overview. Both large signal immunity and high sensitivity are required, particularly in the presence of many strong signals.
It can be operated via the front panel or via remote control software. Ethernet interfaces are necessary to control the instrument from a remote computer and to output measurement results. The open interface description for remote control commands and the output data formats should be provided to enable external system integrators to incorporate the instrument into third-party software solutions. The output results may include spectra, waterfall (spectrogram), demodulated audio information, level measurement data, and I/Q baseband data.
The common measurement instrument could be divided into three categories:
- Superheterodyne or swept frequency spectrum analyzer: It is the general workhorse RF test equipment that is capable of looking at signals in the frequency domain. The superheterodyne principle uses a mixer and a second locally generated local oscillator signal to translate the frequency.
- Fast Fourier Transform (FFT) spectrum analyzer: This equipment uses digital signal processing techniques to analyser a waveform with Fourier transforms to provide in depth analysis of signal waveform spectra.
- Monitoring receiver: This equipment uses digital signal processing techniques and implements functionalities, such as detecting unknown signals, identifying interference, spectrum monitoring, and signal search over wide frequency ranges and producing signal content. Some devices also could perform measurements in line with ITU-R Recommendations.
In recent years, a form of measurement instrument, termed a real-time spectrum analyser or real-time receiver, has grown in popularity. These devices capture all the signals within the bandwidth and analyses them in real time. To achieve their performance a real-time devices captures the waveform in memory and then uses a fast Fourier transform technology to analyze the waveform very quickly.
PAGE 3 OF 22

APT/AWG/REP-80
There are some requirement to the specification of the measurement instrument1:
- Frequency range: fulfill the test requirement, normally 1 MHz - 3GHz;
- Resolution bandwidth range: normally 10 Hz - 3 MHz;
- Detectors: auto selection, peak, average, RMS;
- Measurement: include but not limited to Channel power, bandwidth, field strength;
- Marker function: central frequency search, peak search, normal, delta, Band Power, noise;
- Scan mode (monitoring receiver): frequency scan, memory scan, panorama scan.
2.1.2 Signal recognition and modulation measurement
For the analogue modulated signal, most of the spectrum analyzer and standard spectrum monitoring receiver in the market could demodulate the signal and perform the modulation measurement of modulation parameters.
However, for the digital modulated signal, the signal recognition software or instrument is necessary to evaluate the transmission system and key modulation parameters, and then the modulation instrument such as vector signal analyzer and modern digital monitoring receiver will be used to measure of different modulation parameters. The APT Report on application of digital signal processing technology in spectrum monitoring (APT/AWG/REP-64) gives some examples about the modulation recognition systems which identify modulation types in real-time.
2.2 Antenna
The purpose of receiving antennas is to extract the maximum possible signal from the environment and to apply this signal to the input of the receiver.
There are some requirements to the specification of the monitoring antenna:
- Directivity: both the directional antenna and omnidirectional antenna should be used in this measurement. The omnidirectional antennas may be used for general tasks of monitoring when the transmitter position is not known while the directional antennas may be used for specific tasks (technical measurements) when better sensitivity is needed.
- Polarization: vertically and horizontal polarization. Polarization of antennas should correspond to the polarization of the arriving signal wave front.
- Impedance: antenna should match the impedance of the transmission line and receiver input circuits, so as to ensure the maximum transfer of power. Normally 50 ohm.
- Antenna factor or antenna gain and cable loss over the frequency range could be allowed for the correction by control software.
1 The specifications for monitoring receiver listed in the Table 3.3-1 of ITU-R Handbook on Spectrum Monitoring could be used for reference.
PAGE 4 OF 22
APT/AWG/REP-80
2.3 Feeder link
The measurement signal or survey band could apply directly to the spectrum analyzer or receiver via the antenna and cable in the frequency band below 1 GHz. This system has the advantages of being simple to configure and calibrate, it gives a low set-up time and allows easy measurement observations. In some scenario, tunable band-pass filter should be inserted in order to reduce interfering inter-modulation products, especially when the measurement place near the FM radio station or base station of cellular telephone network. However, the use of these band-pass filters requires a stepped measurement where the tuned frequency of the band-pass filter is synchronized with the current measurement frequency of the spectrum analyzer or monitoring receiver.
In the measurement beyond 1 GHz, low noise amplifier (LNA) could be also inserted to improve the gain and noise characteristics of the measurement system. It gives an excellent configuration to measure low level signals. LNA should be inserted close to the antenna to avoid additional attenuation and noise caused by cables. It also should be noted that overload of the measurement system should avoid taking into account that the maximum measurable level without overloading the equipment then depends on the capabilities of the LNA rather than the spectrum analyzer or receiver itself. The typical noise figure of LNA should lower than 2dB and the gain should be in the range of 30 - 40dB. In order to accurately measure the power level, the flatness of LNA should be better than ± 0.5dB.
2.4 Complementary accessories
The low loss cable should be used to improve the sensitivities of the measurement system, especially when perform the measurement in the frequency band beyond 18 GHz. The RF adapter and switch unit may also be useful to match the feeder link. Global Positioning System receiver could continuously update the exact location of the measurement unit, in particular in the operation of the mobile unit, and a compass measures the orientation of the vehicle or directional antenna with respect to North. The digital map is necessary to display the contour of mobile unit, bearing lines and their cross-point which allow the operator to easily find the estimated position of the emission, locations of licensed stations, and other complementary information. Data storage device should be used to save the result of measurement, such as spectrum graph, demodulated audio, I/Q raw data and other associated information.
3 Measurement of general purpose
3.1 Determination of measurement sites
The measurement sites should be in the locations which might be definitely designated in the cross-border agreement or be selected by the administration concerned and these sites are normally near the borderline. If the surrounding conditions of interested location do not comply with the measurement requirement, the measurement site should be adjusted to appropriate place in the vicinity. In some case, the ship could be used as the measurement platform to perform the measurement along the boundary if the river is the borderline.
PAGE 5 OF 22

APT/AWG/REP-80
The quantity and type of radiocommunication station/equipment in the destination area are key factors to plan and perform the measurement. These areas, inter alia, the frontier port, the airport, the seaport and the residential areas in which a number of radiocommunication station/equipment were intensively used or critical radiocommunication system was deployed, might be identified as important monitoring area, whilst the rural areas attract less attentions. The candidate measurement site should be close to the destination area to increase the geographic coverage, especially for the measurement in the frequency bands above 30 MHz.
The measurement site should be located in places suited to the zone to be monitored. Sufficient clearance with respect to nearby obstacles, such as hills, buildings, large trees and other man-made or nature features, may improve the situation substantially. These sites should be free from strong emissions and other sources of interference because, dependent upon the frequency ranges to be covered, the presence of nearby radio transmitters may severely limit the monitoring capabilities due to intermodulation and blocking effects. The band pass filter may be implemented if the measurement place had to be close to the high power transmissions.
The measurement could be performed by the fixed monitoring station in the vicinity of borderline or by the portable and mobile monitoring station which could be setup along in the border area when the measurement locations were not designated in the cross-border agreement.
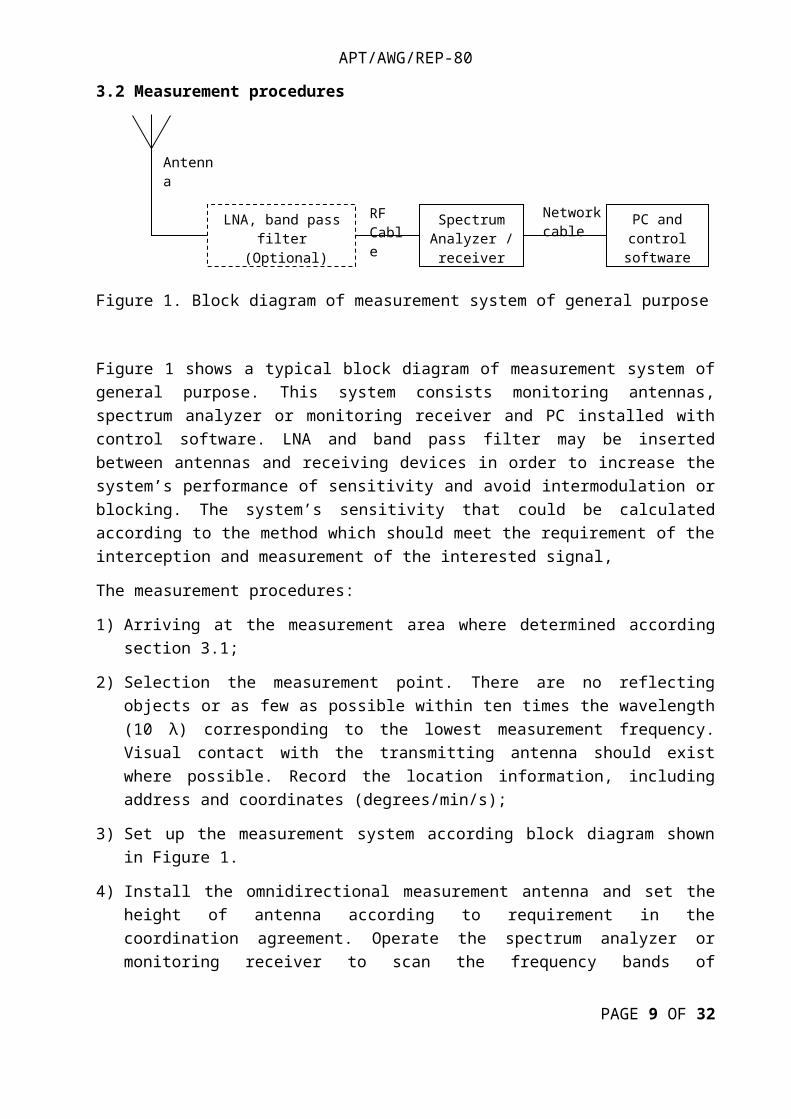
3.2 Measurement procedures
Figure 1. Block diagram of measurement system of general purpose
Figure 1 shows a typical block diagram of measurement system of general purpose. This system consists monitoring antennas, spectrum analyzer or monitoring receiver and PC installed with control software. LNA and band pass filter may be inserted between antennas and receiving devices in order to increase the system’s performance of sensitivity and avoid intermodulation or blocking. The system’s sensitivity that could be calculated according to the method which should meet the requirement of the interception and measurement of the interested signal,
The measurement procedures:
1) Arriving at the measurement area where determined according section 3.1;
2) Selection the measurement point. There are no reflecting objects or as few as possible within ten times the wavelength (10 λ) corresponding to the lowest measurement frequency.
PAGE 6 OF 22
Network cable
RF CableLNA, band pass filter
(Optional)
Antenna
PC and control
software
Spectrum Analyzer / receiver
APT/AWG/REP-80
Visual contact with the transmitting antenna should exist where possible. Record the location information, including address and coordinates (degrees/min/s);
3) Set up the measurement system according block diagram shown in Figure 1.
4) Install the omnidirectional measurement antenna and set the height of antenna according to requirement in the coordination agreement. Operate the spectrum analyzer or monitoring receiver to scan the frequency bands of interested, set the receiving devices in max hold mode for several minutes, and record all the signals in these bands;
5) Install the vertical polarization directional (in horizontal plane) measurement antenna. Rotate and adjust the direction of antenna until the level of the interested signal is maximum, record the angel of arrival and the level. Then, install the horizontal polarization directional (in horizontal plane) measurement antenna pointed it to the direction of the signal, and measure the level. Compare this two levels and determine the polarization of each signal and record the results (central frequency/polarization/angel of arrival).
6) Measurement the signals with same polarization directional antenna. Set the interested signal displayed around the central frequency of receiving device and the bandwidth of device equals approximately two times of bandwidth2 of the signal. The receiving device should be set in max hold mode for several minutes and read the measurement results, including central frequency, bandwidth and signal level. The direction of antenna, setup parameters of the device and those measurement results in associate with snapshot of the signal should be recorded. If the direction finding equipment is available, the measurement result of direction of signal will be much more accurate than using the directional antennas.
- Continuous signal: In case of the channel power measurement function is integrated in the receiving device, the receiving power level of continuous signal except pulsed signal could be measured with this function. The levels also can directly be measured with marker function using the correct measurement bandwidth and the respective detector. However, digital signals are sometimes wider in bandwidth than the highest measurement bandwidth available to the equipment. If the RF energy of the signal is evenly spread over the whole bandwidth, all levels can also be measured using a smaller measurement bandwidth and correcting the result with the following formulae:
P = Pm + 10*log (signal bandwidth/RBW) (1)
where:
P: total signal level in dBm
Pm: measured level in a smaller RBW
This method is not applied to digital signals using Gaussian filtering and analogue modulated signals.
- Pulsed signal: The time domain function of spectrum analyzer could be used to measure the receiving power level of pulsed signal, such as TDMA and radar signals. If the spectrum analyzer is not available, the pulsed signal level could be read out and
2 The TABLE 4.3-1 of ITU-R Handbook on Spectrum Monitoring shows necessary measurement bandwidths for some common radio systems.
PAGE 7 OF 22

APT/AWG/REP-80
calculated in monitoring receiver. For FSK or MSK modulated signals, the peak reading is also the average burst level. For other modulated signals, the average burst level can be calculated from the long-term RMS reading, provided the pulse/pause ratio remains constant over the whole measurement time:
Pav-burst = PRMS + 10*log (T/τ) (2)
where:
Pav-burst: average burst level (dBm)
PRMS: long term RMS reading of the receiver in dBm
T: burst period (s)
τ: burst length (s)
The T and τ could be measured by analyzed the waterfall or spectrogram displays (two dimensional displays of signal frequency versus time, with signal amplitude indicated by color).
7) Signal analysis if the specialized hardware and software is available. The signal analysis operation may include the signal classification, recognition and identification in order to perform such tasks as identification of users of the spectrum and localizing the origin of signals. The output of signal analysis should be the modulation type, typical modulation parameters and signal carrier communication system.
8) At least two measurements should be performed in two different measurement sites in every measurement area. The operation 2) – 8) should be performed in each measurement place. The location of transmission could be determined by the lines of bearing measured in different measurement places.
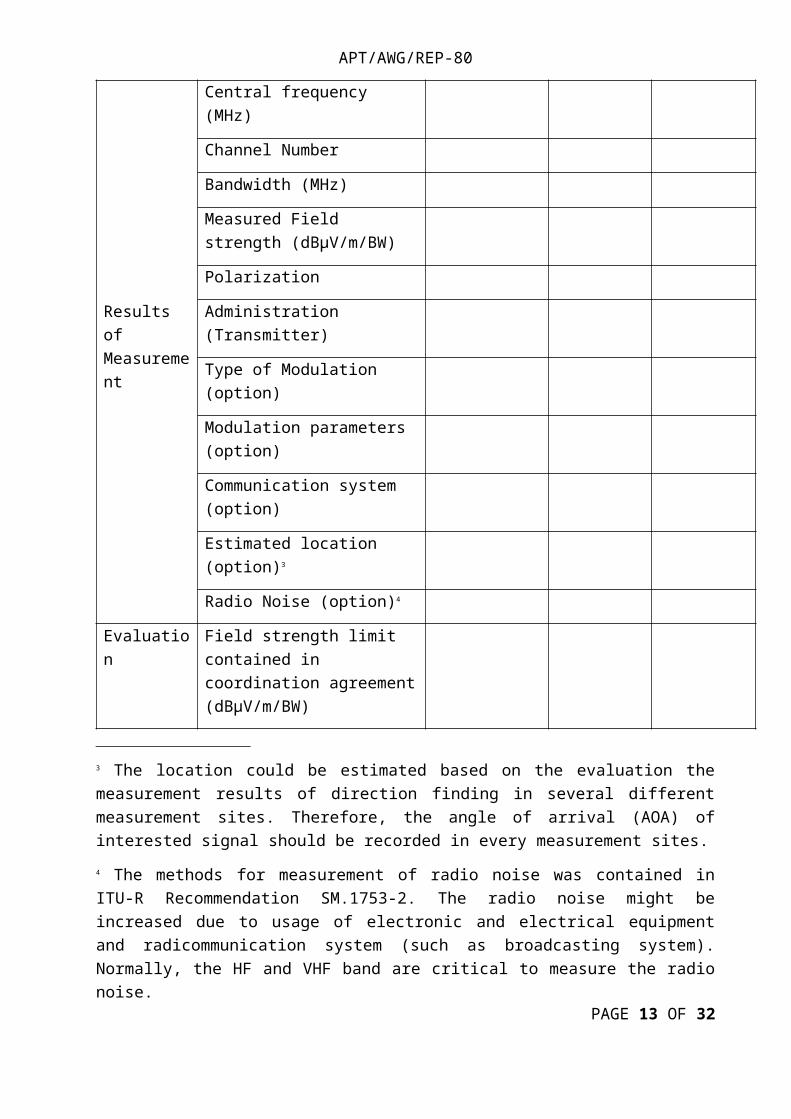
3.3 Result presentation
Measurement results can be presented in tabular form, as an example shown in Table 1:
Table 1: Example of measurement results for general purpose
Measurement site 1
Measurement site 2
Measurement site …
Condition during Measurement
Date DD/MM/YYYY
Time period HH/MM to HH/MM
Location name
Longitude (E)
Latitude (N)
Distance to Border (km)
PAGE 8 OF 22
APT/AWG/REP-80
Height of antenna (m)
Information of Tx Location in neighbouring countries
Results of Measurement
Central frequency (MHz)
Channel Number
Bandwidth (MHz)
Measured Field strength (dBµV/m/BW)
Polarization
Administration (Transmitter)
Type of Modulation (option)
Modulation parameters (option)
Communication system (option)
Estimated location (option)3
Radio Noise (option)4
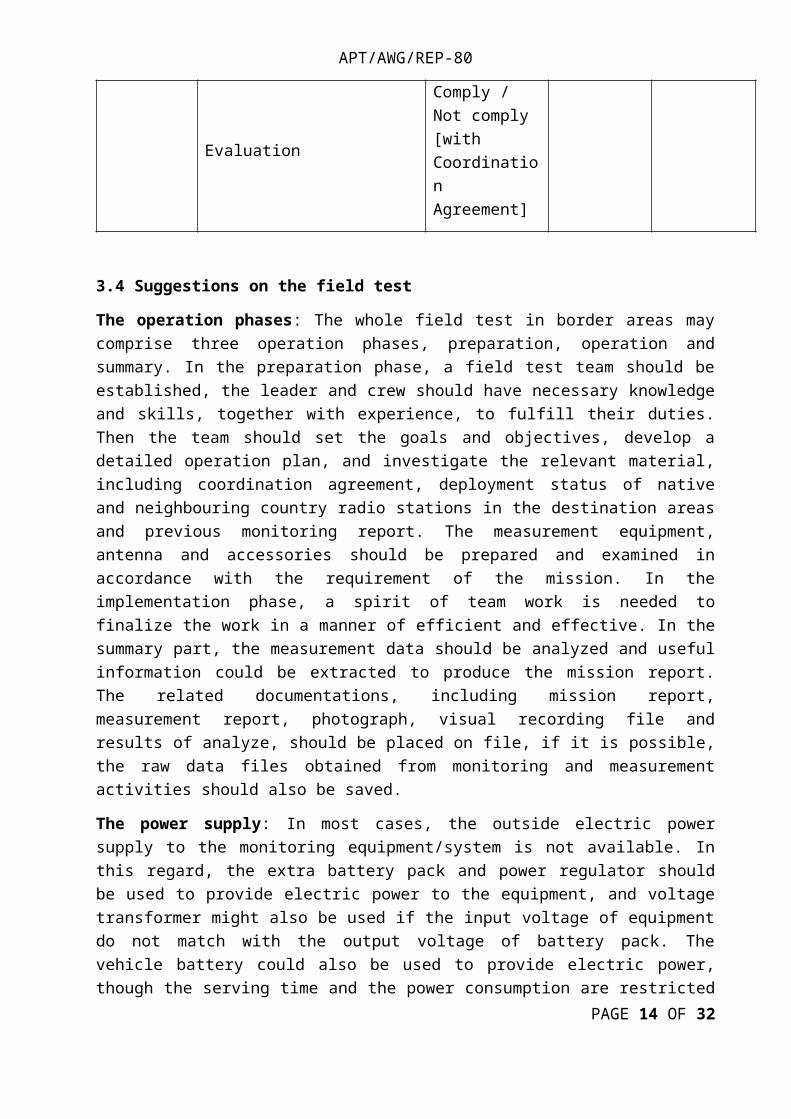
Evaluation
Field strength limit contained in coordination agreement (dBµV/m/BW)
Evaluation
Comply / Not comply [with Coordination Agreement]
3.4 Suggestions on the field test
The operation phases: The whole field test in border areas may comprise three operation phases, preparation, operation and summary. In the preparation phase, a field test team should be established, the leader and crew should have necessary knowledge and skills, together with experience, to fulfill their duties. Then the team should set the goals and objectives, develop a
3 The location could be estimated based on the evaluation the measurement results of direction finding in several different measurement sites. Therefore, the angle of arrival (AOA) of interested signal should be recorded in every measurement sites.
4 The methods for measurement of radio noise was contained in ITU-R Recommendation SM.1753-2. The radio noise might be increased due to usage of electronic and electrical equipment and radicommunication system (such as broadcasting system). Normally, the HF and VHF band are critical to measure the radio noise.
PAGE 9 OF 22

APT/AWG/REP-80
detailed operation plan, and investigate the relevant material, including coordination agreement, deployment status of native and neighbouring country radio stations in the destination areas and previous monitoring report. The measurement equipment, antenna and accessories should be prepared and examined in accordance with the requirement of the mission. In the implementation phase, a spirit of team work is needed to finalize the work in a manner of efficient and effective. In the summary part, the measurement data should be analyzed and useful information could be extracted to produce the mission report. The related documentations, including mission report, measurement report, photograph, visual recording file and results of analyze, should be placed on file, if it is possible, the raw data files obtained from monitoring and measurement activities should also be saved.
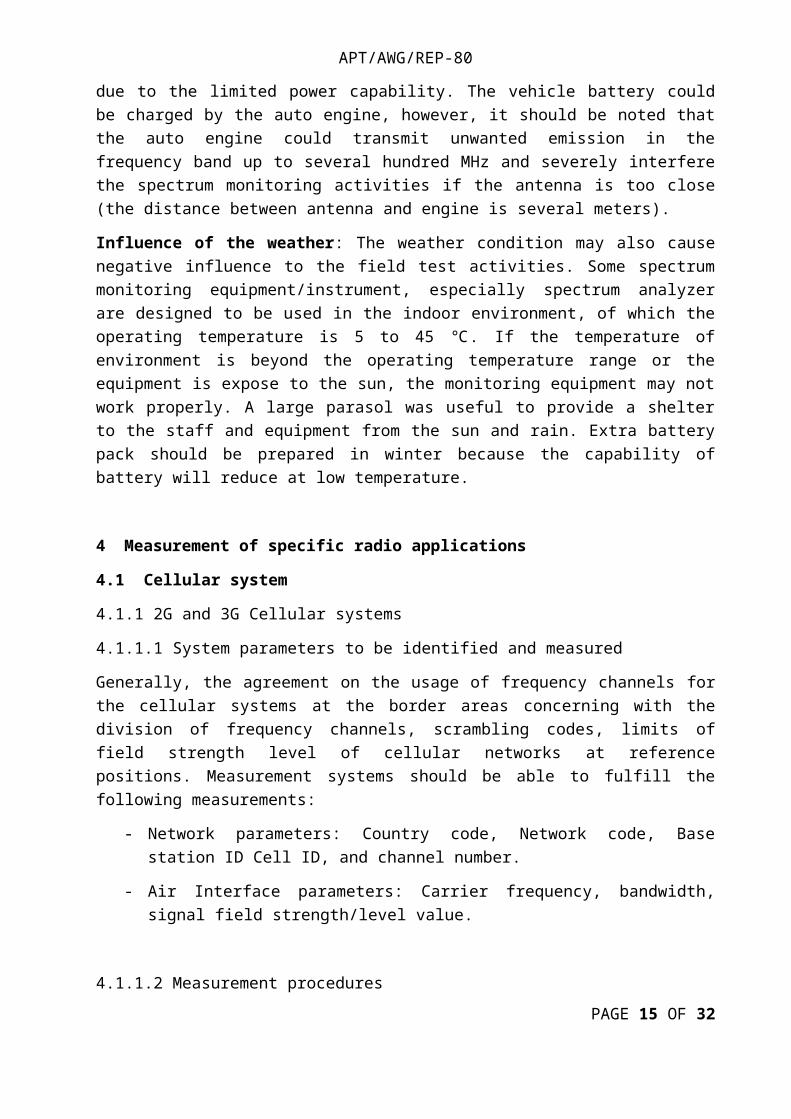
The power supply: In most cases, the outside electric power supply to the monitoring equipment/system is not available. In this regard, the extra battery pack and power regulator should be used to provide electric power to the equipment, and voltage transformer might also be used if the input voltage of equipment do not match with the output voltage of battery pack. The vehicle battery could also be used to provide electric power, though the serving time and the power consumption are restricted due to the limited power capability. The vehicle battery could be charged by the auto engine, however, it should be noted that the auto engine could transmit unwanted emission in the frequency band up to several hundred MHz and severely interfere the spectrum monitoring activities if the antenna is too close (the distance between antenna and engine is several meters).
Influence of the weather: The weather condition may also cause negative influence to the field test activities. Some spectrum monitoring equipment/instrument, especially spectrum analyzer are designed to be used in the indoor environment, of which the operating temperature is 5 to 45
. If the temperature of environment is beyond the operating temperature range or the℃ equipment is expose to the sun, the monitoring equipment may not work properly. A large parasol was useful to provide a shelter to the staff and equipment from the sun and rain. Extra battery pack should be prepared in winter because the capability of battery will reduce at low temperature.
4 Measurement of specific radio applications
4.1 Cellular system
4.1.1 2G and 3G Cellular systems
4.1.1.1 System parameters to be identified and measured
Generally, the agreement on the usage of frequency channels for the cellular systems at the border areas concerning with the division of frequency channels, scrambling codes, limits of field strength level of cellular networks at reference positions. Measurement systems should be able to fulfill the following measurements:
- Network parameters: Country code, Network code, Base station ID Cell ID, and channel number.
- Air Interface parameters: Carrier frequency, bandwidth, signal field strength/level value.
PAGE 10 OF 22

Network Analyzer
PC and control
software
Antenna
Network cable
GPS
APT/AWG/REP-80
4.1.1.2 Measurement procedures
1) Arriving at the measurement area where determined according section 3.1;
2) Selection the measurement site which normally on the ground. Record the location information, including address and coordinates (degrees/min/s);
3) Find out the channels/frequencies which are being occupied by the interested cellular network using the mobile units equipped with specialized applications which could check the state of cellular network.
4) Measurement of network parameters which are listed in Table 2 using the network analyzer.
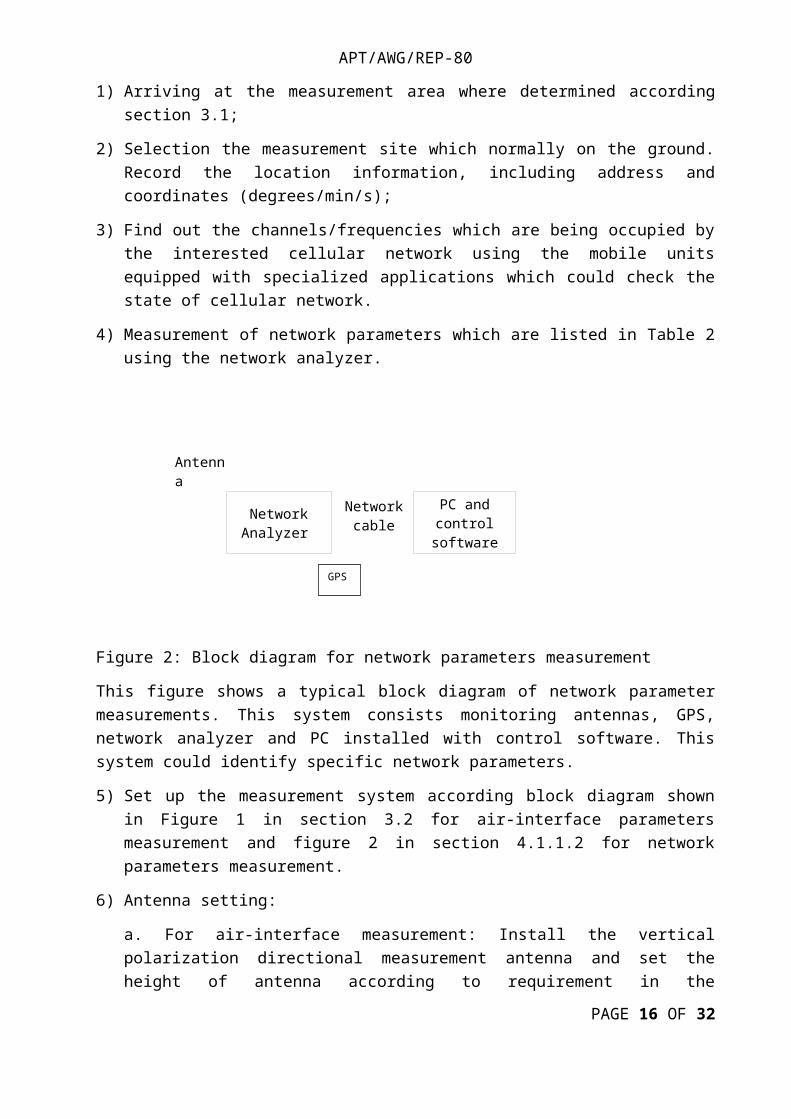
Figure 2: Block diagram for network parameters measurement
This figure shows a typical block diagram of network parameter measurements. This system consists monitoring antennas, GPS, network analyzer and PC installed with control software. This system could identify specific network parameters.
5) Set up the measurement system according block diagram shown in Figure 1 in section 3.2 for air-interface parameters measurement and figure 2 in section 4.1.1.2 for network parameters measurement.
6) Antenna setting:
a. For air-interface measurement: Install the vertical polarization directional measurement antenna and set the height of antenna according to requirement in the coordination agreement, such as 1.5m or 3m. Adjust the direction of antenna until the level of the interested signal in receiving device is maximum. Determine the direction of each signal and record the results.
b. For network parameter measurement: install the antenna to network analyzer. No need to adjust polarization for antenna installation.
7) Measurement the central frequencies, bandwidths of interested signals with spectrum analyzer for air-interface parameter measurement or network parameter measurement for network parameter measurement.
8) Measurement of the field strength of interested signals.
PAGE 11 OF 22

APT/AWG/REP-80
- Method 1: The spectrum analyzer or spectrum monitoring receiver should be set in max hold mode for not less than 1 minutes and read the measurement results. The power level of signal could be calculated with formula (1) or (2) described in section 3.2.
- Method 2: The receiving device make a measurement over a long-time period, such as 1, 10 or 15 minutes, the statistical results including 90% value (10%), 10% value and median value.
- Method 3: Measurement the spatial distribution of field strength could realize high reliability estimation of the expected field strength at a point. The section 4.4.3.1.3 of ITU-R Handbook on Spectrum Monitoring could be considered as reference in this case.
4.1.1.3 Result presentation
Measurement results for air-interface parameter measurement can be presented in tabular form, as an example shown in Table 1 section 3.3. While, the network parameter measurement results, as an example shown in Table 2. The field strength level may also be displayed together with the measurement point coordination on the digital map.
Table 2: Example of network parameter measurement results for cellular systems
Measurement site 1
Measurement site 2
Measurement site …
Condition during Measurement
Date DD/MM/YYYY
Time period HH/MM to HH/MM
Location name
Longitude (E)
Latitude (N)
Distance to Border (km)
Height of antenna (m)
Configuration of Network
Radio SystemGSM/CDMA/WCDMA/TD-SCDMA
GSMChannel number
Frequency (MHz)
WCDMA / TD-SCDMA / CDMA
Frequency band (MHz)
PAGE 12 OF 22
APT/AWG/REP-80
Results of Measurement
Country code (MCC)
Network code (MNC)
Operator
GSM/WCDMA/TD-SCDMA
Location Area Code (LAC)
Cell ID (CID)
CDMA
System ID (SID)
Network ID (NID)
Base ID (BID)
Central frequency (MHz)
Bandwidth (MHz)
Measured Field strength (dBµV/m/BW)
Evaluation
Type of Channel / Frequency band
Shared / Name of Administration preferential
Field strength limit (dBµV/m/BW)
Evaluation
Comply / Not comply [with Coordination Agreement]
4.1.2 4G Cellular systems
4.1.2.1 System parameters to be identified and measured
The agreement on the usage of frequency channels for the 4G cellular systems at the border areas concerning with the division of frequency channels, limits of field strength level of cellular networks at reference positions. Measurement systems should be able to fulfill the following measurements:
- Network parameters: Country code, Network code, e-Node Base station ID, Cell ID and Tracking Area Code.
- Air-Interface parameters: Carrier frequency, bandwidth, signal field strength/level value.
PAGE 13 OF 22
APT/AWG/REP-80
4.1.2.2 Measurement procedures
Step 1) to 3) are the same with these procedures in section 4.1.1.2;
4) Measurement of network parameters which are listed in Table 3 using the network analyzer.
Step 5) to 6) are the same with these procedures in section 4.1.1.2;
7) Measure the central frequencies and bandwidths of interested signals with spectrum analyzer or spectrum monitoring receiver. The traditional spectrum monitoring receiver should not be used if the bandwidth of the interested signal is larger than the IF bandwidth of the receiver.
8) Measurement of the field strength of interested signals.
- Method 1: The spectrum analyzer or spectrum monitoring receiver should be set in max hold mode for not less than 1 minutes and read the measurement results. The power level of signal could be calculated with formula (1) or (2) described in section 3.2.
- Method 2: The receiving device make a measurement over a long time period, such as 1, 10 or 15 minutes, the statistical results including 90% value (10%), 10% value and median value.
- Method 3: Measurement the spatial distribution of field strength could realize high reliability estimation of the expected field strength at a point. The section 4.4.3.1.3 of ITU-R Handbook on Spectrum Monitoring could be considered as reference in this case.
4.1.2.3 Result presentation
Measurement results for air-interface parameter measurement can be presented in tabular form, as an example shown in Table 1 section 3.3. While, the network parameter measurement results, as an example shown in Table 3. The field strength level may also be displayed together with the measurement point coordination on the digital map.
Table 3: Example of measurement results for 4G cellular systems
Measurement site 1
Measurement site 2
Measurement site …
Condition during Measurement
Date DD/MM/YYYY
Time period HH/MM to HH/MM
Location name
Longitude (E)
PAGE 14 OF 22
APT/AWG/REP-80
Latitude (N)
Distance to Border (km)
Height of antenna (m)
Operating frequency band
Results of Measurement
Radio System FDD-LTE/TD-LTE
E-UTRAN Absolute Radio Frequency Channel Number
Country code (MCC)
Network code (MNC)
Tracking Area Code
Physical Cell ID (PCI)
E-NodeB ID
Central frequency (MHz)
Bandwidth (MHz)
Frequency band (MHz)
Measured Field strength (dBµV/m/BW)
Operator
Evaluation
Type of Channel / Frequency band
Shared / Name of Administration preferential
Field strength limit (dBµV/m/BW)
Evaluation
Comply / Not comply [with Coordination Agreement]
4.2 Broadcasting system
Considering the spectrum usage, it should be noted that the broadcasting service, especially FM audio broadcast and TV broadcast, applies extremely high transmission power over large portions of the spectrum in the frequency band below 1 GHz (VHF and lower part of UHF),
PAGE 15 OF 22
APT/AWG/REP-80
very close to critical applications, including aeronautical navigation and communication system. Therefore, the monitoring and measurement activities of broadcasting system in the border areas are attached great importance to prevent the interference to other existing radiocommunication service as well as facilitate provision of broadcasting service to the local citizens.
The monitoring and measurement activities of FM audio broadcast signal could be performed with monitoring system in Figure 1, utilizing the demodulation function of spectrum analyzer or spectrum monitoring receiver. The additional demodulation equipment and audio recording equipment may also be used to demodulate and record multi-channel output audio signals simultaneously to improve the efficiency of the spectrum monitoring task, especially for the surveillance of multiple signals in the FM broadcasting band.
For TV broadcast signal, the specific demodulation and content recording equipment are needed to identify the operators, measure the transmission characteristics and evaluate of the quality of service. It should be noted that the acoustic signal of the analog television broadcasting may fall into the frequency band of FM broadcasting and the it could be identified by the frequency difference of 6.5 MHz between acoustic and picture signal of one analogue TV broadcasting signal.
4.2.1 Measurement procedure
Measurement procedures:
1) Arriving at the measurement area where determined according section 3.1;
2) Selection the measurement point. There are no reflecting objects or as few as possible within ten times the wavelength (10 λ) corresponding to the lowest measurement frequency. Visual contact with the transmitting antenna should exist where possible. Record the location information, including address and coordinates (degrees/min/s);
3) Set up the measurement system according block diagram shown in Figure 1, additional equipment may be needed.
4) Install the omnidirectional measurement antenna and set the height of antenna equals 10 meters (or according to requirement in the coordination agreement). Operate the spectrum analyzer or monitoring receiver to scan the frequency bands of interested, set the receiving devices in max hold mode for several minutes, and record all the signals in these bands;
5) Install the vertical polarization directional (in horizontal plane) measurement antenna. Rotate and adjust the direction of antenna until the level of the interested signal is maximum, record the angel of arrival and the level. Then, install the horizontal polarization directional (in horizontal plane) measurement antenna pointed it to the direction of the signal, and measure the level. Compare these two levels and determine the polarization of each signal and record the results (central frequency/polarization/angel of arrival).
6) Measurement the level of signals with same polarization directional antenna. Set the interested signal displayed around the central frequency of receiving device and the bandwidth of device equals approximately two times of bandwidth of the signal (FM: 120 kHz, analog TV: 120 kHz, although occupied bandwidth is 8 MHz, nearly all energy is in the vision carrier for which 120 kHz is sufficient, digital TV: 6/7/8 MHz). The receiving device should be set in max
PAGE 16 OF 22

APT/AWG/REP-80
hold mode for several minutes and read the measurement results, including central frequency, bandwidth and signal level.
7) Measurement and record of audio content of the FM broadcasting signal and visual content of the TV broadcasting signal, if possible.
8) The direction of antenna, setup parameters of the device and those measurement results in associate with snapshot of the signal should be recorded. If the direction finding equipment is available, the measurement result of direction of signal will be much more accurate than using the directional antennas.
4.2.2 Result presentation
Measurement results can be presented in tabular form, as an example shown in Table 4:
Table 4: Example of measurement results of broadcasting system
Measurement site 1
Measurement site 2
Measurement site …
Condition during Measurement
Date DD/MM/YYYY
Time period HH/MM to HH/MM
Location name
Longitude(E)
Latitude(N)
Distance to Border (km)
Height of antenna (m)
Results of Measurement
Radiocommunication System FM/TV
FM/ Digital
TV
Central frequency (MHz)
Bandwidth (MHz)
Measured Field Strength (dBµV/m/BW)
Language
Content
Administration (Transmitter)
Analog TV
Central frequency of acoustic signal (MHz)
PAGE 17 OF 22

APT/AWG/REP-80
Bandwidth of acoustic signal (MHz)
Central frequency of picture signal (MHz)
Bandwidth of picture signal (MHz)
Language
Content
Administration (Transmitter)
Evaluation
Field strength limit (dBµV/m/BW)
Evaluation
Comply / Not comply [with Coordination Agreement]
PAGE 18 OF 22

APT/AWG/REP-80
Annex 1
References
1. ITU Spectrum Monitoring Handbook 2011 (Chapter IV - Measurement of field strength)2. Rec. ITU-R SM.378-7 (Field-strength measurements at monitoring stations)3. Rec. ITU-R SM.1708-1 (Field-strength measurements along a route with geographical
coordinate registrations)4. Rec. ITU-R BT.417-5 (Minimum field strengths for which protection may be sought in
planning an analogue terrestrial television service)5. ITU-R Recommendation SM.1753-2 (Methods for measurements of radio noise)
PAGE 19 OF 22
APT/AWG/REP-80
Annex 2
Case study in Indonesia on field strength measurement procedure of broadcasting system
This annex indicated the field strength measurement procedure of broadcasting system in Indonesia. The measurement configuration was shown in Figure 1.
Figure 1. Measurement Configuration
Measurement Procedure:
1. Select the antenna according to the frequency band to be measured
a. The recommended antenna is a dipole.b. Install antenna on mounting with altitude ≥10 mc. The polarization is adjusted to the polarization of the transmitting antenna
(horizontal)d. Antenna (dipole ½ λ) is directed to:
Service area center for FM radio broadcast area service quality measurement Transmitters for TV service area quality measurement
2. Field strength measurement can be done using one of 2 types of measuring instruments Field Strength Meter (FSM), Spectrum Analyzer (SPA):1) Field strength measurement with Field Strength Meter (FSM)
- Use FSM device default antenna (this type of antenna usually dipole ½ λ)- Setting antenna:
a. The antenna element is adjusted to the frequency to be measuredb. The length of the antenna element at maximum positionc. Set the element length according to the frequency to be measuredd. Especially for UHF TV frequencies, adjust the antenna impedance to the frequency
to be measurede. Install the antenna according to the transmitter polarization
- FSM in ON condition- Set the frequency to be measured- Set mode as follow:
a. FM: For FM field strength measurements (center frequency);b. AM: For measurement of analog TV field strength (video carrier).
- Set FSM bandwidth at BW = 120 kHz (for FM and TV field strength measurements)
PAGE 20 OF 22
h ≥ 10 m
Antenna
RF cable ≥10 m
(FSM/SPA/Receiver)

APT/AWG/REP-80
- Set attenuation = 0 dB- Perform internal calibration by pressing Cal button- Record the measurements on the designation of the highest field strength value (emax)
and the lowest field strength value (emin)- Record the measurements on the designation of the highest field strength value (emax)
and the lowest field strength value (emin)- The measurement results obtained by calculating the average field strength using the
equation:
e=emax+emin
2
Note :e: average field strength (dBμV/m)emax: highest field strength (dBμV/m)emin: lowest field strength (dBμV/m)
2) Field strength measurement with Spectrum Analyzer (SPA)The dynamic range of SPA should be no less than 60 dB. The zero-span method (ITU-R Recommendation SM.378-7) may be used.
- Use field strength measurement antenna;- Setting the antenna:
a. The antenna element is adjusted at frequency to be measuredb. The length of the antenna element at maximum positionc. Set the element length according to the frequency to be measuredd. Especially for UHF TV frequencies, adjust the antenna impedance to the
frequency to be measurede. Install the antenna according to the transmitter polarization
- SPA in ON condition- Data input k antenna factor and cable attenuation to SPA- Set center frequency according to transmitter carrier frequency- Set span frequency to 0 Hz (zero-span) (*)- Set Resolution Bandwidth (RBW) to 30 kHz (for FM and TV field strength
measurements)- Set Video Bandwidth (VBW) to 30 kHz (for FM and TV field strength measurements)- Set attenuation: 0 dB- Set trace to Max Hold and wait for 2 minutes- Stop SPA sweep by pressing Hold / View button- Set the marker position at the top of the signal- The measurement results in dBμV / m- If SPA does not support data input feature k factor of antenna, hence unit of
measurement result obtained in the form:dBμV, must be converted to dBμV/m units using the equation:
e=v0+k+ac
Note:e = field strength (dBμV/m)Vo = output voltage (dBμV)K = antenna factor (dB/m)ac = cable attenuation (dB)
PAGE 21 OF 22

APT/AWG/REP-80
dBm, the reading result should be converted to dBμV / m units using the equation:e=p0+k+ac+107
Note:e = field strength (dBμV / m)Po = output power (dBm)K = antenna factor (dB / m)Ac = cable attenuation (dB)Note: coefficient 107 is used for the 50 ohm antenna system.
Additional note:
For SPA already equipped with field strength measurement option, no need to change the span to 0 Hz. The antenna system needs to be selected on the field's strong field measurement option menu according to the antenna used.
PAGE 22 OF 22