*x007/13/02* - scottish qualifications authority any rough working should be done on the question...
TRANSCRIPT

HTP
X007/13/02
*X007/13/02* ©
BIOLOGYADVANCED HIGHER
SECTION A—Questions 1–25 (25 marks)
Instructions for completion of Section A are given on Page two.
SECTIONS B AND C
The answer to each question should be written in ink in the answer book provided. Any additional paper (if used) should be placed inside the front cover of the answer book.
Rough work should be scored through.
Section B (55 marks)
All questions should be attempted. Candidates should note that Question 8 contains a choice.
Question 1 is on Pages 10, 11 and 12. Question 2 is on Page 13 and Question 3 is on Page 14. Pages 12 and 13 are fold-out pages.
Section C (20 marks)
Candidates should attempt the questions in one unit, either Biotechnology or Animal Behaviour or Physiology, Health and Exercise.
N A T I O N A LQ U A L I F I C A T I O N S2 0 1 5
w E D N E S D A Y , 1 3 M A Y1 . 0 0 P M – 3 . 3 0 P M

Page two[X007/13/02]
Read carefully
1 Check that the answer sheet provided is for Biology Advanced Higher (Section A).
2 For this section of the examination you must use an HB pencil and, where necessary, an eraser.
3 Check that the answer sheet you have been given has your name, date of birth, SCN (Scottish Candidate Number) and Centre Name printed on it.
Do not change any of these details.
4 If any of this information is wrong, tell the Invigilator immediately.
5 If this information is correct, print your name and seat number in the boxes provided.
6 The answer to each question is either A, B, C or D. Decide what your answer is, then, using your pencil, put a horizontal line in the space provided (see sample question below).
7 There is only one correct answer to each question.
8 Any rough working should be done on the question paper or the rough working sheet, not on your answer sheet.
9 At the end of the examination, put the answer sheet for Section A inside the front cover of the answer book.
Sample Question
Which of the following molecules contains six carbon atoms?
A Glucose
B Pyruvic acid
C Ribulose bisphosphate
D Acetyl coenzyme A
The correct answer is A—Glucose. The answer A has been clearly marked in pencil with a horizontal line (see below).
Changing an answer
If you decide to change your answer, carefully erase your first answer and using your pencil, fill in the answer you want. The answer below has been changed to D.
A
A
B
B
C
C
D
D

[Turn overPage three[X007/13/02]
1. Which line in the table below correctly shows components of cell structure found in prokaryotic cells? (✓ = present x = absent)
Cell wall
Plasmamembrane
Microtubules Ribosomes
A ✓ ✓ x ✓
B x ✓ ✓ ✓
C ✓ x x ✓
D x x x x
2. The role of cytokinesis is to
A shorten spindle fibres
B move chromatids
C form two nuclei
D divide cytoplasm.
3. The diagram below represents the lac operon in E. coli.
Which line in the table correctly identifies the conditions required for transcription of the structural gene?
Inducer Operator
A present blocked
B present not blocked
C absent blocked
D absent not blocked
4. Which line in the table below correctly matches checkpoint conditions with the stage of the cell cycle where they apply?
Success of DNA replication
Cell size
Chromosome alignment
A S G1 M
B G2 M S
C G2 G1 M
D S G1 G2
5. To determine how the fatty acid composition of breast milk was affected by diet, samples were collected from two groups of women. The diet of one group consisted entirely of plants (vegan). The other diet included food from both plant and animal sources (mixed).
For the two diets, the table below shows the concentrations of fatty acid (mg g–1) in the breast milk and the number of double bonds each fatty acid contains.
Fatty acid
Double bonds
Vegan(mg g–1)
Mixed(mg g–1)
Lauric 0 39 33
Myristic 0 68 80
Palmitic 0 166 276
Stearic 0 52 108
Palmitoleic 1 12 36
Oleic 1 313 353
Linoleic 2 317 69
Linolenic 3 15 8
A comparison of total saturated fatty acids in the two diets shows the ratio of vegan : mixed is
A 0·65 : 1
B 0·94 : 1
C 2·0 : 1
D 2·8 : 1
SECTION A
All questions in this section should be attempted.
Answers should be given on the separate answer sheet provided.
Regulatorgene
StructuralgeneOperator
Page four[X007/13/02]
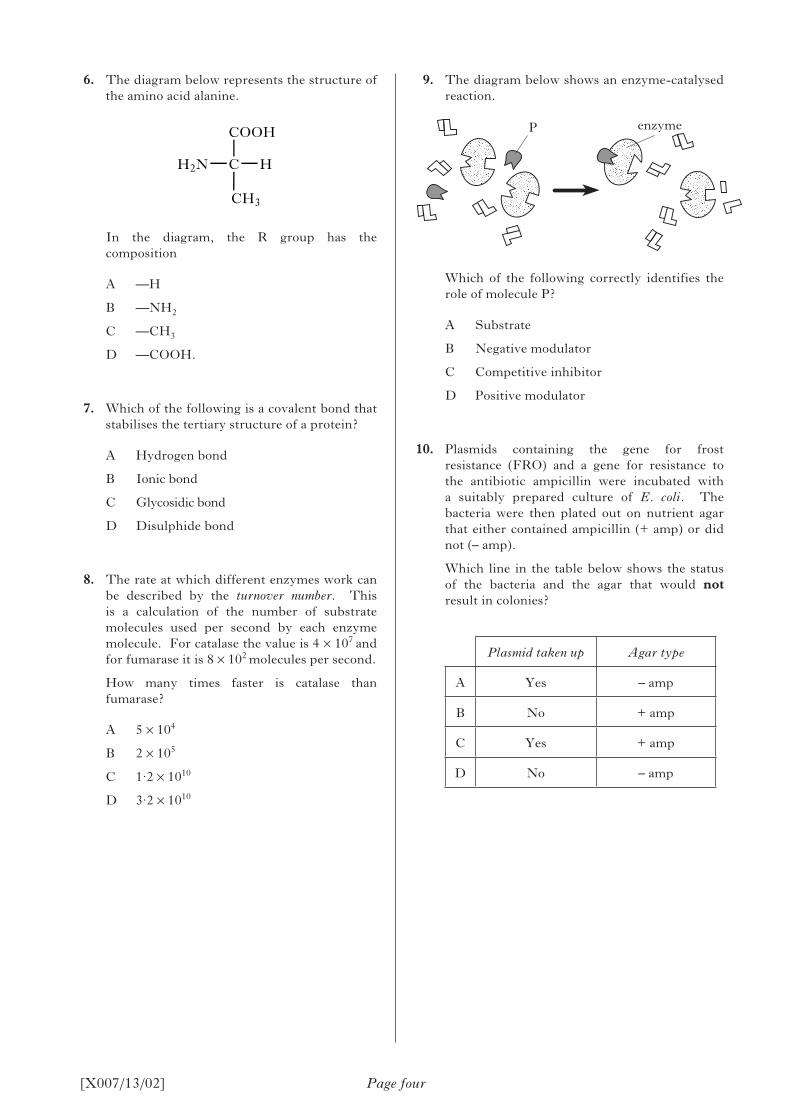
6. The diagram below represents the structure of the amino acid alanine.
H2N C H
COOH
CH3
In the diagram, the R group has the composition
A —H
B —NH2
C —CH3
D —COOH.
7. Which of the following is a covalent bond that stabilises the tertiary structure of a protein?
A Hydrogen bond
B Ionic bond
C Glycosidic bond
D Disulphide bond
8. The rate at which different enzymes work can be described by the turnover number. This is a calculation of the number of substrate molecules used per second by each enzyme molecule. For catalase the value is 4 × 10⁷ and for fumarase it is 8 × 10² molecules per second.
How many times faster is catalase than fumarase?
A 5 × 10⁴
B 2 × 10⁵
C 1·2 × 1010
D 3·2 × 1010
9. The diagram below shows an enzyme-catalysed reaction.
enzymeP
Which of the following correctly identifies the role of molecule P?
A Substrate
B Negative modulator
C Competitive inhibitor
D Positive modulator
10. Plasmids containing the gene for frost resistance (FRO) and a gene for resistance to the antibiotic ampicillin were incubated with a suitably prepared culture of E. coli. The bacteria were then plated out on nutrient agar that either contained ampicillin (+ amp) or did not (– amp).
Which line in the table below shows the status of the bacteria and the agar that would not result in colonies?
Plasmid taken up Agar type
A Yes – amp
B No + amp
C Yes + amp
D No – amp
Page five[X007/13/02]
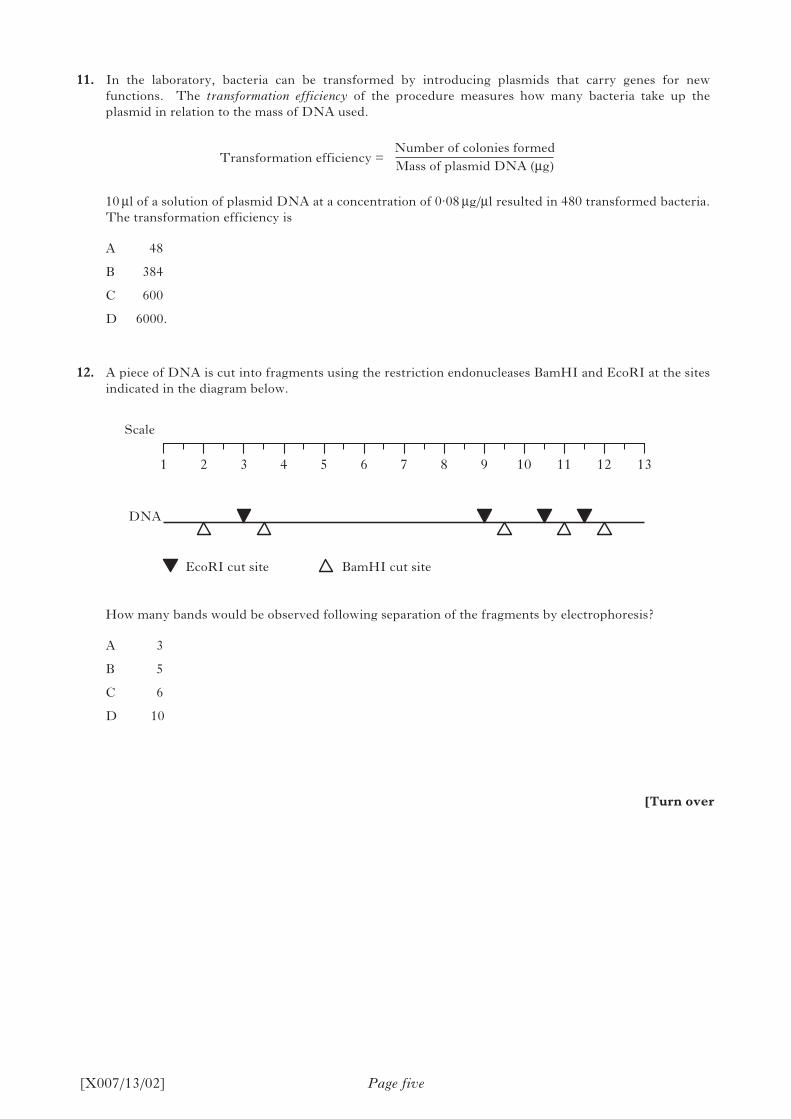
11. In the laboratory, bacteria can be transformed by introducing plasmids that carry genes for new functions. The transformation efficiency of the procedure measures how many bacteria take up the plasmid in relation to the mass of DNA used.
Transformation efficiency =Number of colonies formedMass of plasmid DNA (µg)
10 µl of a solution of plasmid DNA at a concentration of 0·08 µg/µl resulted in 480 transformed bacteria. The transformation efficiency is
A 48
B 384
C 600
D 6000.
12. A piece of DNA is cut into fragments using the restriction endonucleases BamHI and EcoRI at the sites indicated in the diagram below.
1 2 3 4 5 6 7 8 9 10 11 12 13
EcoRI cut site BamHI cut site
Scale
DNA
How many bands would be observed following separation of the fragments by electrophoresis?
A 3
B 5
C 6
D 10
[Turn over

13. A hoverfly is an insect that visits the sycamore tree to lay its eggs. These eggs hatch into larvae which catch aphids as they roam around the twigs and leaves of the tree. The larvae are prey to a variety of birds, including blue tits, whilst the sap of the sycamore leaves provides the aphids with energy.
From the information provided, which line in the table below correctly describes the nutrition of the organisms?
Aphid Hoverfly larva Blue tit
A Herbivore Heterotroph Consumer
B Consumer Herbivore Carnivore
C Heterotroph Omnivore Carnivore
D Carnivore Consumer Omnivore
14. Ecological efficiency in a food chain is the percentage of
A energy lost between two trophic levels
B plant biomass converted to biomass in top carnivores
C solar energy converted to plant biomass
D energy transferred from one trophic level to another.
15. Which line in the table below correctly describes detritivores?
Type oforganism
Type ofdigestion
A microbe external
B microbe internal
C invertebrate internal
D invertebrate external
16. The data in the table below relate to leaf fall and leaf litter accumulation in four different forest types.
Foresttype
Annual leaf fall(kg ha–1)
Average litter(kg ha–1)
A 9400 2220
B 5600 2450
C 1380 39980
D 2800 167700
Which forest type shows the most rapid decomposition?
17. The following graph shows the total mass of nitrogen in bean seedlings grown in air enriched with carbon dioxide (0·13% CO2) and normal air (0·03% CO2). Although beans are legumes, they still absorb 60% of their nitrogen compounds from the soil.
What mass of nitrogen had been absorbed from the soil by 60-day-old plants grown in the enriched atmosphere?
A 180 mg
B 300 mg
C 480 mg
D 800 mg
Page six[X007/13/02]
1600
1400
1200
1000
800
600
400
200
00 20 40 60 80
Age (days)
Tot
al m
ass
of n
itro
gen
com
pou
nd
s in
pla
nts
(m
g)
0·13%CO2
0·03%CO2
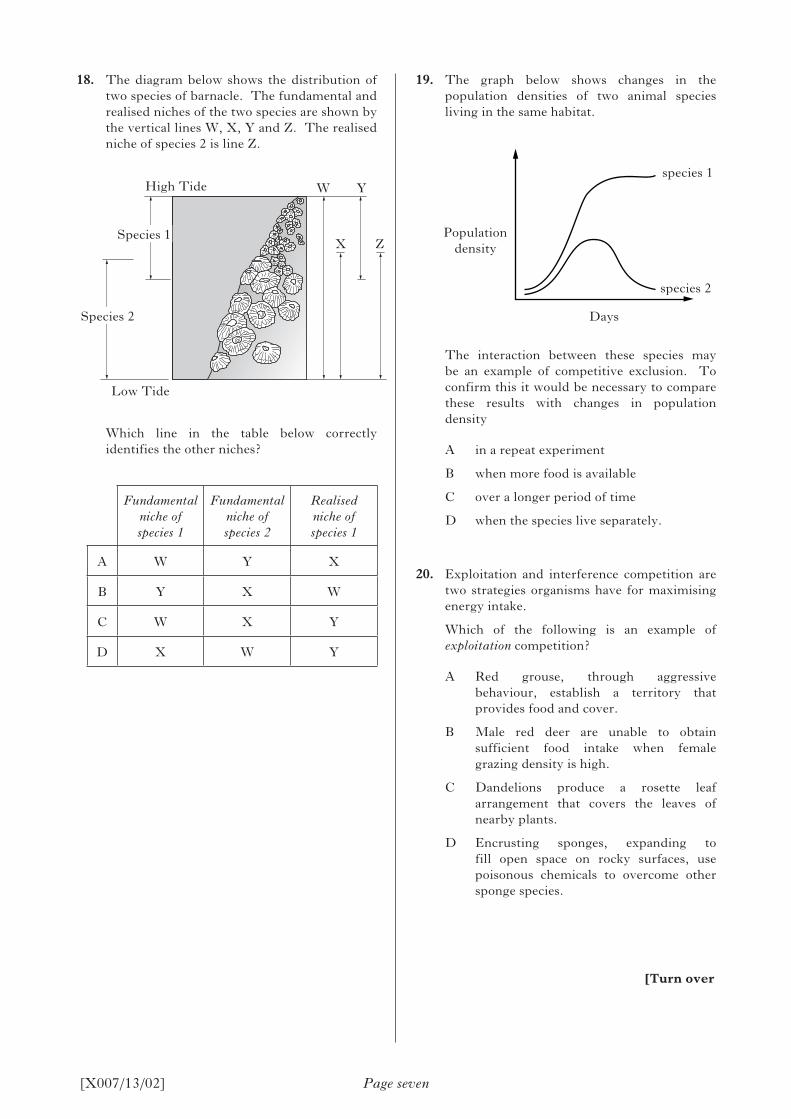
18. The diagram below shows the distribution of two species of barnacle. The fundamental and realised niches of the two species are shown by the vertical lines W, X, Y and Z. The realised niche of species 2 is line Z.
W
X
Y
ZSpecies 1
Species 2
Low Tide
High Tide
Which line in the table below correctly identifies the other niches?
Fundamental niche of species 1
Fundamental niche of species 2
Realised niche of species 1
A W Y X
B Y X W
C W X Y
D X W Y
19. The graph below shows changes in the population densities of two animal species living in the same habitat.
species 1
species 2
Days
Population density
The interaction between these species may be an example of competitive exclusion. To confirm this it would be necessary to compare these results with changes in population density
A in a repeat experiment
B when more food is available
C over a longer period of time
D when the species live separately.
20. Exploitation and interference competition are two strategies organisms have for maximising energy intake.
Which of the following is an example of exploitation competition?
A Red grouse, through aggressive behaviour, establish a territory that provides food and cover.
B Male red deer are unable to obtain sufficient food intake when female grazing density is high.
C Dandelions produce a rosette leaf arrangement that covers the leaves of nearby plants.
D Encrusting sponges, expanding to fill open space on rocky surfaces, use poisonous chemicals to overcome other sponge species.
Page seven[X007/13/02]
[Turn over

24. Reciprocal transplant experiments are sometimes used to investigate the relative contributions of genes and environment to the growth of plants. In one such experiment, specimens of young plants of a single species were collected at altitudes of 1000 and 2000 metres and then each grown at both altitudes.
The table below shows the results obtained.
Altitude at which plants were collected
(m)
Mean height of stems (cm)
For plants grown at 1000 m
For plants grown at 2000 m
1000 65 ± 6 29 ± 3
2000 28 ± 3 20 ± 2
Which of the following observations could be used to justify the conclusion that variation in height is determined to some extent by the environment?
A Plants from different altitudes differ in height when grown in the same environment.
B Plants from the same altitude differ in height when grown in the same environment.
C Plants from different altitudes have similar heights when grown in different environments.
D Plants from the same altitude differ in height when grown in different environments.
Page eight[X007/13/02]
21. Animals may interact with their environment by conformation or regulation. Each statement below applies to one of these interactions.
1 A wide range of habitats can be occupied.
2 A restricted range of habitats can be occupied.
3 There is a high energy cost.
4 There is a low energy cost.
Which of the statements above apply to regulation?
A 1 and 3
B 1 and 4
C 2 and 3
D 2 and 4
22. The giant bullfrog of southern Africa lives in an environment where hot and dry conditions can occur at any time of the year. To survive these conditions the frogs become dormant.
Which combination of terms applies to this type of dormancy?
A Predictive and aestivation
B Consequential and aestivation
C Predictive and hibernation
D Consequential and hibernation
23. The table below shows some of the characteristics of a number of agricultural fertilisers.
Fertiliser
Characteristic A B C D
Phosphate concentration
high high low high
Nitrate concentration
high low high high
Nutrient release rate
slow slow fast fast
Which of these fertilisers would be most likely to cause eutrophication in an aquatic ecosystem?

Page nine[X007/13/02]
25. The table below shows concentrations of mercury compounds in a lake containing the following aquatic food chain.
Aquatic plants minnow bass pike
Source of mercury sampleConcentration of mercury
compounds (µg g–1)
lake water 0·0015
aquatic plants 0·01
minnow 0·02
bass 0·58
pike 1·0
The difference in mercury concentration between lake water and aquatic plant tissue is a result of
A biodegradation
B bioaccumulation
C biomagnification
D biotransformation.
[Turn over for SECTION B on Page ten
[END OF SECTION A]
Candidates are reminded that the answer sheet MUST be returned INSIDE thefront cover of the answer book.
SECTION B
All questions in this section should be attempted.
All answers must be written clearly and legibly in ink.
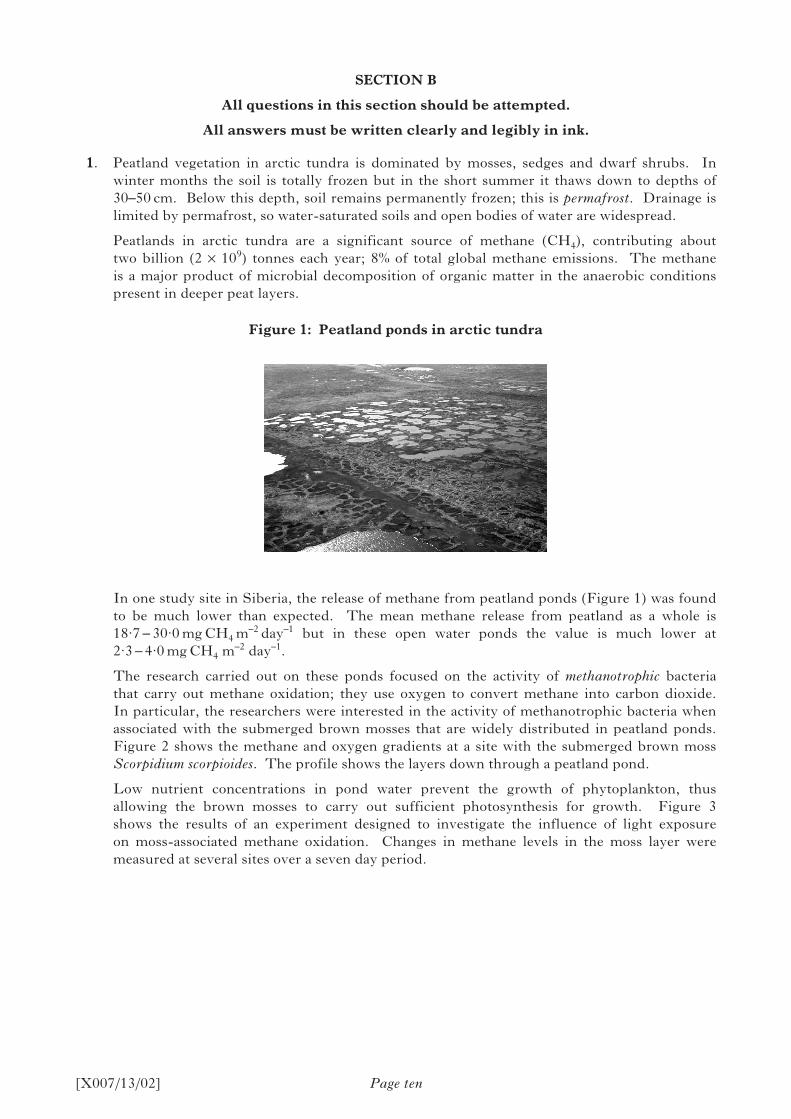
1. Peatland vegetation in arctic tundra is dominated by mosses, sedges and dwarf shrubs. In winter months the soil is totally frozen but in the short summer it thaws down to depths of 30–50 cm. Below this depth, soil remains permanently frozen; this is permafrost. Drainage is limited by permafrost, so water-saturated soils and open bodies of water are widespread.
Peatlands in arctic tundra are a significant source of methane (CH4), contributing about two billion (2 × 10⁹) tonnes each year; 8% of total global methane emissions. The methane is a major product of microbial decomposition of organic matter in the anaerobic conditions present in deeper peat layers.
Figure 1: Peatland ponds in arctic tundra
In one study site in Siberia, the release of methane from peatland ponds (Figure 1) was found to be much lower than expected. The mean methane release from peatland as a whole is 18·7 – 30·0 mg CH4 m
–2 day–1 but in these open water ponds the value is much lower at 2·3 – 4·0 mg CH4 m
–2 day–1.
The research carried out on these ponds focused on the activity of methanotrophic bacteria that carry out methane oxidation; they use oxygen to convert methane into carbon dioxide. In particular, the researchers were interested in the activity of methanotrophic bacteria when associated with the submerged brown mosses that are widely distributed in peatland ponds. Figure 2 shows the methane and oxygen gradients at a site with the submerged brown moss Scorpidium scorpioides. The profile shows the layers down through a peatland pond.
Low nutrient concentrations in pond water prevent the growth of phytoplankton, thus allowing the brown mosses to carry out sufficient photosynthesis for growth. Figure 3 shows the results of an experiment designed to investigate the influence of light exposure on moss-associated methane oxidation. Changes in methane levels in the moss layer were measured at several sites over a seven day period.
Page ten[X007/13/02]

1. (continued)
Figure 2: Methane and oxygen gradients in a Siberian peatland pond
0
5
10
15
20
25
30
35
40
45
MethaneOxygen
0 20 40 60
Oxygen concentration (% air saturation)
Methane concentration (µM)
Dep
th b
elow
wat
er s
urf
ace
(cm
)
80 100
0 500400300200100
PROFILE
Openwater
Mosslayer
Permafrost
Activepeatlayer
Figure 3: Mean methane change over 7 days in the moss layer under light and shaded conditions
35
30
25
20
15
10
5
0
–5
–10
–15
LightShaded
CH
4 ch
ange
(m
g C
H4
m–2
day
–1)
Page eleven[X007/13/02]
[Question 1 continues on Page twelve

Question 1 (continued)
(a) It has been suggested that the association between methanotrophic bacteria and brown mosses is a symbiotic interaction beneficial to both species.
What term could be used to describe this interaction?
(b) Refer to Figure 2.
(i) Select data to show that methane-producing microbes are anaerobic.
(ii) How do the results suggest that the moss layer is a zone of methane oxidation?
(c) Use Figure 3 to describe the effect of light on methane level in the moss layer.
(d) Explain how the interaction between the mosses and methanotrophic bacteria may be responsible for the lower methane output observed in peatland ponds.
(e) Why does the absence of phytoplankton in peatland ponds benefit the growth of brown mosses?
(f) The Intergovernmental Panel on Climate Change (IPCC) has given methane a GWP20 of 72. This means that over 20 years, methane has a global warming potential that is 72 times higher than the same mass of carbon dioxide.
(i) What name is given to gases that have global warming potential?
(ii) Calculate the mass of carbon dioxide that would have a global warming potential equivalent to the total global production of methane in a year.
(g) Brown mosses require stable environmental conditions and may be sensitive to global warming.
Suggest one possible consequence of global warming on the peatland tundra.
Page twelve[X007/13/02]
Marks
1
1
2
2
2
1
1
2
1
(13)
[Question 2 is on fold-out Page thirteen

2. (a) Different biomes (major vegetation types) are determined by climate. The Figure below shows the relationship between biomes and two abiotic factors. The diameter of each circle is proportional to the net primary productivity (NPP) of each biome.
tropical rainforest
savannah(grassland) tropical seasonal
forest
temperaterain forest
marshland
temperateforest
steppes(grassland)
shrubland
taiga(Boreal forest)
tundra
Factor B
Factor A
(i) Give an example of units that would allow a comparison of net primary productivity in the different biomes.
(ii) From the information in the Figure, identify the abiotic factors A and B.
(b) Change in a significant abiotic factor may result in a major successional change in an ecosystem. The succession may involve facilitation and result in a climax community.
(i) State what is meant by the term facilitation.
(ii) State two features of a climax community.
Page thirteen[X007/13/02]
Marks
1
1
1
1
(4)

3. The Figure below shows changes in river conditions below a point from which sewage is continuously discharged.
Sewagedischarge
BODAlgaeBacteriaNitrateAmmonium
0 500 1000 1500 2000
KeyOxygen
Distance down the river from sewage discharge (m)
Con
cen
trat
ion
in w
ater
(va
riou
s u
nit
s)
(a) Account for the increase in nitrate that occurs from 250 to 600 m downstream of the discharge.
(b) Explain why biochemical oxygen demand (BOD) decreases.
(c) Suggest why the sewage discharge leads initially to a decrease in the number of algae.
(d) Explain how either a susceptible or a favoured species could be used in monitoring freshwater ecosystems.
4. Discuss the transmission of parasites to new hosts.
Page fourteen[X007/13/02]
Marks
1
1
1
2
(5)
(5)

5. Plants contain a variety of carbohydrates that differ in structure and function.
(a) The disaccharide sucrose is abundant in plants. It consists of a glucose and a fructose molecule joined by a glycosidic bond, as shown in the diagram below.
O
OH
OHHOO
O
5
6
HO
HO
4
HOCH2
1
2
3
CH2OH
CH2OH
Glucose Fructose
(i) Name the type of reaction that forms glycosidic bonds between monosaccharides.
(ii) Describe the glycosidic bond linking glucose and fructose in sucrose, as shown in the diagram.
(b) The storage carbohydrate starch exists as large, insoluble granules that contain two types of polysaccharide, amylose and amylopectin, formed from glucose monomers.
(i) Give one difference between the structures of amylose and amylopectin.
(ii) Explain why the insoluble nature of starch granules is important to cells.
Page fifteen[X007/13/02]
Marks
1
1
1
1
(4)
[Turn over

6. The diagram below shows events during signalling by the neurotransmitter acetylcholine (ACh) at the junction between a nerve cell and a muscle cell. (Na+ = sodium ions; K+ = potassium ions.)
nerve cell
vesicle containing ACh
ACh released
bound ACh
outer membrane of muscle cell
ACh receptors activated
Na+
K+
ACh receptors not activated
In a neuromuscular junction, the nerve cell releases ACh molecules that will bring about muscle contraction when they bind to receptors in the outer membrane of the muscle cell. At the same time the enzyme acetylcholinesterase, also present in the muscle cell membrane, is rapidly breaking down any ACh molecules.
acetylcholine acetate + cholineacetylcholinesterase
The rapid breakdown of ACh enables the muscle cells to respond to the next release of neurotransmitter.
(a) (i) What property of an acetylcholine molecule requires it to have a receptor site at the cell surface?
(ii) Use information from the diagram to explain how the ACh receptor acts as a transducer.
(b) Two types of drug used by anaesthetists affect signalling by ACh at the neuromuscular junction:
vecuronium: competitively blocks the ACh receptor neostigmine: inhibits acetylcholinesterase.
When vecuronium blocks the binding of ACh to its receptor, muscle contraction stops. Explain how neostigmine would reverse the effects of vecuronium.
Page sixteen[X007/13/02]
Marks
1
1
2
(4)

7. The Human Genome Project determined the sequence of bases on each of the human chromosomes. Other species, including micro-organisms that cause disease (pathogens), have had their genomes analysed in a similar way. The genome for each species is stored in a separate database.
One benefit of having DNA databases is that the presence of small amounts of pathogen DNA can be detected within a tissue sample using PCR because the pathogen sequence is known.
(a) (i) Name the type of enzyme used to amplify DNA during PCR.
(ii) Give one feature of primers used in PCR.
(iii) Explain why amplification of pathogen DNA by PCR requires knowledge of its nucleotide sequence.
(b) Deep sequencing is a new approach to identifying pathogens that overcomes the need to know pathogen base sequences in advance.
The steps required to search for unknown pathogens by deep sequencing are shown in the Figure below. Large quantities of DNA can be isolated from a tissue sample in which only a few cells may be infected.
step 1 Isolate DNA from cells
step 2 Digest DNA into millions of short fragments
step 3 Determine nucleotide sequence of a very large number of fragments
step 4 Compare sequences obtained with database of human genome sequence
step 5 Compare sequences with database of known pathogens’ genome sequences
Refer to the Figure.
(i) Why is it necessary to sequence a very large number of fragments?
(ii) Explain why step 4 is required to identify an unknown pathogen.
Page seventeen[X007/13/02]
Marks
1
1
1
1
1
(5)
[Turn over
Fragment source:
humanpathogen

8. Answer either A or B.
A. Discuss membranes in eukaryotic cells under the following headings:
(i) organelles and their functions;
(ii) membrane structure;
(iii) transport of ions across membranes.
OR
B. Discuss DNA under the following headings:
(i) DNA structure;
(ii) DNA replication in cell cycle S phase;
(iii) mutations causing abnormal cell division.
[END OF SECTION B]
Page eighteen[X007/13/02]
Marks
5
4
6
(15)
6
4
5
(15)

SECTION C
Candidates should attempt questions on one unit, either Biotechnology or Animal Behaviour or Physiology, Health and Exercise.
The questions on Biotechnology can be found on pages 19–21.
The questions on Animal Behaviour can be found on pages 22–24.
The questions on Physiology, Health and Exercise can be found on pages 25–28.
All answers must be written clearly and legibly in ink.
Labelled diagrams may be used where appropriate.
Biotechnology
1. The diagram below shows a fermenter used to culture yeast on a large scale.
pH probe
culture mediumcontaining glucose
water in
water out
stirrer
(a) (i) Explain why initial growth of micro-organisms is slow following inoculation of a culture medium.
(ii) During which growth stage do micro-organisms produce most primary metabolites?
(iii) Ethanol is a primary metabolite of yeast. Suggest how the production of ethanol could be maximised.
(b) (i) A haemocytometer was used to determine the density of yeast cells in a sample taken from the fermenter. The diagram below shows yeast cells in part of the haemocytometer grid. The depth of the chamber is 0·2 mm.
0·2 mm
Calculate the number of cells in 1 mm3 of fermenter culture.
(ii) Give one method that can be used to distinguish between viable and non-viable cells when counting them using a microscope.
Page nineteen[X007/13/02] [Turn over
Marks
1
1
1
1
1
(5)

Biotechnology (continued)
2. (a) In a process that could lead to bioengineered human organs, a rat kidney grown entirely in the lab has been transplanted into a recipient rat. The kidney was shown to work and was not rejected by the rat’s immune system.
The process involved removing all the cells from the donor organ to leave its underlying protein scaffold (Figure 1). Stem cells from the transplant recipient were then “seeded” on the scaffold to be grown into the new kidney (Figure 2).
Figure 1: Kidney protein scaffold Figure 2: Kidney in culture medium
renal artery
ureter
protein scaffold enlarged
culture medium
in
waste out
The whole procedure is based on being able to grow animal cells in culture using aseptic technique.
(i) State what is meant by the term aseptic.
(ii) Give one example of an aseptic technique used during animal cell culture.
(iii) Explain why the medium needs to be isotonic when growing animal cells.
(iv) Explain why a bioengineered organ produced in this way would not be rejected by the recipient’s immune system.
(b) Cancer cell lines are often grown in culture.
(i) What is the advantage of using a cancer cell line instead of a primary cell line?
(ii) Name the cancer cell type used in monoclonal antibody production.
Page twenty[X007/13/02]
Marks
1
1
1
1
1
1
(6)

Biotechnology (continued)
3. Nitrogen fixation in legumes involves the conversion of nitrogen gas to ammonium by Rhizobium species. Describe how this process can be enhanced by biotechnology.
4. Plant stanols added to margarine are claimed to reduce the level of potentially harmful LDL-cholesterol in the blood.
(a) (i) Margarines containing stanols are described as “functional foods”.
State what is meant by the term functional foods.
(ii) Give one claimed benefit of another named functional food.
(b) The table below shows the combined results of six separate trials to identify effects of plant stanols on LDL-cholesterol in the blood. All subjects were placed on a low fat diet for three weeks. In the treatment groups, subjects ate margarine containing 2 g of stanols daily whereas those in the control groups ate margarine without stanols.
Amount of stanol consumed (g per day)
0 2
Reduction in LDL-cholesterol (%)
4 –12 8 –24
From the results it was concluded that stanols in a low fat diet reduce the level of LDL-cholesterol in the blood.
Use information from the table to:
(i) support the conclusion;
(ii) challenge the conclusion.
Page twenty-one[X007/13/02]
Marks
(5)
1
1
2
(4)
[End of Biotechnology questions. Animal Behaviour questions start on Page twenty-two]

SECTION C (continued)
AniMAl BehAVioUR
1. In many mammals, scent-marking is an important signalling behaviour particularly in solitary species such as the giant panda, Ailuropoda melanoleuca.
Signalling has costs that must be matched against the possible benefits. The diet of the giant panda is energy-poor but chemical signals can be energetically expensive to produce so they must be deployed effectively.
Pandas communicate without direct contact by leaving scent marks on trees in two ways. Firstly, by spraying urine on the tree; secondly by vigorously rubbing the anal gland on the bark of a tree to deposit waxy secretions (AGS).
(a) Suggest one purpose of chemical communication in pandas.
(b) Figure 1 below shows data obtained in a study of wild pandas in Foping National Nature Reserve in China. This is an area of biologically rich temperate forest with high rainfall.
Figure 1: Bark texture of available trees for scent-marking by giant pandas
Urine-marked treesAGS-marked trees
Available trees
AGS-markedtrees
Moss freeMoss covered
Roughest Rough Medium Smooth
Urine-markedtrees
Availabletrees
100
80
60
40
20
0
100
80
60
40
20
0
Percentage of trees
Percentage of trees
Describe one characteristic of the trees favoured by pandas for each method of scent-marking.
(c) When spraying urine on tree bark, male pandas adopt a handstand posture.
(i) Why should other males be interested in smelling scent marks at higher points in the trees?
(ii) Suggest why male pandas favour broader trees for urine spraying.
Page twenty-two[X007/13/02]
Marks
1
2
1
1

AniMAl BehAVioUR (continued)
1. (continued)
(d) The Figure below shows seasonal patterns of scent marking.
100
80
60
40
20
0
Percentage of marks
Non-mating season
Mating season
Male Female
Explain how the data provide evidence of sexual dimorphism in the giant panda.
2. Chemicals called beta-endorphins, produced in the brain during grooming, motivate primates to receive more grooming.
(a) (i) State whether the release of these chemicals is a proximate or an ultimate cause for grooming behaviour. Justify your answer.
(ii) In humans, beta-endorphins bring about feelings of pleasure and relaxation. What term applies to the assumption that the same responses occur in other primates?
(iii) State one benefit of grooming for an individual primate.
(b) Contrast the characteristics of parental care in primates and invertebrates.
3. Discuss the variety of defence strategies employed by animals to avoid predation.
Page twenty-three[X007/13/02]
Marks
1
(6)
1
1
1
2
(5)
(5)
[Turn over

AniMAl BehAVioUR (continued)
4. The red-winged blackbird (Agelaius phoenicius) is widely distributed in large areas of North and Central America. It prefers grassland habitats, particularly in marshy or wetland areas.
Territorial males show a form of polygamy called polygyny and may mate with and defend up to ten females in the territory, depending on the food resources available. The graph below shows the relative reproductive success of females mating with males that have from one to six mates.
0 2 4 6Mates per male
1·81·61·41·21·00·80·60·40·2
0
Survivingoffspring per
female
1 3 5
(a) Describe and explain the trend shown in the graph.
(b) What sets a limit on the size of territory occupied by a male?
(c) Natural selection is concerned with “survival of the fittest”. In this context, what is likely to determine whether a male bird should favour polygyny over mating with a single female?
Page twenty-four[X007/13/02]
Marks
2
1
1
(4)
[End of Animal Behaviour questions. Physiology, health and exercise questions start on Page twenty-five]

SECTION C (continued)
Physiology, heAlth And exeRcise
1. (a) Hypertension is diagnosed as blood pressure values greater than 140/90 mmHg. Explain what the 140 value represents.
(b) Give two non-modifiable risk factors for hypertension.
(c) Various lifestyle choices are known to lower blood pressure. A study examined the effect of salt (sodium chloride) intake on blood pressure in two different diets.
One diet, known as the DASH diet, was rich in fruit, vegetables and low-fat dairy products. The other, considered to be a typical diet, was consumed by the control group. Within each assigned diet, individuals ate foods supplemented with high, intermediate and low levels of sodium.
The results are shown in the graph below.
Key
Control diet
DASH diet
High Intermediate Low
Sodium Intake
135
130
125
120
Blood Pressure(mm Hg)
(i) Calculate the % increase in blood pressure for individuals following a control diet when salt intake is changed from low to high.
(ii) Give two conclusions about how the DASH diet alters the effect of salt on blood pressure.
2. Describe the long term changes to the heart arising from endurance training. Explain why such changes are important to an athlete.
Page twenty-five[X007/13/02]
Marks
1
2
1
2
(6)
(5)
[Turn over

Physiology, heAlth And exeRcise (continued)
3. Densitometry is one method used to determine percentage body fat. The illustration below shows equipment involved in making the necessary measurements.
Referencechamber
Measurementchamber
Electronics
Computer Balance
(a) Give the two measurements required to obtain body density.
(b) Once density has been calculated, how is % body fat derived?
(c) Describe one other method that can be used to assess body composition.
4. (a) Figure 1 below shows a glucose tolerance curve for an individual with normal control of blood glucose. After fasting, the individual consumed a standard glucose test drink; blood glucose levels were then monitored over a five-hour period.
Figure 1: Glucose tolerance curve
120
100
80
60
Blood glucose concentration
(units)
0 1 2 3 4 5
Time (hours)
(i) Give two effects of insulin that would account for the response shown between one and two hours.
(ii) Individuals with Type 2 diabetes (NIDDM) have less control over blood glucose level. Other than lack of exercise, give one risk factor for NIDDM.
Page twenty-six[X007/13/02]
Marks
1
1
1
(3)
2
1

Physiology, heAlth And exeRcise (continued)
4. (continued)
(b) There is recent evidence that breaking up prolonged periods of sitting may help with the control of blood glucose level. In one study on subjects with a heightened risk of Type 2 diabetes, researchers investigated the effect on blood glucose levels of interrupting sitting time with brief activity.
Following overnight fasting, subjects attended a laboratory to complete one of three trial activities. They attended on two other occasions, each time performing one of the other activities.
The three trial activities were:
1 sitting
2 sitting with light-intensity walking
3 sitting with moderate-intensity walking.
The subjects’ blood glucose levels were measured hourly, from two hours before to five hours after consuming a standard glucose test drink. Figure 2 shows the mean total glucose present in the blood over the five-hour period following the drink.
Figure 2: Glucose response – total glucose over 5 hours
8
6
4
2
0
Total glucose over 5 hours
(units)
Sitting Sitting+ light
intensity walking
Sitting+ moderate
intensity walking
Trial activity
(i) Give two conclusions that can be drawn from the data.
(ii) Give one aspect of the walking activity that should be kept constant.
Page twenty-seven[X007/13/02]
Marks
2
1
(6)
[END OF QUESTION PAPER]

[BLANK PAGE]
DO NOT WRITE ON THIS PAGE

[BLANK PAGE]
DO NOT WRITE ON THIS PAGE

ACKNOWLEDGEMENT
Section B Question 1 – George Burba/shutterstock.com