xa04n2870 the sampling and analysing methods of
TRANSCRIPT

XA04N2870
The Sampling and AnalysingMethods of Radionuclidesused in The Nordic Countriesfor Environmental Samples
fNfS-XA-N--2532A2P.
2292AC P.
Meiidctea et,,o,
PU
i U
Edited by Tarja K. TaipaleFinnish Centre for Radiation andNuclear Safety
January 1985
This report forms a part of the program"Safety Research in Energy Production" sponsored by
NORDIC LIASON COMMITTEE
NUFOR ATOMIC ENERGY


The Sampling and AnalysingMethods of Radionuclidesused in The Nordic Countriesfor Environmental Samples
U2N
U L:�Edited by Tarja K. TaipaleFinnish Centre for Radiation andNuclear Safety
January 1985
This report forms a part of the program"Safety Research in Energy Production" sponsored by
NORDIC LIASON COMMITTEENUFOR ATOMIC ENERGY

minsblgotab Stockholm 1985

SAMMAIMRAG
Styrgruppen f6r radioekologi under det nordiska kontaktor-
ganet f6r atomenergifrAgor (NKA) ar ansett det vara mycket
viktigt att frbattra jamf6rbarheten fr mdtningar av om-
givningsradioaktivitet i de nordiska ldnderna, dA ett
grundIdggande krav f6r att utfbrd koordinerade forsknings-
program dr resultatens jdmfbrbarhet.
I detta syfte ar flera undersbkningar genomfbrts mellan
laboratorier scm mdter radioaktivitet i ogivningen. Dessa
unders6kningar ar visat sig vara mycket nyttiga och ar
lett till en mera omfattande och systematist bverblicX
6ver den metodologi, som de nordiska laboratorierna anvLn-
der f6r omgivningsm�itningar.
Ytterligare bar man ansett det n6dv�indigt att utarbeta
rekommendationer eller till ocb med en bverenskommelse
om hur resultat bbr presenteras f6r att gbra en jdrnfbrelse
av data lattare.
Denria rapport &r baserad pi! enk�itsvaren frAn de deltagan-
de nordiska laboratorierna och sammanstalld pa strilsaker-
hetscentralen i Helsingfors.


The participating nordic laboratories/De deltagande nordiska laboratorierna
Denmark/Danmark
Ris95 National Laboratory/Fors0gsanlaeg RisoBox 49, DK-4000Roskilde, EMIARK
National Institute of Radiation ygiene/Statens Institut for StrAlehygieneFrederikssundsvej 378Brj6nsh56j, DK-2700DENMARK
Finland/Finland
Finnish Centre for Radiation and Nuclear Safety/StrAls9kerhetscentralenBox 268, SF-00101Helsinki, FINLAND
University of Helsinki, Department of Radiochemistry/Helsingfors Universitet, Radiokemiska institutionenUnioninkatu 35, SF-00170Helsinki, FINLAND
Norway/Norge
Institute for Energy Technology/Institutt for Energiteknik.Box 40, N2007Kjeller, NORWAY
National Institute of Radiation Hygiene/Statens Institutt for Strilhygiene6sterdalen 25, N1345bster&s, NORWAY
Sweden/Sverige
National Institute of Radiation Protection/Statens StAlskyddinstitutBox 60204, S10401Stockholm, SWEDEN
National Swedish Environment Protection Board/Statens NaturvirdsverkS-17011Drottiningsholm, SWEDEN
Studsvik Energiteknik ABS-61182Nykdping, SWEDEN

University of Lund, Radiation Physics Department/Lunds Universitet, Radiofysiska institutionenLasarettet, S-22185Lund, SWEDEN
University of Uppsala, Radiobiological Institute/Sveriges Lantbruksuniversitetet,Institutionen fbr radioekologiBox 7031, S-75007Uppsala, SWEDEN

CONTENTS
FOREWORD 1
SAMPLING 2The purpose of the sample 2
Monitoring of the environment of the nuclear power plants 2Monitoring of the global fall-out 3Other surveying 3
Representativeness of sample 4Selection of samples 4Selection of sampling area 6Selection of sampling frequency and time 8
Selection of sample size and sampling ethod 9
PRETREATMENT 10Storage 10Cleaning 11Drying 11Homogenizing and subsampling 12Evaporation 12Ion exchange 12Dry and wet ashing 13Hydrofluoric acid treatment and fusion 13Leaching 14
DETAILED METHODS OF SAMPLING AND PRETREATMENT 14Air 14Deposition 15Soil 17Milk 18Other foodstuffs 19Terrestrial indicators 20Sea water 21Sediment and sedimenting material 22Aquatic indicators 24

ANALYSING METHODS 25y-spectrometry 25
Preparation of the sample to the measuring geometry 25Measuring 25Analysing of spectrum 25Calibration of detectors 26
Radiochemical determination of aesium 26
Methods for determination of strontium 89 and 90 27Nitrate precipitation 27Ion exchange 29HDEHP-extraction 29
Methods for determination of transuranic elements 30Determination of plutonium 30Determination of americium and curium 31
Determination of tritium 33
Determination of radium 226 34
Determination of lead 210 35
Determination of polonium 210 35
TREATMENT AND REPORTING OF RESULTS 36Recommendations 37
PAN-SCANDINAVIAN INTERCALIBRATIONS 38Sediment intercalibration 38Fucus intercalibration 39Intercalibrations of detector systems for background radiationmonitoring 39Intercalibration of collecting and analysing of groundlevel air 40Intercalibration of collecting and analysing of sedimentingmaterial 40
REFERENCES 41

FOREWORD
The Radioecology Group under the Nordic Liaison Committee
for Atomic Energy has considered it to be of great impor-
tance to improve the comparability of environmental
radioactivity measurements in the Nordic countries,
a basic requirement for coordinated research programmes
being comparability of results. In a case of emergen-
cy, good comparability between the results obtained
will be required for mutual assistance.
Therefore several intercomparison exercises have been
carried out between the laboratories measuring environ-
mental radioactivity. The exercises have proved very
useful and have led to a more comprehensive and systematic
survey of the environmental measurement methodology
used so far by the Nordic laboratories.
Furthermore it is considered necessary to make some
recommendations or even to reach an agreement on how
to present the results in order to make the comparison
of, at least, monitoring data easier.
This report is based on the answers received from the
participating laboratories to a questionnaire sent by
the Finnish Centre for Radiation and Nuclear Safety,
Helsinki. The laboratories are listed in an Annex to
this report.

2
SAMPLING
.1h 1he-.5�ampig
Monitoring in the environment of the nuclear power
plants
The purpose of the sampling determines the types
o f s a m p 1 e s , a s w e I a s t h e 1 o c a t i o n a n d f r e q u e n c y o f
the sampling. The nuclear power plants or research
reactors are monitored by studying the quantities and
qualities of the radionuclides spreading in the environment.
Some of the radionuclides can be analysed using direct
measurements, but most of the environmental samples
are analysed either chemically or radiochemically.
Environmental monitoring has several important
aims:
- to supplement the discharge monitoring in order to
verify the origin of radionuclides
- to contribute to the estimation of doses to the critical
group to ensure adherence to the dose limits
- to determine the uptake of radionuclides by plants
and animals for possible countermeasures in cases of
unexpected release
- to contribute to a better understanding of the rela-
tionship between discharge and dose in the different
dose pathways concerned
- to show the level and variation of environmental
contamination and to provide basic data for informing
the public.
The environment of nuclear power plants and research
reactors is monitored in all Nordic countries.

3
Monitoring of the global fall-out
The levels of di f f erent nucl ides in the global
fall-out and their transport pathways are also monitored
using environmental samples. Generally, the global
fall-out monitoring covers the whole country. Possible
increases in levels can be observed and external and
internal doses estimated. The results from the global
fall-out monitoring programmes can be used for other
purposes as well, e.g. to determine sedimentation rates.
These samples are also used as reference samples for
the nuclear power plant control.
The radionuclides most often studied are 137cs
and other long-lived y-emitters, 90 Sr, tritium and transu-ranic elements, especially 238PU, 239,240 Pu and 241Am. The
global fall-out surveys are carried out in all Nordic
countries.
Other surveys
The results of the nationwide surveys and nuclear
power plant monitoring programmes can be used for other
research purposes as well. Transfer, sorption and accu-mulation of various elements and the effect of different
environments on these phenomena are studied. The moni-
toring programmes are often supplemented by additional
projects to obtain more detailed data.
The environments of planned uranium mines are studied
by analysing natural radioactivity in various materials.
This kind of work is done in Sweden, Finland and Greenland.

4
_B.ePra_.s.Pn1,_ati vkn-e s s o_ 59"p 1 e 1 2
Selection of samples
The purpose of the sampling programme is to determine
the types of samples. Some transport pathways of radionucli-
des are more significant than others.
Samples are selected according to some basic require-
ments. For the determination of short-lived radionuclides,
samples which permit rapid measurement of nuclides,
e.g. air and deposition, are selected. Long-lived radionuc-
lides on the other hand are studied in the environment
where they accumulate, e.g. in soil and sediment. it
should also be ascertained that the sample type will
be available during the entire research period which
may include several years.
Air sa ple are collected for the monitoring of
nuclear power plants and research reactors and of global
fall-out. In the air, increased levels are quickest
observable which makes air samples essential for the
detection of short-lived radionuclides. The results
are used for calculating inhalation and immersion doses. Air
is also an important pathway for transporting and distribu-
ting radionuclides.
Deposition is collected in the environmental monitoring
of nuclear power plants and global fall-out. It can
also be used to detect increased activity levels. Re-
sults of activity measurements in deposition are used
specially for external dose estimations and as a basis
for calculating transfer factors of radionuclides.
Soi which is an important link in terrestrial
food chains, reveals an accumulation of long-lived radionuc-
lides. Soil samples are usually taken for the monitoring
of global fall-out and nuclear power plants or reactors.

5
_Qt11Pr._f gggi§_t�qff s , e . g . meat, f is h ,
cereals and vegetables, which are important p art of
man's nutrition, are chosen for programmes monitoring
fall-out and nuclear power plants. They contribute
directly to the internal radiation dose to man.
Ind_1caLQLQrZanisms are collected for early detec-
tion of the accumulation of radionuclides in the biota.
In the selection of the indicator organisms, the following
features should be considered: occurrence, ease of sampling,
endurance of the organisms under changing environmental
conditions, and the marked accumulation ability of one
or more radionuclides.
Grass and different kinds of moss and lichen are
terrestrial indicators; slow-growing moss and lichen
are integrative types of these indicators.
There are several aquatic organisms that can be
used as indicators. In the Baltic Sea area, F u c u s
vesiculosus is a good indicator, because it exists every-
where except in the Bothnian Bay. It is also the most
studied aquatic indicator in the Nordic countries, because
it accumulates several trace metals and radionuclides. Other
species of algae are also studied.
Mytilus edulis filters particles in seawater and
can absorb radionuclides in particle form, e.g. transu-
ranics. M c a c is a special indicator in the
Baltic Sea. It lives in the bottom sediment and is nourished
by fresh sedimenting material. Ma3_tdQteaPntQmcLn_ an
interesting relict animal in the Baltic Sea, absorbs
radionuclides effectively.
SediMe _t___0nd__s_edjMPn�j" material are important
research objects in the water ecosystem. Sedimenting
material transfers and adsorbs radionuclides from the
water phase. The absorption and accumulation of radionucli-
des in the bottom sediment are studied in sediment samples.
Undisturbed sediment layers can be used to follow the
development of the conditition of the surrounding water
area and possible migration of elements in the sediment.

6
aQq__XatgL in addition to air, is another important transfer
agent of radionuclides. It is also an important research
object, because all nuclear power plants in the Nordic
countries are situated on the coast.
Selection of sampling area
The selection of the appropriate sampling area
or point is important, each sample must represent the
sampling time and area as well as possible.
In the ag-Ditoring programmes_of nuclear power_21ants
and re _� cL_Ltagtors, the sampling areas are selected
to represent different distances to the reactor, being
anything from hundreds of metres to tens of kilometres.
In the choice of the sampling point for example,
wind conditions and especially the dominating direction
of the wind are considered for monitoring air and deposi-
tion. In aquatic environments the knowledge of water
currents is required.
In nation-wid rveying of the global _faUmgut
the sampling areas are selected to represent the whole
country. Measurements of samples then permit the fall-
out level over the whole country to be evaluated.
The monitoring of nuclear power plants and reactors
also requires the results of nation-wide monitoring
programmes for comparison. When analysing a substance
such as milk it is important to compare results f rom
the vicinity of the reactor with the results of the
nation-wide programme. Thus annual and seasonal variations
in the fall-out level can be excluded from the releases
from reactors.
The sizes of sampling areas vary depending on the
type of sample. Rainwater samples are generally collected
at the same fixed points by assuming that the composition
of rainwater is constant in the area of interest. For
plant samples, a more extensive area is chosen to ascertain
a representative sample.

7
A- r _s a mpL�s are primarily taken on the b as is ofmeteorological conditions. The environment around a
nuclear power plant or a reactor is monitored by selecting
an area where te activity concentration in air can
be supposed to be highest. The samples are usually
taken where there is no interference from roads and
other dusty place.
For the nation-wide global fall-out monitoring
the most representative sampling sites are selected.
When meteorological conditions vary greatly in different
parts of the country, samples should be collected according-
ly.
RajaijzLttrgQ1lp�ctQxs are usually placed according
to the same principles as air collectors. Air concentrations
usually show smaller variations than deposited activity
which means that fewer air sampling stations are necessary
than rainwater stations.
Soil g5ampl-es are collected from undisturbed soil
if possible. The collection area selected is generally
f lat and open terrain, without shadowing vegetation.
The selection of sampling areas depends on the purpose
of the soil sample. Smaller, exactly limited areas
are selected for annual follow-up sampling. For an
average areal concentration, a larger area is chosento provide several parallel samples.
In mkjLarapjinjz the use of larger dairies can
make it difficult to find the area of production. When
the area has been determined geographically, the proportion
of milk of the total national production must also be
known. This applies to other foodstuffs as well. Thus
the foodstuff samples are collected from producers or
wholesalers who know the production areas.

8
Selection of sampling frequency and time
The f requency of the s amp ling also a f fects the
representativeness of the samples Some samples, e.g.
air and deposition, are collected continuously. Samples
are analysed daily, weekly, monthly or quarterly. Continuous
sampling may sometimes be substituted by periodical
collection of, say, milk samples in the environment
of nuclear power plants or reactors. For example, milk
samples are taken once a week for 131I determinations,
and bulked weekly samples are analysed monthly for 137cs
and 89 Sr and quarterly for 9OSr.
Cereals and other plant samples are mostly takenafter harvesting, but quickly growing plants, such as
grass, are collected several times during the summer.
Meat samples are generally collected after the autumn
slaughter and samples of game meat during the hunting
season.
The prevailing conditions and their influence on
the results are usually considered in the selection
of sampling time. For example, in unfiltered sea water
some radionuclide concentrations vary seasonally. Furthermo-
re salinity, temperature and amounts of stable isotopes
may have seasonal variations affecting the concentrations
in aquatic samples. Also the concentrations of reactor-
originating nuclides in sea water samples can vary signifi-
cantly, depending on the sampling moment. If the sample
happens to be taken just when the discharge plume is
at the sampling site the concentrations of discharge
nuclides will probably be high whereas on the next day
they may be below the detection limit. These phenomena
should be considered when results are compared.
9
5-eleclion of samp _zje-gnd sa pling m thod
Sample size depends essentially on the activity
and ambition of the detection level and on such factors
as the nuclide, the measuring equipment, and the need
for parallel measurements. Samples with a high water
content tend to be big, since there is little dry material.
Methods of sampling different materials also vary.
Certaing facts have to be taken into account when selecting
the sampling methods.
Soil sarDples are usually collected to a depth of
25 to 50 cm, depending on the quality of the soil The
topmost layer, 0-5 cm, is sufficient for monitoring
discharges from nuclear power plants. The upper layer
is important, because most of the radioactivity is usually
concentrated in that layer. Great care must be observed
in sampling to ensure that undisturbed samples are taken.
The height of grass samplga is taken into account.
For instance when the food chain air-grass-cow-man is
studied the grass is cut at the same height as the
cow bits it of.
In collecting vegetables, only the edible parts
of the plant are used for analysis.
Sea water samgling is usually carried out at adepth of about m when studying surface water and at
about m above the bottom when studying bottom water.
Also the whole depth distribution of water can be measured.
Samplers or plastic vessels are used for collecting.
Sampling of near bottom water is done carefully, without
mixing the bottom material.
Sediment is sampled with various gravity and box
corers. The diameters of the samplers and the number
of parallel samples taken for sufficient amounts of
sediment material vary greatly. Samples are usually
sliced into subsamples. It is important to take an
undisturbed sample, without mixing the layers missing
the uppermost layer of the sediment.
1 0Se d.i e et with traps, varying
.a-a-t-pr.jal is collected
considerably in diameter and model but so that the ratio
of the height to the diameter of the tap is more than
3 to avoid under or over trapping.
is carried out by divers, drags
or directly by hands. When using drags, one cannot
be sure of the quality of the sample. An advantage
for the diver is that plants can be collected by hand
selecting them one by one at the sampling site. Various
bottom samplers, crabs or dredges are used for sampling
bottom animals.
The sampling methods of different environmental
materials vary substantially. Each of the Nordic countries
has its own methods for different sample types presented
in connection with the different sample materials.
PRETREATMENT
The pretreatment methods vary significantly for
each of the different materials and in each of the Nordic
countries. There are however some general considerations
for the pretreatment steps.
Storage
The samples must be stored without any risk of
contamination, avoiding critical spoiling. The material
of the containers for the liquid samples should be suitable
for storing. Acid and carriers are added to water sample
as soon as possible after sampling, avoiding adsorbtion
of nuclides onto the walls of the containers. Before
the sampling, acid is often added to the bottles placed
in rainwater collectors. The longer the storing period
the more important the acidifying of the water sample.
For short periods the biota and sediment samples
can be stored in a refrigerator 2-+40C), whereas long-

1 1
term storing is better done by freezing. Several foodstuffs
are also stored frozen. For short periods milk is usually
stored in a refrigerator and occasionally a preservative
e.g. sodium azid is added to prevent it from turning
sour.
Several samples are stored dried or ashed, thus
dry storage is needed.
C-leal2ing
Cleaning of the sample from other materials involves
pretreatment. For example, plant samples are freed
of mould, parts of other plants and earth. Dead parts
of the plant are also removed. Sea water samples can
be filtered if the activity or amount of particles is
measured separately. Soil samples are freed of plant
roots etc.
The cleaness of the collectors and containers may
also affect the final result. When collecting deposition
for strontium and caesium analyses, the collectors have
to be rinsed throughly for otherwise the absorbed dry
deposition on the surface is lost. It is important
that the collectors are carefully cleaned for the next
sampling period.
Drying
Drying increases the amount of solid material in
samples and permits longer storage. Before analysis
solid samples are usually dried either in an oven or
at room temperature. It is important to prevent contamina-
tion during the drying procedure.
Samples are dried carefully and for a sufficiently
long time at a fixed temperature to a constant weight.
Measuring of both fresh and dry weight is required for
the reporting of results.

2
Freeze-drying is a simple and reliable method that
renders most samples easy to handle.
Bom.g.g.g.Djzing ad__spD33jnp1 i&
Homogenizing of the sample before subsampling for
analysis is very important because dried samples contain
grains or particles of different sizes. It is generally
done after drying (or ashing). The subsampling is done
carefully with a suitable apparatus or by hand. In
spite of homogenizing, the subsample does not always
represent the entire sample. Some nuclides may fasten
or be adsorbed in different ways onto fine-grained and
coarse-grained parts of materials.
EvapDration
Evaporation is the most commonly used concentrating
pretreatment of liquid samples. Excessive evaporation
temperature can cause the sample to boil and scatter.
The evaporation bowl has to be made of such material
that the evaporating material does not absorb into it.
The walls are washed carefully after evaporation.
Spectrometric measurements are often done directly from
dried liquid material without measuring the yield, assuming
it to be 100%.
IQ n- e x cbanak
In some countries ion exchange is used in the col-
lection of deposition. For these resins, the correct
grain size and the method of regeneration are of great
importance. The amount of resin also affects the adsorp-
tion of nuclides. It is essential that the nuclides
studied are totally adsorbed in the resin, because no

3
yield determination is done4.
PuL-and -w.91-a-5bing
Solid samples are usually dry or wet ashed before
radiochemical separation. The temperatures for dry
a sh i ng v a r y , mos t c ommon ly be ing 4500C The ashing
time depends on the material. Dry ashing is only used
for determining nuclides which do not evaporate at the
temperature used. Even at 4500C sulphur and phosphorus
can cause mterial to glow, resulting locally higher
temperatures and loss of some nuclides. Carriers or
tracers should be added before ashing to ensure that
they are in the same chemical form as the nuclide to
be analysed. However, they are generally added after
dry ashing. Measuring of the ash weight is important
for calculating results.
If dry ashing is not suitable the sample can be
wet ashed. Carriers and tracers are usually added before
a wet ashing procedure.
Hydrofluor.ic-ac-id-treatmgnt-and fusion
Hydrofluoric acid treatment may be necessary for
some samples with a high content of silicates. With
some biota samples, this is done after wet ashing before
separation of plutonium and americium.
Samples difficult to melt or dissolve are fused.
In strontium analysis, carbonate fusion is done for
insoluble parts of rainwater and plant samples. Natrium
hydroxide - natrium nitrate fusion is necessary for
some air filters.

4
Lg3china
Acid leaching is done for soil and sediment samples.
For transuranium analysis, combined wet ashing and acid
leaching can compensate for dry ashing.
For strontium analysis in soil and sediment, leaching
dissolves biologically available radionuclides for the
sample. To ensure that the results are comparable the
leaching period has to be long enough and the same for
all samples of the same type.
DETAILED METHODS OF SAMPLING AND PRETREATMENT
Air
Air samples are collected for monitoring artificial
radioactivity in the air near nuclear power plants and
reactors. Global fall-out is also studied. The sampling
is done for other purposes as well, e.g. as at the University
of Lund in Sweden, where radon daughters are monitored
in the environment of planned uranium mining sites.
The purpose of the sampling affects the choice
of sampling site.
The selection of the type of sampler is principally
a technical procedure. The amount of air is a parameter
which affects the minimum detectable activity and varies
between laboratories from 300 m3 d-1 to 156000 m3 d-1.
Air samples are collected on glass fiber or on
coal-impregnated glass fiber filters or on both successive-
ly. If the sample is ashed for analysis a paper filter
must be used. Sampling time varies from one day to
two weeks, being mostly one week. The height of the
sampling point varies from one to three metres from
the ground. In one laboratory the sampling point is
on the roof of the laboratory, about 15 m above ground.
From air filters, y-emitters are determined in
all laboratories. A 1 s o ,90 Sr is analyzed monthly or

1 5
quarterly on bulked samles In one laboratory, total-
ccand -� are also determined.
Pretreatment of f ilters is done in dif ferent ways
For total-a and -� measuring no pretreatment is done.
Filters are normally compressed to provide suitable
counting geometry for radionuclide analysis by gamma-
spectrometry. Paper f ilters are ashed before go Sr ana-
lysis. Combined glass fiber filters representing the
desired time period are ground and homogenized before
subsampling for the 9OSr analyses. Filters are fused
with natrium hydroxide and natrium nitrate before proper
strontium separation.
Table I shows the data on the collectors and sampling
and pretreatment methods used in the different laboratories.
Differences in sampling height and pretreatment
methods can affect the comparability of results from
different countries. The detection of short-lived
y-nuclides depends on the length of the sampling period
and the interval between sampling and measurement.
DgpoLi-tion
Deposition samples are collected in all Nordic
countries. The samples are used for monitoring both
nuclear power plants or reactors and the global fall-
out level in the country concerned. Samples are also
collected for special purposes, such as dose and model
calculations. Also the environments of the planned
uranium mining sites are studied.
Dry and wet deposits are collected together into
open collectors.
Collectors vary from country to country. Their
areas vary from 0 .05 m2 to m2. This affects the
detection limit. The material is either stainless steel,
plastic coated glass-fiber or brass. The last is used for
tritium sampling. The height of the collector from
the ground varies from m to 25 m.

6
Ion exchange resin is used as a sampling method
in three laboratories. Both anion and cation exchange
resins are used in the columns. Thus handling of large
amounts of rainwater can be avoided.
The sampling period of deposition is usually one
month. Ion exchangers are changed once a week and collectors
are washed and cleaned monthly. Samples are analysed
monthly or as combined samples of several months, e.g. quar-
terly.
'Y-nuclides are determined in all Nordic countries.89 Sr, 9OSr, total-a and total-� are also determined.
Tritium is measured from deposition in one laboratory
and transuranic elements in another.Rinsing and washing of the collectors are done
in the field at the end of the sampling period. Collectors
are rinsed with either acidic solution or distilled
water or with both, adding the washings to the sample.
Collectors for tritium samples are washed without taking
the washing with. Carriers are added either before
collecting into the collecting vessel or in the laboratory
into the sample. No carrier is added to the tritium
samples. Ion exchange resins are not usually pretreated
in the field.
Rainwater samples are evaporated in the laboratories.
In some laboratories -nuclides and possibly total-a,
total-� and 89,90Sr are measured or analysed directly
from evaporated samples; in others, evaporated samples
are ashed before the measurements. Ashing temperatures
vary from 300 OC to 450 OC. The activity of ion exchange
resin is measured directly or from the ashed sample
as well. Tritium samples are pretreated by distilling.
Table II summarizes the various sampling and pretreat-
ment procedures for rainwater.
Differences in sampling and pretreatment methods
may affect the comparability of results between laborato-
ries. These differences are probably caused by the
types of collectors, the use of ion exchangers, and
the different ways of rinsings and washings of collectors
7
and of ashing samples.
.5-Q-U
Soil samples are collected for studying the transport
of radionuclides, special attention being given to the
slow accumulation of long-lived fall-out nuclides.
The soil in the environments of nuclear power plants
is also monitored. Moreover soil samples are analysed
for radioecological survey of the transfer of radionuclides
from soil to plants and for the effect different soils
have on this transport. Natural radioactivity in the
soil used for building materials is also studied.
The sampling areas are selected according to the
purpose of the study. The sampling depth varies from
0 to 25 cm or to 50 cm. When monitoring nuclear power
plants only, the topmost 0-5 cm layer of the soil is
sufficient. The collecting is carried out with either
a spade or a metallic auger. The diameter of the sampling
auger varies from 65 cm to 7 cm and the size of the
sampling area from 16 to several hundred square metres.
The purpose of the sample affects the selection of the
sampling area.
The sampling frequency of repeated collectionsvaries from once a year to every five years. The sample
is subsampled vertically into several slices, for example,
0-1 cm, 12 cm, or 0-5 cm, 510 cm.
The nuclides to be studied depend on the purpose
of the sample. y-emitters and specially 137Cs are measured
in monitoring programmes. In some laboratories Sr
and transuranic elements are also determined. Nuclidesof natural series, particularly isotopes of radium,
torium and uranium, are measured for control of the
natural radioactivity. In one laboratory the extractable
parts of these nuclides are studied.
The pretreatment methods vary in the Nordic labo-
ratories. Usually, samples are first freed of stuffs

1 8
and parts of plants and then weighed and dried Drying
temperatures vary from 20 to 1050C. Different methods
are used in homogenizing the samples; in some laboratories,
samples are milled and in the others sifted. Y-nuclides
are usually measured from dried samples. The soil sample
is ashed and leached before strontium analysis. Addition-
ally, plutonium, uranium and radium are measured from
the ashed sample in several laboratories, the temperature
of the ashing varying from 450 to 5500C. In one laboratory,
transuranium analysis is done from dried, wet ashed
and leached samples.
Table III shows the summary of the soil sampling
and pretreatment methods used.The different pretreatment methods of the samples
can affect the comparability of the results considerably.
Factors of this kind can be the homogenizing, the temperature
and the modes of ashing and the leaching time.
Milk
Milk is an important foodstuff causing internalradiation dose of 9Sr, 131I and 137Cs to man in the
Nordic countries.
Milk samples are analysed in all Nordic countries.
The most common purpose is monitoring of the nuclear
power plants. Milk analyses are used for dose and model
calculations as well.
Milk samples are collected from farms near nuclear
power plants or reactors. Reference and fall-out samples
are collected from either farms, dairies or transport
tanks. Dry milk samples are taken from factories.
The frequency of sampling depends on the nuclides
studied. For 131I analyses milk is usually taken once
a week. Iodine is measured either directly from milk
or by the ion exchange method. Y-nuclides especially137Cs, and 89,90 Sr are analysed once a month. For some
purposes milk samples are taken quarterly. In one laborato-

9
ry uranium and radium are also analysed from some samples.
Volumes of samples vary from two to eight litres,
1-2 kg of dry milk is taken for analyses.
Pretreatment methods vary in the different laborato-
ries. In two laboratories, Y-emitters are measured
directly. In other laboratories, milk is ashed before
analysing, the ashing temperatures being from 4500C
to 4900C.
Table IV gives data on the milk sampling and pretreat-
ment used in the Nordic laboratories.
Different modes of pretreatment can influence the
comparability of the results and some radionuclides
may be lost during evaporation and ashing, especially
in studies on fresh fall-out.
Other foodstuffs
Radioactivity of foodstuffs other than milk is
also studied. Meat, fish and cereals are the most analysed.
Furthermore, eggs, roots and other vegetables as well
as fruit and berries are collected.
Samples are collected for monitoring nuclear power
plants and for other purposes as well, to follow the
transfer of long-lived nuclides and doses and to make
model calculations. Some foodstuffs, e.g. lettuce and
elk meat, are used partly as indicators.
Sampling is carried out at private farms, central
stores and abattoirs. Samples are usually taken once
a year in connection with harvest; meat samples are
taken once or twice a year, except reindeer meat samples,
which are taken less frequently at present. Fish are
obtained from local fishermen or research stations.
The pretreatment methods depend on the sample.
Usually, the samples (especially meat and fish) are
frozen first. The samples are cleaned, the edible part
being retained for analysing. In some laboratories,
Y-measurements are made from dried sample, especially

20
from plants, and in others from ashed sample. The dried
samples are ashed at temperatures ranging from 4500C
to 5500C.
Y -nu c lid es, especially 137Cs , are analysed from
all foodstuffs and 239,240 Pu from some sample types.
The Sr is determined in some foodstuffs by some laborato-
ries. Table V summarizes the sampling and pretreatment
methods of foodstuffs except fish used by the Nordic
laboratories.
j_e=_P__strial indicators
Terrestrial indicator samples are collected for
monitoring the environments of nuclear power plants
and uranium deposits. Grass is selected as an indicator
sample and also because of its importance as a link
in food chains. Various mosses and lichens are studied
in the monitoring of nuclear power plants and for investiga-
ting food chains. Different species of lichen and moss
are collected for monitoring uranium deposits.
In summer the sampling frequency varies from once
to four times a year. Grass is usually collected at
the same farms as the milk samples for studies on the
air-grass-cow-man food chain. The sampling area varies
from 025 to 8 m2. Normally moss and lichen are collected
from areas of occurence near the environments of nuclear
power plants or uranium deposits. The samples weigh
a few kilograms.
Pretreatment methods depend on the nuclides studied
and vary in different laboratories. 131I can be measured
directly from fresh or dried grass. In some laboratories
the Y-nuclides are measured from ashed samples and in
the others from dried samples. The ashing temperatures
vary from 4500C to 5500C. 89,90 Sr and transuranic elements
are also analysed. U, Ra, Po and Pb isotopes are determined
for the monitoring of uranium deposits. 55Fe, 239PU
and 241 Am are also determined in the investigation of
2
food chains.
Table VI summarizes the different indicator organisms
as well as the sampling and pretreatment methods used
by the laboratories.
The differences between laboratories in sampling
and pretreatment may influence the comparability of
the results.
Sea water
Sea water is an important transfer agent for radio-
nuclides in the environment.
Sea water samples are collected for monitoring
the environments of nuclear power plants. Following
the radioactive contamination of the Baltic Sea, the
Danish Straits, the North Sea and the North Atlantic
is also performed. Separate projects, such as coordinated
research programme of the IAEA "Study of Radioactive
Materials in the Baltic Sea" have been conducted.
Depending on the purpose, the sampling frequency
varies from once to several times a year.
The sampling areas are also chosen according to
the purpose. In the monitoring programmes of the nuclear
power plants most of the water samples are collected
near the coast. In studies of the condition of the
sea area, the samples are taken over the whole of the
area studied.
Both surface and near bottom waters are analysed.
The samples are taken either into a vessel direct
or using a Ruttner-sampler. Pumping and filtering is
used to study the amounts of particles and the distribution
between particulate and the soluble forms. Near-bottom
water is usually taken from one metre above the bottom.
The volume of the sample varies from one litre to about
two thousand litres depending on which nuclides are
to be determined.
Y-nuclides are usually determined from all sea

22
water samples. Several nuclides, e.g. strontium, tritium,
plutonium, americium, thorium, uranium, neptunium, polonium,
technetium and lead are determined from sea water samples.
Some of these nuclides are also studied from filtered
water and from particles.
The pretreatment method depends on the nuclides
studied. Y-nuclides are measured from evaporated samples
or from sea water samples direct. Large samples are
commonly pretreated by precipitation; AMP precipitation
is usually done for caesium determination, and hydroxide
precipitation for transuranics. Analyses are also done
on evaporated samples. Samples for measuring tritium
are first distilled.
All determinations can be done directly from unfil-
tered water. For some purposes such as the determination
of the amount of the particles, the water samples can
be filtered through 045 or the 03 Pm filters.
Table VII summarizes the sampling and pretreatment
methods for sea water samples.
Sedi en -and mentin&__=_tgxiaJ
Sediment and sedimenting material are important
research objects in the aquatic ecosystem. They are
collected for the monitoring of the nuclear power plants.
Additionally sediment samples are collected for monitoring
global fall-out levels. Sediment is an important link
in the studies of aquatic food chains. The age of sediment
and the distribution of radionuclides in sediment are
also investigated.
The sampling areas are selected according to the
purpose of sampling. Large sedimentation basins of
the sea area are chosen for sampling points, in studies
of vertical distribution and levels of long-lived radionuc-
lides. Additionally sediments of some lakes are studied.
Sediment samples are usually taken once a year. During
the open water period sedimenting material is collected

2 3
continuously at several points near the nuclear power
p 1 a n t s . Special monitoring in the Biotest basin in
Forsmark, Sweden, is performed. Sedimenting material
is usually collected at a depth of one metre above the
bottom; also depths of and 10 metres from the surface
are used. Before the measurements, the samples are
combined into three-month samples.
Different apparatuses are used for collecting sedi-
ment. Usually, samples can be sliced into 1-5 cm subsamp-
les.
Sedimenting material is collected in traps of various
kind. The models and areas of sampling tubes vary greatly.
y-nuclides are measured from most samples, especially
the 137Cs content is followed. 9OSr, 21OPb, 2
2 3 U , 238U , 2 3 9 2 4 Pu and 2 4 Am are also determined
from some samples.
Before Y-measuring the samples are dried. Frozen
samples can be dried with a vacuum freeze-drier. This
makes the samples easier to handle. Samples are ashed
and acid leached for strontium analysis. For plutonium
and americium measurements dried samples are ashed or
wet ashed.
Table VIII summarizes methods of sampling sediment
and sedimenting material, as well as the pretreatment
methods.
There are several factors, which may affect the
comparability of the results. It is of utmost importance
to keep the sample undisturbed during sampling. Mixing
the sediment layers or missing the uppermost layer with
a high water content leads to incorrect vertical distribution
or/and total contents of the radionuclides. Different
apparatuses with various diameters may also affect results.

24
t o r s
Aquatic indicator organisms are useful monitoring
objects when controlling environments of the nuclear
power plants. They are also collected for studing fall-
out levels in an aquatic environment.
Radioactivity measurements of biota samples are
included also in the coordinated IAEA programme. In
1980-82 a Joint Nordic Fucus Project was carried out
in Nordic countries to compare the contents of radionuclides
in different sea areas.
The sampling areas are chosen according to the
purpose of the study and the occurrence of the indicator
species. FLLcu5 is the most often studied
species of algae in the Nordic countries. Additionally
other species and bottom animals are studied. The sampling
methods, diving, fishpots and several kinds of bottom
samplers, depend on the sampling objects.
y-nuclides are usually determined from aquatic
indicators. The short-lived discharge nuclides are
of special interest in the vicinities of nuclear power
plants. 89,90 Sr is also analysed from most samples,
plutonium, americium and technetium from some.
Bottom animal samples are preserved frozen. They
are dried in an oven or in a freeze-drier, and ground
and homogenized before Y-counting. Strontium analysis
is preceded by ashing and transuranic analysis by ashing
or wet ashing and acid leaching. Hydrofluoric acid
treatment is necessary for some algae species, especially
for the determination of americium.
Table IX summarizes the sampling and pretreatment
methods of aquatic indicators.
25
ANALYSING METHODS
am�ipectr ngtry
'Y-spectrometry is used by all Nordic laboratories.
Preparation of the sample for the measuring geometry
Solid samples are generally dried, ground and homo-
genized before measurements. In some laboratories chemical
separation is carried out to concentrate and clean the
samples. Liquid samples are evaporated to a smaller
volume or to dryness; some samples are also ashed before
Y-measurement.
The measuring geometry depends, among other things
on the ambition for the detection limit, the amount
of sample available for analysis, and the effectivity
of pre-concentration. Different boxes and Marinelli
beakers are generally used as measuring geometries; some
samples are pressed into discs.
Measuring
The detectors most commonly used are Ge (Li) and
high purity Ge or NaI detectors. The samples are measured
in a background shield to reduce the background and
are usually placed directly on the detector to increase
the effeciency. Measuring times vary according to samples
and nuclides.
Analysing of spectrum
The gamma spectra are almost always analysed by
computer using the programs developed for this purpose.
The programs generally contain partial factors like
- searching of peaks
- calculating of total peak area either according
to manual calculation or applaying

26
adapting of energy and effectivity calibrations
to the spectrum
identifying of the nuclides in the spectrum
making the half-life correction of the nuclide
making background correction
taking account of self absorption in the sample
(some)
making the coincidence correction (true coincidence,
some)
reporting of nuclide concentrations and the
error estimations.
Calibration of detectors
The detectors are almost always calibrated for
the same geometry as the measurement. Water is the
most common basic matrix, but other matrices with a
higher or a lower density are also used.
R a diQDbgm1PP_1_ de1_ermiD,_atdQPPf a di�m
In one laboratory, 137Cs is measured after a radiochemi-
cal separation, which is used for rainwater, ashed grass
and some milk samples.
After addition of the carrier, EDTA-solution is
added to the dissolved sample. Caesium is separated
from strontium by a cation exchange step, in which caesium
is eluted with diluted hydrocloric acid before strontium
e 1 u t i o n .Caesium is precipitated as phosphomolybdate
and purified by molybdate precipitation. After carbonate
precipitation caesium is precipitated as erchlorate
and the Reactivity of the sample is measured with an
�-analyser.
For fresh milk the above procedure is preceded
by cation exchange.
The scheme of the analysis is presented in Figure

27
MeIbDAz-.fDr- dtgrminalion-.Qf-5!rpntigL-B-9-
89 Sr 89 Y
T 112 50.5 d
9OSr 90Y 9OZr
28.8 y 64.1 h
The amounts of 89 Sr and 90 Sr can be determined
by measuring the combined amount of these nuclides and
by subsequent separating of 90 Sr and measuring its daughter
nuclide 90 Y. Strontium has to be separated by a chemical
procedure from calcium and other matrices in environmental
samples as well as from other radioisotopes.
Three different methods have been used in seven
Nordic laboratories.
Nitrate precipitation
The most common method for separating strontium5-8is the nitrate precipitation Pretreatment with
drying or ashing is followed by different precipitations
depending on the material; phosphate precipitation for
milk samples, oxalate precipitation for sediment, oil,
plant and rainwater samples, and both for sea water
samples. The treatment methods, however, differ in
the different laboratories.
Figure 2 shows the scheme for analysing soil and
sediment samples.
After the first precipitations earth alkaline metals
are isolated as carbonates (except in milk). Strontium
can be separated from calcium and partly from other
interfering ions by precipitating it as nitrate several
times with 70-77 nitric acid. Barium, radium and
lead can be separated by precipitating them as chromates.
Thorium, daughters of radium and rare earth metals,
particularly yttrium, are removed by ferric hydroxide
28
scavening. Strontium is ten recipitated as carbona-89 90
te. Sr and Sr can be measured from this precipi-
tation, and calculated after 90 Sr separation. Yttrium
carrier is added to the diluted sample, and the solution
is allowed to stand for at least fourteen davs after
,�erric hdroxide nrecipitation.a 90 Sr and 90 Y reach
equilibrium during this eriod.
Yttrium is purified from strontium with hydroxide
precipitation and precipitated after that as oxalate.
The amount o 90 Sr is determined by measuring its daughter
n u c I d e90 Y. Yttrium oxalate is measured with a low
background B-counter. It can also be measured as oxide
after ignition.
After yttrium precipitation, the yield of strontium
is measured from the solution; this can be done spectrometri-
cal ly. The yttrium yield is measured from hydroxide
or oxal ate TDrecipi tat i on e i th e r t i t r i met r i ca 1 1 y or
after ignition t Y203, gravimetrically. The yield
in Sr analvsis can also be determined by 85 Sr spike.
The amount of stable strontium, which is determined
separately, has to be taken into account in the yield
measurement e.g. in grass.
With some modifications, this method, used originally
by AERE, can be applied to all kinds of environmental
samples and foodstuffs. The chemical yields vary, depending
on the material. Strontium separates very well from
calcium and other interferences.
Although time-consuming the method is reliable
and safe for routine use. The reproducibility of the
chemical analysis is about %. The statistical error
of 89Sr and Sr results deloends on the activity of
the sample, the error of 89Sr result being always greater
than that of 9Sr.
a The waiting time for 90 Sr- 90 Y equilibrium to be reached
(18 days) is not needed if less occurate results are
adequate. A 0 % equilibrium can be reached in about
one day.

2 9
Ion exchange
One laboratory uses ion exchange method whereby
strontium is first separated from calcium with a cation
exchange step. Caesium is also removed from strontium
with cation exchange i EDTA. Caesium can be eluted
with diluted hydrochloric acid, strontium, wich is
retained in the resin, can be eluted with a stronger
acid. Figure 3 shows the scheme of the method. Strontium
is purified with chromate precipitation as in the nitrate
precipitation method, and the analysis is continued
according to it.
This method permits only ten day's waiting time
for equilibrium, which has to take account when calculating
the results. This period, however, is too short, for
it takes at least 14 days before the balance exists.
HDEHP extraction
The third method used for strontium determination9,10,11is the HDEHP extraction, used in one laboratory
The methods for fresh and old fall-out differ slighly. The
scheme of milk analysis for fresh fall-out nuclides
is shown in Figure 4 After pretreatment, drying and
ashing, the sample is diluted into 1M hydrochloric acid
and extracted with HDEHP solution in the pH range 1.0
- 1 .1. Strontium is retained in the water phase and
yttrium is extracted to the organic phase. After addition
of the yttrium-carrier and waiting for a balance between
90Y and 90 Sr a second extraction is done with HDEHP.
Calcium and other ions with an oxidation state of 2
are retained in the water phase. Yttrium is back-extracted
with nitric acid, precipitated as oxalate and measured.
The yield of strontium is measured from the calcium
yield, which is determined gravimetrically.
The first extraction step is not required for old
fall-out.
The detection limit for yttrium is 74 mBq/1 per

30
600 ml milk.
This HDEHP method is shorter and thus quicker than
the nitrate precipitation method in routine use. The
intercalibration results have been good; 89 Sr cannot
be determined with this method, however.
The method has also been modified to permit rapid12analyses (Fig. 5.) . These are done without the waiting
time and yttrium is analysed as in old fall-out samples.
Strontium is precipitated as phosphate and purified
with two nitrate precipitations. Then it is precipitated
as carbonate and measured with a ncounter. The detection
1 im i t f o r th is rap id method is 0 . 1 Bq l- f or 89Sr
and 90 Sr and 0074 Bq 1-1 for yttrium per 50 ml milk
sample
metbojj§-f-Qr-determina.ti.-Qn-of-.tr.�-nsur.ap-i-c-kl.emei2ts-
Determination of plutonium
Ion__eX_cLanZ& is the most commonly used method for13-20
plutonium separation It is used by five laborato-
ries.
The isotopes studied are 238 Pu, 239 Pu and 240 Pu.
First, the sample is ashed or wet ashed and acid leached.
For sea water samples, several hydroxide precipitations
are done after evaporation or from the samples direct. Af-
ter pretreatment, plutonium is oxidized to the 4 oxidation
state. The oxidants used are perhydrol and natrium
nitrite or hydroxylaminhydrochlorid. Anion exchange
is done in either a nitrate or a chloride form. Washing
is done with nitric acid and hydrochloric acid so that
the heavy metals, uranium and thorium, can be removed.
The first fraction from the exchange is collected for
americium and curium analysis if needed. Plutonium
is eluted by reducing to the 3 oxidation state; the
reducing agents most commonly used are hydrochloric
acid and ammonium iodide. Plutonium is electrodeposited

3
onto a sta in les s s t e e 1 d i sc a nd e a s u red w . t h cc - s p ec t -
rometry. The laboratories use different electrodeposition
methods. Deposition can be done from diluted nitric
acid or from sulphuric acid. Yields from electrodepositions
are usually good. 242 Pu tracer is added for the determina-
tion of chemical yield. Figure 6 shows the scheme for
Pu analysis.
This method works well and gives pure spectra.
Increasing of washing volumes and decreasing of elution
rate can improve the separation. The ion exchange method
is suitable for all kinds of samples: water, soil, sediment,
plants, seaweeds and mussels, only the pretreatment
stage differs. Intercalibrations have given good results.21
Tbe_&x1ragtiQnmethod is used in one laboratory
Samples are ashed and treated with acids. Figure 7 shows
the scheme for determination. Dilution is followed
by the lanthan fluoride precipitation. Plutonium is
extracted into TTA from Al(NO3)2 solution and then into
9M hydrochloric acid. During extraction p4+ separates
from trivalent lanthanides and actinides. Uranium is
separated with fluoride precipitation, ferric ions are
separated with ether extraction. Plutonium is then
electrodeposited.
The analysing methods differ from each other as
regards the time when tracer is added. This can influence
the final result. Further, the chemical state of the
tracer added and of the plutonium in the sample have
to be similar.
Determination of americium and curium
Three laboratories have reported their analysing
methods for americium 241 and curium 242 and 244.
T.b-e-.-ELILEH-E=,ext-r.�-cl-iDn metb-Qd is used in two labo-20,22,23
ratories . The analysis continues immediately
after plutonium separation. Both methods are very similar
and are based on HDEHP extraction and several ion exchange
steps (Fig. 8).

32
After plutonium ion exchange americium is in nitric
acid or hydrochloric acid solution. Oxalate precipitation
is done in one of the laboratories because of the high
calcium and phosphate content in sediment and sea water.
Calcium is separated with ferric hydroxide precipitation
and ferric-ions with anion exchange. The most part
of thorium and lanthanides can be eliminated with HDEHP
extraction. The rest of the thorium and plutonium can
be removed with cation and anion exchanges. The final
purification is done using anion exchange resin in a
nitric acid-methanol form. The remaining lanthanides
can be separated with rodanide washing, which leaves
americium and curium in the resin as complex ions.Two anion exchanges are required for soil and sediment
samples. Americium and curium are electrodeposited
in the same way as plutonium.
This method takes a long time, but it is suitable
for soil, sediment, biota and sea water. Chemical yields
have been 40 - 70% for sea water and 60 - 90% for the
other samples. The detection limit depends on the measuring
time, and is e.g. 0.37 x 10⁻³ mBq 1-1 for 100 1 sea
water sample for the measuring time of 7 - days.
The intercalibration results have been good.Io 22-26
-n- Jj�_ngemthod is used in one laboratory
Analysis continues from plutonium separation. Calcium
oxalate precipitation is done immediately after the
pretreatment and before the plutonium separation. There
are several ion exchange steps, including anionic and
cationic steps. The separation of americium is based
on eluation with rodanide ions in cationic ion exchange
resin Purification from lanthanides and thorium is
done with anion exchange and with rodanide ion solution
as well Americium is electrodeposited from diluted
sulphuric acid at pH 2 Figure shows the scheme for
determination.
Several parallel determinations have given good
results.

3 3
Df1PrMiDE1iOnDf_1rj1!uM
Tr it ium is an a I ysed from water samples; it is
measured with liquid scintillation counting either immediate-
ly after distillation or after electrolytic enrichment.
Tb.o�--gLI�LQ-t-rol_y.t-is-._QrLCicbmg-nl---uLQthQd is illustrated27,28in Figure 10 The sample for tritium measurement
is first distilled to dryness, after which 100 ml of
each sample are taken for electrolysis. Sodium peroxide
is added into the electrolysis cell for alkaline electro-
1 y s i S .Iron and nickel are used for the cathode and
the anode. The electrolysis is carried out at a temperature
of +100C first at a current of 30 amperes for three
days and then at 03 amperes for seven days. The remain-
ing volume about 35 ml is determined exactly. To prevent
large amounts of hydrogen from binding in the sodium
hydroxide, the enriched sample is neutralized with carbon
dioxide to sodium carbonate. The sample is then distilled
under reduced pressure at a low temperature in a dry
ice-ethanol bath. Liquid scintillation counting is
perfomed with dioxane-based scintillation solution.
Calibration is carried out using the external standard
channel-ratio method.The detection limit in this method is 09 kBq m-3
with an enrichment factor of 14 and a counting time
of 200 minutes. The reproducibility error of the whole
analysis ± la) is 10-20%.The is used
for water samples if only a rough estimation of the
tritium level is desired. First the sample is distilled
to dryness. The water and scintillation solution are
mixed at a ratio of 1:1 to obtain a homogeneous gel.
The sample is measured with a low background liquid-
scintillation counter. The calibration is done as in
the electrolytic enrichment method.
The detection limit in this method is only about
7 kBq m-3 and the reproducibility only 20-30% due to
the great influence of the background fluctuations.
34
The method is very quick and can be used for monitoring
tritium levels in the environment of nuclear power plants
and reactors.
!?etgrjP1nat�Qn_.PfrajL1.gP 226
Radium 226 determination is done for environmental
samples in monitoring the environment of uranium deposits29.
It is also determined when estimating internal doses
from foodstuffs.
The size of the sample analysed is one litre of
water or 5- 10 g of plant ash. The Ba-carrier is added
and the ash is dissolved in hydrocloric acid. The hydroxide-
carbonate fusion is done to the residue. After dis-
solution, the Pb-carrier is added. To the water sample,
both Ba- and Pb-carriers are added directly. Radium,
barium and lead are precipitated as sulphates. The
precipitation is purified from polonium by washing with
concentrated nitric acid. It is then dissolved in alkaline
EDTA solution and coprecipitated with barium sulphate
by adjusting the pH to 45. This slightly acidic solution
keeps naturally occurring alpha emitters and lead carrier
in solution as complex edetate ions, the barium complex
ion is destroyed and barium-radium sulphate precipitate
is formed. The time the precipitation takes must be
noted After washing with water the precipitate is
centrifuged on a weighed stainless steel planchette,
which is then dried and weighed. The alpha activity
of precipitated radium and its daughter are measured.
Figure 11 shows the scheme for the method.
The chemical yield is determined gravimetrically
from the added barium carrier or with a 133Ba spike.
The method is suitable for milk, foodstuffs and water.
If there is a lot. of barium in the samples, e.g. in
some seaweeds, the gravimetric yield determination is not
suitable. In these cases, a tracer has to be used or
the stable barium content in the sample has to be determined.

35
Dettrm!DL1!DnDf_12.ad_210
210 Pb is determined from plant, foodstuff, water
and sediment samples. The method is used to determine
210 Pb indirectly through its high energy beta-emitting
daughter 21 0 Bi ( 1 2 MeV, T1/2 = 5d)30. After ashing
the sample is stored for 30 days, during which time
21 0Bi reaches equilibrium with 210 Pb. The ash is digested
using both nitric acid and hydrocloric aid. 210 Bi
is isolated using DDTC (diethylammonium diethyldithiocarbama-
te) extraction in chloroform. Copper and iron can interfere
with the extraction. After destroying the organic matter
with nitric acid, hydroxide precipitation is done at
pH 8. Bismuth is then precipitated as bismuth oxychlo-
ride. The precipitation procedure is specific for bis-
muth. The precipitate is filtered, covered with aluminium
foil and counted in a low-background beta analyser.
Figure 12 shows the scheme of the analysis.
The recovery of bismuth is calculated using the
weight of bismuth in the final BiOCl precipitate and
the amount of Bi-carrier added before separation.
The detection limit of the method is about 37 mBq/
sample with a background lower than cpm and a standard
error 10) about 10%.
The results of analyses have been reproducible.
D 21Q
Polonium 210 is analysed from water, sediment and
some indicator organisms in the environment of planned
uranium mines31932. It is also analysed from sediment
to determinate the ratio 210 Pb- 210 Po for dating measurement.
After drying, the sample is wet ashed in nitric
acid and finally in a mixture of nitric and hydrochloric
ac id Wet ashing is necessary because polonium is a
very volatile element. Undissolved silicates are filtered.
The sample is neutralized and polonium is electrodeposited

3 6
onto a silver disc Hydrazine is added to prevent the
silver from darkening. The silver disc is measured
by a-spectrometry.The yield is determined by 209Po or 208Po tracer
added to the sample before wet ashing.
The method is quick and reliable.
Figure 13 shows the analysis scheme for polonium.
TREATMENT AND REPORTING OF RESULTS
The treatment and reporting of results, including
units, vary significantly in the publications by theNordic countries. Although the sampling and analysis
procedures were comparable, the great variations in
the processing and reporting would make the results
difficult to compare. Some important points in the
treatment and reporting of results are presented here.
Dec-a-y--a-n-�L-yi.e-l-cL-c--Q-rr-tgtio-n usually have to be donefirst. Especially in studies of short-lived nuclides
the correction for radioactive decay is very important.
Generally, the sampling date is the reference date.
Thp- the-x-gap-It must be confirmedbefore it is used. When parallel measurements have
to be done, the results are compared; the average is
usually taken as the final result. When calculating
averages of results it should be weighed carefully which
of the single results are to be included in the calculation.
Moreover when concentrations are very low, the minimum
detectable activity should be known, so that results
below it can be rejected.
The er D_r_J;LM_i_ta of the result should always be
estimated. In addition to the statistical error, errors
caused by the analysis and measuring apparatures should
be both estimated and reported as well. In many cases
only the statistical error of the activity measurement
is given.
or results should

37
also be considered; the more single results there are
the better the representativeness. Difficulties are
faced when conclusions have to be drawn from few results
or from only one result.
If j_tLQ___aye_r_p_ge is reported, it would be useful
to give the related range and the number of results
used.
The reporting of bacjigLQprLd data, that is e.g. seasonal
variation, salinity, pH, temperature of sea water, meteorolo-
gical conditions and precipitation (air, deposition)
makes it easier to compare the results. For foodstuff
results, it is an advantage to know the part of production
represented in the area reported.
-R-e�g.gmmniendat.ions
Some recommendations are needed to make it possible
to compare results of analyses of environmental samples
in the Nordic countries. The reporting of the results
should include sampling date, period, place or area,
amount and method. It is also useful to know the pretreat-
ment and analysing methods. Table X summarizes these
recommendations with special requirements for different
sample types.
In the reporting of solid foodstuffs, results from
the dry weight of plants and berries are more exact
than those from the fresh weight, which varies with
the humidity. Shaking and the time of collection can
affect the fresh weights of plants. In contrast the
fresh weight is more accurate for meat and fish in
which the end point of drying and the final dry weight
are difficult to determine. Fresh weights are also
used when calculating doses. In all results where the
units B kg-1 dry weight or Bq kg-1 fresh weight are
used, the ratio dry weight/fresh weight should be mentioned
as well.
In reporting milk results constant K and Ca values

3
should be used and their concentrations in a litre of
milk mentioned. When these values are known it is easy
to calculate a value of Bq 1-1 milk. In milk results
the knowledge of separation should be mentioned.
In reporting of results of sediment or sedimenting
material, the water content gives information about
the quality of the sediments. When reporting integral
va 1 u es f or sediment the unit of Bq m-2 is used In
this case, the depth of sediment sample should also
be mentioned.
PAN-SCANDINAVIAN INTERCALIBRATIONS
Pan-Scandinavian intercalibrations are carried
out in analysing sediment, algae (Eucu.
and sedimenting material and in comparing results of
direct measurements of external radiation and air filters.
Sjedimnt inter al ation
Sediment intercalibration was performed in May,
1979 at Barsebtick, Denmark33. The purpose was to calibrate
both the sampling apparatuses and the analyses done
by the laboratories. Five different devices were used
for sampling and compared by measuring the dry weight
of the samples. Samples were found to differ clearly
from each other.All five laboratories analysed the samples taken
with each type of collector. 40 K, 60CO, 137Cs and 239,240 Pu
were determined. In the results, differences in the
activity levels are observed. For example, the relative
standard deviation in the activity measurements of plutonium
varied from 11% to 54% between the different laboratories
and the samples.
This intercalibration showed that differences exist
between both the collectors and analyses; intercalibrations

3 9
of this kind are therefore to be recommended.
Epcus int-er-cal-ibrations
The sample was commercial dried seaweed from the Norwegian
Westcoast. Five laboratories participated in the exercise.
The 137Cs determinations showed a relative standard
deviation of 65 %, while 239,24OPu varied by 26 and
226 Ra by 3 . 9OSr was determined by only two laboratories,
the relative standard deviation being 8.5 The determina-241tion of Am was unsatisfactory, the two results reported
varying by nearly one order of magnitude.
.r.ad.jatjon_=n.jtoring
Two intercalibrations of detector systems for back-ground radiation monitoring were done34,35; the first
one was carried out at Risj6, Denmark, in June, 1980,
with 22 participants and 23 instruments from 11 different
laboratories; and the second in Helsinki, Finland, in
May, 1982, where there were 12 participants and 13 instru-ments from 6 laboratories. High-pressure ionization
chambers, NaI-scintillation counters, plastic sintillation
counters, Geiger-Muller counters and Ge(Li) detectors
as well as sets of TL dosimeter systems were the instruments
to be calibrated.
Ionization chambers appeared to yield the most
reliable results; the variations were larger in scintillators
and GM instruments. Comparison of the calculated response-
corrected terrestrial components, however, shows that
the variations can largely be explained by variations
in the response to components of natural gamma radiation.
Further intercalibrations and development of simple
evaluation procedures are needed to improve the accuracy
and comparability of environmental radiation measurements.

40
lnlgrcalihr�gllon around
I e v el_a iL
Intercalibration of air was done in May, 1982 at
Nurmij5rvi, Finland. Participants from four different
laboratories used their own air samplers, and evaluated
the artificial activity concentration in air by gammaspect-
rometry36.
Interca.I.ibratjon__Qf collecting, andau"jDg__ofaedjm_�1
Epterial
An intercalibration of collection of sedimenting
material was carried out in September - December 1981
at Loviisa, Finland. The aim was to compare the effecti-
veness of the different kinds of sediment traps used
in the Nordic countries in the field of radioecology,
as well as, the analyses of sedimenting material done
in the participating laboratories.
Four different traps from Sweden and one from Finland
were used to collect sedimenting material during a 12-
week period in the water recipient area of the Loviisa
nuclear power plant. Three of them represented cylindrical
sediment vessels of different design and size; other
two were identical cylinders with funnel bottoms. Marked
differences were found in the amounts of sedimenting
material collected by various traps when the results
for dry weights per square metre were compared.
Three laboratories analysed all the samples collected
gammaspectrometrically. Some differences were found
in these resultstoo. Report of this intercalibration
will be published in 1985.

4
REFERENCES
1. Paakkola, 0. , Sample Collection and Preparation of Samples,Badan Tenaga Atom Nasional, Jakarta, 1975.
2. Paakkola , 0 . , Insaml ing av milj6prov , Provinsamling ochanalysmetoder f6r radionuclider i 15ngaktiva bibsf5rprover,Lund, Sverige, 1980.
3. Paakkola , 0 . , Rantavaara , A. N5gra aktiva och inaktivaelement i v5xter i Finland, Nordiskt radioekologisemina-rium, Norrk6ping, Sverige, 1976.
4. Salo, A., Strontium-90 and Caesium-137 in Water in Finland,Report SFL-A4, Helsinki, 1966.
5. Bryant. F.J., Morgan, A., Spicer, G.S., The Determinationof Radiostrontium in Biological Materials, AERE-R 3030,Harwell, 1959.
6. Osmond, R.G., Owers, M.J., Healy, C., Mead, A.P., TheDetermination of Radioactivity Due to Caesium, Strontium,Barium and Cerium in Waters and Filters, AERE-R 2899,Harwell, 1959.
7. Paakkola, O., Voipio, A., Strontium-90 in the Baltic Sea,Suomen Kemistilehti, 38, 1965, pp. 11-17.
8. Determination of 89Sr and Sr in Aquatic Systems, Editedby M. Puhakainen, Finnish Centre for Radiation and NuclearSafety, Helsinki, 1984, in Finnish, English Summary
9. Butler, Sr-90 Monitoring at the Savannah River Plant,Health Physics, 8, 1962, pp. 273-277.
10. Peppard, Mason, Moline, The Use of Dioctyl Phoshoric AcidExtraction in the Isolation of Carrier-Free Y90, La-140,Ce-144, Pr-143 and Pr-144, Journ. Inorg. Nucl. Chem.,a, 1957, PP. 141-146.
11 Suomela, J., Halten av Sr-90 i mejerimjblk, 1965-1966,Intern basrapport fr5n speciallab., SSI-1967-017.
12 Suomela, J., Snabb analysmetod f6r best5mning av Sr-89,Sr-90 och Y90 f6retr5devis i mjblk, SSI-1973-010.
13 Procedure Manual, Health and Safety Laboratory Report,Radiochemical Determination of Plutonium in Soil by Leach-ing, HASL-300, 1972, pp. 89-114.

4 2
14 Hakanen, M., Jaakkola, T., Distribution of Fallout Pluto-nium in Reindeer in Radioactive Foodchains in the SubarcticEnvironment, Contract CHE 11-1)-3011 of US, ERDA, Techn.Prog. Rep. for the period of Aug. 15., 1975 - Aug. 14.,1976, (Paper No 77), COO-3011-1.
15. Talvitie, N. Radiochemical Determination of Plutoniumin Environmental and Biological Samples by Ion Exchange,Anal. Chem., Vol. 43, No 13, 1971, pp. 1827-1830.
16. Hakanen, M., Jaakkola, T., Distribution of Fallout Pluto-nium in Reindeer in Radioactive Foodchains in the SubarcticEnvironment, Contract No. CH E 11-1)-3011, US ERDA, Reportfor period Aug.15., 1976 - Nov. 14, 1977, Department ofRadiochemistry, University of Helsinki, 1977.
17. Roberts, F. Brauer, F. Sequential Separation of SomeActinide Elements by Ion Exchange, HW-60552, 1959.
18. Suomela , J. Metod f br best5mning av plutonium i omgivnings-prover, SSI-1977-021.
19. B5rring, N-E., Hellron, S., Kvantitativ elektrolytisk ut-f5llning av plutonium ur sur lbsning, AE-arbetsrapport,SSA-25, 1963.
20. Taipale, T. K., Tuomainen, K. Radiochemical Determinationof Plutonium and Americium from Seawater, Sediment andBiota, STUK-B-VALO 26, Helsinki, to be published
21. Levine, H., Lamanna, A., Radiochemical Determination ofPlutonium-239 in Low-Level Environmental Samples by Elect-rodeposition, Health Physics, 1965, Vol 11 , pp. 117-125.
22. Bojanowski, R., Livingston, H., Schneider, D., Mann, D. A Procedure for Analysis of Americium in Marine Environmen-tal Samples, in Reference Methods for Marine RadioactivityStudies 11, Techn. Rep. Ser. No. 169, Vienna, 1975, pp.77-86.
23. Holm, E., Ballestra, S., Fukai, R., A Method for Ion-Exc-hange Separation of Low Levels of Americium in Environmen-tal Materials, Talanta, Vol. 26., 1979, pp. 791-794.
24. Hakanen, M. Jaakkola, T. Rajamtiki, S. Determinationof 241Am in Sediment Samples in Radioactive Foodchainsin the Subarctic Environment, Contract No. EY-76-C-02-3011,A003, US DOE, Final Report, Department of Radiochemist-ry, University of Helsinki, 1979.
25. Coleman J Asprey , L. Chisholm, R. Journ . Inorg. Chem.Vol. 31, 1969, p. 1167.
26. Talvitie, N.A., Electrodeposition of Actinides for AlphaSpectrometric Determination, Anal. Chem. Vol. 44, 1972,p. 280.

4 3
27 Ostlund , H., Werner H., The electrolytic enrichment oftritium and deuterium for natural tritium measurements,Tritium in the Physical and Biologial Sciences, Vol. I,IAEA, Vienna, 1962.
28. Determination of Tritium from Water Samples with Electroly-tic Enrichment Method, Edited by R. Sax6n, Finnish Centrefor Radiation and Nuclear Safety, Helsinki, 1984.
29. Goldin, A.S., Determination of dissolved radium, Anal.Chem. Vol. 33, 1961, p. 406.
30. Modified from: Radiochemical procedures for determinationof selected members of the uranium and thorium series,Canmet Report 78-22, Canada Center for Mineral and EnergyTechnology, 1979.
31. Kauranen, P., Miettinen, J.K., in Radiecological Concentra-tion Methods, Ed. B. Aberg and F.P. Hungate, PergamonPress, Oxford, 1967.
32. Htis5nen, E., Dating of Sediments, Based on 210po Measure-ments, Radiochem. Radioanal. Letters, 31, 1977, pp.207-214.
33. Aarkrog, A., Nordisk Interkalibrering af sediment pr6veind-sampling og analyses NKA's styringsgruppe for radio6kologi,198o.
34. Utter-Jensen, L., Nielsen, S., A Nordic Intercomparisonof Detector Systems for Background Radiation Monitoring,Risj6-M-2266, Denmark, 1981.
35. Arvela, H., A Nordic Intercalibration and Evaluation ofthe Detector Responses to Natural Environmental Gamma Ra-diation, Helsinki, 1983, STL-A46.
36. An Intercomparison of Airborne Dust Sampling and SampleAnalysis between Nordic Countries, Joint Report Editedby Kari Sinkko, Helsinki, 1983, STL-B-TUTO-25.

Figure 1. Radiochemical determination of caesium 137.(Used in lab. no. 9 (Annex. 1.))
Sample solution Cs-Sr carrier
E D T A 0.75 M HCI
Cation N/
exchange Dowex Sr-5OW-X8
I- 5-0- 100 mesh_ fraction
osphomolybdatppt
olybdate p
Carbonate pp t
-measurements Perchlorate
Dilution forchemical yield
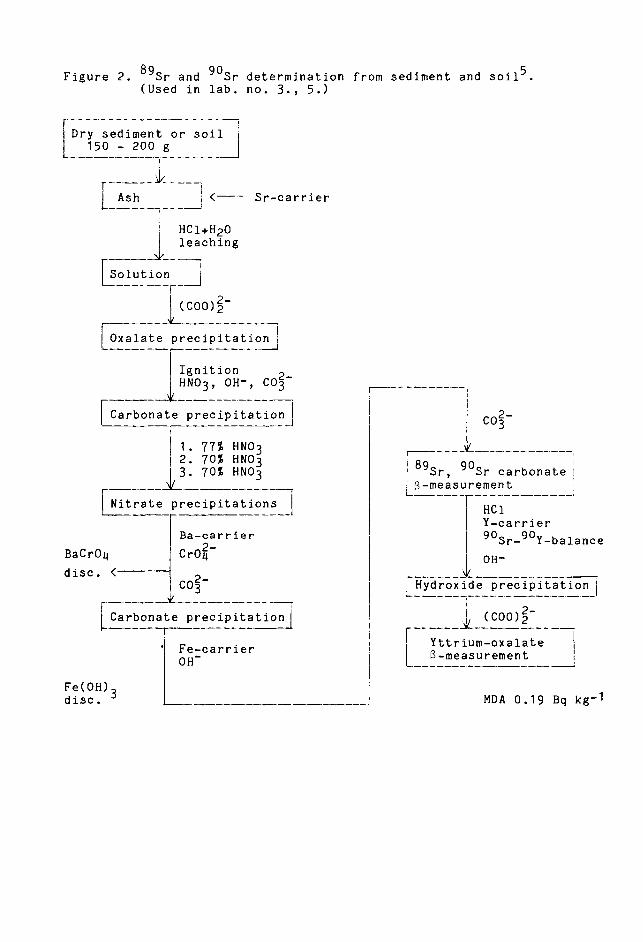
9 90 5Figure 2 Sr and Sr determination from sediment and soil(Used in lab. no. 3, 5.)
Dry sediment or soil I110 - 200
Ash Sr-carrier
HCl+H2Oleaching
SolutionI--- ___ - - -
2-COO)2
r-oxalate precipitations
Ignition 2-HNO3, OH-P 3
Carbonate precipitation C02-3
1. 77% HN0370% HN03 189 9070% HN03 Sr, Sr carbonatei
�-measurement
rate precipitation HC1Y-carrier
Ba-carrier 9OSr-90Y-balance2-
BaCrO4 CrO4 OH-disc. <-- 2-
C03 Hydroxide precipitation
Carbonate precipitation (COO)2
Fe-carrier Yttrium-oxalateOH- L-2 -measurement
Fe(OH)disc. 3 MDA 019 Bq kg-1

Figure 3 Determination of 90 Sr( 89 Sr).(Used in lab. no. 9)
Sample solution Cs-Sr-carrier
EDTA
[5ation exchange]
0.75 M-EC.I-> Cs-fraction
3 M HCI
Chro.mate pecipitation]
-----------Hydroxide precipitati�o]n
Sr-C arbonate precipitatLonl -measurement
Diluted for chemical yieldY-carrierSr-Y-balance (least 10 d)
Hydroxide precipitat::o]n
Y-oxalate precipitation 6-measurement
Chemical yield measurement

Figure 4 Determination of Sr 90 and calcium in milk 9,10,11(fresh fallout)(Used in lab. no 7)
Dairy milk 600 ml
ling to drynessLO - - - - - - - - - - - - - - - -
- - - - - - - - - - - - - - - - - --
Extraction with 20 Ashing at 3500 C 3 hHDEHP at pH 1.0 1.1 6500 C 16 h
- - - - - - - - - -
Lissolving in M HC1--------------- -A
Y-carrier 1 mgSr-Y-balance 14 d
Extraction with 5 % HDEHP!at pH 1.0 1.1
-----------
Backextraction into 3-M Hn3j
Y-oxalate precipitation MDA 7.4 mBq 1-1Sr
- ------- -- - ---
jIY-oxaiate!B-measurement
Precipitation of Ca-oxalate
Filtration;drying at 1100 C 30
!Gravimetric determination of!calcium

2Figure 5. Determination of Sr 89 and Sr 90 in milk(Rapid method)(Used in lab. no. 7)
Milk 5 ml
Sr-carrier 5 mgY-carrier 1 mgBa-carrier mgLa-carrier 1 mg
Bailing to dryness
FAshing at 6500 C 1 h
FDissolving in M HC1
I
Extraction with 5 % HDEHPat pH 1. - 1
Backextraction into 3 M HN03]
MDAy0.074 Bq 1-11 Y-oxalate precipitation
Y-oxalate Phosphate precipitation�-measurement I
i rate precipitation1. precip. 70 HN032. precip. 68 HN03
Ba-carrier mgHAc + NH4 Ac
Ba <- Chromate precipitate
Y-carrier 1 mg
y <__ r-Hyrox-Ide precipitation
1�
Carbonate precipitation
4 -Sr-carbonate] MDASr go 019 Bq 1-1�-measurement MDASr 89

Figure 6 Determination of plutonium in soil, sediment andbiotal 320
(Used in lab. no 3,4.,7-,9-,10-)
Dry samp 10(20)g or Dry sample
242 Pu-tracer243Am-tracer)------------
Wet ash ng & leaching Ashcons. HN03 + HC1
tracersFiltering
,�Poration dissolving
8 M HN03 9 M HC1)PU3+ > Pu 4+ oxidation
[Lnion ex hange
EffluentWas IP9A M-IN03 M HCII._ > (to analysis
of americium)
9 M HCI
(8 M HNO 3
PU +-> PU3+ reductiondisc. Eluation
Electrodepositioa-measurement
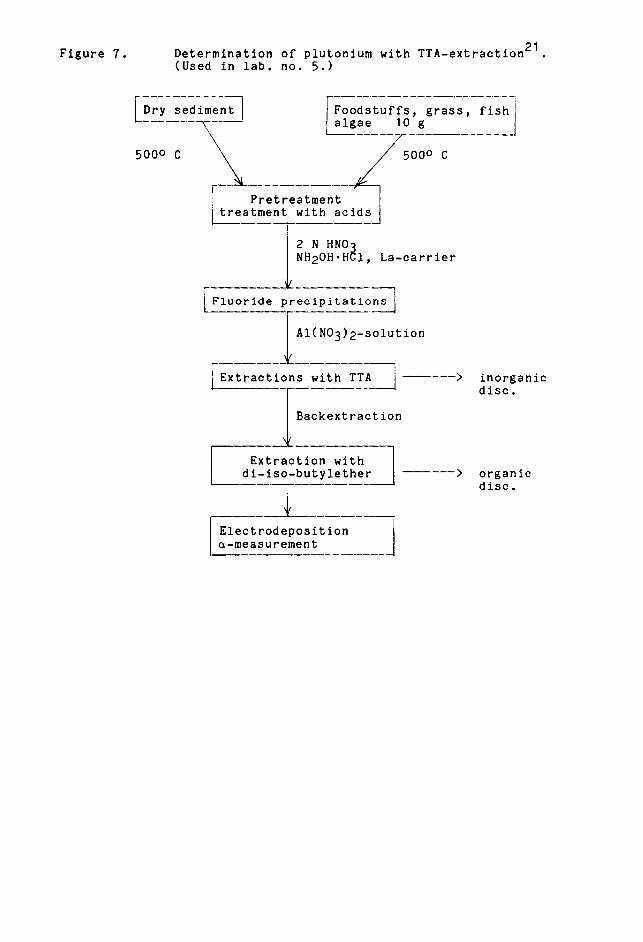
Figure 7 Determination of plutonium with TTA-extraction 21(Used in lab. no. 5.)
LDry sediment OCdstuffs, grass, fishialgae 10 g
5000 5000 C
Pretreatmenttreatmen with acids
2 N HN081NH20H-H La-carrier
ide precipitationsL!-,U Or__ - -WN03)2-sOlution
Extractions with TTA inorganicdisc.
Backextraction
Extraction withdi-iso-butylether organicL disc.
Electrodepositiona-measurement

20 22 2 3Figure 8. Determination of americium
(Used in lab. no 3, 10.)
Am-rrakt-'on evaporation (lab no.- 3.)
H20Ca-carrierpH 1.5
,'Oxalate precipitationI(COOH)2 - I
Filtering
filtrate > R.E.(partial), Fe,disc. phosphates etc
(lab. no. 10.) 3 MHC1Fe-carrier
Fe(OH) prewith N4-3
filtrate- > Ca 2+disc.
9 MHCI
i7ge Cl--form
Evaporation
4 M HN03
CationTh(partlal)< org. HDEHP-ex raction exchange Cl--form
disc.
Evaporation Anionexchange Cl-form
"H20, pH 2 3
Pb Ra inorganic evaporationMe�+ < disc. HDEHP-ex traction 1 M HN03-
93 % CH30H
0.075 M HC1 org.
... 11 AnIoR.E.(partial < ' xch n;e
disc.
orm. 4 HN03Th <
disc. 1 M NH4SCN-Evaporation 75 CH30"
R.M HCI 1M HNOA=- > E.
93 3H
1.5m HCl-
86 % C30H
Am, Cm

Figure 9. Determination of americium by ion exchange 22,24,25,26.(Used in lab. no. 4)
Am fraction12 M HC1
Anion exch
aporation5 M HC1
tion e h :�ge]
effluent-M HC > disc.
Washing
0.5 M Cl-> disc.
5 M NH4SCNni c h n gej
[A_on ex a_
effluent
-5 M NH4SCN > disc.Washing
-3--MNB4SCN disc.
0.1 M HC1
Evaporation
8 M HN03
Anion exch
8 M HN03
Evaporation
V
deposition of AmNH4)2SO4, pH 2

Figure 10. Determination of tritium from water samples 27,28(Used in lab. no. 3)
WATER SAMPLEvolume about 50 ml
Distillation to dryness
DISTILLED SAMPLE- two aliquots of 100 ml to
alkaline electrolysis
Electrolysis:3 days with 3 A7 days with 03 A
ELECTROLYZED SAMPLE- volume determination (about 35 ml)- neutralization with C02
Distillation under reducedpressure to remove NaOH
3H-SAMPLE- liquid scintillation counting with
dioxane-based scintillation solution
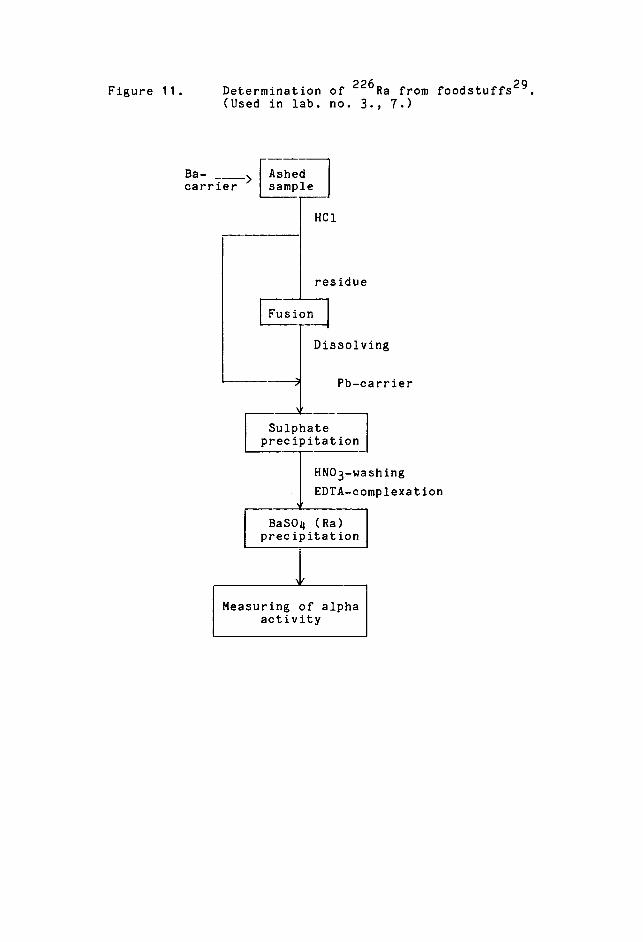
226 29Figure 11. Determination of Ra from foodstuffs(Used in lab. no. 3 7)
Ba- Ashedcarrier sample
HC1
residue
n
Dissolving
Pb-carrier
Sulphateprecipitation
HN03-washing
EDTA-complexation
BaSO4 (Ra)precipitation
I
Measuring of alphaactivity

Figure 12. Determination of 21 0Pb from plants and food-stuffs3O.(Used in lab. no. 3)
Dried sampleF __j< 4000 C
Ashed sam
Bi and Pb waiting for 21OPb- 210 Bi equil. 30 dayscarriers---> HN03 HC1
H20
ample inI- 2 HC1
DDTC-extr tion > inorg.
Pb
ample in.1 DDTO _C]
HN03 digesting of org.
NH3, pH
Hydroxide precipitate
Cl20
1-precipitation
Filtering
:overing with Al-absorbator
Recounting

Figure 13. Determination of polonium 21031,32 .(Used in lab. no. 3 4)
Sam 20 9Po-tracer
1wet a
FilteringSilicatesdisc.
Neutralizing8 M NaOHpH < 0.5
Hydratzine0hydrochlorideWarming 60
V
Electrodep 8s itionin 60 - 65 C
2 h
a-measurement

Table I. Sampling and pretreatment methods of air in the nordic laboratories.
Laboratory Purpose of Type of Sampling method Frequency Place Pretreatment Analysissampling collector amount filter (height)
Risj6 -control of -compres- 156000 m3/d -paper -1 day -3 m -ashing 90 Sr monthlyNational global and sor-cent- - 40000 m3/d -glass -1 week -1 m -pressing Y -nuclidesLaboratory local fall-out rifugalDenmark
Finnish Centre -control of I-compres- 18000 m3/d -glass -1 week -1.5 m -pressing y-nuclidesfor Radiation global and sor 90and Nuclear local fall- Sr quarterlySafety out -centrifu-Finland gal -1500 m3/d -glass 2 weeks -1 m
-carbon
University of -control of -2400 m3/d not -15 m -dryingHelsinki local and global conti- (on theDepartment of fall-out nuously roof)RadiochemistryFinland
continues
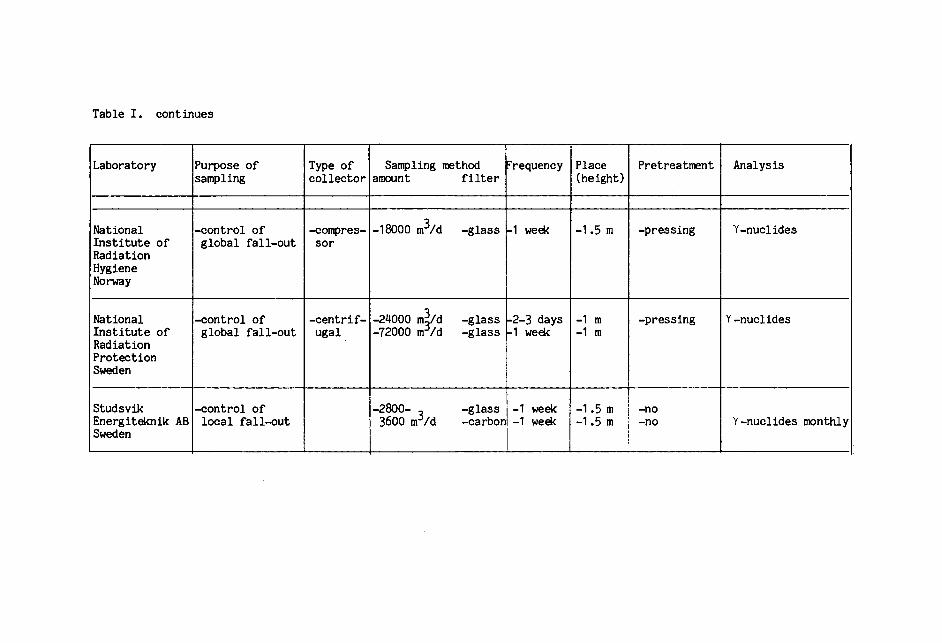
Table I. continues
Laboratory Purpose of Type of Sampling method Frequency Place Pretreatment Analysissampling collector amount filter (height)
National -control of -compres- 18000 m3/d -glass 1 week -1.5 m -pressing Y-nuclidesInstitute of global fall-out sorRadiationHygieneNorway
National -control of -centrif- 24000 3/d -glass 23 days 1 m -pressing Y -nucl idesInstitute of global fall-out ugal -72000 M3/d -glass -1 week -1 mRadiationProtectionSweden
Studsvik -control of -28oo- glass 1-1 week -1.5 m -noEnergiteknik AB local fall-out 3600 M3/d -carboni-1 week -1.5 m -no Y-nuclides monthlySweden
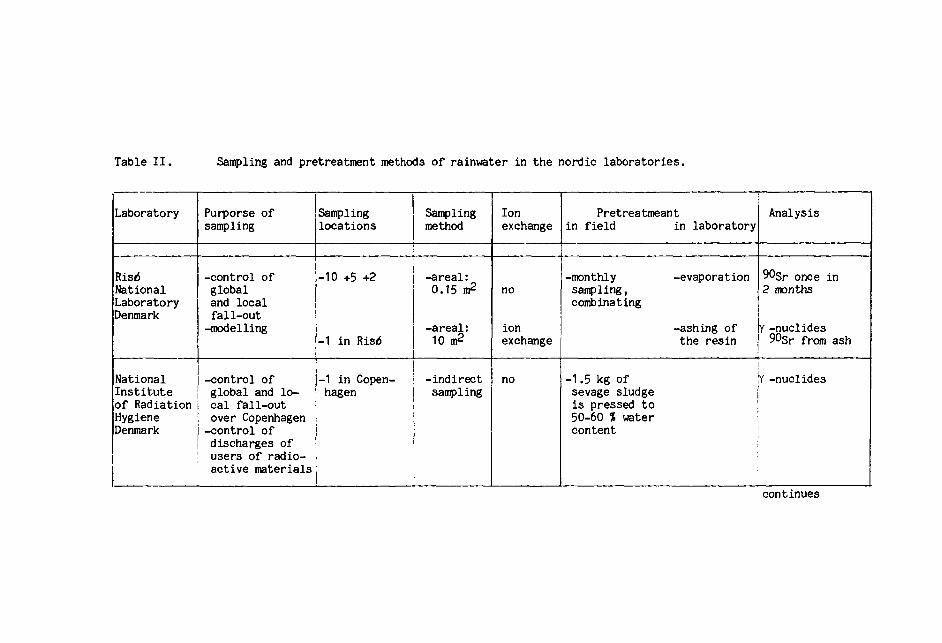
Table II. Sampling and pretreatment methods of rainwater in the nordic laboratories.
Laboratory Purporse of Sampling Sampling Ion Pretreatmeant Analysissampling locations method exchange in field in laboratory
Risj6 -control of -10 +5 2 -areal: -monthly -evaporation 9OSr once inNational global 0.15 m2 no sampling, 2 monthsLaboratory and local combinatingDenmark fall-out
-modelling areal: ion -ashing of -nuclides-1 in Risj6 10 m2 exchange the resin 9OSr from ash
National -control of -1 in Copen- -indirect no -1.5 kg of -nuclidesInstitute global and lo- hagen I sampling sevage sludgeof Radiation cal fall-out is pressed toHygiene over Copenhagen 50-60 waterDenmark 1-control of content
i discharges ofusers of radio-active materials
continues

Table II. continues
Laboratory Purporse of Sampling Sampling Ion Pretreatmeant Analysissampling locations method exchange in field in laboratory
Finnish -control of -18+5 in the -areal: no -washing with -evaporation Y-nuclides monthlyCentre for global and whole country -1 m2 2 1% HNO? and 89P90Sr monthlyRadiation local fall-out -0 .05 m distil ed -ashing (from some samples)and Nuclear -environmental (stainless water +4500CSafety studies near steel)Finland planned uranium 2 3
mines -0.05 m no -distilling H(brass) analysis mnthly-all collec- or quarter yearlytors sit-uated1 m aboveground
Institute -control of -5 locations to standard Ino -precipitation -evaporation Y-nuclidesfor Energy discharges and cover all dom- -metheoro- noted daily for total-B total-�Technology fall-out inating wind logical or monthlyNorway directions equipment -no pretreatment
continues

Table II. continues
Laboratory Purporse of Sampling Sampling Ion Pretreatmeant Analysissampling locations method exchange in field in laboratory
National -control of -7 locations -02 m 20 ml -resins are -ashing at -y-nuclidesInstitute of the Test Ban over the whole stainless anion changed once 3000 C aboutRadiation Treaty country steel and a week 20 hProtection -global and funnel 20ml Lwashing andSweden local fall-out -2.5 m cation cleaning once
studies and above exchange a monthcontrol ground resins
IStudsvik 2 [-washing with -evaporation
I-local control -1 location 1 m stein_� no:Energiteknik of the reactor less steell H20 once.AB a week�Sweden -5 locations 2
cover dom- -0.25 m anion -no pretreatment -noinating wind -1.5m and -changed oncedirections above cation a month
ground exchangeresins

Table III. Sampling and pretreatment methods of soil in the nordic laboratories.
Laboratory Purpose of Sampling Sampling Pretreatment Analysisthe sampling locations method
Ris6 -following vertical -10 locations -4x4 m 2 area -slices 0-10 cm, 9OSr 137CsNational transfer -8 subsamples 10-20 cm etc. 239,A0puLaboratory -auger 065mm -drying 241AMDenmark -accumulation -uncultivated soil -to 50 cm -sifting every fifth
studies in the soil mainly depht year-every fifth
year
Finnish Centre -measuring total -uncultivated soil -auger 7cm -slices 2 cm and 9OSr 137csfor Radiation amounts of nuclides in the environment -0-25 cm 6-20 cm 23V40puand Nuclear in soil per area of nuclear power -every third -drying at +850 C every thirdSafety and average plants year -sifting 2 mm) yearFinland concentration in -clayey moraine -combinating for
surface layer Pu-analysis
University of -measuring total -different farming i-spade -drying at 500C UraniumUppsala, concentrations environment -20 subsamples -millingRadiobiological -studies of trans- -different farming from 50 m area I-sifting 2 mm) 232Th 226RaInstitute fer in different areas in Skawaborg -0-25cm, 25-50cm 238U '234USweden soil type in western Sweden i-same firm placesi 2;2,rh, 232Thi 2 Ka: extraction
-studies of theextractable parts testsof nuclides
continues

Table III. continues
Laboratory Purpose of Sampling Sampling Pretreatment Analysisthe sampling locations method
University of -environments of -auger 7cm to -slices 3cm Uranium seriesLund planned uranium 30cm depht -drying U, Po, RaRadiation Phys- mines (Plentajok, -about 15 samples Y -nuclidesics Department Lilljuthatten) in every areaSweden
National Swedish -control of nu- -the environments -surface soil -cleaning Y-nuclidesEnvironment clear power plants of nuclear power 0-5cm -drying (9OSr,239,240puProtection Board plants -once a year -ashing at 4900 C may becomeSweden 2-3 areas/plant -2-3 litres actual)
National Insti- -dose estimates -gravel pits -occassional -crushing to small 226 Ratute of Radiation from building sampling from pieces 232 ThProtection material gravel 40iSweden
Studsvik -control of nuclear -2 locations accord- -once a year !-drying 1050 CIEnergiteknik AB power plants ing to monitoring J-homogenizing
ISweden -research programme 1-ashing 5500 Cprojects

Table IV. Sampling and pretreatment methods of milk in the nordic laboratories.
Laboratory Purpose of Sampling locations Sampling Pretreatment Analysissampling method
Ris6 -measuring the doses 7 drymilk factories -1 sample from the -ashing 90 Sr,137csNational of 9Sr,137cs over the whole production ofLaboratory caused by milk country a monthDenmark -modelling of -2 kg
radioactivecontamination offoodstuffs
Finnish Centre -measuring of aver- -3 dairies -1 sample weekly -evaporation 131I, 89Sr (iffor Radiation age concentration -6 dryrnilk factories analysed once a -ashing 4500 C needed)and Nuclear of Sr and 137cs month 9OS CaSafety in different areas -1 sample monthly 137cs', KFinland of production over from production
the whole country of a factory-dose estimates -5 litres or kg-control of nuclear -8 farms < 1km -1 sample weekly -0.01-0.02% NaN3 131I weekly
power plants from nucl.p.plant from every farm as preservative 137CS monthly-8 litres -evaporation 90sr monthly
-local dairy < 40km -1 sample weekly -ashingfrom largestoringtank
-8 litres from thewhole production
Institute for -control of -2 farms in the -1 sample weekly -no pretreatment Y-nuclides:Energy Technology discharges from environment of the or 131I weeklyNorway reactor institute -4 analysis yearly 9OSr quarter
yearly
continues

Table IV continues
Laboratory Purpose of Sampling locations Sampling Pretreatment Analysissampling method
National -control of -one farm near -1 I unseparated -no y -nuclidesSwedish nuclear each power plant milk from each specially 131iEnvironment power plants fa rmProtectionBoardSweden
National Insti- -control of -5 dairies -4 samples/dairy -ashing Y -nuclides, 137csKtute of Radiation Y-nuclides in milk -yearly 9OSrProtection -average concent- -2 litresSweden rations in the
country
Studsvik -control of the -1 farm -1 sample weekly -no 'Y -nuclides: 131I, 125j,Energiteknik AB environment of the or 137cs every secondSweden reactor -2 samples yearly week during the
(Sr, Cs) grazing period

Table V. Sampling and pretreatment methods of foodstuffs (other than milk) in the nordic laboratories.
Laboratory Purpose of Sampling material Sampling locations Pretreatment Analysissampling and method
- -----------------------------------------------------------
Ris6 -measuring of doses -cereals, vegetables -yearly from -ashing 9OSr,137csNational of Sr and 137cs bread, total diet different partsLaboratory -modelling of the countryDenmark meat, egg -from Copenhagen
- ---------
Finnish Centre -determination of -cereals, 3 kg -4 central- -cleaning 9OSr Cafor Radiation doses to a man (wheat, rye) stores yearly -drying 1050 C 137Cs, Kand Nuclear -determination of -leaf and root from 5-8 -milling nuclidesSafety average concent- vegetables, fruits product centers -ashing 4500 C 9,9OSrFinland rations of nu- berries 57 kg)
clides -meat, 23 kg -2 abattoirs(pork and beef) twice a year
-control of -cereals, kg -5 farms nearnuclear power (wheat, rye) nuclear powerplants plants
(< 20km)-lettuce, apple -once or twiceor currants a year
-meat, 2 kg (beef)
University of -following the -reindeer meat -Lappland in -freezing 137CS,239,240puHelsinki transfer of long- the connection -(drying 1050 C)Department of lived radio- of slaughtersRadiochemistry nuclides in -once a yearFinland food chains
continues

Table V. continues
Laboratory Purpose of Sampling material Sampling locations Pretreatment Analysissampling and method
National Swedish -control of -meat (elg, coat, -the environments -cleaning Y-nuclidesEnvironment nuclear power lamb) of nuclear -freezing 9OSr,236puProtection plants -cereals (wheat, power plants -drying (from someBoard barley) -yearly in the -ashing at 4900 C samples)Sweden -vegetables connection of
harvest orslaughter
National Insti- -control of -reindeer meat -in the connection -freezing 137cs, Ktute of Radia- -nuclides in of reindeertion Protection foodstuffs slaughter, someISweden samples as a
average of someyears
!Studsvik --control of -meat -the envir-on- -drying 1050 C Y-nuclides,Energiteknik AB nuclear power -cereals, vege- ments of nuclear -homogenizing'Sweden plants tables power plants -ashing at 5500 C
-once a year

Table VI. Sampling and pretreatment ethods of terrestrial indicators in the nordic laboratories.
Laboratory Purpose of Indicator Sampling locations Sampling JIF-retreatment Analysis� �-----the-sa-mpling---------------and--frequency method
-----------
Ris6 1-studies of food- -grass -the environment -1 m 2 area -combinating 131I,9OSriNational chain: grass-cow- of Ris,6, 33 -cutting � -ashing y-nuclidesLaboratory man, grass-air- points 16 km 1-2cm overlDenmark foodstuffs -four times a year soil
Finnish Centre -control of 1-grass -in the environ- -grass from� -cleaning 131Ifor Radiation the nuclear -moss ments of nuclear milk farms -drying 89,9OSrand Nuclear power plants -lichen power plants -cutting -milling y -guclidesSafety -monitoring of -beard moss -W 5 km 1-2 cm -ashing 22bRaFinland uranium deposits 2)0-10 km over soil +4500 C
-2-4 times a year -for 226Rain summertime
-the environmentof uranium depo-sitions in summertime
!University of -study of food -lichen Lappland and -sampling -cleaning 55Fe,210po-21OPb,!Helsinki chains southern Finland by hand -drying�Department of -not continuously 137CS, 9Sr, 239pu,Radiochemistry.Finland 241AM
2.Institute for -control of -grass -the environment -2 m area -ashing 131I (no pre-�Energy Technology the reactor in of Kjeller, 150- -direct treatment)Norway Kjeller 650m from reactor sampling Y -nuclides
-4-5 times a year without Puin summertime roots
continues

Table VI. continues
Laboratory Purpose of Indicator Sampling locations Sampling Pretreatment Analysisthe samplig and frequency method
National Swedish -control of -moss -the environment -2 m 2 areal -drying 1050C Y -nuclidesEnvironment nuclear power -lichen of nucl.p.plants, -ashing 5500CProtection Board 239,240plants -grass -2-3 areas or freeze- PuSweden -fern -once a year drying
University of -moss -the environments -0.25-8 m 21 -cleaning U, Ra PoLund, Radiation -lichen of planned -drying 'Y -nuclidesPhysics Depart- uranium mines -milling
�ment;Sweden
Studsvik -control of -grass -grass: 3 locations -grass: -drying 1500C Y -nucl ides�Energiteknik AB the environment -moss near Studsvik re- cutting -ashing 5500C (Sr, Pu, U, Ra'iSweden of the reactor -lichen actor weekly to 2 cm, from some
and nuclear -fern in summertime 50 x 50cm samples)power plants -others: twice
A a year

Table VII. Sampling and pretreatment methods of sea water in the nordic laboratories.
Laboratory Purpose of Sampling locations Sampling Pretreatment Analysissampling and frequency method
Ris,6 National -following the -16 locations around -pumping -acid and radiocesiumLaboratory, radioactive con- Sealand 50 litres carriers 9OSr PuDepartment of tamination of the surface and bottom added in the Am, H.Health Physics Danish Straits water laboratoryDenmark -half-yearly: to the samp-
summer and winther les
-following the ra- -occasional sampling -pumping -Brecipitationdioactive contami- with various ships 50-1800 litres on board ofnation of the - 100 samples/yr. Pu, Am, (OH)North Sea, the and radioce-North Atlantic and sium (AMP)the Baltic Sea in 200-1800
litres
Finnish Centre -following the -different parts of the -lm under surface -subsampling Y -nuclidesfor Radiation radioactive condi- Baltic Sea, 62 points 35-130 litres -adding ofand Nuclear tion in the Baltic -yearly -some samples also acids and 9OSrSafety Sea lm above the carriers 239,NOpuFinland bottom -evaporation 241Am, 3H (f
-with Ruttner from -distilling some samples)112-1 m depth, (for tritium)
-control of -5-6 points near nuclear 1 litre forthe nuclear power plants tritiumpower plants -3-4 times a year
continues

Table VII. continues
Laboratory Purpose of Sampling locations Sampling Pretreatment Analysissampling and frequency method
University of -study of F23� 240pu,
constant points -pumping trough -adding ofHelsinki, behaviour of Pu millipore filter acids and 241;mDepartment of and Am -1-2 times a year (0.3 or 045 m) tracersRadiochemistry -study of the -0-200 m depth -weighing ofFinland distribution be- filters
tween particulateand soluble form
Institute for -control ra-Energy Techno- dioactivitylogy and researchNorway work
National Swedish -control of nuclear -1-2 points near the -1 with Ruttner- -adding of -Y-nuclidesEnvironment power plants outlet at each power sampler under acids I I MarinelliProtection Board plant the surface or -adding of ICs-nuclidesSweden 50 1 sample acids, car-
rier and AMP
University of -research -North Sea, Arctic Sea, -100-1700 -precipitation Th, U, Np, PuLund, Radiation Baltic Sea with NaOH, Am, cmPhysics Depart- pH9ment -yearly expeditions -with AMP, CsSweden -with NH3 Tc
1-1 I -no U, 210po, 21OPbi

Table VIII. Sampling and pretreatment methods of sediment (1) and sedimenting material 2 in the nordic laboratories.
Laboratory 1 2 Purpose of Sampling locations Sampling Pretreatment Analysisthe sampling and frequency method
Risj6 National x -monitoring of -1-2 locations -HAPS samples -drying at 1200C 'Y -nuclidesLaboratory, global fall- Danish Straits 1-3 cm slices homogenizing, Pu, Am,Health physics out -annually -13.5 cm -acidextraction occassioDepartment for trans- nally 9SrDenmark uranics
x -monitoring -3-5 locationsnuclear power Barseb5ck andplants Ringhals
-semi-annuallyx -relations be-
tween sedimentsand benthic -20 locations inradioactivity Thule, Greenlandcontest -every 5th year
University of x -determination -the Baltic Sea -slicing to 137Cs,Helsinki, of the age of -Lake Vanajavesi subsamples 21OPb-210poDepartment of sediment -Lake Saimaa -freezing 239,240pu,Radiochemistry -study of the -some small lakes 241AMFinland distribution
of nuclidesin sediment
continues
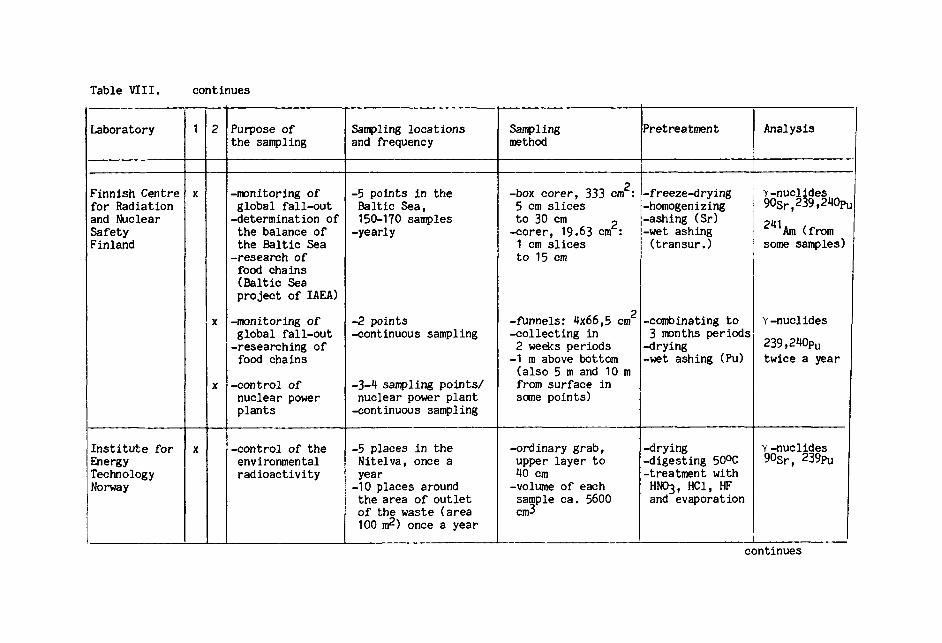
Table VIII. continues
Laboratory 1 2 Purpose of Sampling locations Sampling Pretreatment Analysisthe sampling and frequency method
Finnish Centre x -monitoring of -5 points in the -box corer, 333 cm 2 -freeze-drying Y-nuclidesfor Radiation global fall-out Baltic Sea, 5 cm slices -homogenizing 9OSr,239,240puand Nuclear -determination of 150-170 samples to 30 cm 2 -ashing (SH 241Safety the balance of -yearly -corer, 19 .63 cm -wet ashing Am (fromFinland the Baltic Sea 1 cm slices (transur.) some samples)
-research of to 1 cmfood chains(Baltic Seaproject of IAEA)
x -monitoring of -2 points -funnels: 4x66,5 cm 2 _combinating to 'Y-nuclidesglobal fall-out -continuous sampling -collecting in 3 months periods
-researching of 2 weeks periods -drying 239,240pufood chains -1 m above bottom -wet ashing (Pu) twice a year
(also m and 10 mx -control of -3-4 sampling points/ from surface in
nuclear power nuclear power plant some points)plants -continuous sampling
Institute for x -control of the -5 places in the -ordinary grab, -drying Y-nuclidesEnergy environmental Nitelva, once a upper layer to -digesting 500C 9OSr, 239puTechnology radioactivity year 40 cm -treatment withNorway -10 places around -volume of each HN03, HC1, HF
the area of outlet sample ca. 5600 and evaporationof the waste (area cm3100 2) once a year
continues

Table VIII. continues
Laboratory 1 2 Purpose of Sampling locations Sampling Pretreatment Analysisthe sampling and frequency method
National -control of -1 sampling point/ -Wilner corer -freeze-drying Y 5nuclideiSwedish nuclear power nuclear power plant 38.5 CM2 -homogenizing 2 9,240puEnvironment plants once/month 2 cm slices -ashingProtection 241Am (fromBoard ISweden -monitoring of -20 points every fourth -corer, 19.63 cm2 same samples)*
global fall-out year. 2 cm slices toMunds Univ.) -researching of 1 cm
I food chains
�x -control in the -1/month -2.5 x 12 cm -freeze-drying Y-nuclidesBiotest basin homogenizing
sewage sludge
-control of -3-4 communal sewage -500 ml -drying Y-nuclidesnuclear power works/power plant sewage sludge -ashingplants once a year
Studsvik x xEnergiteknik ABSweden
University x -research -sea and lakes -Box corer -drying Y -nuclidesof Lund -yearly expedition -dissolving Pu, Am, U PoDepartmentof RadiationPhysicsSweden

Table IX. Sampling and pretreatment ethods of aquatic indicators in the nordic laboratories.
Laboratory Purpose of Indicator Sampling locations Sampling Pretreatment Analysisthe sampling and frequency method
Risj6 Natio- -monitoring -fucoids -Roskilde Fjord -collecting -drying 1000C Y-nuclidesnal Labora- global fall- -2-3 locations from boat -millingtory, out -semi-annually and from land Pu AmHealth Phy- by hand or by -asbing atsics Dept. dredge 4000C TcDenmark -monitoring
waterborn -Danish Waters -further ash-releases from -20 locations ing at 6000Cnuclear in- -annually for SrPuAmstallations(Sellafield) -Faroes, Green-
land-annually
-Mytilus edulis -Danish Waters-3-5 locations
Finnish Cen- -monitoring of Fucus esicu- -2 locations/nuclear -by diving or -drying 1050 Y-nuclidestre for Ra- global fall-out los-Us power plant sampler 2 kg -milling 89,90Srdiation and -researching of Cladophora s. of Fucus, 2Og -ashing atNuclear food chains Enteromgrpha §� -1-2 times a year of Macoma and 4500 CSafety -control of Mesidotea ento- Mytilus) -wet ashingFinland nuclear power mm -3-5 locations near -by fishpot Uu, Am) 239,240pu
plants Finnish coast (200 g of-IAEA project Macorna baltiaa -once a year UAEA) Mesi ote 241Am from(see seawater) Mytilus edglia -By� : also some samples)
meat andshell sepa-rately
__�cntinues

Table IX. continues
Laboratory Purpose of Indicator Sampling locations Sampling Pretreatment Analysisthe sampling and frequency method
Institute -control of en- -EgjjmMjm -Nitelva river -sampling by -drying Y -nucl idesfor Energy vironmental perfoliatus (close to institute) hand -ashing 9OSr, 239puTechnology radioactivity -twice a year -treament withNorway HN03,HC1,HF
National -control of Fucus esicu- -2-7 locations/ -by diving or -drying 1050C Y -nuclide5Swedish nuclear power losus nuclear power picking 2 kg -ashing at 239,240pu*Environment plants f1DAQPhQra plant Eugia 5500CProtection Litt2rim- B2� Cladophaa or 241Am fromBoard -researching of Lyamea sp. -once a year 200 g Macoma, freeze- some samplesSweden food chains Mytilus Eduli§ Mytiju , drying
Macoma baltica Littorina, -homogenizingMytili , weat
Munds Univ.) and shellseparately
Studsvik -control pro- -Fucus esicu- -1-2 stations -raking, dredge -drying -Y -nuclidesEnergi- gramme 10sus -once a year or diving -ashingteknik AB -Cladophora ",
ffp�-Macoma baltica-Mytilus, tdu3--ia
University -research and -Fijcus yeaicu- -monthly in 4 fixed -drying Y -nuc I idesof Lund monitoring losus stations -ashing -PuAmTcDepartment of -yearly expeditionsRadiation world widePhysicsSweden

Table X. Recommendations for the use of units and additionalinformation of samples.
Sample Nuclide Unit Additional information
Air all Bq m-3 temperature
Deposition all Bq m- 2 precipitation
Soil all Bq m- 2 soil type and depth
Milk Sr Bq g- 1Ca production areaCs Bq g- 1Kothers Bq 1 _1
Meat and fish all Bq kg- production areafreshweight
Foodstuffs other all Bq kg- production areathan milk, meat dry weightand fish
All indicators all Bq kg-dry weight
Sea water all Bq m3 depth and salinity(temperature)
Sediment and all Bq kg- 1 depthsedimenting dry wightmaterial Bq m-

Annex. 1. The participating nordic laboratories.
Lab. No. Denmark
1. Rish National Laboratory
Roskilde
2. National Institute of Radiation Hygiene
Br,6nsh6j
Finland
3. Finnish Centre for Radiation and Nuclear Safety
Helsinki
4. University of Helsinki, Department of Radiochemistry
Helsinki
Norway
5. Institute for Energy Technology
Kjeller
6. National Institute of Radiation Hygiene
Oster5s
Sweden
7. National Institute of Radiation Protection
Stockholm
8. National Swedish Environment Protection Board
Drottningholm
9. Studsvik Energiteknik AB
Nyk6ping
10. University of Lund, Radiation Physics Department
Lund
11. University of Uppsala, Radiobiological Institute
Uppsala