xiaochen li and yan xu
TRANSCRIPT

Abstract—As China developing in a rapid step, there is a
tremendous growing in the foreigners’ interest of learning
Chinese and exploring the Chinese culture. Along with this,
more and more foreigners choose the Internet as an access to
Chinese learning resources. In this paper we process an
important Chinese learning website’s Web logs and analyze the
users’ distribution. Based on deep statistics and analysis, we
propose several conclusions about the temporal and
geographical distribution characteristics of the Chinese
learning website visitors. For the temporal distribution, we
observe an obvious pattern: (i) it’s a cyclic pattern with a
period of one week, (ii)Thursday holds the peak of user
numbers within a specific week, (iii) there is a downward trend
of the user numbers per day during weekdays. For the
geographical distribution of the users, we present experiments
on two levels: (a) countries and regions ,(b) continents.
Understanding the temporal and geographical distribution
characteristics of Chinese learning website visitors brings us a
better knowledge of the users’ preference and gives us pointers
for research, so that we can improve the Chinese learning
website and then attain a better adaption of the users’ habits
and need.
Index Terms—Chinese learning, website usage, distribution
of website visitors
I. INTRODUCTION AND BACKGROUND
Recently Chinese language learning and Chinese culture is
gaining interest from an increasing number of people around
the world. And the prevailing usage of the Internet provides a
convenient way for users to access on-line Chinese learning
resources. Thus, understanding who are deploying the
Chinese learning website and when they visit the website
becomes an important research topic. Because these will not
only provide us clues which can help to improve the
architecture of the website and the Multilanguage service of
pages, but also give pointers to the adjustments of the
number of servers and the bandwidth. Based on these
improvements and adjustments, we can attain a balance
between a better online service and a more rational use of
resources.
Cooley et al. [1] proposed that how a website is used is an
important input to Fig out the complexity of tasks such as
website architecture and web server architecture. Web Usage
Manuspcript received September 20, 2012; revised December 16, 2012.
This work was supported in part by the Chinese National Undergraduate
Research and Innovation Plan, National Natural Science Foundation of
Beijing under Grant 4122076 and Education science Foundation of Beijing
under Grant AHA09110.
The authors are with the College of Information Science, Beijing
Language and Culture University, Beijing, 100083 China (e-mail:
[email protected], [email protected]).
Mining is the application of data mining techniques to large
Web data repositories in order to produce results that can be
used in the design tasks mentioned above. Web logs play a
significant role in the web mining process because Web logs
are crucial information sources for analyzing users’ action
and these information sources are issued by users themselves.
In this paper, we process and analyze the Web logs of a
Chinese learning website. In Section II we discuss previous
work on Web logs mining, research on website usage and
Web logs and data visualization. We design several
algorithms to identify users from these logs and propose
some statistics of the users (see Section III). This processed
data provides us information of the website users’
distribution from two dimensions (see Section IV ): the
temporal dimension and the geographical dimension. Finally,
we conclude and discuss further observations in Section V.
The paper makes the following contributions: (1) we Fig
out the periodical pattern of the change in the user number, (2)
we describe the users’ geographical distribution on the
country level and the continent level. To the best of our
knowledge, our study is the first that provides a detailed
users’ temporal and geographical distribution of a Chinese
learning website, which is a hot issue of education. Learning
about users’ distribution characteristics makes significant
difference because it leads to new research directions.
Moreover, it helps us gain a better knowledge of website
users and thus help us improve the website organization in
order to provide better online services.
II. RELATED WORK
Analysis of the Chinese learning website visitors’
temporal and geographical distribution is a new research
branch so that there are rare related articles. But we can still
learn from some research methods.
A. Information Objects
1) Clicks.
Generally, there are several links in a specific page. We
define a click as a user clicks on one of these links and enter a
new page.
2) Users.
Web server logs provide limited information about users.
As a result, we can only get a user’s IP address and his
identification information (User Agent). However, users’
accesses to network vary widely for their using caching,
proxy servers and firewalls. All of these applications bring
lots of troubles and complexities to the identification of users.
For instance, when different users access to the server with a
same proxy server, Web server logs will show the same IP
address corresponding to these different users. Another
Analysis of the Temporal and Geographical Distribution of
a Chinese Learning Website Visitors
Xiaochen Li and Yan Xu
International Journal of Computer Theory and Engineering, Vol. 5, No. 3, June 2013
546DOI: 10.7763/IJCTE.2013.V5.747

instance is that sometimes a specific user will use different
web browsers on his computer when accessing to the server.
In this case, the Web server logs cannot distinguish clearly
whether these logs belong to the same user or belong to
different users. In Section III we will talk about algorithms
designed to identify users in our paper.
3) Sessions.
Identification of users is often followed by the detection
of sessions. The so-called session refers to a chronological
set which consists of several pages visited by a specific user.
By analyzing the timing set, we can gain some knowledge of
users’ interest and preferences. As a result, the detection of
sessions is a key step in Web log mining and various
algorithms have been proposed in order to get a better
performance.
For instance, the timeout method for sessions or pages with
its key point of fixing the maximum time (cutoff value) of the
session or the time spent on a specific page by a user, is
relatively easier to implement. According to Goker [2], the
best time threshold value for session is 25.5 minutes. The
cutoff value is dependent on the goal of specific analysis.
Most of the commercial products set their cutoff value as 30
minutes. In this paper, we also choose 30 minutes as our
cutoff value of sessions. The timeout method for pages takes
users’ habits into consideration when compared with the
timeout method for sessions. This results in a better
performance.
However, in timeout method the cutoff value is simply set
without deeply analysis of the website’s contents and the
users’ habits. As a result, the method has its limitations to
some extent. Cooley et al. [1] proposed a transaction method
to identify sessions. The main idea of this method is that
whether users stay on a specific page and the time spent on
this page are dependent on the category this page belongs to,
namely, the page is a content page or a secondary page.
Although this method results in a more precise performance,
it still has some drawbacks: the method itself is complex to
implement because we should pre-judge the category of the
page. In addition, the formation of each session contains only
one content page. As a result, usage of this method is not as
wide as that of the timeout method.
B. Research on Website Usage and Web Logs
There has been lots of research which focus on several
aspects on website usage. Mahlke [3] and Hans [4] discussed
factors influencing the usage of websites, including
perceived usefulness, ease of use, hedonic quality and visual
attractiveness etc. Hans [5] also proposed a technology
acceptance model to predict the website usage. Cohen [6]
developed a two-tiered model for analyzing library website
usage statistics.
Numerous of analysis has also been proposed on Web logs.
Beitzel’s study focused on investigating the nature of
changes in the query stream of a very large search service
over. He also proposed a method of temporal log analysis that
can be used to study changing topical trends over time in
addition to the traditional static analysis [7]. Silverstein et al.
found that for 85% of the queries in Alta Vista only the first
result screen is viewed, and 77% of the sessions contain only
1 query [8].
Domain-specific search behavior has been studied in the
context of searching for people on the web [9], biomedical
information seeking [10] , blog search [11], and so on.
Weerkamp et al. [9] analyzed a large-scale log of people
search on the web, providing detailed statistics at the level of
queries, sessions and users. Lin et al. [10] examined the
relationship between initial search results and the overall
utility of interaction, finding that similarity-based browsing
tool helps in the case of poor initial retrieval results. Mishne
et al. [11] focused on the analysis of blog search behavior,
finding that blog searches typically include named entities of
interests [12]. In our paper, we focus on the Chinese learning
website.
C. Data Visualization
Data visualization is the study of the visual representation
of data, meaning “information which has been abstracted in
some schematic form, including attributes or variables for the
units of information” [13]. Several tools and technologies
have been developed to achieve a balance between aesthetic
form and functionality need, such as tables, histograms and
bar graphs. Another tool used in our paper for data
visualization is data map, which means displaying data on a
geographical map to provide an insight to the knowledge of
geographical distribution in data. There is a variety of
researches on the data map. For instance, Healey [14]
described a technique for choosing multiple colors for use
during data visualization.
III. CHINESE LEARNING WEBSITE AND DATA PROCESSING
A. Web Logs and Data Cleaning
The main data source of this paper is the Web logs issued
by Beijing Language and Culture University Website server.
BLCU is the only international university in China with its
main task set at teaching Chinese language and culture to
foreign students. There are several centers for studying
Chinese on campus and the university also provides a bunch
of online Chinese learning resources for foreigners. The Web
log data was collected between July 1, 2011 and August 31,
2011. During this period there was no major update or
change to Beijing Language and Culture University’s
website which guarantees the data’s comparability.
In many computer science fields, one needs to prepare
quality data by pre-processing the raw data. In practice, it has
been generally found that data cleaning and preparation takes
approximately 80% of the total data engineering effort. Data
preparation is, therefore, a crucial research process. First,
BLCU’s website (www.blcu.edu.cn) consists of several
department-level sub-websites and Chinese learning centers’
websites. With the focus of analyzing behaviors of Chinese
learners, we process the Web logs and eliminate records
irrelevant to Chinese learning. Second, elimination of the
items deemed irrelevant can be reasonably accomplished by
checking the suffix of the URL name. For instance, all log
entries with filename suffixes such as gif, GIF, jpeg, JPEG,
jpg, JPG and map can be removed [1]. Log cleaning
algorithm used in this article is presented as follows:
Step 1 Remove the Web log entries which are irrelevant to
International Journal of Computer Theory and Engineering, Vol. 5, No. 3, June 2013
547

Chinese learning resources.
Step 2 Remove the Web log entries whose request-status
is not 200.
Step 3 Remove the log entries whose suffixes of the URL
belong to a defined set1.
The data size of initial Web logs is on-average 200M per
day. After checking the relevance with Chinese learning and
URL suffixes, the remaining data makes up an on-average
350K-textfile per day. This remaining data will be used in the
following experiments.
B. User Identification
In this paper, we use users’ IP addresses and their
identification information to uniquely identify them. Because
of the plummeting of the data and the complex conditions
required to identify users, our data only provides us close to
14000 different users. Among them, nearly half of the users
visit only one page and most of them only issue one session
(see Table I). We still have about 7800 users that issued more
than one session. These users incited, on average, 2.25
sessions. Most of these sessions are continuous because these
users spent more than half an hour on their browsing
behaviors.
TABLE I: CHARACTERISTICS OF USERS.
Number of users 14164
Number of users with >1 clicks 7822 (55.2245%)
Number of users with >1 sessions 745 (5.2598%)
Busiest day in number of users July 14,2011 683users
Average number of query per user
All users 3.6437
Users with >1 queries 5.7873
Average number of session per user
All users 1.0671
Users with >1 sessions 2.2497
Average visit-time per user
(in second)
1220.7624
We extract the IP addresses of these users and locate them
according to the location database which is issued by
IPligence Lite2. After that we propose several analysis of the
temporal and geographical distribution of these users.
IV. RESULTS AND DISCUSSIONS
A. Users’ Temporal Distribution
Fig. 2 shows the temporal distribution of users. There is an
obvious cyclic pattern of the distribution (indicated by the
green line). According to the Fig, in a specific week, the
largest user number always appears on Thursday and among
the other six days, Monday also sees a relatively more
number of visitors. We have discussed above that, according
to statistics, a significant percentage of users visit only one
page of this website. Several reasons contribute to this
phenomenon, including that this group of users fail to find
their expected resources on the homepage or users visit the
website by accident. So users who access more than one page
provide us with more useful information of the users’
distribution because they may be more concerned about
1 The defined suffix set: gif , jpg , png , bmp , mp3 , doc , docx , xls , ppt , txt ,
rar , dll , wma , zip , css , js , swf , exe , rm , rmvb, avi , and JPG . 2 http://www.ipligence.com/free-ip-database
Chinese learning compared to other users. Therefore, we
extract these users who click more than one page out of the
user set and then analyze the change of user number over
time (indicated by the purple line). Reader may notice that the
fluctuation of the purple line is not as significant as that of the
green line, but some cycles still can be observed. Another
interesting finding is that there are more one-click users on
Thursdays compared to the other days in a specific week
according to an observation that the biggest gaps between the
green and purple lines usually emerge on Thursday.
The temporal distribution of users whose IP addresses
belong to countries and regions outside China shows another
interesting characteristic. It is obvious that every Thursday
has the biggest number of users. When dividing the
two-months period into seven sections according to
weekdays (such as Monday, Tuesday and Friday), there is a
significant downward trend of accumulated user numbers
within these seven sections except the section corresponding
to Thursday (see Fig. 1). This downward trend, which
indicates that there are more users visiting our Chinese
learning website at the beginning of a week rather than
visiting at weekends, reveals that people tend to perform
higher enthusiasm to learn Chinese on the first few days of a
week.
Fig. 1. User distribution over weekdays. In this plot, the x-axis indicates a
specific weekday (Monday, Tuesday etc.), the y-axis indicates the total
number of users who visited BLCU’s website on this specific weekday
during July 2011 and August 2011.
B. Users’ Geographical Distribution
Over the two-month period, there are 14164 users in total,
of whom nearly 75% are from Chinese mainland (see Fig. 3).
To get a deeper sense of the distribution of foreign users, we
treat the foreign users set as a whole and then analyze the
composition of this set. The result shows that the United
States, Korea and Niue are the Top 3 users’ sources. Each of
these three countries accounts for over 10% of the foreign
users set. Japan, HongKong, Thailand, Australia, Germany,
France and Russia constitute the second echelon of the users’
source countries or regions. Each of these countries or
regions occupies over 1% of the foreign users set. There are
another 85 countries or regions which make up the other 28%
of the foreign users set (see Fig. 3).
Let us go back to the whole user set including both users
whose IP addresses belong to Chinese mainland and those
with IP addresses belonging to regions outside China and
then sort these source countries and regions. According to the
user percentage accounted by these countries and regions, we
International Journal of Computer Theory and Engineering, Vol. 5, No. 3, June 2013
548
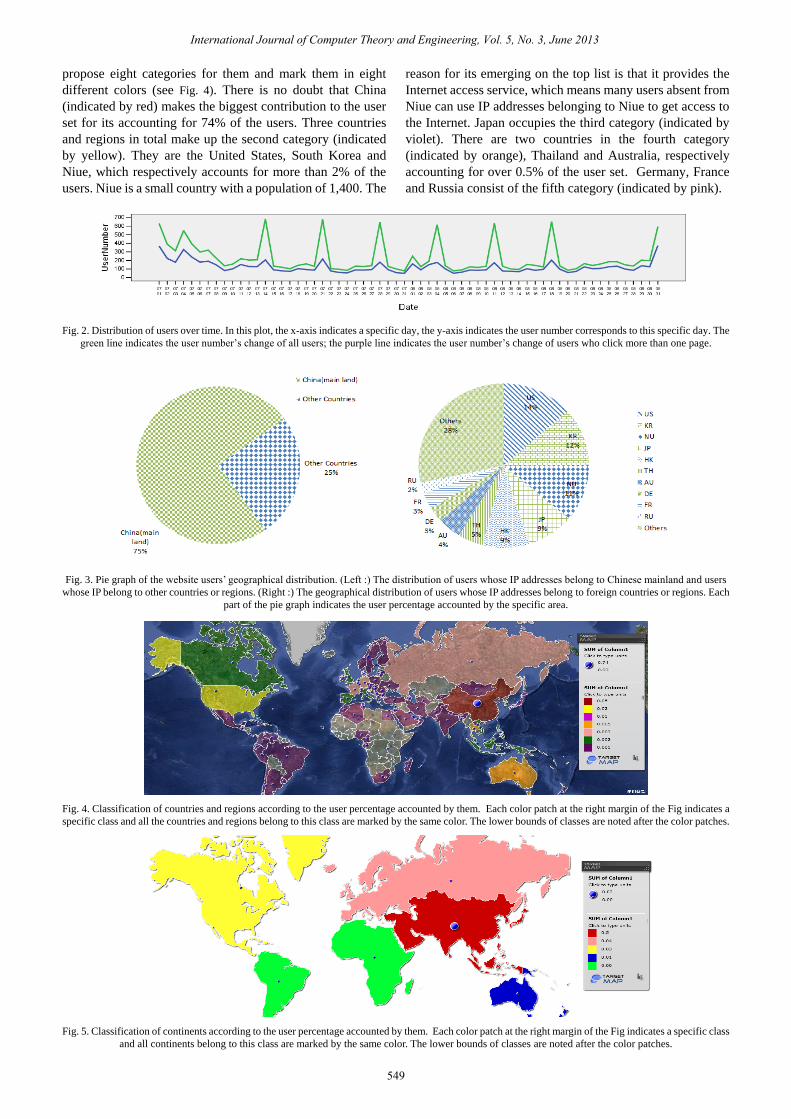
propose eight categories for them and mark them in eight
different colors (see Fig. 4). There is no doubt that China
(indicated by red) makes the biggest contribution to the user
set for its accounting for 74% of the users. Three countries
and regions in total make up the second category (indicated
by yellow). They are the United States, South Korea and
Niue, which respectively accounts for more than 2% of the
users. Niue is a small country with a population of 1,400. The
reason for its emerging on the top list is that it provides the
Internet access service, which means many users absent from
Niue can use IP addresses belonging to Niue to get access to
the Internet. Japan occupies the third category (indicated by
violet). There are two countries in the fourth category
(indicated by orange), Thailand and Australia, respectively
accounting for over 0.5% of the user set. Germany, France
and Russia consist of the fifth category (indicated by pink).
Fig. 2. Distribution of users over time. In this plot, the x-axis indicates a specific day, the y-axis indicates the user number corresponds to this specific day. The
green line indicates the user number’s change of all users; the purple line indicates the user number’s change of users who click more than one page.
Fig. 3. Pie graph of the website users’ geographical distribution. (Left :) The distribution of users whose IP addresses belong to Chinese mainland and users
whose IP belong to other countries or regions. (Right :) The geographical distribution of users whose IP addresses belong to foreign countries or regions. Each
part of the pie graph indicates the user percentage accounted by the specific area.
Fig. 4. Classification of countries and regions according to the user percentage accounted by them. Each color patch at the right margin of the Fig indicates a
specific class and all the countries and regions belong to this class are marked by the same color. The lower bounds of classes are noted after the color patches.
Fig. 5. Classification of continents according to the user percentage accounted by them. Each color patch at the right margin of the Fig indicates a specific class
and all continents belong to this class are marked by the same color. The lower bounds of classes are noted after the color patches.
International Journal of Computer Theory and Engineering, Vol. 5, No. 3, June 2013
549

This data is basically in line with the Chinese Ministry of
Education’s statistics on the number of foreign students
studying in China in 2011. In their statistics, the top ten
source countries of foreign students studying in China are the
South Korea, Japan, Thailand, Vietnam, Russia, Indonesia,
Pakistan and Kazakhstan. In addition, France, Mongolia and
Germany also hold their number of foreign students over
5000. The Internet access and the methods of identifying
users take some responsibilities for the nuance between our
data and the statistics of the Chinese Ministry of Education.
According to the statistics of Chinese Ministry of
Education in 2011, Asia is the largest source of the foreign
students with its contribution of 64.21% of the students,
followed by Europe (16.15%), America (11.05%), Africa
(7.09%) and the Oceania (1.5%). So we rearrange our data
on a higher level of the continents (see Fig. 5). Asia is the
largest source of our website users (indicated by red), with a
percentage of 83% accounted by it. Europe (indicated by
pink) is the second with a percentage of 4%, followed by
North America, Oceania, South America and Africa.
Changes in the list are to some extent caused by the national
discrepancies of richness which may lead to differences in
the degree of Internet popularity.
V. CONCLUSION
In this paper, we have deeply discussed the visitors’
temporal and geographical distribution of a Chinese learning
website, with web log data contributed by 14164 users from
96 countries and regions over a two-month period. This is the
first time that analysis of temporal and geographical user
distribution is performed on a Chinese learning website, with
our goal to investigate the distribution of Chinese learners.
Our result provides some clues for future research in terms of
the improvement of Chinese learning websites and the
popularization of Chinese. We focused our analysis on both
time and space dimensions. The most interesting findings
include (a) nearly half of the users just issued one click (users
just clicked on just one page) and one session; (b) there is a
cyclic pattern of the temporal distribution of the users with its
period of one-week and Thursday has the largest user number
within a specific week; (c) the data from our web logs is
approximately consistent with the statistics, which are issued
by the Chinese Ministry of Education in 2011, about the
foreign students who study in China at that time.
Our analysis of the Chinese learning website has revealed
many directions for future work, including: (i) improving the
organization of Chinese learning websites in order to attain
better user experience, (ii) offering recommendation and
translation services for Chinese learning websites users; (iii)
revising the promotion strategies of Chinese language and
culture.
REFERENCES
[1] R. Cooley, B. Mobasher, and J. Srivastava, “Data preparation for
mining world wide web browsing patterns,” Journal of Knowledge and
Information Systems, pp.5-32, Jan.1999.
[2] D. He and A. Goker, “Detecting session boundaries from web user
logs,” in Proc. 22nd Annu. Information Retrieval Research Conf.,
Cambridge, pp. 57-66, 2000.
[3] S. Mahlke, “Factors influencing the experience of website usage,” in
Proc. ACM Conf. Human Factors in Computer System, New York, pp.
846-847, 2002.
[4] H. Heijden, “Factors influencing the usage of websites: the case of a
generic portal in the Netherlands,” Information& Management, pp.
541-549, 2003.
[5] H. Heijden, “Using the technology acceptance model to predict website
usage: Extensions and empirical test,” Research Memorandum, Vrije
Universiteit Amsterdam, Netherlands, 2000.
[6] L. B. Cohen, “A two-tiered model for analyzing library website usage
statistics, part 1: Web server logs,” Portal: Libraries and the Academy,
vol. 3, pp. 315-326, April 2003.
[7] S. Beitzel, E. Jensen, A. Chowdhury, O Frieder, and D Grossman,
“Temporal analysis of a very large topically categorized Web query
log,” Journal of the American Society for Information Science and
Technology, vol. 58, pp. 166-178, Jan. 2007.
[8] G. Silverstein, M. Heizinger, H. Marais, and M. Morics, “Analysis of a
very large Web search engine query log,” ACM SIGIR Forum, vol. 3,
pp. 6-12, 1999.
[9] W. Weerkamp, R. Berendsen, B. Kovachev, E. Meij, K. Balog, and M.
Rijke, “People searching for people: Analysis of a people search engine
log ,” in Proc. 2011 ACM SIGIR Conf., pp. 45-54, 2011.
[10] J. Lin and M. Smucker, “How do users find things with pubmed:
Towards automatic utility evaluation with user simulations,” in Proc.
2008 ACM SIGIR Conf., pp. 19-26, 2008.
[11] G. Mishne and M. Rijke, “A study of blog search,” in Proc. 2006 ECIR
Conf., pp. 289-301, 2006.
[12] J. Kim, H. Feild, and M. Cartright, “Understanding book search
behavior on the Web,” in Proc. 2012 CIKM Conf., Maui, USA.(to be
published) , 2012.
[13] M. Friendly (2008). Milestones in the history of thematic cartography,
statistical graphics, and data visualization. [Online]. Available:
http://www.math.yorku.ca/SCS/Gallery/milestone/milestone.pdf
[14] C. Healey, “Choosing effective colors for data visualization,” in Proc.
7th IEEE Visualization Conf., pp. 263, 1996.
Xiaochen Li will receive her Bachelor degree in
information management and information system from
Beijing Language and Culture University, Beijing,
China in 2013. Her research interests include Web
usage, data mining and information retrieval.
Yan Xu received the M.S. degree in computer science
(1996) and the Ph.D. degree in computer
science(2004) from Beijing University of Aeronautics
& Astronautics, Beijing, China. She is an Associate
Professor in the College of Information Science,
Beijing Language and Culture University now. Her
research interests include data mining and information
retrieval
International Journal of Computer Theory and Engineering, Vol. 5, No. 3, June 2013
550