xiith international symposium on biomechanics and medicine ... · xiith international symposium on...
TRANSCRIPT

XIIth International Symposium on Biomechanics and Medicine in Swimming
April 28 to May 2, 2014
Australian Institute of Sport, Canberra
Contents
Venue map................................................................... 2 Welcome ...................................................................... 3 Keynote speakers......................................................... 4 Program ....................................................................... 8 General information .................................................. 18 Social events .............................................................. 20 Sponsors .................................................................... 21 Exhibitors ................................................................... 23 Keynote abstracts ...................................................... 25 Oral abstracts............................................................. 31 Poster abstracts .......................................................137 Index of presenters ..................................................204

Venue map
2 BMS2014—ABSTRACTS HANDBOOK

Welcome
Welcome to Canberra: Australia’s national capital city.
What a great place to hold the 12th International Biomechanics and Medicine in Swimming Symposium—BMS2014. This symposium has been held every four years since 1970—mainly in European cities with the exception of two in North America. It is therefore the first time that BMS has been held in the southern hemisphere and what an appropriate location—Australia’s national sports institute, the Australian Institute of Sport in Canberra.
It was four years ago that the Australian Institute of Sport teamed up with Swimming Australia Limited and the John Curtin School of Medical Research at the Australian National University as proposed co hosts of the BMS2014 Symposium. With the assistance of the Canberra Convention Bureau we developed a proposal to host BMS2014 in Canberra. This proposal was accepted by the BMS steering group at the BMS2010 conference in Olso, Denmark.
Because of the strong links with elite sport at the Australian Institute of Sport, the disciplines of Biomechanics, Physiology and Medicine were readily included into the symposium program. Biomechanics, including Computational Fluid Dynamics, and Physiology, including Recovery, will run as concurrent sessions throughout the entire symposium. Because of the influence of Swimming Australia, coaching was also added, as a distinct discipline, for the first time in the history of BMS symposium, to the program but with the direct application of science and medicine to coaching. We have an exciting range of keynote speakers for each discipline. These include Bill Sweetenham (Australia) and Andrei Voronstov (Sweden, formerly Russia) for Coaching, Dr Frank Fish (USA) for Biomechanics, Dr Raymond Cohen (Australia) for Computational Fluid Dynamics and Dr Philippe Hellard (France) for Physiology. In addition we have Professor David Costill (USA) for Nutrition, Professor Rob Newton (Australia) for Strength and Conditioning, Professor Peter Fricker (Australia) for Medicine, Peter Blanch (Australia) for Physiotherapy and Professor Steven Langandorfer (USA) for Social Sciences.
There will also be a Q&A session with Brenton Rickard, Alicia Coutts and Ben Treffers, three of Australia’s finest swimmers, who will discuss sport science and medical servicing that have influenced their performance at international meets. After this session, Australian Senior Coach John Fowlie will give a poolside presentation for those involved in the coaching discipline.
As an added bonus to BMS2014 delegates the AIS has opened its exercise facilities during the public exercise periods for delegates to exercise in the old AIS pool, the gym area and the athletics track. Special thanks to the ACT Chief Minister, Katy Gallagher, for providing symposium delegates with complimentary public transport throughout the symposium.
I am sure that as a delegate of the BMS2014 symposium you will experience stimulating presentations, you will enjoy being reacquainted with old friends as well as meeting new friends and will enjoy yourself at the social functions.
Bruce R Mason OAM PhD FISBS Chairman of the BMS2014 Symposium Organising Committee
BMS Steering Committee
Professor Kari Keskinen (Chairman, Finland)
Professor Bodo E Ungerechts (Germany)
Professor João Paulo Vilas-Boas (Portugal)
Professor Jan Pieter Clarys (Belgium)
BMS2014 Organising Committee
Dr Bruce Mason—AIS, Aquatic Testing, Training and Research
David Jukes—AIS, Events and Sports Camps
Dale Barnes—AIS, Movement Science
Nicole Vlahovich—AIS, Sports Medicine
Stream Coordinators
Physiology—Professor David Pyne and Dr Philo Saunders, AIS Physiology
Nutrition—Professor Louise Burke and Greg Shaw, AIS Nutrition
Biomechanics (including CFD)—Dr David Pease and Dr Bruce Mason, AIS Aquatic Testing, Training and Research
Medicine (including Physiotherapy)—Dr David Hughes, AIS Sports Medicine and Kylie Holt, AIS Physiotherapy
Coaching—Dr Ralph Richards, ASC National Sport Information Centre
Strength and Conditioning—Julian Jones, AIS Strength and Conditioning
Social Sciences, Humanities and Pedagogics—Associate Professor Robert Keig Stallman, Norway
Conference Secretariat
Conference Logistics* PO Box 6150 KINGSTON ACT 2604
02 6281 6624 02 6285 1336 [email protected] www.conferencelogistics.com.au
*acting as agent for Australian Sports Commission
BMS2014—ABSTRACTS HANDBOOK 3

Keynote speakers
Peter Blanch
Peter Blanch has worked in elite sport for almost 30 years. Early in his career he was involved with teams in the VFL (Victorian Football League) before it became the AFL, the NSL (National Soccer League) before it became the A league and the NBL back when Australian basketball was on television. For twenty years he worked at the Australian Institute of Sport in Canberra working with numerous programs but specifically basketball, cycling, triathlon and swimming. During this time he attended three Olympics, five Commonwealth Games and numerous other International competitions. A lot of this time was spent as a clinician but along the way he has also been involved in research with a Masters degree in three dimensional motion in swimming, over 40 peer-reviewed publications, adjunct positions at three universities and
numerous national and international conference presentations. Over the last two years he has taken the role of Sports Science and Sports Medicine Manager for Cricket Australia with one of his major KPIs being the reduction of injuries to fast bowlers.
Dr Raymond Cohen
Dr Raymond Cohen completed his PhD in Computational Fluid Dynamics and Computational Acoustics at the University of Melbourne in 2009. He then joined the Computational Modelling Group of CSIRO Mathematics, Informatics and Statistics as a Postdoctoral Fellow to work on modelling of human swimming in collaboration with the Australian Institute of Sport. Now as a Research Scientist in CSIRO Computational Informatics, he continues to study human performance in aquatic sports (swimming, diving and kayaking) using computational fluid dynamics and biomechanical modelling.
Dr David Costill
Dr David Costill, Emeritus Professor of Exercise Science and Director of the Human Performance Laboratory, at Ball State University 1966–2004 years. He has published, lectured and conducted research related to various aspects of sports performance and nutrition. The focus of his research has been to better understand the demands of swimming training and the day to day nutritional needs of athletes.
Dr Frank Fish
Dr Frank Fish is a Professor of Biology at West Chester University. He received a PhD in Zoology from Michigan State University. Frank has published over 100 research articles that focus on the energetics, mechanics, and hydrodynamics of aquatic locomotion by animals and construction of biomimetic robot designs.
4 BMS2014—ABSTRACTS HANDBOOK

Professor Peter Fricker OAM MBBS FACSP FRACP (Hon.) FFSEM (UK) (Hon.) GAICD
Professor Peter Fricker is currently Consulting in Sports Medicine, Sports Science, Physical Activity and Health, and holds professorial appointments at Griffith University (Gold Coast) and Victoria University. From 2005 to 2011 Professor Fricker was Director of the Australian Institute of Sport and for six months prior to his departure to Qatar he was Acting CEO of the Australian Sports Commission. He joined the AIS in 1981 as the AIS’s first sports physician, consulting from his own practice in Canberra. In 1983 he joined the AIS as staff medical officer. From that time until he was appointed Director he worked at the AIS as Head of Sports Science and
Sports Medicine, then as Deputy Director of the AIS.
He has also served as medical officer and medical director for Australian teams to six Commonwealth Games (1986-2006) and five Olympic Games (1988-2004). He serves on the Medical Commission of the Australian Olympic Committee, has served as Chair of the Medical Commission of the Australian Commonwealth Games Association, as a Member of the Australian Sports Drugs Medical Advisory Committee, a Member of the National Antidoping Research Committee, as advisor to the World Antidoping Agency (WADA) on antidoping research, and as a member of the AFL Research Committee, among other roles over many years.
He has edited and authored three text books and a book on fitness, and has published numerous papers on sports injuries, athlete health, and immunology and exercise in particular.
He was awarded the Medal of the Order of Australia in 1993, the Australian Sports Medal in 2001, the Citation for Distinguished Service to Sports Medicine by the Australasian College of Sports Physicians in 2010, and the Order of Merit of the Australian Olympic Committee in 2012.
Dr Phillipe Hellard
Dr Philippe Hellard is the Director of Research of the French Swimming Federation, Civil servant of the Ministry of Youth Sports and Associative Activities and Assistant to the Technical Director of the French Swimming Federation.
Dr Hellard is also a researcher associated with the National Institute of Sports and Physical Education (INSEP) and a researcher associated with the Institute of Biomedical and Epidemiology Sports Research (IRMES). Dr Hellard is married with two children and lives in France.
Professor Steven Langendorfer
Stephen J Langendorfer, PhD, is Professor and interim Director of the School of Human Movement, Sport, and Leisure Studies at Bowling Green State University in the USA. Dr Langendorfer is a recognised authority in the areas of aquatics and lifespan motor development. He earned degrees from SUNY-Cortland, Purdue University, and the University of Wisconsin-Madison as well as studied at the Deutsche Sporthochschule, Köln, Germany. In addition to academics, he has worked as a lifeguard, water safety and canoeing instructor, instructor trainer, wilderness trip leader, and coach.
Dr Langendorfer has authored numerous scholarly publications (including Aquatic Readiness: Developing Water Competence in Young Children, 1995, and a second edition in preparation) as well as presented widely on motor development, assessment, and especially developmental aquatics. He is the founding editor of the
International Journal of Aquatic Research and Education. He has volunteered for the American Red Cross for almost 50 years including contributions to developing their parent-child and revisions of the learn-to-swim programs. He is a member of Red Cross’s Scientific Advisory Council (aquatic sub-council) that reviews and provides evidenced-based science for Red Cross programs. His scholarly work and service, especially in aquatics, has been recognised with awards including the Golden Whale Award from the Commodore Longfellow Society in 1993 and most recently the 2013 Ireland Medal and a Golden Lecture in Wroclaw, Poland in 2014.
BMS2014—ABSTRACTS HANDBOOK 5

Professor Robert Newton PhD, AEP, CSCS*D, FESSA, FNSCA
Professor Robert Newton is the Foundation Professor in Exercise and Sports Science at Edith Cowan University, Australia and an Honorary Professor of The University of Hong Kong. Prior to this appointment, Professor Newton was Director of the Biomechanics Laboratory, at Ball State University in Indiana. He has also worked at the Pennsylvania State University as a visiting research fellow in the Center for Sports Medicine. Current major research directions include: assessment and development of maximal strength and power, muscle architecture and musculotendinous stiffness, athlete load monitoring, muscle, fat and bone composition of athletes.
Professor Newton is an Accredited Exercise Physiologist, Certified Strength and Conditioning Specialist with Distinction with the National Strength and Conditioning Association (NSCA), Fellow of Exercise and Sports Science Australia and Fellow of the NSCA. In 2004 he was awarded Outstanding Sports Scientist of the Year by the NSCA. He has published over 250 refereed scientific articles, two books, 16 book chapters and has a current h-Index of 46 with his work being cited over 9,000 times. As of 2013 his research had attracted over $19.5Million in competitive research funding.
Professor Newton has an extensive track record of research and consultancy in the assessment and development of neuromuscular performance in particular maximal strength and power. He has been a consultant to many professional teams and sporting organisations including Chicago Bulls, New Jersey Nets, Indianapolis Colts, England Rugby, Manchester United, English and Australian Institutes of Sport and Surfing Australia. In 2012 Professor Newton was appointed to the Advisory Board of Nike SPARQ.
Bill Sweetenham AM
Bill Sweetenham was born in 1950 and grew up in a small Australian country town. He has served as Head Coach of national swimming teams at five Olympic Games for three different countries, and has coached swimmers to success at nine World Championships, eight Commonwealth Games and 27 individual long-course Olympic and World Championship podium finishes.
Early highlights of Bill’s career include many world record swims by the likes of Stephen Holland, Michelle Ford and Tracey Wickham. Bill was the first State Director of Coaching for Queensland, and went on to serve as Head Swimming Coach of Australian Swimming, Head
Coach at the Australian Institute of Sport in Canberra, Head Coach at the Hong Kong Sports Institute, National Youth Coach for Australian Swimming (1995–2000), Head Coach and National Performance Director of British Swimming from November 2000 to October 2007.
Under Bill’s leadership and management as National Performance Director of British Swimming, Britain’s swimmers won 18 World Championship titles, and produced their best ever Commonwealth Games, World Championships and Olympic Games results. This included European Champion Team, both Senior and Junior. Bill’s current position is as consultant to Olympic and World Championship Head Coaches through the Australian Sports Commission. He works as a business and sports consultant to several international organisations.
Bill is a member of the Order of Australia and a Churchill Fellow. He is an accomplished and published author. Bill is internationally recognised for his strategic planning capabilities in high performance sport. He has had an Olympic medallist at every Olympic Games since 1976.
Professor João Paulo Vilas-Boas
Professor João Paulo Vilas-Boas is a Full Professor at the Faculty of Sport, University of Porto, a member of the Steering Group Biomechanics and Medicine in Swimming of the World Commission of Science in Sport, and a member of the board of the Portuguese Olympic Committee, a former Olympic Swimming Coach and he is the director of the Porto Biomechanics Laboratory, University of Porto, Porto, Portugal.
6 BMS2014—ABSTRACTS HANDBOOK

Dr Andrei Vorontsov
Andrei Vorontsov has a PhD in Sport Studies with more than 100 books, articles and scientific reports published. He started his elite coaching career as coach at the Russian State Central University of Physical Education, continued as ITC coach in Bath, and then became ASA Talent Development Coach. From 2008–2012 he was the Russian National Head Coach and is now the National Swimming Coach in Sweden.
Swimming panel
Alicia Coutts
Alicia Coutts is a five-time Olympic medallist for Australia and the winner of 21 medals in major international competitions. She was named Australian Swimmer of the Year in 2010 and 2012, the Australian Institute of Sport Athlete of the Year in 2012 and was the 2010 Australian Commonwealth Games Team closing ceremony flag bearer.
Brenton Rickard
Brenton Rickard spent a decade on the Australian Swimming Team and has won around 30 medals at major international meets and 19 national titles. After suffering the disappointment of missing the Athens 2004 Olympics, Brenton moved to the AIS where he spent almost five years culminating in two Olympic silver medals, a World Championship and World Record. During that period Brenton completed a Bachelor of Science and worked part time at the Biomechanics department. By providing assistance, information and feedback in a manner that suited Brenton, the biomechanics and sport science departments helped mould a talented young swimmer into one of the best Breaststrokers in the world.
Ben Treffers
Ben Treffers is an Australian National Champion and Silver Medallist at the World University Games. Ben was a finalist at the 2010 World Short Course Championships and a member of the Australian National Teams for the 2010 Pan Pacific Games, the 2010 World Short Course Championships and the 2011 World Championships.
BMS2014—ABSTRACTS HANDBOOK 7

Program
Monday 28 April 2014
1500–1930 Registration Indoor Synthetic Field
1600–1800 PLENARY SESSION 1 AIS Theatrette Chair: Dr Bruce Mason
1600 Opening address, welcome and acknowledgment of country, and introduction of BMS Steering Committee, Organising Committee and Discipline Coordinators Dr Bruce Mason
1640 Announcement of 2018 Symposium venue and presentation from winning consortium
1700 Introduction: Who was Professor Leon Lewillie? Professor Jan Pieter Clarys
Introduction of Professor João Paulo Vilas-Boas (Leon Lewillie Memorial Lecture) Professor Kari Keskinen
1715 The Leon Lewillie Memorial Lecture 2014: ‘Building up’ in swimming science Professor João Paulo Vilas-Boas
1800–1930 WELCOME RECEPTION Indoor Synthetic Field
1930 CLOSE OF DAY
Tuesday 29 April 2014
0830–1000 PLENARY SESSION 2 AIS Theatrette
0830 COACHING KEYNOTE Introduction: Dr Ralph Richards Biomechanics—interpretation and implementation Bill Sweetenham
0930 Q&A with Swimmers Chairpersons: Professor Bodo E Ungerechts and Senior Coach Jim Fowlie Swimmers: Alicia Coutts, Brenton Rickard, Ben Treffers
1000–1030 CONCURRENT SESSION 1
1A—Coaching 1 1B—Physiology 1 1C—Biomechanics 1
Chair: Jim Fowlie Chair: Dr Philo Saunders Chair: Professor Bodo E Ungerechts
Room: Silver Room Room: Gold Room Room: AIS Theatrette
1000 Visual search behaviour and information extraction differences between high-level and developing swimming coaches Amy Waters
Relationship between body composition and competition performance in swimming Dr Megan Shephard
Three different calculations to compute a swimmer’s instantaneous active drag and variations in the parameter values that arise as a consequence Dr Bruce Mason
1015 The effect of deliberate practice on the technique of national calibre swimmers Dr Rod Havriluk
Bone mineral density between different age group of swimmers and soccer players Emilson Colantonio
Development of a new resisted technique in active drag estimation Pendar Hazrati
1030–1100 MORNING TEA Indoor Synthetic Field
8 BMS2014—ABSTRACTS HANDBOOK

Tuesday 29 April 2014 (cont)
1100–1300 CONCURRENT SESSION 2
2A—Coaching 2 2B—Physiology 2 2C—Biomechanics 2
Chair: John Fowlie Chair: Dr Philo Saunders Chair: Dr Ross Sanders
Room: AIS Pool Room: Gold Room Room: AIS Theatrette
1100 Practical session John Fowlie, Ben Titley
Fatigue of the shoulder’s internal rotators following a 200-m all-out swim Dr Jeanne Dekerle
The velocity and fatigue index of various leg kicks in rescue towing Dr Robert K Stallman
1115 The interplay of critical velocity and anaerobic distance capacity Lachlan Mitchell
Upper limb kinematic differences between breathing and non-breathing conditions in front crawl sprint swimming Dr Carla McCabe
1130 Concurrent validity of a new model for estimating peak oxygen uptake based on post-exercise measurements and heart rate kinetics in swimming Thorsten Schuller
The effects of breathing on hip roll asymmetry in competitive front crawl swimming Mike Barber, John Barden
1145 Effects of breathing patter during submaximal eggbeater kick on oxygen uptake at constant workload in competitive water polo players Yosuke Sasaki
Freestyle arm entry effects on shoulder stress, force generation, and arm synchronisation Dr Theodore Becker
1200 5 minute break
2A—Coaching 2 (cont) 2B—Physiology 2 (cont) 2C—Biomechanics 2 (cont)
Chair: Ralph Richards Chair: Dr Philo Saunders Chair: Dr David Pease
Room: Silver Room Room: Gold Room Room: AIS Theatrette
1205 Attentional focus and swim start performance Michael Maloney
Use of additional warm-up strategies in the pre-race transition period enhances sprint swimming performance Courtney McGowan
A multi-analysis of performance in 13- to 15-year-old swimmers: a pilot study Ana Silva
1220 Biophysics of the elite endurance swimmer: a case study during aerobic capacity evaluation using different methods Professor João Paulo Vilas-Boas
Altitude training enhances performance in elite swimmers: results from a controlled four parallel groups trial (The Altitude Project) Professor Ferran A Rodrigues
Adjustments to elliptical zone software for acquiring body segment parameters automatically Chuang-Yuan Chiu
1235 Assessing the evolution of swim training via a review of Doc Counsilman’s training logs Professor Joel Stager
Effects of subacute moderate hypoxia on performance, peak oxygen uptake and stroke kinematics in 50 to 400-m time trials in elite swimmers Professor Ferran A Rodriguez
Sculling and unroll-body-action techniques in the ‘thrust’ movement of synchronised swimming based on three-dimensional motion analysis Dr Miwako Homma
1250 Session wrap up Session wrap up Session wrap up
1300–1400 LUNCH Indoor Synthetic Field Even numbered poster presenters will be at their posters to answer questions
BMS2014—ABSTRACTS HANDBOOK 9

Tuesday 29 April 2014 (cont)
1400–1530 PLENARY SESSION 3 AIS Theatrette
1400 BIOMECHANICS KEYNOTE Introduction: Dr David Pease Limitations on swimming speed: how can natural technologies be utilised? Dr Frank Fish
1445 COACHING KEYNOTE Introduction: Dr Ralph Richards Sport science and medical support in preparation of elite swimmers (Russia, GBR, Sweden) Dr Andrei Vorontsov
1530–1600 AFTERNOON TEA Indoor Synthetic Field
1600–1650 PLENARY SESSION 4 AIS Theatrette
1600 PHYSIOLOGY KEYNOTE Introduction: Professor David Pyne The development of a research department in the French Swimming Federation: a paradigm evolution Professor Philippe Hellard
1645 5 minute changeover
1650–1735 CONCURRENT SESSION 3
3A—Coaching 3 3B—Physiology 3 3C—Biomechanics 3
Chair: Jon Shaw Chair: Lachlan Mitchell Chair: Professor João Paulo Vilas-Boas
Room: Silver Room Room: Gold Room Room: AIS Theatrette
1650 Comparison of the training load during high-intensity interval-resistance training programmed by different exercise duration Yasuo Sengoku
Relationship between the oxygen uptake efficiency plateau and the lactate threshold in endurance swimmers Dr Camila Coelho Greco
Dubious use or misuse of scientific information in commerce and policy making e.g. the swimsuit case Professor Jan Pieter Clarys
1705 The evaluation of efficiency of individual programs for altitude training of elite swimmers upon metabolic and biomechanical criteria Dr Andrei Vorontsov
VO2 assessed by backward extrapolation in 200, 400, 800 and 1500 m front crawl in youth swimmers Dr Flávio Antônio de Souza Castro
The effect of full body swimsuits on swimmers’ morphology and glide performance Dr Georgios Machtsiras
1720 Effects of active and passive recovery on muscle oxygenation during interval swimming Professor Yoshimitsu Shimoyama
Comparisons of four competitive jammers by biomechanics and physiological parameters in expert male crawl swimmers Professor Didier Chollet
1735 CLOSE OF DAY
10 BMS2014—ABSTRACTS HANDBOOK

Wednesday 30 April 2014
0830–0920 PLENARY SESSION 5 AIS Theatrette
0830 STRENGTH AND CONDITIONING KEYNOTE Introduction: Jamie Youngson Strength and conditioning priorities for elite swim athletes Professor Robert Newton
0915 5 minute changeover
0920–1030 CONCURRENT SESSION 4
4A—S&C Workshop 4B—Physiology 4 4C—Biomechanics 4
Chair: Jamie Youngson Chair: Dr Tom Vandenbogaerde Chair: Dr Jeanne Dekerle
Room: Silver Room Room: Gold Room Room: AIS Theatrette
0920 This session will be discussion based for coaches in the room on how to optimise their dryland program to get the outcomes that they are after.
Ventilatory and kinematics responses in sprint versus marathon swimmers. Relationship with the VO2 slow component Dr Philippe Hellard
Buoyant (leg-sinking) torque in able-bodied swimmers and swimmers with impaired leg function Dr Carl Payton
0935 Observation of the soft palate while breathing in a simulated swimming Professor Hideki Hara
Optimising individual stance position in the swim start on the OSB11 Dr Armin Kibele
0950 Does back crawl require greater energy expenditure than front crawl at equivalent sub-anaerobic threshold speed? Tomohiro Gonjo
Should the gliding phase be included in the backstroke starting analysis? Karla de Jesus
1005 Lactate peak in youth swimmers: quantity and time interval for measurement after 50–1500 m maximal efforts in front crawl Dr Flávio Antônio de Souza Castro
Characteristics of an elite swimming start Elaine Tor
1020 Session wrap up Session wrap up
1030–1100 MORNING TEA Indoor Synthetic Field
1445–1530 CONCURRENT SESSION 5
5A—S&C practical session 5B—Physiology 5 5C—Biomechanics 5
Chair: Jamie Youngson Chair: Professor David Pyne Chair: Professor Kari Keskinen
Room: S&C Gym Room: Gold Room Room: AIS Theatrette
1100 This session will be in the strength and conditioning gym and will discuss practical exercises for inclusion into a swimmer’s program to optimise transfer from the gym to the pool.
Intermittent maximal lactate steady state determination based on 200 m performance Ronaldo Bucken-Gobbi
Torque and power about the joints of the arm during the freestyle stroke Dr Simon Harrison
1115 Lactate parameters and 100 m freestyle results in male and female youth swimmers Georgia Rozi
The determination of ‘added mass’ of swimmers as a part of studies of unsteady flow Professor Bodo E Ungerechts
1130 Effect of an exhaustive swim exercise on isometric peak torque and stroke parameters Dr Camila Coelho Greco
A different stroke technique of skilled swimmers to exert hand propulsion between the front crawl stroke and the butterfly Dr Shigetada Kudo
BMS2014—ABSTRACTS HANDBOOK 11

Wednesday 30 April 2014 (cont)
1145 Validation of an inertial measurement unit for the determination of the longitudinal speed of a swimmer Dr Frederic Puel
Effect on body kinematics of sculling propulsion in displacement Dr Raul Arellano
1200 The contribution of the arm stroke and leg kick to freestyle swimming velocity, controlling for stroke and kick rate: a pilot study Kirstin Morris
Difference of hydrodynamic force on foot between front crawl 6-beat and flutter kicking Hiroshi Ichikawa
1215 Are different methods for the aerobic capacity evaluation providing coherent biomechanical parameters? Professor João Paulo Vilas-Boas
A method to calculate the vertical force produced during the eggbeater kick Nuno Oliveira
1230 Effects of sprint interval training on metabolic, mechanical characteristics and swimming performance Futoshi Ogita
Variability in coach assessments of technique in front crawl sprint swimming Gina Sacilotto
1245 Longitudinal and confirmatory assessment of young swimmers’ performance and its determinant factors Dr Tiago Barbosa
1300–1400 LUNCH Indoor Synthetic Field Odd numbered poster presenters will be at their posters to answer questions
1400–1445 PLENARY SESSION 6 AIS Theatrette
1400 NUTRITION KEYNOTE Introduction: Professor Louise Burke Energy and dietary demands of pool and open water swimming Dr David Costill
1445–1530 CONCURRENT SESSION 6
6A—Nutrition 6B—Physiology 6 6C—Biomechanics 6
Chair: Greg Shaw Chair: Dr Megan Shephard Chair: Clare Jones
Room: Silver Room Room: Gold Room Room: AIS Theatrette
1445 FINA Consensus Statement feedback
In-water resisted swim training for age-group swimmers Kosuke Kojima
The effect of pullout timing on breaststroke turn performance Dr Alison Alcock
1500 Diagnostics of specific working capability and evaluation of adaptation to training workloads during sport season in open water swimmers Alexander Petriaev
Lower trunk muscle activity in butterfly swimming Jonas Martens
1515 Comparing methods for summarising a training load in prediction models of swimming performance Marta Avalos
Effect of fatigue in spatiotemporal parameters during 100 m front-crawl event monitored through 3D dual-media automatic tracking João Ribeiro
1530–1600 AFTERNOON TEA Indoor Synthetic Field
12 BMS2014—ABSTRACTS HANDBOOK
Wednesday 30 April 2014 (cont)
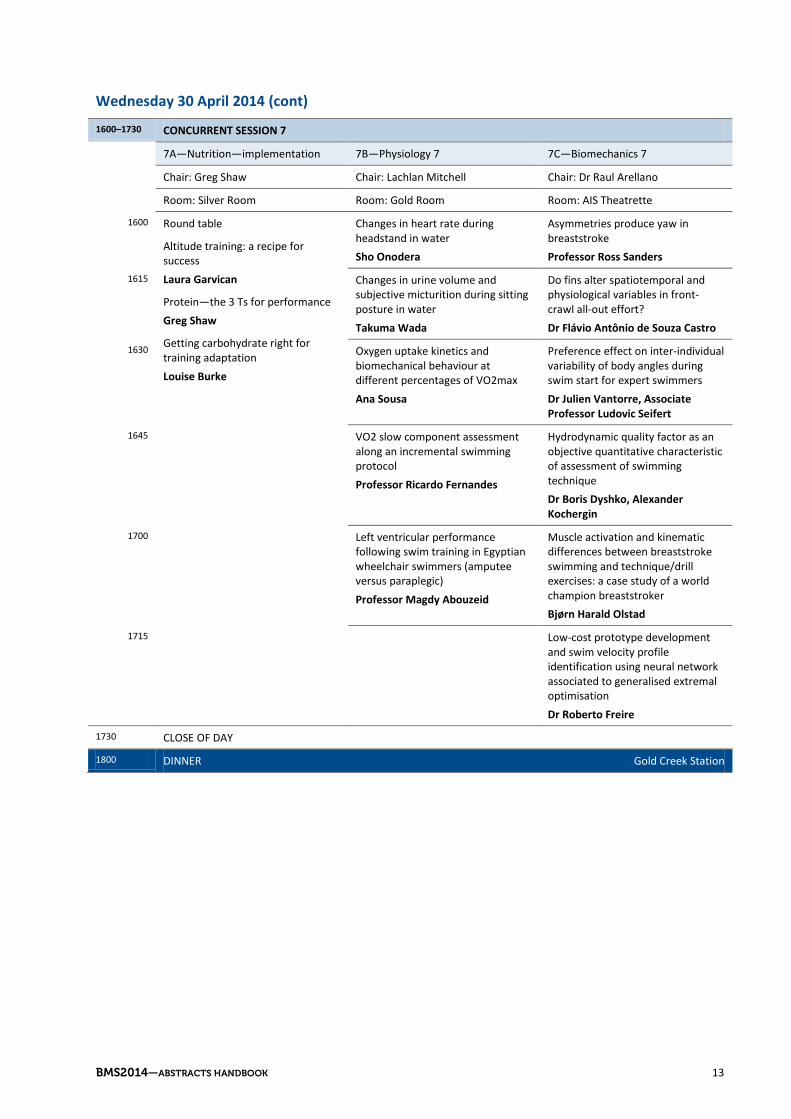
1600–1730 CONCURRENT SESSION 7
7A—Nutrition—implementation 7B—Physiology 7 7C—Biomechanics 7
Chair: Greg Shaw Chair: Lachlan Mitchell Chair: Dr Raul Arellano
Room: Silver Room Room: Gold Room Room: AIS Theatrette
1600 Round table
Altitude training: a recipe for success Laura Garvican
Protein—the 3 Ts for performance Greg Shaw
Getting carbohydrate right for training adaptation Louise Burke
Changes in heart rate during headstand in water Sho Onodera
Asymmetries produce yaw in breaststroke Professor Ross Sanders
1615 Changes in urine volume and subjective micturition during sitting posture in water Takuma Wada
Do fins alter spatiotemporal and physiological variables in front-crawl all-out effort? Dr Flávio Antônio de Souza Castro
1630 Oxygen uptake kinetics and biomechanical behaviour at different percentages of VO2max Ana Sousa
Preference effect on inter-individual variability of body angles during swim start for expert swimmers Dr Julien Vantorre, Associate Professor Ludovic Seifert
1645 VO2 slow component assessment along an incremental swimming protocol Professor Ricardo Fernandes
Hydrodynamic quality factor as an objective quantitative characteristic of assessment of swimming technique Dr Boris Dyshko, Alexander Kochergin
1700 Left ventricular performance following swim training in Egyptian wheelchair swimmers (amputee versus paraplegic) Professor Magdy Abouzeid
Muscle activation and kinematic differences between breaststroke swimming and technique/drill exercises: a case study of a world champion breaststroker Bjørn Harald Olstad
1715 Low-cost prototype development and swim velocity profile identification using neural network associated to generalised extremal optimisation Dr Roberto Freire
1730 CLOSE OF DAY
1800 DINNER Gold Creek Station
BMS2014—ABSTRACTS HANDBOOK 13

Thursday 1 May 2014
0830–0920 PLENARY SESSION 7 AIS Theatrette
0830 BIOMECHANICS/CFD KEYNOTE Introduction: Dr David Pease Computational fluid dynamics as a tool for improving stroke technique Dr Raymond Cohen
0915 5 minute changeover
0920–1030 CONCURRENT SESSION 8
8A—Social sciences 1 8B—Physiology 8 8C—Biomechanics 8
Chair: Professor Stephen Langendorfer
Chair: Dr Tiago Barbosa Chair: Professor Jan Pieter Clarys
Room: Silver Room Room: Gold Room Room: AIS Theatrette
0920 The concepts ‘can swim’ and ‘water competition’ and their relationship: a conceptual model Dr Robert K Stallman
Effects of swim training on energetic and performance in women masters swimmers Professor Daniel A Marinho
Unsteady hydrodynamic forces acting on a robotic arm and its flow field during the crawl stroke Professor Hideki Takagi
0935 The effects of unsteady water on choice of swimming stroke Bjørn Harald Olstad
Bioelectrical impedance vector migration induced by training in young competitive synchronised swimmers Professor Ferran A Rodriguez
Effect of jumping timing on resultant height for lift by four swimmers in synchronised swimming Professor Motomu Nakashima
0950 Lifesaving—a sport and a tool of rescue: is there danger of negative transfer? Torill Hindmarch
Profile of stroke mechanics and economy during maximal aerobic test in crawl swimming Dr Dalton Pessoa Filho
Computational fluid dynamic analysis of streamlined gliding and freestyle kicking at different depths Dr Andrew Lyttle
1005 The ‘neglected factor’ in teaching and learning swimming: the teacher. Examples from Norway Dr Dagmar Dahl
Elite child athlete is our future: bone lumbar spine adaptation in elite Egyptian children monofin swimmers Professor Magdy Abouzeid
External kinetics measurements in individual and relay swimming starts: a review Luis Mourao
1020 Session wrap up Session wrap up Session wrap up
1030–1100 MORNING TEA Indoor Synthetic Field
1100–1200 PLENARY SESSION 8 AIS Theatrette
1100 SOCIAL SCIENCES, HUMANITIES AND PEDAGOGICS KEYNOTE Introduced by Dr Robert K Stallman Water competence: new insights into swimming and drowning Professor Steve Langendorfer
1145 5 minute changeover
14 BMS2014—ABSTRACTS HANDBOOK

Thursday 1 May 2014 (cont)
1200–1300 CONCURRENT SESSION 9
9A—Social sciences 2 9B—Biomechanics 9 9C—Biomechanics 10
Chair: Dr Dagmar Dahl Chair: Dr Daniel Marinho Chair: Elaine Tor
Room: Silver Room Room: Gold Room Room: AIS Theatrette
1200 Exploring beliefs about swimming among children and caregivers: a qualitative analysis Dr Robert K Stallman
The effect of feet placement during the wall contact phase on freestyle turns Jodi Cossor
How swimmers adapt their inter-limb coordination to drag perturbation Associate Professor Ludovic Seifert
1215 Can you swim? Teaching teachers of swimming and water safety Associate Professor Jenny Blitvich
The importance of sagittal kick symmetry for underwater dolphin kick performance Ryan Atkinson
Between stability and flexibility of expert arm–leg coordination in breaststroke swimming Dr John Komar
1230 Self-rescue in cold water: Nordic conditions Torill Hindmarch
Elliptic model for evaluation of tumble turn in swimming Dr Teruo Nomura
On the movement behaviour of elite swimmers during the entry phase Dr Sebastian Fischer
1245 Participation rates and maximal swim performance Dr Andrew Cornett
Effect of different protocol step lengths on swim efficiency and arm coordination in front crawl swimmers Kelly de Jesus
1300 CLOSE OF DAY
1400–1700 TOURS
BMS2014—ABSTRACTS HANDBOOK 15

Friday 2 May 2014
0830–0920 PLENARY SESSION 9 AIS Theatrette
0830 MEDICINE KEYNOTE Introduction: Dr David Hughes Immune function and the swimmer: twenty-five years of enquiry at the AIS Professor Peter Fricker
0915 5 minute changeover
0920–1030 CONCURRENT SESSION 10
10A—Social sciences 3 10B—Medicine 1 10C—Biomechanics 11
Chair: Associate Professor Jenny Blitvich
Chair: Dr David Hughes Chair: Dr Barry Wilson
Room: Silver Room Room: Gold Room Room: AIS Theatrette
0920 Decrement in the performance of swimming skill with the added burden of outer clothing Dr Robert K Stallman
Evaluation of master swimmers health: the case of French National Championships François Potdevin
The accuracy of commercially produced accelerometer-based activity monitors as a means of estimating average swim bout speed Dr Brian Wright
0935 Self-rescue and baby swimming: combining the child’s perspective with a drowning prevention intention Torill Hindmarch
Relationships between body composition and success in competitive swimming Professor Milivoj Dopsaj
A new method to evaluate breaststroke kicking technique using a pressure distribution analysis Takaaki Tsunokawa
0950 Lane bias at the 2013 World Swimming Championships Chris Brammer
Ventilation dynamics during race-pace swimming in elite swimmers Marja Paivinen
A validated assessment of a swimmer’s passive wave resistance using CFD Marion James, Joseph Banks
1005 Self-training strategies in leisure swimmers: gender and age effects François Potdevin
Relationships between hand kinematics and hip movement in front crawl Dr Frederic Puel
1020 Session wrap up Session wrap up Session wrap up
1030–1100 MORNING TEA Indoor Synthetic Field
1100–1150 PLENARY SESSION 10 AIS Theatrette
1100 PHYSIOTHERAPY KEYNOTE Introduction: Sports Physiotherapist Kylie Holt Injury to swimmers: bad luck, bad athletes or bad management Peter Blanch
1145 5 minute changeover
16 BMS2014—ABSTRACTS HANDBOOK

Friday 2 May 2014 (cont)
1150–1300 CONCURRENT SESSION 11
11A—Social sciences 4 11B—Medicine and physiotherapy 11C—Biomechanics 12
Chair: Torill Hindmarch Chair: Kylie Holt Chair: Dr Rod Havriluk
Room: Silver Room Room: Gold Room Room: AIS Theatrette
1150 A non-linear pedagogical approach for learning expert coordination patters in swimming Dr John Komar
Effect of immersion on angle positioning at elbow joint with and without pre-instruction in trained swimmers Koichi Kaneda
Real-time sonification in swimming—from pressure changes of displaced water to sound Professor Bodo E Ungerechts
1205 Predicting a nation’s Olympic qualifying swimmers Sian Allen
Pelvic tilt in the swim block start Brett Doring
A novel dynamometric central for 3D forces and moments assessment in swimming starting Professor João Paulo Vilas-Boas
1220 Swimming and water safety programs for children between 5 and 14 years old in Australia: a survey of swim school managers’, swimming teachers’ and parents’ perceptions Melissa Savage
Changes in the conditioning components for the Japanese Universiade swimming teams Hirofumi Jigami
A new approach for identifying phases of the breaststroke wave kick using 3D automatic motion tracking Bjørn Harald Olstad
1235 Session wrap up Session wrap up Session wrap up
1235–1335 LUNCH Indoor Synthetic Field
1335–1535 Demonstrations in AIS Pools—Biomechanics and Physiology
1535–1635 International Team Relays Old 50m Pool—4 x 50 m freestyle relay teams
1630–1745 PLENARY SESSION 11 AIS Theatrette Chair: Dr Bruce Mason
Closing remarks—Professor Kari Keskinen Achimedes Award presentations—Professor Bodo E Ungerechts to introduce Presentation—Hosts of BMS2018 symposium Close of Conference—Dr Bruce Mason
1745 CLOSE OF DAY
1900–2300 SYMPOSIUM BANQUET Indoor Synthetic Field Dr Bruce Mason and Dr Dave Martin (Master of Ceremonies) Presentation to the winner of the Achimedes Award—Professor Bodo E Ungerechts Brief history of BMS—Professor Jan Pieter Clarys
BMS2014—ABSTRACTS HANDBOOK 17

General information
Conference venue Australian Institute of Sport Leverrier Crescent Bruce ACT 2617
Registration desk The registration desk will be open for the duration of the symposium and will serve as your main point of contact for all symposium related enquiries. The registration desk can be contacted throughout the symposium on mobile phone 0448 576 105. The registration desk will be open at the following times and locations:
Monday 28 April 12.00 pm to 7.30 pm Indoor Synthetic Field
Tuesday 29 April 8.00 am to 5.30 pm Indoor Synthetic Field
Wednesday 30 April 8.00 am to 5.30 pm Indoor Synthetic Field
Thursday 1 May 8.00 am to 2.30 pm Indoor Synthetic Field
Friday 2 May 8.00 am to 5.30 pm Indoor Synthetic Field
Upon arrival at the symposium, please ensure you collect your symposium handbook and name badge from the registration desk. Conference Logistics staff will be happy to assist you.
Catering and dietary requirements Morning, afternoon teas and lunches will be served in the exhibition area in the Indoor Synthetic Field. Lunches will be served as an informal stand-up buffet. Vegetarian options will be catered for in the main catering choices. Other dietary requirements noted on your registration form have been passed on to the catering staff, and will be available from a dedicated catering station. Please ask the catering staff for assistance.
Delegate list A delegate list with name, organisation and state will be supplied to delegates, exhibitors and sponsors at the symposium. Anyone who indicated on their registration form that they did not want their name and organisation to appear on the list has not been included.
Dress The symposium dress is smart casual for all sessions and social functions.
Evaluation survey Following the symposium an evaluation survey will be available for delegates to complete. The online evaluation survey will be emailed to all delegates, exhibitors and sponsors after the symposium. Delegates are encouraged to complete the symposium evaluation as it assists in the planning of future events.
Internet access ASC-Public wifi will be available for delegates attending the BMS2014 Symposium. To log on to the wireless network, simply choose ‘ASC-public’ in your network connections, Agree to the terms and conditions and then choose ‘Continue Browsing’ to access the network. Sessions will last for 8 hours; after this time you will need to agree to the terms and conditions again.
Messages Messages can be left at the registration desk and will be passed on as required. The registration desk can be contacted throughout the symposium on mobile phone 0448 576 105.
18 BMS2014—ABSTRACTS HANDBOOK

Mobile phones As a courtesy to other delegates and speakers, please ensure that all mobile phones and electronic devices including tablets are switched to silent during all sessions and social functions.
Name badges Your symposium name badge must be worn at all times, as it is your entry to all sessions, the exhibition area and social functions. Symposium staff reserve the right to refuse entry to anyone not wearing their allocated name badge.
Speakers’ preparation area Speakers are required to submit and preview their presentations prior to their session. An audio visual technician will be available to assist with your presentation. Please go to the registration desk and the staff will direct you to the speakers’ preparation area.
Special requirements Every effort has been made to ensure people with special requirements are catered for. Should you require any assistance, please contact the registration desk to enable us to make your attendance at the symposium a pleasant and comfortable experience.
Transport information A dedicated symposium bus will be made available to transport delegates staying at the Novotel Canberra and Belconnen Premier Inn to the AIS in the morning prior to the symposium starting and again in the afternoon at the close of each day.
Buses have been arranged to transport people to and from Gold Creek Station for the barbecue dinner.
Public transport To help you get around and explore Canberra during BMS 2014, ACTION are giving away FREE $20 MyWay cards for travel on ACTION buses. To get your FREE card, along with maps, timetables and other helpful information, just visit the ACTION stand at registration between 3.00 pm and 7.30 pm on Monday 28 April. (*Only one card per delegate. Cards are valid for travel between Monday 28 April 2014 and Sunday 4 May 2014.)
For over 37 years ACTION has provided safe, reliable and accessible public transport services to Canberra residents and visitors, servicing four main bus stations, town centres, tourist attractions, entertainment venues, educational institutions and other destinations. For more information visit action.act.gov.au.
The Australian Institute of Sport is serviced by ACTION Bus Route 7 that runs approximately every half hour from Civic to Belconnen. A copy of the timetable is available for viewing at registration or go to www.action.act.gov.au.
Car parking There is free car parking for up to 500 cars available onsite. Note that if there are other events on, there will be high demand for parking.
Taxis Canberra Elite Cabs 0417 672 773 [sms] (SMS name, pickup address and time required)
Cabxpress 6260 6011 [ph]
Silver Service Taxis 13 31 00 [ph]
The Canberra Guide An app and mobile friendly website is available to guide you to Canberra’s must see attractions. To see the website, go to http://www.thecanberraguide.com.au/mobile/ or search for The Canberra Guide on Google Play or the iStore for your smart phone.
BMS2014—ABSTRACTS HANDBOOK 19

Social events
All social events, whether they are included or not, must be pre-booked. If you have not already booked a place and wish to attend, please see staff at the registration desk but note there may not be space available.
Welcome Reception Monday 28 April 2014 6.00 pm to 7.30 pm Venue: Indoor Synthetic Field, AIS Cost: included in full registrations, student registrations and Tuesday day registrations. Additional tickets $50 per person
Following The Leon Lewillie Memorial Lecture, take the opportunity to mingle with fellow delegates at the Welcome Reception.
Gold Creek Station Dinner Wednesday 30 April 2014 6.00 pm to 10.00pm Venue: Gold Creek Station (transfers to and from AIS) Cost: $90 per person
A bus will depart from the AIS at 5.45 pm and return delegates to the AIS, Novotel and Belconnen Premier Inn.
Please ensure you bring your ticket for entry.
Gold Creek Station is a working pastoral property on the outskirts of Hall village, north-east of Canberra. It currently runs merino sheep and beef cattle. You’ll enjoy a true ‘Aussie BBQ’ with steak, sausages, chicken shish kebabs, fresh salads and drinks.
Symposium Banquet Friday 2 May 2014 7.00 pm to 11.00 pm Venue: Indoor Synthetic Field, AIS Cost: included in full and student registrations. Additional tickets $100 per person
Please ensure you bring your ticket for entry.
The symposium concludes with a three-course meal at the AIS. Catch up with fellow delegates to compare notes on the week that’s been.
Tours On Thursday 1 May 2014 delegates have the opportunity to book into one of the tours of attractions of the Canberra region. Note that tours require pre-booking—if you wish to attend one of the tours and have not already booked, please see staff at registration.
20 BMS2014—ABSTRACTS HANDBOOK

Sponsors
Major sponsor—Australian Institute of Sport
As Australia’s strategic high performance sport agency, the AIS is responsible and accountable for leading the delivery of Australia’s international sporting success.
Situated on a 65-hectare site just minutes from Canberra’s city centre, the AIS has been the cradle of Australia’s national sports system—one that is recognised the world over for its ability to identify, develop and produce world, Olympic and Paralympic champions.
Silver sponsor—Kistler
Kistler force plates were first introduced in 1969 and have consistently proved their worth as precise and reliable measuring instruments.
The unique piezoelectric measuring system offers numerous advantages and makes Kistler force plates a cost effective investment for biomechanical laboratories. Kistler performance assessment systems are helping to improve training methods worldwide in national sport science institutions, Olympic training centres and professional training facilities.
With their longevity, high accuracy, linearity and sensitivity Kistler force plates provide reliable and reproducible results. Innovative product design and solid workmanship are results of Kistler’s commitment to quality.
Year after year Kistler invests 10% of its sales in R&D to facilitate technically innovative yet cost-effective state-of-the-art solutions. Kistler Group is the market leader in dynamic measurement technology; 23 group companies and over 30 distributors worldwide ensure close contact with the customer, individualised application support and short lead times.
Satchel sponsor—2XU
Founded and based in Melbourne, Australia, 2XU’s philosophy is to create products that will advance human performance. 2XU employs fabric and construction technology to take you beyond what you previously thought possible. Fast becoming the most technical performance sports brand on the planet, 2XU is worn by multiple world champions, endorsed by sports institutions the world over and praised by professional athletes from all disciplines. 2XU understands what is needed to be the best. Developed by athletes for athletes.
BMS2014—ABSTRACTS HANDBOOK 21

22 BMS2014—ABSTRACTS HANDBOOK

Exhibitors
Contemplas Booth no. 4
CONTEMPLAS GmbH, with its headquarter in Kempten/Germany, develops and distributes worldwide software solutions for general motion analysis in the sport and medicine market.
With the motion analysis software TEMPLO and VICON MOTUS, CONTEMPLAS offers the possibility to do professional motion analysis in different fields of application and integrates other systems, such as EMG, pressure and force measurement.
CORTEX Biophysik GmbH Booth no. 5
As world market leader in mobile Cardiopulmonary Exercise Testing with our METAMAX system, CORTEX is pleased to present to you comprehensive performance diagnostics for professional athletes.
Our METASWIM allows you to determine performance-related physiological data of swimmers in the pool, providing unlimited real life testing during utilising both freestyle and backstroke styles.
COSMED Booth no. 3
With more than 30 years of experience in the sport and performance field, COSMED provides the best and most comprehensive cardiopulmonary, metabolic and body composition solutions for the research, sport science and performance markets.
During BMS 2014, COSMED will present the Aquatrainer, the newly validated swimming snorkel for gas exchange analysis during swimming. Researchers and coaches can now acquire an incredible number of information on athletes tested in real conditions (swimming pool or flume).
BMS2014—ABSTRACTS HANDBOOK 23

Kistler Booth no. 1
Kistler force plates were first introduced in 1969 and have consistently proved their worth as precise and reliable measuring instruments.
The unique piezoelectric measuring system offers numerous advantages and makes Kistler force plates a cost effective investment for biomechanical laboratories. Kistler performance assessment systems are helping to improve training methods worldwide in national sport science institutions, Olympic training centres and professional training facilities.
With their longevity, high accuracy, linearity and sensitivity Kistler force plates provide reliable and reproducible results. Innovative product design and solid workmanship are results of Kistler’s commitment to quality.
Year after year Kistler invests 10% of its sales in R&D to facilitate technically innovative yet cost-effective state-of-the-art solutions. Kistler Group is the market leader in dynamic measurement technology; 23 group companies and over 30 distributors worldwide ensure close contact with the customer, individualised application support and short lead times.
24 BMS2014—ABSTRACTS HANDBOOK
Keynote abstracts
THE LEON LEWILLIE MEMORIAL LECTURE
‘Building up’ in swimming science Professor João Paulo Vilas-Boas1 1Centre of Research, Education, Innovation and Intervention in Sport, Faculty of Sport, University of Porto, Portugal, Porto Biomechanics Laboratory, University of Porto, Portugal, Steering Group ‘Swimming’ of the World Commission for Science in Sports
The BMS movement emerged from the Steering Group Biomechanics and Medicine in Swimming of the World Commission on Science and Sport (International Council of Sport Science and Physical Education—ICSSPE—UNESCO), aiming to promote the production, spreading and recognition of science within the sports community, particularly in swimming. Over the last 30 years, the University of Porto, Portugal, has been fighting for this goal, despite initiating and evolving this purpose in a particularly adverse context, as follows:
• a small peripheral country
• little expression of the swimming sport
• far from leading other sport sciences on a global scale
• low confidence on scientific and theoretical ‘external’ contributions to the field of swimming practice
• limited budget and staff.
Sport and science ‘entrepreneurs’, like Leon Lewillie (and also Jean-Peter Clarys), and the BMS family, catalyse that fight over time, through their example and the opportunity and motivations they have made possible. Nowadays, the University of Porto, the Faculty of Sport, the Porto Biomechanics Laboratory, and especially the Swimming Science Portuguese family, may be proud of a raised building. This text explores the story behind this ‘locally based struggle for the BMS spirit’, concluding that projects like this one are feasible, and may also be a word of motivation for the sake of their proliferation throughout the world.
COACHING KEYNOTE
Biomechanics—interpretation and implementation Bill Sweetenham, AM1 1Business and sports consultant
Along with the principal presenter, this presentation will combine a small group of specialist sports science coaching staff which will include Jodi Cossor (Biomechanics), Tom Vandenbogaerde (Exercise Physiology, Dean Benton (Strength and Conditioning and Nutrition), Vincent Walsh (Professor of Brain Research) and Taisuke Kinugasa (Performance Analyst from Japan Institute of Sport).
This presentation will focus on applied biomechanical competition and training analysis, and its critical interpretation and understanding and acceptance by the coaching team. This critical information will then be supported and delivered to the training and preparation model of the athlete by the entire team of sports science personnel and coaching staff. It would be expected that biomechanical change is best delivered to the athlete and implemented in the most positive and efficient way by the entire coaching and sports science staff.
A winning team approach led by biomechanics on a personal basis would provide greater opportunity for optimal performance for the individual athlete. This highlights the need for a team approach based on efficient change through the leadership of accurate biomechanical interpretation. It is envisaged that this concept, whilst being innovative and creative will challenge the normal and accepted approach that has been utilised by many in the past.
It will address the neurological aspects of accelerated change of motor pathway learning for the benefit of the individual athlete. This will also address a fully integrated learning model for the team staff.
BMS2014—ABSTRACTS HANDBOOK 25

BIOMECHANICS KEYNOTE
Limitations on swimming speed: how can natural technologies be utilised? Dr Frank Fish1 1Professor of Biology, West Chester University, USA
Despite improvements in training, technique and conditioning, human swimming performance is limited in terms of speed due to the constraints of biology and physics. In comparison, animals greatly exceed human swimming performance. Examination of the morphology, mechanics and hydrodynamics of animal swimming can provide insights into mechanisms to efficiently reduce swimming effort and avoid constraints on speed. Animals are capable of manipulating flow around the body both passively and actively. Passive mechanisms rely on structural and morphological components of the body. Streamlined, fusiform body designs are ubiquitous in fast-swimming animals to minimise drag. The texture and composition of the skin surface further minimises drag by a reduction in water friction and delay of separation effects. The skin of marine animals is tighter than the integument of humans. The pliability of human skin produces mobile skin folds that add to drag. A particularly limitation to human performance is swimming in close proximity to the water surface. This position generates waves that increase drag. In addition, interference within the wave pattern traps the swimmer within a trough that produces a barrier to maximum speed. Active mechanisms by animals for enhanced propulsion utilise vorticity control for thrust production. Fast-swimming animals move their appendages in an oscillatory manner in which wing-like blades produce lift as the primary propulsive force. Humans swim with a paddling, drag-based mechanism. Although effective for propulsion, drag-based swimming is limited to use at low speeds and has reduced efficiency, whereas lift-based mechanisms operate at high speeds with high propulsive efficiency. The thrust is produced in association with the momentum shed by the swimmer into the water. The manifestation of this shed momentum is the wake, which is composed of a thrust producing jet and alternating pairs of vortices. The pattern of vortices for humans indicate severe limits to the fastest speed that can be attained. Compared to human swimmers, aquatic animals have an advantage of being adapted to life in water that permits greater swimming performance than for humans.
COACHING KEYNOTE
Sport science and medical support in preparation of elite swimmers (Russia, GBR, Sweden) Andrei Vorontsov1 1Swedish Swimming Federation
Abstract not available at time of printing.
PHYSIOLOGY KEYNOTE
The development of a research department in the French Swimming Federation: a paradigm evolution Professor Philippe Hellard1 1Director of Research, French Swimming Federation, Ministry of Youth Sports and Associative Activities, France
Introduction The French national swimming team won 66 Olympic and World medals from 1998 to 2013, although it had won only 12 between 1984 and 1998. The growth of the French Swimming Federation’s research department since 1998 has been one of the factors contributing to this success. The development of this department was a complex undertaking for many reasons. First, French swimming coaches and technical staff have not been trained within a scientific culture. Yet they possess extraordinarily diverse skills that in many ways depend on their personalities, personal histories, cultural background and past training experiences. This diversity suggests the widely differentiated and individualised support that they require. Second, the department’s activity is expected to cover the broad range of issues related to training and high-level performance. This has required a multidisciplinary approach and the development of a well-functioning collaborative network. Last, as part of our mandate, the research department is called on to communicate and share our findings with all French territories.
26 BMS2014—ABSTRACTS HANDBOOK
Methods The first objective of the department is to formalise the most effective training practices through an analysis of coaching practices. The second objective is to build knowledge that is relevant to all issues touching on performance and health, such as motor learning, nutrition, the mobilisation of energy resources, altitude training, biomechanics and any other area related to high-level training. As a third objective toward performance optimisation, the department of research has for the past 15 years been piloting the development of technological processes to evaluate performance. This aspect of our activity has resulted in the conception of high-tech tools and research equipment that have been meticulously constructed and shown to be well adapted to use in the field.
Results In these three areas, the analysis of the most effective practices, knowledge building to enhance training, and the development of technologies for practitioners, the research department of the French Swimming Federation has been a leader in developing ideas, innovations and skills over the last15 years.
STRENGTH AND CONDITIONING KEYNOTE
Strength and conditioning priorities for elite swim athletes Professor Robert Newton1 1Foundation Professor in Exercise and Sports Science, Edith Cowan University, WA
Introduction The vast volume of scientific research supports evidence from professional practice that an appropriate, well implemented and integrated strength and conditioning program is an essential component of total athlete management and critical to maximising performance, rehabilitation, reducing injury and illness. Swim athletes of all ages and level of competition can benefit from regular strength and conditioning training but program design will dictate safety, efficiency and effectiveness. In this presentation we will explore the latest research informing strength and conditioning science and practice in the preparation of elite swim athletes.
Anabolic/catabolic One of the greatest challenges facing the contemporary athlete and coach is balancing sufficient training volume to elicit continued adaptation and performance enhancement while avoiding injury or illness and minimising declines in structural integrity principally muscle mass and tendon stiffness. Large volumes of endurance exercise result in metabolic and endocrine environments which are both acutely and chronically catabolic reducing the athlete's ability to build or even maintain muscle mass. The muscle system is the largest in the body by mass and is now recognised as possessing important paracrine, exocrine and endocrine functions mediating all of the other body systems. High load resistance training is the most effective strategy for building the mass and capacity of the muscle system providing a more anabolic environment throughout the body to aid recovery from training as well as injury.
Genomic and non-genomic actions of testosterone Testosterone exerts major hormonal influence over physical and mental performance as well as recovery in both male and female athletes. The genomic actions of testosterone are well-established as a powerful anabolic hormone influencing muscle, bone, connective tissue, brain and peripheral nerves. Testosterone is a mediator of tissue repair and as such it is crucial to maintain adequate systemic levels in all athletes. However, there are also important non-genomic actions of testosterone which may improve athletic performance by modulating significant physiological responses enhancing force production and ameliorating fatigue. The psychological effects are also significant with enhanced aggression, confidence, cognitive function, memory and reduced anxiety and depression - highly desirable outcomes, particularly in the female athlete. Testosterone can be manipulated quite effectively by high load resistance training, psychological interventions and appropriate recovery strategies.
Strength and power All sports including swimming require some degree of neuromuscular strength and power. Even endurance is underpinned by the maximal strength capacity of the athlete. While a range of neural and intra muscular components contribute to athlete strength and power, the limiting characteristic is muscle cross-sectional area and architecture. All of these qualities are most effectively manipulated to appropriate strength and conditioning.
BMS2014—ABSTRACTS HANDBOOK 27

Critical programming considerations We will also discuss the importance and implementation of in-season (in-competition) maximal strength training as well as the sequencing of strength and endurance sessions to optimise performance outcomes. Monitoring of key neuromuscular performance qualities to inform training and recovery strategies will also be addressed.
NUTRITION KEYNOTE
Energy and dietary demands of pool and open water swimming Dr David Costill1 1Human Performance Laboratory, Ball State University, USA
This session will be moderated by Professor Louise Burke to lead Dr Costill through his 50 years of swimming physiology and sports nutrition research. Though his past efforts have been directed toward energy demands and muscular training, the intent of this discussion will be to address the demands on dietary needs and adaptations of repeated training sessions. Efforts will be made to outline and emphasise the factual basis for essential nutrition, training, and performance. A distinction will be made between the relatively short pool events and those endurance events in open water. In addition, the discussion will touch on the need for dietary supplements and their impact on peak performance.
BIOMECHANICS/CFD KEYNOTE
Computational fluid dynamics as a tool for improving stroke technique Dr Raymond Cohen1 1Research Scientist, CSIRO Computational Informatics
Elite competitive swimming is a sport in which the difference between winning and losing can be a fraction of a second. Swimmers and their coaches are always striving to optimise stroke technique to get an edge over their rivals. However optimal technique varies across individuals because swimmer performance depends on a complex interplay between fluid dynamics, swimmer biomechanics and physiology. Computational fluid dynamics (CFD) is an emerging technology that offers new opportunities for experimentation with stroke technique to complement the well established pool based experimentation methods. In CFD, experiments are conducted in a virtual environment with a biomechanical model of the swimmer in a computational model of the pool. Individual aspects of stroke can be modified in isolation, providing a controlled and repeatable testing environment. The resulting performance changes can be analysed and the underlying physical mechanisms can be explained. The results are then fed back to the coaches to help inform further testing of stroke technique. Other sports that already benefit from CFD modelling include motor sports, sailing, many winter Olympic sports and cycling.
CFD modelling of swimming requires a biomechanical model of the swimming athlete. This model is generated from a combination of laser body scan of the athlete in an anatomical pose and motion captured swimming kinematics. The model is then placed into the virtual pool and allowed to swim freely. The performance from this baseline case is then analysed. Previously immeasurable quantities about the stroke can be determined from the CFD results including individual forces on limbs, swimming efficiencies and internal swimmer biomechanics including joint torques, joint powers and muscle forces. The coaches and scientists can then modify stroke details of the baseline digitised swimming stroke to see what impacts the changes have on all the performance metrics.
A number of CFD studies have been conducted on swimming stroke technique in a partnership between CSIRO and AIS. Highlights of these studies are presented along with an overview of the leading edge studies being conducted overseas. This presentation will also look towards the future where CFD will become a tool which is routinely used by elite level swimmers and coaches to improve stroke technique.
28 BMS2014—ABSTRACTS HANDBOOK

SOCIAL SCIENCES, HUMANITIES AND PEDAGOGICS KEYNOTE
Water competence: new insights into swimming and drowning Professor Steve Langendorfer1 1Interim Director of the School of Human Movement, Sport, and Leisure Studies, Bowling Green State University, USA
Langendorfer and Bruya (1995) originally proposed “water competence” as a gender-inclusive alternative to “watermanship,” to describe aquatic expertise broadly conceived. Various other authors (e.g., Stallman, et al., 2008; Moran, et al., 2011; Quan, et al., 2013) have suggested it as minimum performance required to reduce drowning risk. I propose that contemporary science requires envisioning human aquatic performance, learning, and instruction uniquely by associating water competence with five key principle: 1) dynamic; 2) individual; 3) contextual; 4) probabilistic; and 5) developmental. It is critical to view water competence dynamically, particularly using Newell’s (1986) constraints model, rather than from static “ability” conceptions. Water competence views efficient and effective control and coordination of aquatic tasks as resultant of interactive relationships among individuals’ personal characteristics, specific aquatic environments in which persons find themselves, and unique task demands required. The dynamic developmental view argues against a unitary approach to swimming instruction or to drowning prevention efforts. It should embrace the notion that individual capabilities emerge in semi-predictable orders across the lifespan as well as moment to moment and from one aquatic situation to the next. Because it recognises the complexity of water competence, I argue for engaging in lines of scientific “strong inference” (Platt, 1964) to explore how persons, aquatic environments, and task demands interact, while searching for existence of lawful, yet heuristic, principles by which to guide our clinical and professional behaviours in swimming and aquatics.
MEDICINE KEYNOTE
Immune function and the swimmer: twenty-five years of enquiry at the AIS Professor Peter Fricker1 1Chief Sports Medicine Advisor to the President of Aspire Zone Foundation, Doha, Qatar
Research on exercise and immune function has been conducted over more than two decades at the Australian Institute of Sport.
The initial (two part) question was why do our high performing athletes get sick when they train hard, and can we prevent such illness?
The AIS and its key partners from Hunter Institute of Immunology, the University of Canberra, and Griffith University embarked on understanding the behaviour of mucosal immune function, and focused much of the work initially on the tracking of Salivary IgA, which has been recognised as a very useful marker of immune status and at least a modest indicator of risk of upper respiratory illness.
Research also considered interventions on the premise that viruses were being reactivated in response to heavy training, which produced the symptoms and signs of illness, and a decrease in performance. Ebstein-Barr viruses were looked at, and antiviral prophylaxis was assessed.
Careful consideration was also being given to the causes of upper respiratory illness, and research methodology refined the assessment of illness for diagnosis, and quantification of workloads to compare the effects of training and of illness, and of recovery with or without interventions.
Research looked at whether athletes were more susceptible to illness than the non-exercising population, individual responses to training, and the associated risk of illness.
Similarly objective measures were necessary to document the impact illness might have on performance at key events.
Over time the research moved to consider the innate immune system, and the behaviour of the gut in this context. Much recent work has indicated a remarkably complex interplay of immune factors which involve the flora of the gut and the cellular mechanisms of the intestinal tract. Interleukins and cytokines, and their associated regulating factors, have come into the spotlight.
BMS2014—ABSTRACTS HANDBOOK 29

Interventions—notably probiotics—have been the most recent area of study in this context, with interesting results.
PHYSIOTHERAPY KEYNOTE
Injury to swimmers: bad luck, bad athletes or bad management Peter Blanch1 1Sports Science and Sports Medicine Manager, Cricket Australia
Due to the high repetitious workload of swimming training, overuse injuries especially of the shoulder are a costly problem for swimming. Due to different logistical reasons long term injury surveillance in swimming has not been achieved and research is often around perceived risk factors examined retrospectively and/or cross-sectionally. The identified risk factors often place ‘the blame’ for injury on some sort of athlete inadequacy (genetic, flexibility, strength, technique). However the most consistent findings that occur in the literature related to injury are to do with training volume and structure. Training ramped up too quickly, taken too high or maintained at monotonous levels are all related to injury. This of course places considerable responsibility on the coach. The basic recording of injury history and injury costs associated with measurement of the load athletes are placed under is fundamental information required for swimming to advance in the area of injury prevention.
30 BMS2014—ABSTRACTS HANDBOOK

Oral abstracts
CONCURRENT SESSION 1A—COACHING
Visual search behaviour and information extraction differences between high-level and developing swimming coaches Amy Waters1, Brendan Lay1, Stephen Tidman1, Nat Benjanuvatra1 1The School Sport Science, Exercise and Health, UWA
Introduction The capability to effectively identify skill errors relies on a high level of perceptual-cognitive skill that enables coaches to integrate visual information with existing knowledge (Williams, et al., 1999). Currently, it is unclear whether expert coaches have developed visual search strategies that enable them to be more efficient at the way they extract visual information. This study sought to examine whether expert coaches are able to extract more relevant information from viewing a short video clip of a swim performance.
Method Four expert and 4 developing coaches viewed twenty 5s video clips of swimmers performing the freestyle sprint (10 above water and 10 underwater) while wearing an eye movement recording system (ASL Mobile Eye, Bedford, MA) (Figure 1). After viewing each clip, participants verbally reported on the swimmer’s technique and predicted the swimmer’s 50m freestyle swim time. Verbal responses were scored based on the number of technical elements and whether coaches made any linkages between problem areas. Locations and durations of gaze fixations (Figure 2) were extracted from the eye movement data.
Figure1: Experimental set-up Figure 2: Visual fixation
Results Expert coaches identified more technical comments as well as making more linking statements that associate different technical elements with one another. Eye tracking data indicated that experts had more fixations than developing coaches and spent a majority of the time fixating on the hips while the developing coaches fixated on the arms. There were no differences between groups in the accuracy of the 50m swim time predictions despite having different visual gaze and verbal response data.
Conclusion The greater number of technical comments and linkage statements made by expert coaches highlighted their ability to identify associations between problem areas and greater understanding of the skill being evaluated. Expert coaches were more efficient at extracting visual information and emphasised body position as a key area of importance. Expert coaches were not better at predicting the 50m sprint time which reflected the novelty of the task to both levels of coach.
References Williams AM., Davids K & Williams, JG (1999). Visual Perception and Action in Sport. London: E & FN Spon.
BMS2014—ABSTRACTS HANDBOOK 31

Presenter Amy Waters is a research student at the School of Sport Science Exercise and Health at the University of Western Australia. Throughout her undergraduate years, she developed a keen interest in the area of coaching expertise. This research study was conducted as part of her Honours degree.
The effect of deliberate practice on the technique of national calibre swimmers Rod Havriluk1 1Swimming Technology Research
Introduction Previous research showed a significant effect for an intervention using deliberate practice with age group swimmers (Havriluk, 2006). The purpose of this study was to determine the effect of deliberate practice on the technique of national calibre swimmers where, in comparison to the age groupers, the habit strength would likely be more resistant to change.
Method The subjects included 19 national calibre swimmers (11 male and 8 female). The swimmers were pre-tested with Aquanex+Video on all four strokes. An instructional intervention included two classroom and three poolside sessions designed to improve technique (as measured by the active drag coefficient, Cd). The intervention was consistent with the concepts of deliberate practice (Ericsson, Krampe & Tesch-Römer, 1993) and included clear instructions, appropriate task difficulty, immediate feedback, individualised supervision, a variety of learning strategies, tasks designed to maintain swimmer’s focus in the cognitive and associative learning stages, and replication of superior performance. After the intervention, the swimmers were asked to continue to practice deliberately for one month during regular team training and were then post-tested.
Results There was a significant decrease (improvement) in the Cd (p<.05). There was no significant change in swimming velocity, but there was a significant decrease in average hand force (p<.05).
1
1.05
1.1
1.15
1.2
1.25
1.3
Pretest Posttest
Swim
min
g Ve
loci
ty (m
/sec
) and
Ac
tive
Drag
Coe
ffici
ent (
Cd)
54
56
58
60
62
64
66
Aver
age
Hand
For
ce (N
)
Swimming VelocityActive Drag CoefficientAverage Hand Force
Conclusions The results demonstrate that even a relatively short duration of deliberate practice can make a meaningful improvement in technique for swimmers of a very high ability level. Because of the technique improvement, the swimmers were able to swim as fast on the post-test with less force, and therefore, less effort.
References Havriluk, R. (2006). Magnitude of the effect of an instructional intervention on swimming technique and performance. In J. P.
Vilas-Boas, F. Alves, A. Marques (Eds.), Biomechanics and Medicine in Swimming X. Portuguese Journal of Sport Sciences, 6 (Suppl. 2), 218–220.
Ericsson, K.A., Krampe, R.T. & Tesch-Römer, C. (1993). The role of deliberate practice in the acquisition of expert performance. Psychological review, 100(3), 363–406.
32 BMS2014—ABSTRACTS HANDBOOK

Presenter Dr Rod Havriluk is the president of Swimming Technology Research and the president of the International Society of Swimming Coaching. He serves on the advisory board for the Counsilman Center for the Science of Swimming and the editorial board for the Journal of Swimming Research. His research is focused on three primary areas: improving technique, preventing shoulder injuries, and accelerating skill learning.
CONCURRENT SESSION 1B—PHYSIOLOGY
Relationship between body composition and competition performance in swimming Megan Shephard1,2, Kellie Pritchard-Peschek3, Tina Skinner2, Kate Bolam2 1Queensland Academy of Sport, 2University of Queensland, 3Swiss Federal Institute of Sport Magglingen
Body composition is believed to be an important component of swimming performance. An increase in lean mass in male swimmers and a reduction in skinfold over a training season was previously correlated with enhanced swimming performance in female swimmers (1). The purpose of this study was to evaluate the relationship between body composition and competition performance in elite swimmers. The body composition of 26 highly-trained swimmers (9 male (M) and 17 female (F)) was assessed. Body composition was measured in the weeks around the major domestic and/or international competition for 2012 and 2013 (19±19 d). Height, body mass (BM), sum of 7 skinfolds (SF7) were measured and dual x-ray absorptiometry (Hologic Discovery W) was used to determine total lean mass (LM), total fat mass (FM), and % body fat (%BF). The swimmers’ performance time in their best event was converted to a FINA point score (2) in order to normalise the competition performance. A total of 59 performances with corresponding body composition measures were used (2.3±1.2 per swimmer). Mean FINA point score for all performances was 893±44 (M 887±48; F 897±44). Mean height was 180.4±7.8 cm (M 188.2±3.7; F 175.4±5.2 cm); mean BM was 73.4±10.1 kg (M 82.3±8.8; F 67.8±6.1 kg); mean LM was 55.5±9.7 kg (M 65.9±6.4; F 49.0±3.8 kg); mean FM 14.4±3.2 kg (M 12.4±2.3; F 15.6±3.1 kg); and mean SF7 was 64.0±23.0 mm (M 46.3±6.9; F 75.4±23.0 mm). For the male swimmers, there was a large relationship with performance between mass (r=0.58) and LM (r=0.55), and a moderate relationship with performance between FM (r=0.36) and %BF (r=0.41). Comparatively, for the female swimmers there was a moderate relationship between performance and FM (r=0.32), and %BF (r=-0.32). In conclusion, there is a moderate relationship between body fat and performance in both male and female swimmers, and a large relationship with lean mass for male swimmers. However, other factors aside from body composition also substantially affect performance at the major competitions.
References 1. Anderson, M.E., W.G. Hopkins, A.D. Roberts, D.B. Pyne. Ability of performance-test measures to predict competitive
performance in elite swimmers. Journal of Sports Sciences. 26(2), 123–130, 2008
2. http://www.fina.org/H2O/index.php?option=com_content&view=article&id=1373&Itemid=641
Presenter Dr Megan Shephard (nee Anderson) is the Sport Science Manager at the Queensland Academy of Sport. Megan completed her PhD in swimming physiology and performance at the AIS and for the past 9 years her role at the QAS has been providing sport science support to Queensland’s elite swimmers and coaches.
Bone mineral density differences between swimmers and soccer players in different age groups Emilson Colantonio1, Claudia Juzwiak1, Marcelo Pinheiro1, Fabricio Madureira2, Claudio Scorcine2, Jose Clemente3 1Universidade Federal de Sao Paulo, 2FEFIS, 3Clinica Multimagem
Introduction During childhood and adolescence, bone mineral density (BMD) increases until the peak bone mass is reached. Physical activity has been proposed as a major determinant of BMD, but there is still doubt concerning the effects of swimming. The aim of the study was to evaluate the BMD of the children, teenagers and adults, who train soccer and swimming.
Method After a written informed consent was obtained, 117 male volunteers were recruited being 38 soccer players (SP), 33 swimmers (SW) and 46 control group (CG). The subjects were divided according to the age in three groups: children 07- to 10-year-old (n=50), teenagers 11- to 17-year-old (n=41), and adults 18- to 30-year-old (n=36). BMD and %
BMS2014—ABSTRACTS HANDBOOK 33

body fat percentage (%BF) were measured using dual-energy absorptiometry (DXA) (Lunar Prodigy Advance—GE Healthcare, USA®). Statistical Analysis: Anova One Way for multiple analysis intra and inter studied groups was performed.
Results Physical characteristics for height (cm), weight (kg), body mass index (kg/m2) and %BF: SP children (134,62±7,79; 33,54±7,43; 18,47±3,61; 24,18±12,27), SP teenagers (166,51±10,81; 59,07±15,67; 21,01±4,20; 16,04±7,02), SP adults (177,54±9,77; 71,66±12,44; 22,64±2,40; 9,28±3,21); SW children (134,62±7,79; 33,54±7,43; 18,47±3,61; 24,18±12,27); SW teenagers (163,55±11,16; 52,36±10,61; 19,37±2,02; 13,52±5,01); SW adults (172,70±9,18; 73,89±8,55; 24,78±2,38; 13,80±6,33); CG children (130,02±9,18; 30,73±7,11; 18,07±2,74; 23,70±9,74); CG teenagers (157,11±11,29; 50,72±13,52; 20,25±3,12; 24,65±9,49); CG adults (177,38±5,63; 76,26±11,36; 24,25±3,29; 23,84±8,91), respectively. BMD mean values of three groups are summarised in Table 1.
Table 1 BMD mean values of children, teenagers and adults for soccer, swimming and control group
Age group Soccer Swimming Control group Children 0.96±0.07 0.93±0.05 0.86±0.05
Teenagers 1,.19±0.16 1.05±0.07 1.02±0.14
Adults 1.41±0.87* 1.26±0.08* 1.23±0.11* The significance level was set at p ≤ 0.05 and * indicate difference between children and adults of the same group.
Conclusion No difference on the BMD was found between swimmers, soccer players and control group. Independent of exercise, BMD was significantly different between children and adults, what probably represents the expected biological process.
References Bellew, JW & Gehrig, L. A comparison of bone mineral density in adolescent female swimmers, soccer players, and weight lifters.
Pediatric Phys Ther, 18(1): 19–22, 2006.
Chow, R; Harrison, J; Dornan, J. Prevention and rehabilitation of osteoporosis program: exercise and osteoporosis. Int J Rehabil Res, 12(1): 49–56, 1989.
Juzwiak, CR et al. Effect of calcium intake, tennis playing, and body composition on bone-mineral density of Brazilian male adolescents. Int J Sport Nutr Exerc Metab, 18: 524–38, 2008.
Orwoll, ES et al. The relationship of swimming exercise to bone mass in men and women. Arquives of Internal Medicine, 149(10): 2197–200, 1989.
Presenter Emilson Colantonia has a PhD in Biodynamic of Human Movement—Universidade de Sao Paulo, Sao Paulo, Brazil. He is a member of the Biosciences Department and Professor of Physical Education Course of Universidade Federal de Sao Paulo, Sao Paulo, Brazil.
CONCURRENT SESSION 1C—BIOMECHANICS
Three different calculations to compute a swimmer’s instantaneous active drag and variations in the parameter values that arise as a consequence Mason Bruce1, Gina Sacilotto1, Pendar Hazrati1, Renata Franco1 1Australian Institute of Sport
Introduction The Australian Institute of Sport has developed a free swim analysis system called the Assisted Towing Method (ATM) designed to estimate a swimmer’s instantaneous whole body active drag parameter at maximum swim velocity. The computed active drag parameter may then be used to assist in the biomechanical assessment of the swimmer’s free swimming technique. The ATM method involves towing the swimmer at approximately a five per cent greater speed than the swimmer’s maximum swim velocity, using a tow which allows a swimmer’s natural intra stroke velocity fluctuations to occur. The swimmer must apply equal maximum power and use similar swimming
34 BMS2014—ABSTRACTS HANDBOOK

technique in both the assisted tow and unassisted swim, as well as maintain a mean constant speed throughout both conditions. The varying drag force and varying velocity profiles are used in the computation of active drag. A cubic function obtained from the maximum swim velocity and the tow velocity is used to compute the swimmer’s active drag parameter by multiplying the drag force profile by this cubic function (Mason et al, 2013). In the first calculation, just the mean swim velocities are used in the cubic function. In the second calculation the instantaneous variable velocities are used. In the third calculation a factor incorporating the acceleration profile is applied to the second calculation.
Method Four elite male freestyle sprint swimmers were tested using the ATM and their active drag parameters were computed using the three different calculations. Although the ATM equation to calculate the active drag parameter in the first and second calculation uses the same formula, different velocity values for Vassist and Vfree are used in the calculation.
Da =Ftow * (Vassist*Vfree**2) In calculation 1 Vassist and Vfre are only mean velocity values. (Vassist **3 –Vfree**3) In calculation 2 Vassist and Vfre are the instantaneous velocities.
In the third calculation, the swimmer’s acceleration profile is included as part of the calculation and this results in a change in the formula for the instantaneous active drag parameter.
Calculation of Active Drag Da = ma(Vassist*Vfree**2 –Vfree**3) – (Ftow*Vassist*Vfree**2) (Vassist **3 – Vfree**3)
The formula variables are:
Da = active drag parameter values Ftow = drag force profile values as measured by force plate Vassist = tow velocity profile values as measured by dynamometer Vfree = free swim velocity profile values computed from Vassist a = acceleration profile values (derivative of Vassist profile) m = inertia of swimmer (mean passive drag value at max swim velocity)
NB. Vfree profile for assisted trials is identical in shape to the Vassist profile but is reduced by a value equal to (Mean of Vassist – Mean of Vfree).
Analysis The three different active drag parameters for each subject were computed and comparisons between each of the three were performed to identify similarities and differences that occur between the three calculated active drag parameters.
Results Results were consistent over all four subjects. Mean active drag and mean propulsive force values were very similar for all three calculations. There were only very slight variations in the active drag, propulsion and net force parameters using the first two calculations. The third calculation resulted in a much larger range in values for the active drag parameter that became positive in its peaks. This resulted in a consequential reduction in the range of the propulsion parameter. The net force parameter remained essential the same for all three calculations.
Conclusion As a consequence of the third calculation producing peaks in the active drag parameter that became positive at the peaks, the researchers would advise only using the first two calculation methods.
References Mason, B., Toussaint, H., Kolmogoro, S., Wilson, B., Sinclair, P., Schreven, S., Sacilotto, G., Hazrati, P. & Domingue, R. (2013)
Recommendations arising from a Workshop of Experts to make the A.I.S. ATM Active Drag Assessment System more Reliable and Accurate. Paper presented at the 31st International Society of Biomechanics in Sports Conference, Taiwan.
Presenter Dr Bruce Mason has been a biomechanist at the Australian Institute of Sport over the last 30 years. During the last seven years he has worked primarily with the sport of competitive swimming. Bruce has produced a number of analysis systems to assess elite sports performance.
BMS2014—ABSTRACTS HANDBOOK 35

Development of a new resisted technique in active drag estimation Pendar Hazrati1,2, Bruce Mason1, Peter Sinclair2, Gina Sacilotto1,3 1Australian Institute of Sport, 2University of Sydney, 3University of Canberra
Introduction A swimmer produces propulsive forces to propel the body forward, however the water creates a resistance or drag force on the swimmer’s body in the opposite direction; opposing forward movement. The Velocity Perturbation Method (VPM) (Kolmogorov & Duplishchea 1992) estimated active drag by comparing two conditions: free swim velocity and the velocity of swimming with an additional hydrodynamic body attached to a swimmer’s waist which produced a known extra drag. The calculation of active drag was based upon two assumptions: first, the swimmer was able to generate an equal mechanical power output in both conditions; and second, the swimmer maintained a constant average velocity during each trial. Xin-Feng et al. (2007) estimated active drag using similar calculations and assumptions to the VPM technique, but with a new device that enabled a drag force that could be varied for different swimmers.
Mason et al. (2011) assessed active drag by using the Assisted Towing Method (ATM) at the Australian Institute of Sport (AIS). This technique utilised the same equal power assumption as the VPM technique except that the swimmer was assisted by a motor driven cable. The purpose of the present study was to implement a new technique to estimate active drag using an electrically braked resisted force rather than an assisted tow, whilst fluctuations in intra-stroke velocity were still allowed. This technique is similar to the method of Kolmogorov & Duplishcheva (1992) and Xin-Feng et al. (2007).
Method Twelve national and international male swimmers with a FINA point rank of over 750 completed all testing protocols. Firstly, two maximum effort free swim trials were performed over a 25 m distance, with velocity averaged over six full strokes towards the end of each trial. Secondly, two trials were performed using an electrically braked cable to achieve a velocity 5% less than mean maximum swim velocity over a 25 m interval with velocity averaged over six full strokes. The swimmers were allowed to have a fluctuating velocity which enabled them to maintain their normal stroke technique while being resisted. Subjects were allowed a five minute rest between each trial to avoid fatigue.
Result and discussion The mean value of active drag during free swimming was computed for each subject. The mean active drag values found in this study (104 N at 1.81 m/s) were in agreement with those previously reported by Kolmogorov & Duplishcheva (1992) (104 N at 1.79 m/s) and Xin-Feng et al. (2007) (105±5.63 N 1.83 m/s). In contrast, the mean active drags values found in the ATM technique (Mason et al., 2011) (124 N at 1.82 m/s) and Hazrati et al. (2013) (131±19 N at 1.80 m/s) were nearly 20% higher than those for the other studies. It seems that the three techniques using resisted swimming (VPM, Xin-Feng and the current study) presented similar values, while the ATM technique which assessed active drag by assisting rather than resisting velocity, provided larger values.
Conclusion The three resisted techniques which estimated active drag during free swimming through the use of known resistive forces provided similar values to each other. In contrast, the velocity-assisted technique of Mason et al. (2011) and Hazrati et al. (2013) provided substantially larger values. Further research should be undertaken to determine why this relationship exists between the resisted and assisted testing conditions.
References Hazrati, P., Mason, B. & Sinclair, P.J. (2013). Paper presented at the 31st International Society of Biomechanics in Sports, Taipei,
252–255.
Kolmogorov, S.V. & Duplishcheva, O.A. (1992). Journal of Biomechanics, 25(3), 311–318.
Mason, B., Sacilotto, G. & Menzies, T. (2011). Paper presented at the 29th International Society of Biomechanics in Sports, Portugal, 327–330
Xin-Feng, W. et al., (2007). Journal of Sports Sciences, 25(4), 375–379.
Presenter Pendar Hazrati is a PhD student at the University of Sydney and PhD scholar of the Australian Institute of Sport. She works with Aquatic, Testing, Training and Research Unit (ATTRU) team at AIS.
36 BMS2014—ABSTRACTS HANDBOOK

CONCURRENT SESSION 2A—COACHING 2
Attentional focus and swim start performance Michael Maloney1, Adam Gorman1 1Australian Institute of Sport
Introduction The ability to execute a complex skill improves when focusing on external movement effects or outcomes, as opposed to an internal or process focus (Wulf, McNevin, Fuchs, Ritter and Toole, 2000). Research in the attentional foci domain has previously investigated swimming, with improvements noted during in-water performance (Stoate and Wulf, 2011). Furthermore, research has observed an external focus to improve force production in simple tasks such as elbow flexion and extension exercises (Marchant et al., 2009) in addition to performance in force dependent tasks, like the swimming start, such as the standing long jump and vertical leap (See Marchant, 2011 for a review). However, not all of these participants could be regarded as experts. Given the effects of attentional focus have demonstrated to vary according to skill level (Perkins-Ceccato, Passmore and Lee, 2003), it is important to test such claims with elite samples so they may be practically applied. The purpose of this investigation is to extend understanding of attentional focus in expert performance of a complex, force producing task such as the swim start.
The aims of this research are to i) consider the effects of manipulating attentional focus on performance of the swim start through the analysis of kinematic and kinetic data; and (ii) identify which, if any, attentional focus best suits elite swimmers in terms of maximising their block starts.
Methods Ten (n=10) elite scholarship swimmers from the Australian Institute of Sport (AIS) each performed 12 dive starts under two different conditions: an internal (process) focus condition and an external (outcome) focus condition. Kinetic and kinematic data was collected across two counterbalanced testing sessions using the ‘Wetplate’ and ‘Swimtrak’ analysis systems (Mason, Mackintosh and Pease, 2012).
Results Results are favourable for focusing attention externally. Results show that when focusing externally, swimmers displayed significantly (p < 0.05) increased take-off horizontal velocity (4.64 m/s ± 0.23 compared to 4.59 m/s ± 0.23), greater peak power (4692 W ± 1276 compared 4592 W ± 1246), increased relative work (15.24 J/kg ± 1.32 compared to 15.03 J/kg ± 1.29), greater entry velocity (6.84 m/s ± 0.14 compared to 6.80 m/s ± 0.16) and a faster time to 15 m (6.88 sec ± 0.62 compared to 6.99 sec ± 0.60).
Conclusions Theoretically, findings extend understanding of attentional focus in highly skilled athletes and offer insight into the usefulness of these instructions for force production and performance in complex, whole body movements. Practically, findings would prove valuable for coaching practitioners and sports scientists. Despite a growing body of evidence in support of external attentional foci instructions, research suggests elite level athletes regularly receive, instead, instructions that encourage an internal focus (Porter et al., 2010). It is important coaches understand how to most effectively use verbal instructions to maximise force production and coordination performance in complex tasks such as the swimming block start.
References Marchant, D. (2011). Attentional focusing instructions and force production. Frontiers in Psychology. 1: 210.
Marchant, D., Greig, M., and Scott, C. (2009). Attentional focusing instructions influence force production and muscular activity during isokinetic elbow flexions. J. Strength Cond. Res. 23, 2358–2366.
Mason, B., Mackintosh, C. & Pease, D. (2012, July). The development of an analysis system to assist in the correction of inefficiencies in starts and turns for elite competitive swimming. In ISBS-Conference Proceedings Archive. 1, 1.
Perkins-Ceccato, N., Passmore, S.R. & Lee, T.D. (2003). Effects of focus of attention depend on golfers’ kill. Journal of Sports Sciences, 21, 593–600.
Porter, J.M., Anton, P.M., Wikoff, N. & Ostrowski, J. (2012). Instructing skilled athletes to focus their attention externally at greater distances enhances jumping performance. Journal of Strength and Conditioning Research, 1.
Porter, J.M., Nolan, R.P., Ostrowski, E.J. & Wulf, G. (2010). Directing attention externally enhances agility performance: A qualitative and quantitative analysis of the efficacy of using verbal instructions to focus attention. Frontiers in psychology, 1.
BMS2014—ABSTRACTS HANDBOOK 37
Wulf, G., McNevin, N.H., Fuchs, T., Ritter, F.,& Toole, T. (2000). Attentional focus in complex motor skill learning. Research Quarterly for Exercise and Sport, 71, 229–239.
Stoate, I. & Wulf, G. (2011). Does the attentional focus adopted by swimmers affect their performance? International Journal of Sport Science & Coaching, 6, 99–108.
Presenter Michael Maloney has an Honours degree in exercise science, with a thesis focusing on representative training design. In 2013 Michael was the Australian Institute of Sport’s postgraduate scholar in skill acquisition. He has remained at the AIS to begin a PhD with the newly established Combat Centre, where he is investigating skill learning under pressure.
Biophysics of the elite endurance swimmer: a case study during aerobic capacity evaluation using different methods Jailton Pelarigo1,2,3, Benedito Denadai4, Joao Ribeiro2, Ricardo Fernandes2,3, Camila Greco4, João Paulo Vilas-Boas2,3 1The Capes Foundation, Ministry of Education of Brazil, Brazil, 2Faculty of Sport/CIFI2D, University of Porto, Portugal, 3LABIOMEP, University of Porto, Portugal, 4Sao Paulo State University, Brazil
Introduction In research swimming, the characterisation of various parameters are generally accomplished by its reduction to the mean and standard deviation. It allows one to analyse the tendencies and/or the variability of a group. However, in doing so, individual characteristics of an elite swimmer may be hidden by the group tendency. Thereby, the purpose of this case-study was to analyse an elite endurance swimmer comparing biomechanical and physiological parameters among the main methods used for aerobic capacity evaluation.
Methods The elite female endurance swimmer (18 yrs, 1.64 m, 56 kg, 91.3% 400m freestyle WR) performed in different days: 1) an intermittent incremental protocol until voluntary exhaustion to determine the velocity (v) associated at the individual lactate threshold (ILT), the ventilatory threshold (VT), the heart rate threshold (HRT), the lactate threshold of fixed 3.5mmol.L-1 (LT3.5), maximal oxygen uptake (VO2max), and minimal v that elicits VO2max (vVO2max); 2) three 30min sub-maximal continuous tests to determine the v and oxygen uptake (VO2) kinetics associated at the maximal lactate steady state test (100%MLSS), above (102.5%MLSS) and below (97.5%MLSS) this intensity. Blood lactate concentration ([La-]), v, ventilatory, energetic and biomechanical parameters were controlled in all tests.
Results The results showed a close relationship among the MLSS, ILT and VT regarding the v, ventilatory, energetic and biomechanical parameters. Meanwhile, LT3.5 and vVO2max presented higher values in all these parameters. Key points were noticed: 1) the oxygen uptake efficiency values (OUE) presented a uncommon stability and linear relationship with the velocity until VO2max, while the remaining swimmers showed decreasing values of OUE, largely determined by metabolic acidosis and pulmonary dead space (Sun et al., 2012). So, this maintenance of OUE may be explained by the observed low [La-] at swimmer’s vVO2max (4.4mmol.L-1); 2) VO2 slow component was not observed both at intensities of 100%MLSS and 102.5%MLSS; 3) the MLSS v was very high (92.6% vVO2max) implying low VO2 values (77.5% VO2max).
Conclusion Thereby, the analysis of individual characteristics of specific athletes, particularly elite swimmers, rather than rely upon mean sample values, may be decisive to understand the specific intervention required and to improve performance.
Acknowledgments This research was supported by grants from the Capes Foundation, Ministry of Education of Brazil (BEX: 0536/10-5).
Reference Sun XG et al. (2012). Eur J Appl Physiol, 112, 919–928.
Presenter Professor João Paulo Vilas-Boas is a Full Professor at the Faculty of Sport, University of Porto, a member of the Steering Group Biomechanics and Medicine in Swimming of the World Commission of Science in Sport, and a
38 BMS2014—ABSTRACTS HANDBOOK

member of the board of the Portuguese Olympic Committee, a former Olympic Swimming Coach and he is the director of the Porto Biomechanics Laboratory, University of Porto, Porto, Portugal.
Assessing the evolution of swim training via a review of Doc Counsilman’s training logs Masataka Ishimatsu1, Kosuke Kojima1, Joel Stager1 1Counsilman Center for the Science of Swimming, Indiana University
Introduction Dr James ‘Doc’ Counsilman, legendary swim coach and innovative pioneer of swim training methods, strived to produce specific and more effective training paradigms for elite competitive swimmers. He led Indiana University men’s swim team (1957–1990), and coached two US Olympic Teams while his 48 swimmers, representing ten nations, competed at the Olympics wining 46 medals including 26 gold. Doc meticulously documented his practical training theory; of interest is how his ideas evolved over time. The purpose of this study was to describe the evolution of Counsilman’s training paradigm over his last two decades at Indiana University by quantitative analysis of his training logs.
Methods Training logs from three college swim seasons (September-March, 25 weeks) recorded by Counsilman and/or his assistants were examined (1968–69, 1978–79, and 1987–88). The number of weekly and total training sessions and swimming distance were calculated for the 1st, 8th, 16th, and 24th weeks of each season. Further, based on Doc’s description, the demand of each swim training set was estimated by classifying into five intensity categories: warm-up and recovery, base, threshold and above, lactate tolerance, and lactate production. Additionally, the physiological stress score (SS) of each set was calculated as the product of swimming distance and stress index assigned to intensity categories (Sharp, 1993).
Results The number of weekly training sessions in the 8th and 16th weeks increased from five in 1968–69 to thirteen in 1977–78, and decreased to nine in 1987–88. Total swimming distance during the 8th week in 1977–78 (72200-meter) was 1.9 and 2.8 times greater than 1987–88 and 1968–69, respectively, although the average distance per session was similar during the 16th week among all three seasons (4500-meter). Average SS per session weeks was similar during the 8th and 16th and between 1968–69 and 1977–78 seasons, but decreased in the 1987–88 season. During the 24th week, although training sessions varied, swimming distance and SS were similar for all three seasons.
Conclusion Counsilman’s training paradigm shifted from few but intense training sessions in the 60s, to greater distance in the 70s, and finally to a more moderate approach with less physiological stress on his athletes in the 80s.
Presenter Joel Stager directs the Counsilman Center for the Science of Swimming at Indiana University in Bloomington Indiana, USA. He obtained an undergraduate Bachelor of Science degree in Biology from the University of Miami while minoring in Chemistry. While at Miami and as a member of the Hurricane swim team he met legendary Indiana University swim coach James (Doc) Counsilman who recruited him to attend graduate school at IU. Stager completed his PhD in Physiology from the Medical Science Program and then completed Post Doctoral work at Colorado State University in the Dept of Physiology and Biophysics in Fort Collins, Co. In 1984 he was offered a position within the Dept of Kinesiology at Indiana University heading up the Exercise Physiology Program. He has held the positions of Director of the Human Performance Laboratory, Chair of the Exercise Science Program, Chair of the University’s Tenure Advisory Committee, Chair of the Long Range Planning Committee for the campus as well as various other roles for IU. He is a participating member of United States masters swimming, a member of the Sport Science and Sport Medicine Committee for USA Swimming and is President and CEO of the Counsilman Center Swim Team.
BMS2014—ABSTRACTS HANDBOOK 39

CONCURRENT SESSION 2B—PHYSIOLOGY 2
Fatigue of the shoulder’s internal rotators following a 200-m all-out swim Jeanne Dekerle1, Louise King1 1University of Brighton, United Kingdom
Introduction Muscular fatigue or loss in the ability to produce force (Taylor et al, 2005) has often been the main mechanism put forward to explain the reduction in stroke length during a 200-m all-out swim (Alberty et al., 2005). The aim of this study was to quantify the loss of torque during maximal voluntary contractions (MVC) following a 200-m all-out swim across a range of joint angles.
Method Ten swimmers performed three, 5-sec MVCs (20-sec recovery; internal rotation of the right shoulder) on an isokinetic dynamometer (Con-Trex Isokinetic dynamometer, Switzerland) before and immediately following a 200-m all-out effort performed in a 25-m pool. Average torque was recorded for each MVC and a mean was obtained from the three attempts. This procedure was replicated 3 times in a random order with the shoulders’ internal rotation angle set at –45°, 0° or + 45°. Each 200-m swim was filmed for subsequent analysis (Version 6.0, DartFish, TeamPro).
Results All stroking parameters changed during each 200-m swim (1.30 ± 0.13 m.s-1) with significant losses in speed (-11 to 13%; F=103.0, P<0.01), stroke rate (-6 to 8%; F=30.0, P<0.01) and stroke length (-5%; F=12.5, P<0.01) when comparing the last to the first 50-m block. Torque values were significantly lower after each swim (F=20.1, P<0.01) and were significantly different between rotation angles [F=5.1, P=0.02; lowest values at –45° (∼65–70%, P<0.05); no difference between + 45° and 0° (P>0.05)] but with no swim x angle interaction effect (F=0.34, P=0.72). The loss in force was not significantly different between angles [in % of pre-swim values: F=.67, P>0.05, –45°: -6 ± 12%, 0°: -9 ± 21%, 45°: -15 ± 16%; in N.m (F=11.9, P<0.05)]. Changes in N.m ranged from -1.4 ± 1.9 N.m (- 45°) to -2.6 ± 4.7 N.m (0°; + 45°: -1.8 ± 2.0 N.m).
Conclusions The internal rotators of the right shoulders do lose their ability to produce force following a 200-m all-out swim. Despite between-angle differences in the torque values with lower scores (-30 to 35%) recorded at –45° when compared to 0° and 45°, a similar level of muscular fatigue occurs across the -45° to 45° range of joint angle investigated.
References Alberty, M., Sidney, M., Huot-Marchand, F., Hespel, J.M. & Pelayo, P. 2005. Intracyclic velocity variations and arm coordination
during exhaustive exercise in front crawl stroke. Int J Sports Med, 26, 471–5.
Taylor, J.L. & Gandevia, S.C. 2008. A comparison of central aspects of fatigue in submaximal and maximal voluntary contractions. J Appl Physiol, 104, 542–50.
Presenter Jeanne Dekerle developed her links with the Chelsea School (now the School of Sport and Service Management) during a 4-month visit in 2003. Since then, she helped the Sport and Exercise Science Area and the University of Lille 2 obtain a European Union grant (under the Interreg IIIa scheme). Jeanne was the post-doctoral research fellow on this project and oversaw the process of bringing the two departments together. The project was focused on the Critical Power concept, the topic of her PhD, and now one of her main research interest as a Senior Lecturer in Sports and Exercise Physiology. She has a publication record of over 20 peer reviewed papers in the area whether investigating exercise tolerance in cycle ergometry or in swimming. Jeanne’s applied work in swimming physiology is internationally recognised with regular invitations to speak at several overseas conferences (Belgium, France, Portugal, Ireland, Canada, and Italy). She is keen in continuing these applied activities, and has the opportunity in her role as the Head Coach of the Eastbourne Swimming Club.
40 BMS2014—ABSTRACTS HANDBOOK

The interplay of critical velocity and anaerobic distance capacity and their relationship to competition performance Lachlan Mitchell1,2, Ben Rattray2, Philo Saunders1,2, David Pyne1,2 1Physiology Discipline, Australian Institute of Sport, 2Discipline of Sport and Exercise Science, University of Canberra
Introduction While critical velocity (CV) and anaerobic distance capacity (ADC) have been measured in swimming for many years, the relationship between the two measures of performance capacity has not been thoroughly detailed.
Methods National level junior swimmers (22 males, 26 females, age = 15.8±1.2 y; mean ± SD) completed a 400 m, 200 m and 100 m freestyle maximal effort time trial on consecutive days. A sub-group of 21 athletes (8 males, 13 females) also completed four 25 m maximal freestyle efforts, from which the fastest effort was recorded. Critical velocity was measured as the slope of the regression line for the three maximal effort time trials, and the ADC was established as the intercept of this line and the y-axis.
Results Critical velocity and ADC were negatively correlated (p < 0.001) for both male (r = -0.75, -0.54 to -0.88; r-value, 90% confidence interval) and female (r = -0.72, -0.52 to -0.85) swimmers. In the freestyle sub-group, the ADC and fastest 25m performance were also negatively correlated (p < 0.01) for both males (r = -0.96, -0.82 to -0.99) and females (r = -0.72, -0.38 to -0.89). The male group were 92.5% likely to have had a stronger correlation for this relationship. Across both groups of male and female athletes a 10% lower ADC corresponded to a 1.3% higher CV for males and a 1.5% higher CV for females.
Conclusions The moderate negative relationship between CV and ADC fits well with the conventional notion that swimmers often exhibit either an aerobic or anaerobic orientation. While both systems can be improved by training, different swimmers often focus on one system, potentially to the detriment of the development of the other. The characterisation of the CV-ADC relationship may provide insight into the magnitude of change a training focus on one energy system may have on the capabilities of the other. It appears junior male freestyle swimmers exploit their anaerobic capacity to a greater degree than junior female swimmers over 25m.
Presenter Lachlan Mitchell is a PhD scholar at the Australian Institute of Sport and the University of Canberra. His research focuses on the variability and physiology of performance in elite swimmers.
Concurrent validity of a new model for estimating peak oxygen uptake based on post-exercise measurements and heart rate kinetics in swimming Thorsten Schuller1, Uwe Hoffmann1, Xavier Iglesias2, Diego Chaverri2, Ferran A Rodriguez2 1Institut for Physiologie und Anatomie, Deutsche Sporthochschule Köln, Germany, 2INEFC-Barcelona Sport Sciences Research Group, Universitat de Barcelona, Spain
Introduction We aimed to assess the validity of a mathematical model based on heart rate (HR) and post-exercise V’O2 measurements for estimating peak V’O2 at the end of a swimming exercise. Its physiological rationale relies on the assumption that during the immediate recovery the systolic volume and the arterio-venous O2 difference remain practically constant for a certain period. According to Fick’s principle, this leaves HR as the main parameter for changes in V’O2 (Drescher et al., 2010).
Method 34 elite swimmers performed 3x200 m at increasing sub-maximal speeds, followed by a maximal 200-m swim. V’O2 was measured breath-by-breath using a portable gas analyser (K4 b2, Cosmed) connected to the swimmer by a respiratory snorkel. HR was measured from RR intervals (CardioSwim, Freelap). Data were time aligned and 1-s interpolated. Exercise V’O2 was the average of the last 20 s during the swim, and recovery V’O2 was the post-exercise first 20-s average. The model calculates a virtual V’O2 at time (t) of recovery [vV’O2(t)], using the quotient between the peak HR during the last 10 s of the swim [HR(0)] and the 1-s interpolated value at (t) [(HR(t)], multiplied by the 1-s interpolated V’O2 value at (t) [V’O2(t)], resulting in: vV’O2(t) = HR(0) / HR(t) V’O2(t). vV’O2
BMS2014—ABSTRACTS HANDBOOK 41

average values were calculated for different time intervals and compared to measured exercise V’O2 values (RM-ANOVA, *p<0.05). Mean differences (mean ∆) and Pearson’s coefficient of determination (R2) were also calculated.
Results As summarised in the table:
Peak V’O2 Time (s) Mean ± SD (ml/min) R2 Mean ∆ (ml/min) p-value
Exercise -20 3547 ± 692
Recovery 0–20 3431 ± 685 0,959 -116 0.001*
Estimated (v) 0–20 3564 ± 698 0,963 17 1.0
5–20 3559 ± 705 0,943 13 1.0
10–20 3520 ± 725 0,900 -27 1.0
15–20 3438 ± 722 0,856 -109 0.76
5–15 3623 ± 707 0,963 76 0.07
10–15 3604 ± 731 0,923 57 1.0
Conclusions The difference between peak V’O2 at the end of the exercise and during the immediate recovery pinpoints the inaccuracy of the 20-s recovery method of estimation and supports the need for the model. The lack of significant differences and high correlation between measured peak V’O2 and estimated post-exercise vV’O2 support its basic physiological assumption. In conclusion, the proposed mathematical model for estimating peak V’O2, which couples and takes into account both HR and V’O2 off-kinetics, provides valid and accurate results, while allowing the subjects to swim completely unimpeded and avoiding the uncertainty of the backward extrapolation method (Rodríguez, 1999).
References Drescher U., Essfeld D., Hoffmann U. 15th ECSS Annual Congress, Antalya, 2010.
Rodríguez F.A. Biomechanics and Medicine in Swimming VIII, pp. 219–226. Jyväskylä, Gummerus Printing, 1999.
Presenter Thorsten Schuller has a BSc in exercise science at German Sport University in Cologne (2008), specialised in swimming coaching and physiology. He is a swimming coach in southern Germany working with young and elite swimmers. Thorsten is currently engaged in psychology studies to improve coaching skills.
Effects of breathing patter during submaximal eggbeater kick on oxygen uptake at constant workload in competitive water polo players Yosuke Sasaki1, Hideki Takagi2, Bun Tsuji2, Kazuhito Watanabe1, Yosuke Murase2, Shozo Tsubakimoto2, Takeshi Nishiyasu2 1Graduate School of Comprehensive Human Sciences, University of Tsukuba, 2Faculty of Health and Sport Sciences, University of Tsukuba
Introduction Recently, we observed specific breathing patterns during eggbeater kick, i.e., greater tidal volumes and End-inspiratory breath-hold periods, compared to those during leg exercise on land (cycling) at submaximal exercise intensities. A previous study reported that the body weight in water in resting vertical position was changed with the tidal volume (1). Thus, given that such specific breathing patterns during eggbeater kick could contribute to decrease in the body weight, oxygen uptake during that might be decreased. This study investigated the hypothesis that the greater tidal volumes and/or End-inspiratory breath-hold periods led to decrease in oxygen uptake at constant workload during eggbeater kick, but did not during cycling on land.
Method Twelve male college-age water polo players performed incremental weight-added eggbeater kick and cycling tests to elicit a moderate exercise intensity (48% peak oxygen uptake). Then, they performed four sets of ten minutes exercises at the intensity in each exercise mode. During the last seven minutes of each trial, the subjects controlled their breaths; 1) they forced to maintain their tidal volumes and respiratory frequencies with no breath-holds
42 BMS2014—ABSTRACTS HANDBOOK

(Normal-breath trial); 2) to hold their breaths at End-inspiration (End-inspiratory breath-hold trial); 3) to do so at End-expiration (End-expiratory breath-hold trial); and 4) to decrease in their tidal volumes and to increase in their respiratory frequencies (Lower tidal volume trial).
Results As we expected, oxygen uptake in End-inspiratory breath-hold trial was significantly lower than that in any other trials during eggbeater kick. However, unlike the hypothesis, no effect of tidal volume was found, by comparing the values in Normal-breath and Lower tidal volume trials. In contrast, no differences were detected in the values among the controlled-breath trials during cycling on land.
Conclusions In competitive water polo players, oxygen uptake could be decreased by holding their breaths at End-inspiration during eggbeater kick at constant workload.
References 1. Von Döbeln W, Holmér I: Body composition, sinking force, and oxygen uptake of man treading water. J Appl Physiol. 1974,
37: 55–59
Presenter Yosuke Sasaki is a PhD student in the Graduate School of Comprehensive Human Sciences, University of Tsukuba. He plays water polo as a goal keeper and is studying the cardio-respiratory responses during eggbeater kick in his PhD program.
Use of additional warm-up strategies in the pre-race transition period enhances sprint swimming performance Courtney McGowan1, Ben Rattray1, David Pyne2, Kevin Thompson1, John Raglin3 1National Institute of Sport Studies, University of Canberra, 2Discipline of Physiology, Australian Institute of Sport, 3School of Public Health, University of Indiana, USA
Introduction Active warm-up has been reported to elevate body temperature1 and increase muscle contractile performance2, both of which are considered crucial for optimal performance. Although several studies have examined the impact of pre-competition warm-up strategies in swimming, new strategies such as passive heating and dryland-based exercise circuits have emerged. The objective of the present study was to determine the impact of a standardised pool warm-up in combination with various additional warm-up strategies on sprint swimming performance.
Method On four separate occasions, sixteen national age-group (11 male, 5 female, aged 13–19 y) swimmers completed a standardised, 25 min pool-based warm-up, followed by a simulated 30 min pre-race transition period (which included a 15 min simulated marshalling period) before completing a 100 m freestyle time-trial. During the pre-race transition period, swimmers wore standard tracksuit pants and completed, in random order the following additional warm-ups (i) standard tracksuit top (CON), (ii) insulated tracksuit top with integrated heating elements (PAS), (iii) standard tracksuit top and completed a 4 min dryland-based exercise circuit (DRY), or (iv) a combination of PAS and DRY (COMBO). Overall performance times, core temperature (Tc) and blood lactate concentration were monitored throughout each trial.
Results Overall performance times were normalised against best effort time and transformed into percentages prior to analysis. Mean performance times for DRY (p = 0.02; x ¯ = 100.97%) and COMBO (p = 0.00; x ¯ = 100.31%) were significantly faster than CON (x ¯ = 102.09%). Mean Tc declined significantly less in the pre-race transition period in the COMBO (p = 0.015; x ¯ = 0.13°C) versus CON (x ¯ = 0.64°C) condition and marginally less in DRY (p = 0.076; x ¯ = 0.24°C). Mean post time-trial lactate concentrations were not significantly different between conditions.
Conclusions The use of additional warm-up strategies incorporating dryland-based exercise routines alone or in combination with electrically heated tracksuit tops, in the pre-race transition period can attenuate the decline in Tc and significantly improve sprint swimming performance.
BMS2014—ABSTRACTS HANDBOOK 43
References 1. Sargeant AJ. Eur J Appl Physiol 1987; 56: 693–8.
2. Sale DG. Exerc Sport Sci Rev 2002; 30 (3): 138–43.
Presenter Courtney McGowan completed her Bachelor of Coaching Science and Bachelor of Sport Studies (Honours) at the University of Canberra in 2010. In 2011 she was invited to join the Australian Institute of Sport as a Post Graduate Scholar in the Department of Physiology, responsible for the quality assurance of physiological testing. In 2012 having received an Australian Post-graduate Award she commenced her PhD in the National Institute of Sport Studies at the University of Canberra. Her research interests include: the optimisation of pre-race warm-up strategies and the role that pacing strategies play in the performance outcomes of elite swimmers.
Altitude training enhances performance in elite swimmers: results from a controlled four parallel groups trial (The Altitude Project) Ferran A Rodriguez1, Xavier Iglesias1, Belen Feriche2, Carmen Calderoan3, Diego Chaverri1, Anna Barrero1, Nadine B Wachsmuth4, Walter Schmidt4, Benjamin D Levine5 1INEFC-Barcelona Sport Sciences Research Group, Universitat de Barcelona, Spain, 2Faculty of Sports Sciences, Universidad de Granada, Spain, 3High Altitude Training Center (CAR) Sierra Nevada, Spain, 4Department of Sports Medicine and Physiology, Universitat Bayreuth, Germany, 5IEEM, Presbyterian Hospital, University of Texas Southwestern, USA
Introduction Based on available scientific literature, training at natural altitude has failed so far to prove useful for the enhancement of sea level performance in swimmers (Truijens & Rodríguez 2010, Rodríguez 2010). This controlled nonrandomised four parallel groups trial examined the effects on performance, oxygen transport and total haemoglobin mass (tHbmass) of four training interventions: terrestrial living high-training high for 3 or 4 weeks (Hi-Hi3, Hi-Hi), living high-training high/low (Hi-HiLo), and living and training at sea level for 4 weeks (Lo-Lo).
Methods From 65 elite swimmers, 54 met all inclusion criteria and completed sea-level time trials over 50 and 400 m front crawl (TT50, TT400), and 100 (sprinters) or 200 m (non-sprinters) at best personal stroke (TT100/TT200). V’O2max was measured on an incremental 4x200-m front crawl test. Training load was estimated using TRIMP and session RPE assessment. Initial performance and measures (PRE) were repeated immediately after the camp (POST) and once weekly on return to sea level during 4 weeks. tHbmass was measured in duplicate at PRE and once a week during the camp. Intervention effects were analysed using mixed linear modelling. Changes are ∆% ± CI95%. Statistical significance was set at p<0.05.
Results TT100 or TT200 improved by ∼3.5% whether at sea level or at altitude, but Hi-HiLo improved more two (5.3±1.6%) and four weeks (6.3±1.9%) after the camp as compared to the other groups. Hi-HiLo and Hi-Hi improved more in TT400 (4.6±1.4% and 3.3±1.4%, respectively). Hi-HiLo improved more (5.5±1.7%) than Lo-Lo (3.2±0.9%) in TT50 after four weeks. There were no changes in V’O2max in none of the groups after the intervention. tHbmass increased in Hi-Hi (6.2±2.6%) and Hi-Hi3 (3.8±5.6%), whereas no significant changes were noted in Hi-HiLo (1.3±4.3%).
Conclusions Hi-HiLo is an effective strategy to enhance performance in elite swimmers over a range of distances, clearly exceeding the smallest worthwhile enhancement effect for Olympic-standard swimmers (0.8%) (Trewin et al. 2004). This substantial performance improvement was not linked to changes in V’O2max or tHbmass, hence could not be attributed to enhanced oxygen transport capacity.
References Rodríguez FA. Training at real and simulated altitude in swimming: too high expectations? Biomechanics and Medicine in
Swimming XI, 30–32. Oslo, 2010.
Trewin CB, Hopkins WG, Pyne DB. Relationship between world-ranking and Olympic performance of swimmers. J Sports Sci, 22(4), 339–345, 2004.
Truijens MJ, Rodríguez FA. Altitude and hypoxic training in swimming. World book of swimming: from science to performance, 393–408. Hauppauge, New York: Nova Science, 2011.
44 BMS2014—ABSTRACTS HANDBOOK

Presenter Ferran A Rodriguez (MD, PhD, FECSS, FACSM) is full professor at INEFC, University of Barcelona, and serves as coordinator of the INEFC Barcelona Sport Sciences Research Group (http://inefcresearch.wordpress.com/). His main areas of research include exercise and sports physiology, bioenergetics, altitude training, physiological testing, swimming and aquatic sports, and talent identification.
Effects of subacute moderate hypoxia on performance, peak oxygen uptake and stroke kinematics in 50 to 400-m time trials in elite swimmers Ferran A Rodriguez1, Diego Chaverri1, Jordi J Mercade2, Javier Arguelles3, Esther Morales2, Blanca de la Fuente3, Belan Feriche2, Carmen Calderon3, Anna Barrero1, Xavier Iglesias1 1INEFC-Barcelona Sport Sciences Research Group, Universitat de Barcelona, Spain, 2Faculty of Sports Science, Universidad de Granada, Spain, 3High Performance Centre (CAR) of Sierra Nevada, Spain
Introduction Exposure to moderate hypoxia negatively impacts many physiological responses to maximal exercise (e.g. decreased cardiac output and muscle recruitment, increased cost of ventilation) and impairs aerobic performance, whereas short duration, anaerobic exercise is not much affected. The effect of acute hypoxia on physiological and technical performance in swimmers has been investigated during submaximal (Mercadé et al., 2006) but not during maximal swimming exercise. We analysed the effects of subacute exposure to moderate altitude within a range of distances on maximal swimming performance, peak V’O2 and stroke kinematics in elite swimmers.
Method Nine elite swimmers (8M, 1F) performed an incremental 4x200-m front crawl test for V’O2max. On separate days, they performed time trials in a 50-m indoor pool: 50 and 400 m front crawl (TT50, TT400) and 200 m at best personal stroke (TT200). They were tested both at normoxic (NORM) conditions, and ca. 72 h after arrival to at an altitude of 2320 m (CAR Sierra Nevada, Spain) (HYPO). Respiratory gases were collected for 1 to 3 min during the immediate recovery. Peak V’O2 was taken as the first post-exercise 20-s average. Swim trials were video recorded with three lateral cameras (50 Hz), two placed underwater and one outside the water. Final time (t) and 3-cycle stroke rate (SR), stroke length (SL), and stroke index (SI) were assessed on each trial. Differences between NORM and HYPO were tested using RM-ANOVA, with p set at <0.05* for significance.
Results At NORM, V’O2max (3555 ± 827) was not different from V’O2peak at TT200 (3341±766, p=0.18), but it was higher than at TT400 (3331± 648, p=0.04). Other results are summarised in the table.
TT50 TT200 TT400
NORM Time (s) 29.47 ± 1.66 135.8 ± 6.1* 279.2 ± 9.3*
V’O2peak (ml/min) 3246 ± 732 3341 ± 766* 3331 ± 648*
SR (Hz) 49.6 ± 2.7 43.8 ± 5.0 40.9 ± 4.4
SL (m) 1.96 ± 0.12 1.98 ± 0.22 2.10 ± 0.25*
SI 3.17 ± 0.34 2.83 ± 0.32* 2.96 ± 0.42*
HYPO Time (s) 29.18 ± 1.64 139.7 ± 6.8 282.5 ± 2.7
V’O2peak (ml/min) 2955 ± 524 2921 ± 524 2856 ± 476
SR (Hz) 49.5 ± 3.6 43.1 ± 5.4 40.7 ± 4.2
SL (m) 1.95 ± 0.13 1.96 ± 0.24 2.03 ± 0.23
SI 3.13 ± 0.26 2.71 ± 0.36 2.79 ± 0.37
Conclusions Altitude exposure did not affect 50-m swimming performance, V’O2peak or stroke kinematics. In contrast, in the 200- and 400-m trials, there was a decrease in performance (2.9 ± 1.6% and 1.2 ± 1.2%), V’O2peak (12 ± 6% and 14 ± 10%), and SI (4.1 ± 3.8% and 5.8 ± 3.0%). Subacute exposure to moderate hypoxia (2320 m) does not affect sprinting ability (∼30 s), whereas it impairs middle-distance performance (∼2–5 min) and stroking efficiency, likely as a consequence of early fatigue caused by centrally-limited O2 delivery to the exercising muscles.
References Mercadé J.J., Arellano R., Feriche B. Revista Portuguesa de Ciências do Desporto, 6, supl. 2, 148–150, 2006.
BMS2014—ABSTRACTS HANDBOOK 45

Presenter Ferran A Rodriguez (MD, PhD, FECSS, FACSM) is full professor at INEFC, University of Barcelona, and serves as coordinator of the INEFC Barcelona Sport Sciences Research Group (http://inefcresearch.wordpress.com/). His main areas of research include exercise and sports physiology, bioenergetics, altitude training, physiological testing, swimming and aquatic sports, and talent identification.
CONCURRENT SESSION 2C—BIOMECHANICS 2
The velocity and fatigue index of various leg kicks in rescue towing J Arturo Abraldes1,3, Robert Keig Stallman2,4, Susana Soares3, Ana Catarina Queiroga3,5 1Faculty of Sport Sciences, University of Murcia, Spain, 2Norwegian School of Sport Science, 3Center of Research, Education, Innovation and Intervention in Sport, U of Porto, 4Norwegian Lifesaving Society, 5Portugese Lifesaving Association
Introduction Several studies have compared towing with the flutter and dolphin kicks, with and without fins. Others have examined towing, including both arm and leg strokes. Given the few studies of rescue towing, there is urgent need for further study. While performance with fins has been shown to be superior, the most common situation in real rescue is that fins are not available.
Methods With the body position of the rescuer (side lying) and the victim (supine lying) held constant, the velocity developed over 25 metres, without fins, was examined. A standard ILS rescue mannequin was used with the grip on back of the neck. The lead arm was extended and passive. A velocimeter was used to determine velocity. The fatigue index (FI) was also obtained. The leg strokes examined were the breaststroke, scissors, flutter and dolphin kicks, in a 4 X 25m random order design. Eleven experienced lifeguards served as subjects.
Results The breaststroke and scissors kicks demonstrated statistically significant superiority in velocity and lower fatigue index. The breaststroke kick was slightly better than the scissors kick (non-significant). This may have been due to more experience with the breaststroke kick. The dolphin kick showed the highest FI.
Conclusions The needs for competition lifesaving and real rescue may differ. Possibilities for recommended technique differences need further exploration.
References 1. Abraldes JA, Soares S, Lima AB, Fernandes RJ, Vilas-Boas JP. The Effect of Fin Use on the Speed of Lifesaving Rescues.
International Journal of Aquatic Research and Education. 2007;1(4):329–40.
2. Hay JG, McIntyre DR, Wilson NV. An evaluation of selected carrying methods used in lifesaving. In: Lewillie L, Clarys JP, editors. Swimming II Proceedings of the second international symposium on biomechanics in swimming. Brussels: University Park Press; 1975. p. 247–53.
Presenter Robert Keig Stallman is a retired Assoc Prof at Norwegian School of Sport Science. He has been active in many branches of aquatics for over 50 yrs. He has worked in approximately 12 aquatic organisations in 6 countries. He is still actively writing, researching and presenting.
46 BMS2014—ABSTRACTS HANDBOOK

Upper limb kinematic differences between breathing and non-breathing conditions in front crawl sprint swimming Carla McCabe1,2, Stelios Psycharakis1,3, Ross Sanders4 1Centre of Aquatics Research and Education, University of Edinburgh, UK, 2Inst. for Sport, Physical Education and Health Sciences, University of Edinburgh, 3School of Life, Sport and Sciences, Edinburgh Napier University, UK, 4Faculty of Health Sciences, University of Sydney
Introduction Due to conflicting evidence (Payton et al., 1999; Vezos et al., 2007), the purpose of this study was to determine whether the breathing action in front crawl (FC) sprint swimming affects upper limb kinematics relative to a non-breathing stroke cycle (SC).
Method Ten male competitive swimmers performed two 25m FC sprints: one breathing to their preferred side (Br) and one not breathing (NBr). Both swim trials were performed through a 6.75m3 calibrated space and recorded by six gen-locked JVC KY32 CCD cameras. The calculated variables were: average swim velocity, stroke length, stroke frequency, vertical and lateral hand displacement, elbow angle magnitudes, stroke phase durations and the horizontal and vertical hand acceleration. A paired t-test was used to assess statistical differences between the trials, with a confidence level of p<0.05 accepted as significant.
Result Relative to NBr, it was found that Br resulted in a significant decrease of the following: average swim velocity (3%; p=0.02), maximum hand depth (6%; p=0.04), push phase duration (16%; p=0.02), elbow angle magnitude at the end back position (7%; p=0.01), range of elbow angle magnitude within the push phase (31%; p=0.01) and a reduced vertical hand acceleration within the pull phase (30%; p=0.04). It was also found relative to NBr that Br significantly increased the average lateral hand displacement within the push phase (24%; p = 0.01), pull phase duration (14%; p=0.02) and a faster vertical hand acceleration within the push phase (33%; p=0.03).
Conclusions Swim performance is compromised in terms of time and influence on kinematic variables by the inclusion of taking a breath in sprint FC swimming. Greater maximum hand depth and elbow range of motion during the NBr trial may have contributed to the faster swim performance compared to the Br trial. Kinetic analysis is required to establish whether temporal changes in stroke phase durations and the accelerative actions of the hands affected the propulsive output between the two conditions. It is recommended that sprinters limit the number of breaths taken without physiological compromise.
References Payton, C.J. et al. (1999). Journal of Sport Sciences, 17, 689–695.
Vezos, N. et al. (2007). Journal of Sports Science and Medicine, 6, 58–62.
Presenter Dr Carla McCabe graduated from the University of Limerick (2003) with a first class honours in Sport and Exercise Science. Under the supervision of Prof Ross Sanders, Carla completed her PhD at the University of Edinburgh (2008). During her time in Edinburgh Carla has worked at the Centre of Aquatics Research and Education (CARE) providing biomechanical support to elite and non-elite swimmers and producing research publications. Carla is currently a lecturer in Biomechanics at the University of Edinburgh and is still an active aquatic researcher.
The effects of breathing on hip roll asymmetry in competitive front crawl swimming Mike Barber1, John Barden1 1University of Regina, Saskatchewan, Canada
Introduction Front crawl swimming is a cyclic activity in which swimmers alternate arm and leg movements to create propulsive forces while the body rotates about its longitudinal axis. It has been suggested that breathing increases body rotation and potentially disrupts the symmetry of the stroke (Psycharakis & Sanders, 2010). Inertial sensors are an emerging and accessible technology for quantifying movement in aquatic environments (Bachlin & Troster, 2011).
BMS2014—ABSTRACTS HANDBOOK 47

This study quantified the effect of breathing on hip roll angle using a body-fixed (lower back at L3) tri-axial accelerometer.
Methods Twenty (13 male, 7 female) provincial and national level swimmers performed three 100m front crawl trials at 70% of their best 100m time with 2 minutes recovery between trials. Three breathing conditions were tested: 1) unilateral preferred side, 2) unilateral non-preferred side and 3) bilateral. Peak unilateral hip roll angles, total hip roll angle and a hip roll asymmetry index were calculated for each condition.
Results The results showed that total hip roll angle was significantly greater (p < 0.05) in the non-preferred (118.8o) breathing condition compared to the preferred breathing condition (114.8o). Subjects rolled significantly more (p < 0.05) to the breathing side than the non-breathing side in all conditions. Further, subjects rolled significantly more (p < 0.05) to the preferred side than the non-preferred side when not breathing in the unilateral conditions (54.3° vs. 51.7°) Finally, the unilateral preferred and non-preferred breathing conditions demonstrated significantly greater (p < 0.05) hip roll asymmetry, as measured by the asymmetry index, than the bilateral condition.
Conclusions The findings demonstrate that breathing patterns affect hip roll asymmetry when performing front crawl at a submaximal speed, such that unilateral breathing exhibits greater asymmetry than bilateral breathing. This supports the idea that bilateral breathing is beneficial and can reduce hip roll asymmetry. The results also demonstrate the practical application of using accelerometers to quantify hip roll angle in competitive front crawl swimming.
References Bachlin, M. & Troster, G. (2011). Swimming performance and technique evaluation with wearable acceleration sensors. Pervasive
and mobile computing, 8, 68–81.
Psycharakis, SG & Sanders, RH (2010). Body roll in swimming: A review. Journal of Sports Sciences, 28(3), 229–236.
Presenters Mike Barber was a graduate student at the University of Regina, Saskatchewan, Canada.
Dr John Barden is an Assistant Professor at the University of Regina, Saskatchewan, Canada. Dr Barden is head of a research team investigating the use of inertial sensors in aquatic environments.
Freestyle arm entry effects on shoulder stress, force generation, and arm synchronisation Theodore Becker1, Rod Havriluk2 1Everett Pacific Industrial Rehabilitation, 2Swimming Technology Research
Introduction Previous research showed that immediately after the arm entry, female butterfly swimmers wasted time (30% of the stroke cycle) with their arms in a weak position that stressed their shoulders (Becker & Havriluk, 20 I 0). The present study was designed to examine the prevalence of an ineffective arm entry in freestyle with respect to gender and the impact on shoulder stress, force generation, and arm synchronisation.
Method The study included 40 university swimmers (20 males and 20 females), each tested with Aquanex+Video swimming freestyle over a 20m course. At the completion of the arm entry, the position of the hand with respect the depth of the shoulder was determined. Stroke cycles were analysed to determine the time that hand force generation begins (HFB) and ends (HFE) and the time that the hand submerged below the level of the shoulder (HSS). The arm synchronisation was analysed in terms of the gap or overlap between hands in force generation as HFE – HFB and HFE- HSS.
Results Most females (70%), but only I 0% of males completed the arm entry with the hand closer to the surface than the shoulder. The time required to submerge the hand below the level of the shoulder (or time of exposure to shoulder stress) for females was significantly longer than for the males (p<.05). Males and females had a similar force overlap for HFE- HFB. For HFE – HSS; males had an overlap, but females had a gap.
48 BMS2014—ABSTRACTS HANDBOOK

Conclusions The arm entry difference resulted in a much longer time of exposure to shoulder stress for the females. Because the females required so much time to submerge the hand below the shoulder, the arm synchronisation showed a gap in force generation as opposed to an overlap for the males. Females can improve their arm entry to minimise time of exposure to shoulder stress and maximise the force generation overlap.
References Becker, T.J. & Havriluk, R. (2010).Quantitative data supplements qualitative evaluation of butterfly swimming. In P-L. Kjendlie,
R.K. Stallman & J. Cabri (Eds.) Biomechanics and Medicine in Swimming XI. Norwegian School of Sport Science, Oslo.
Presenter Dr Theodore Becker attended Indiana University and completed the PhD in Human Performance in 1984. During Ted’s education at IU he was the athletic trainer for Doc Counsilman’s Indiana Swimming teams beginning in 1973. He was the Head Trainer for the United States Swimming Teams and trainer for the 1984 US Swimming Olympic Team, and was featured in an article in the Olympic Sports Illustrated issue. Ted’s specialisation is the analysis of biomechanical shoulder dysfunction in swimmers and restorative exercise intervention. During the last 30 years he has been a presenter at ASCA, BMS, and the coaches college at the Olympic Training Center Colorado Springs. Ted is an advisor to the Journal of Swimming Research, co-author with Dr. Havriluk on swimming research projects, and chapter contributor to the text, Clinics in Sports Medicine—Swimming.
A multi-analysis of performance in 13- to 15-year-old swimmers: a pilot study Ana Silva1, Ludovic Seifert2, Marisa Sousa1, Renata Willig1, Francisco Alves3, João Paulo Vilas-Boas1, Ricardo Fernandes1, Pedro Figueiredo1 1CIFI2D, Faculty of Sport, University of Porto, Portugal, 2University of Rouen, Faculty of Sport Sciences, France, 3Faculty of Human Kinetics, Technical University of Lisbon, Portugal
Introduction Competitive swimming is a cyclic sport performed with the aim of travelling a given distance as fast as possible. The aim of this study was to conduct an analysis to determine which parameters are predominant to achieve better performances in age group swimmers.
Methods Eighteen young female swimmers were divided in two groups (G1: 14.00±0.76; G2: 13.40±0.52 years) considering their performance level. Each swimmer was assessed for anthropometry (height, arm span, foot and hand length), flexibility (flexion and extension of shoulder joint), 30s maximal tethered swimming (to measure mean, Fmean, maximal force, Fmax, and index of fatigue, FI), ten incremental velocity bouts in MAD-system (Toussaint et al., 2004) to measure drag at the maximal velocity, and 25 m at 50 m race pace (to measure stroke length, stroke rate, stroke index, and index of coordination—IdC—Chollet et al., 2000) all in front crawl. An independent sample t-test was performed to compare groups (P<0.05).
Results Swimming velocity was different between groups (1.68±0.02 m/s for G1 and 1.58±0.04 m/s for G2). No differences were found in anthropometric characteristics, in active drag (59.0±20.6 vs. 50.7±11.5 N), and IF (11.4±5.1 vs. 12.0±5.6). G1 showed higher shoulder flexion, stroke length (1.99±0.15 vs. 1.83±0.18 m), stroke index (3.34±0.23 vs.
BMS2014—ABSTRACTS HANDBOOK 49

2.89±0.36 m2.s-1.cycle-1), Fmean (169.6±75.4 vs. 119.0±14.4 N), and Fmax (178.7±73.5 vs. 127.0±14.6 N). Although both groups presented catch-up coordination mode, IdC was lower in G1 (-8.6±1.4 vs. -5.5±3.3%).
Conclusions As both groups have similar anthropometrical characteristics, the higher velocity attained by G1 can be explained by a better technique; G1 showed higher stroke length and SI. These results could be influenced by flexibility, since G1 showed greater range of shoulder flexion. In addition, groups presented similar drag values, despite attained at a higher velocity in G1, suggesting that this group has a better hydrodynamic profile. Moreover, force and force endurance seems to be very important for maximal efforts, as fastest swimmers presented higher Fmean and Fmax, but with similar FI. In opposition to what was expected, faster swimmers showed lower IdC values, probably due to a better application of propulsive forces. Thus, in young female swimmers higher performances are linked to a greater stroke length, stroke index, Fmean, Fmax, shoulder flexion, better hydrodynamic profile, but lower IdC values.
References 1 Toussaint, H., Roos, P., Kolmogorov, S. (2004). The determination of drag in front crawl swimming. J Biomech, 37:1655–
1663.
2 Chollet, D., Charlies, S., Chatard, J. (2000). A new index of coordination for the crawl: Description and usefulness. International Journal of Sports Medicine, 21(1): 54–59.
Acknowledgments This study was supported by the Portuguese Science and Technology Foundation: DFRH-SFRH/BD/87780/2012.
Presenter Ana Silva is a FCT research assistant and Sport Sciences PhD student in Faculty of Sport, University of Porto. She is a collaborator of the Centre of Research, Education, Innovation and Intervention in Sport.
Adjustments to elliptical zone software for acquiring body segment parameters automatically Chuang-Yuan Chiu1, Ross Sanders2 1Institute for Sport, Physical Education and Health Sciences, University of Edinburgh, UK, 2Faculty of Health Sciences, University of Sydney
Introduction Body Segment Parameter (BSP) data comprising segmental mass and centre of mass positions are necessary for inverse dynamics estimation of whole body kinematic and kinetics. This is particularly important in swimming because directly measuring the forces affecting the motion of a swimmer is difficult. Jensen (1978) developed an ‘elliptical zone method’ to model the human body as a series of elliptical cylindroids. The diameters of the elliptical ‘zones’ are obtained by tracing the outlines of body segments from photographic images of the front and side views of a subject. BSP data are then calculated based on the known volumes and density of the elliptical cylindroids. A user-friendly MATLAB program (eZone) for use on a PC (Deffeyes & Sanders, 2005) has been applied in swimming research (McCabe & Sanders, 2012). Currently, the program requires manual digitisation of segmental landmarks and manual tracing of the body segment outlines as input. The purpose of this study was to further develop the approach by enabling automatic digitising and tracing thereby decreasing the manual operations and time required for the analysis process.
Method The ‘chroma key method’ (Chaplin, 1993) was used to detect segment endpoints and whole body silhouettes. Then, the whole body silhouettes were separated to segments by referring to the positions of the segmental endpoints. The boundary of each segmental silhouette was determined by the boundary detection function (Gonzalez et al., 2004). Finally, the elliptical zone method was applied to obtain BSP data. Front and side view images of a shop mannequin were captured by digital cameras and input to both the manual and automatic versions of the software to enable comparison of the methods and validation of the new approach.
Results and conclusion The results show that the new approach can avoid manual digitising work to calculate the body segment parameters automatically. Furthermore, the results were similar to those obtained from the Deffeyes and Sanders (2005) software. The differences were less than 1% in total body volume and less than 5% in segmental volumes except three small segments (neck, hand and foot). In conclusion, the new approach can save operation time.
50 BMS2014—ABSTRACTS HANDBOOK

References Chaplin, D.J. (1993). U.S. Patent No. 5,249,039. Washington, DC: U.S. Patent and Trademark Office.
Deffeyes, J., and Sanders, R.H. (2005). Elliptical zone body segment modeling software: Digitising, modeling and body segment parameter calculation. In Q. Wang (Ed.), Proceedings of XXIII international symposium on biomechanics in sports, 749–752.
Gonzalez, R.C., Woods, R.E. & Eddins, S.L. (2004). Digital Image Processing Using MATLAB, New Jersey, Pearson Prentice Hall, 2004.
Jensen, R.K. (1978). Estimation of the biomechanical properties of three body types using a photogrammetric method. Journal of Biomechanics, 11(8), 349–358.
McCabe, C.B. & Sanders, R.H. (2012). Kinematic differences between front crawl sprint and distance swimmers at a distance pace. Journal of sports sciences, 30(6), 601–608.
Presenter Chuang-Yuan Chiu is currently a PhD student in the Centre for Aquatics Research and Education at the University of Edinburgh, Scotland. He graduated with the BS and MS degrees in mathematics, National Chung Hsing University, Taichung, Taiwan, in 2007 and 2008. His research interests include anthropometry, sports biomechanics, human modeling, pattern recognition and computer vision.
Sculling and unroll-body-action techniques in the ‘thrust’ movement of synchronised swimming based on three-dimensional motion analysis Miwako Homma1, Kanako Nakagawa2, Koji Ito3 1University of Tsukuba, 2Japan Swimming Federation, 3Japan Institute of Sports Sciences
Introduction The thrust movement is an instantaneous technique in which swimmers can reach maximum height above the water surface from feet; it is an important basic movement in the required elements of the technical routines (Figure 1). Synchronised swimmers need to execute a thrust higher and faster. The purpose of this study was to clarify the technical factors for increasing peak height in the thrust movement.
Method The thrust movements both under and above water of nine top-level synchronised swimmers were analysed using 3D DLT method. Peak Height, Height of Shoulder, elbow and wrist, Unroll time, Sculling time, Maximum vertical velocity of the body’s centre of gravity, Wrist velocity, Hip and shoulder angle are analysed as kinematic parameters.
Results Since the peak height index (peak height/body height) and the maximum vertical velocity of the body’s centre of gravity were related significantly, it is necessary to increase the vertical velocity of body’s centre of gravity in order to increase the peak height. Swimmers with a high peak height index were observed a shorter unroll time with a quick extension of the hips. Furthermore, in sculling, the arm’s position was not be lowered from the surface of the water at the arms pull phase. The arm’s position was closer positions to the water surface with a higher vertical velocity of the wrists during the arms turn.
Conclusion It is founded that important techniques to improve peak height in thrust movement, are to unroll with a shorter time, and to not be lowered arms at the beginning of thrust movement and to turn arms rapidly and catch the water closer to the surface.
References Homma M. & Ito K. (2005). Analysis of the heights above the water surface in required elements for technical routines of
synchronized swimming. Journal of methodology of sports, 18(1), 85–100.
Homma, M. & Homma, M. (2006). Support scull techniques of elite synchronized swimmers. Biomechanics and Medicine in Swimming, 6(2), 220–223.
Homma, M., Homma, M. & Kubo, Y. (2007). Differences of flat scull techniques among three horizontal basic positions with different loads above the water surface in synchronized swimming. Journal of training science for exercise and sport, 19(2), 137–148.
BMS2014—ABSTRACTS HANDBOOK 51

Presenter Miwaka Homma is a Professor, Faculty of Health and Sport Sciences, University of Tsukuba with her study in Coaching and Training Methodology in synchronised swimming, Sport Biomechanics in synchronised swimming. She won two Bronze medals (Solo and Duet) at the 1984 LA Olympics. She has been a member of FINA TSSC since 2000, AASF TSSC chair since 2000 and Japan TSSC chair since 2009.
CONCURRENT SESSION 3A—COACHING 3
Comparison of the training load during high-intensity interval-resistance training programmed by different exercise duration Yasuo Sengoku1, Takaaki Tsunokawa1, Keisuke Kobayashi1, Shozo Tsubakimoto1 1University of Tsukuba
Introduction Training for competitive swimmers is characterised by its high volume swimming mileage, compared to other individual sport events. However, abundant scientific evidence has been reported that High Intensity Interval Training (HIIT) could also enhance endurance capacity by the same amount as the traditional high volume training. The HIIT concept had been introduced by Tabata et al. (1996), a training regimen of 20 sec exercise at 170%V
.O2max
intensity with 10 sec interval repeated by 8 sets. Nowadays, many other kinds of training methods have been developed, but the training loads of those training have not been compared, especially in normal swimming pool setting. The purpose of this study was to compare the training load during a new HIIT, which was combined with sprint resisted training (Maglischo, 2003), programmed by different exercise duration.
Method Six well-trained college swimmers participated in this study (male=3, female=3). A HIIT that could be performed in normal swimming pool situation was programmed by combining traditional sprint resisted training. An elastic rubber tube was connected to the starting block and to the swimmer by a swimming belt. Each swimmer swam at maximum effort against the elastic rubber tube. Three trials were investigated consisted by 5sec, 10 sec or 20sec maximal effort swim with 10 sec interval repeated by 5set. Blood lactate accumulation (Bla) and heart rate (HR) were measured after each trail. Video was recorded throughout the trial and stroke frequency (SF) was investigated.
Results Bla after each set was 7.9±2.2, 10.7±2.6 and 12.7±1.5 mmol/l, respectively. HR immediately after each set was 146.6±4.7, 162.9±8.1 and 178.0±7.3 bpm. SF decreased significantly, as the exercise duration increased.
52 BMS2014—ABSTRACTS HANDBOOK

Conclusions Longer exercise stimulus resulted in higher glycolytic and cardiovascular demand, confirming the excellence of the 20 sec trial, so called ‘Tabata Protocol’. However, it was suggested that the 5sec set could also stimulate the anaerobic system sufficiently with high SF, especially for sprinters.
References Maglischo EW. Swimming Fastest. Human Kinetics, 2003.
Tabata I et al. Effects of moderate-intensity endurance and high-intensity intermittent training on anaerobic capacity and V.
O2max. Med Sci Sports Exerc 28: 1327–1330. 1996.
Presenter Yasuo Sengoku, PhD is an assistant Professor at University of Tsukuba and head coach of University of Tsukuba Swimming Team.
The evaluation of efficiency of individual programs for altitude training of elite swimmers upon metabolic and biomechanical criteria Andrei Vorontsov1, Sergey Kolmogorov2,3, Olga Rumyantseva2 1Swedish Swimming Federation, 2Northern (Arctic) Federal University, Russia, 3Russian Swimming Federation, Russia
Introduction The purpose of this study is to assess the effect of individual training programs on the dynamics of swimming velocity at the anaerobic threshold, v0 (AT), and the efficiency of swimming technique during a 21-day altitude training camp (altitude 1960 m, descent to sea level—40–42 days before a major swimming event).
Methodology In order to analyse the volume and intensity of training workloads performed by swimmers during the camp, we used the original software «SwimPlanyzer». The software allows the recording and analysis of individual training programs according to seven training categories: Rec, EN1, EN2, EN3, SP1, SP2, SP3. A combination of physiological (Kolmogorov et al., 2010) and biomechanical methods (Kolmogorov, 2008) was used to assess the dynamics of v0
(AT) in individuals. The subjects were 24 elite swimmers (both males and females).
Results Assessment of training workloads and the dynamics of metabolic and biomechanical criteria in individuals allowed the most efficient training programs to be identified. The significant improvement in v0 (AT) during the altitude training camp was attributed to the increase of metabolic power during swimming and the significant positive dynamics of the propelling efficiency coefficient.
Conclusions The study suggests that an objective judgment concerning the efficiency of individual altitude training programs should be based upon the simultaneous assessment of metabolic and biomechanical criteria. The bespoke altitude training not only increases the power of the oxidative energy system, but also significantly improves the biomechanical efficiency of swimming technique.
References 1 Kolmogorov, S.V., Vorontsov, A.R., Rumyantseva, O.A., Kochergin, A.B. Mechanical and Propulsive Efficiency of Swimmers in
Different Zones of Energy Supply, Biomechanics and Medicine in Swimming XI. Proceedings of the XIth International Symposium for Biomechanics and Medicine in Swimming, Oslo, 16–19 June 2010. Per-Ludvic Kjendlie, Robert Keig Stallman and Jan Cabri (eds). Published by Norwegian School of Sport Science, Oslo, 2010. P. 110–112.
2 Kolmogorov, S.V. (2008). Kinematic and dynamic characteristics of steady-state non-stationary motion of elite swimmers. Russian Journal of Biomechanics, 12(4): 56–70.
Presenter Andrei Vorontsov has a PhD in Sport Studies with more than 100 books, articles and scientific reports published. He started his elite coaching career as coach at the Russian State Central University of Physical Education, continued as ITC coach in Bath, and then became ASA Talent Development Coach. From 2008–2012 he was the Russian National Head Coach and is now the National Swimming Coach in Sweden.
BMS2014—ABSTRACTS HANDBOOK 53
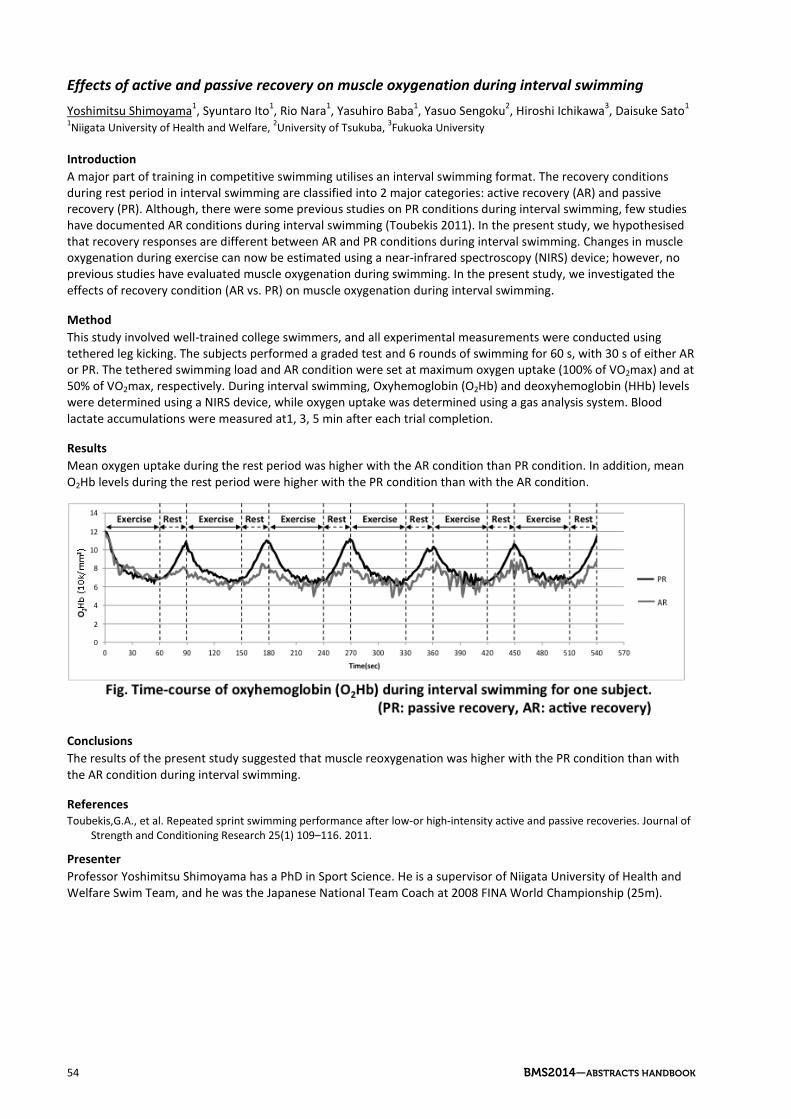
Effects of active and passive recovery on muscle oxygenation during interval swimming Yoshimitsu Shimoyama1, Syuntaro Ito1, Rio Nara1, Yasuhiro Baba1, Yasuo Sengoku2, Hiroshi Ichikawa3, Daisuke Sato1 1Niigata University of Health and Welfare, 2University of Tsukuba, 3Fukuoka University
Introduction A major part of training in competitive swimming utilises an interval swimming format. The recovery conditions during rest period in interval swimming are classified into 2 major categories: active recovery (AR) and passive recovery (PR). Although, there were some previous studies on PR conditions during interval swimming, few studies have documented AR conditions during interval swimming (Toubekis 2011). In the present study, we hypothesised that recovery responses are different between AR and PR conditions during interval swimming. Changes in muscle oxygenation during exercise can now be estimated using a near-infrared spectroscopy (NIRS) device; however, no previous studies have evaluated muscle oxygenation during swimming. In the present study, we investigated the effects of recovery condition (AR vs. PR) on muscle oxygenation during interval swimming.
Method This study involved well-trained college swimmers, and all experimental measurements were conducted using tethered leg kicking. The subjects performed a graded test and 6 rounds of swimming for 60 s, with 30 s of either AR or PR. The tethered swimming load and AR condition were set at maximum oxygen uptake (100% of VO2max) and at 50% of VO2max, respectively. During interval swimming, Oxyhemoglobin (O2Hb) and deoxyhemoglobin (HHb) levels were determined using a NIRS device, while oxygen uptake was determined using a gas analysis system. Blood lactate accumulations were measured at1, 3, 5 min after each trial completion.
Results Mean oxygen uptake during the rest period was higher with the AR condition than PR condition. In addition, mean O2Hb levels during the rest period were higher with the PR condition than with the AR condition.
Conclusions The results of the present study suggested that muscle reoxygenation was higher with the PR condition than with the AR condition during interval swimming.
References Toubekis,G.A., et al. Repeated sprint swimming performance after low-or high-intensity active and passive recoveries. Journal of
Strength and Conditioning Research 25(1) 109–116. 2011.
Presenter Professor Yoshimitsu Shimoyama has a PhD in Sport Science. He is a supervisor of Niigata University of Health and Welfare Swim Team, and he was the Japanese National Team Coach at 2008 FINA World Championship (25m).
54 BMS2014—ABSTRACTS HANDBOOK

CONCURRENT SESSION 3B—PHYSIOLOGY 3
Relationship between the oxygen uptake efficiency plateau and the individual anaerobic threshold in endurance swimmers Jailton Pelarigo1,2,3, Athanasios Dalamitros5, Ana Sousa2, Ricardo Fernandes2,3, Camila Coelho Greco4, João Paulo Vilas-Boas2,3 1The Capes Foundation, Ministry of Education of Brazil, Brazil, 2Faculty of Sport/CIFI2D, University of Porto, Portugal, 3LABIOMEP, University of Porto, Portugal, 4Sao Paulo State University, Brazil, 5Aristotle University of Thessaloniki, Greece
Introduction Distance swimming performance is influenced by the maximal oxygen uptake, the anaerobic threshold (AnT) and swimming economy. The oxygen uptake efficiency slope (OUES) has been proposed as a valid index for the objective estimation of cardiopulmonary function during submaximal laboratory testing (Baba et al, 1996). OUES is strongly correlated with VO2max and has been observed to reach its highest and levelling off values (plateau) (OUEP) near the AnT in patients with cardiorespiratory disease and normal subjects (Sun et al, 2012). However, OUES and OUEP have never been studied in highly trained subjects, particularly swimmers. The purpose of this study was to compare the velocity and oxygen uptake efficiency (OUE) values obtained during OUEP and lactate threshold (LT) in well trained swimmers.
Methods Eight female endurance swimmers (17.5 ± 1.9 yrs, 1.71 ± 0.06 m, 62.1 ± 6.2 kg) performed an intermittent incremental swimming step test (7 x 200 m, with increments of 0.05 m∙sec-1 and 30 s intervals). OUEP was calculated by the ratio of oxygen uptake and minute ventilation. The LT was found by velocity vs. lactate curve modelling method. ANOVA repeated measures and regression analysis were performed to test differences between methods (p<0.05).
Results Similar velocity (1.20 ± 0.05 vs. 1.22 ± 0.05 m.s-1) and OUE values (43.9 ± 5.83 vs. 42.9 ± 5.8 mL VO2.L VE) were obtained during OUEP and LT methods, respectively. Regarding the Passing & Bablok regression analysis and the Pearson’s coefficient of determination, velocity (Intercept A= -0.096, Slope B= 1.071, R2= 0.638, p<0.017) and OUE values (Intercept A= -5.360, Slope B= 1.154, R2= 0.875, p<0.001) obtained both at the OUEP and at the LT were highly correlated.
Conclusion These findings suggest that OUEP has a practical application in swimming as a non-invasive submaximal index closely related to the LT in well trained female endurance swimmers.
Acknowledgments This research was supported by grants from the Capes Foundation, Ministry of Education of Brazil (BEX: 0536/10-5).
References Baba R et al (1996). J Am Coll Cardiol 28:1567–1572.
Sun X et al (2012). Eur J Appl Physiol, 112(3):919–28.
Presenter Dr Camila Coelho Greco completed her PhD in evaluation of aerobic fitness and performance during swimming, and has been studying the physiological responses and indexes for the evaluation of aerobic fitness during swimming, running and cycling.
BMS2014—ABSTRACTS HANDBOOK 55

VO2 assessed by backward extrapolation in 200, 400, 800 and 1500 m front crawl in youth swimmers Rodrigo Zacca1,2, Bruno Costa Teixeira1, Andre Luiz Lopes1, Cristiano Cardoso de Matos1, Ligia Engelmann1, Flávio Antônio de Souza Castro1 1Universidade Federal do Rio Grande do Sul, UFRGS, Brazil, 2CAPES Foundation, Ministry of Education of Brazil
Introduction Direct methods are accurate and precise for maximal oxygen consumption (VO2max) assessment, but some interferences in swimming biomechanics were reported, i.e., ecology of swimming in some swimming strokes seems to be impaired. To minimise this problem, a less accurate alternative has been used for some years: the backward extrapolation (BE) of the oxygen consumption (VO2) recovery curve. Thus, this study aimed to compare VO2 responses obtained by BE technique at distances of 200, 400, 800 and 1500 m.
Method Twelve (eight males and four females) youth swimmers (15.6 ± 0.9 years old, 63.0 ± 7.2 kg body mass, 1.75 ± 0.08 m height, and 1.80 ± 0.10 m arm span) volunteered for this study. The protocol involved the performance in a randomised order of 200-, 400-, 800-, and 1500-m all-out efforts (24h interval). VO2 was measured using the portable gas Analyzer VO2000®. A linear regression curve between the time (20 s immediately after the 10 s of dead space) and consumption values was plotted in order to predict VO2 when the time was zero (BE). Capillary blood samples (25 µl) for blood lactate concentration ([La]) analysis were collected from the fingertip of the hand (1, 3, 5 and 7 min after each all-out effort, [La]peak). Heart rate (HR) and Perceived exertion (PE) values were also collected immediately after each all-out effort. VO2max was considered to be reached according to secondary physiological criteria (Howley et al. 1995): a) [La] level (≥ 8mmol∙l-1); b) High respiratory exchange ratio (r ≥ 1.0); c) High HR (≥ 90% of [220-age]; and d) High value of PE (visually controlled).
Results
Table 1 Mean and standard deviations values of time and VO2 from 200–1500 m maximal efforts
200 m 400 m 800 m 1500 m
Time (s) 132.1 ± 8.4 280.2 ± 17.6 578.9 ± 36.0 1126.0 ± 67.7
VO2 (ml kg-1 min-1) 47.4 ± 8.4 63.5 ± 8.7* 51.0 ± 7.8 48.9 ± 4.8
* p ≤ 0.001 between VO2 from 400 m and all other distances
VO2 in the 400 m showed high respiratory exchange ratio (r ≥ 1.0). [La]peak in 200, 400, 800 and 1500 m were 11.9 ± 1.7, 10.8 ± 2.0, 9.6 ± 1.6 and 9.1 ± 1.6 respectively. HR in 200, 400, 800 and 1500 m were 176.5 ± 10.8, 185.2 ± 13.6 bpm (94.8 ± 5.7 %HRmax), 183.3 ± 18.6 and 185.3 ± 9.1 bpm respectively. PE values in 200, 400, 800 and 1500 m were 17.9 ± 1.6, 18.1 ± 1.5, 17.8 ± 1.9 and 18.2 ± 1.6 points respectively.
Conclusions VO2 in the 400 m was greater than all other distances and there was enough time and intensity to the swimmers achieves their VO2max at the end of 400 m maximal effort. BE technique confirmed to be attractive and capable to identifying similar VO2 values of those obtained during swimming with direct assessment methods.
References 1. Howley ET, Basseett DR, Welch HG. (1995) Criteria for maximal oxygen uptake: review and commentary. Med Sci Sports
Exerc 27: 1292–1301.
Presenter Flávio Antônio de Souza Castro is from Federal University of Rio Grande do Sul, Brazil, where he teaches swimming and leads the Research Group in Aquatics Sports.
56 BMS2014—ABSTRACTS HANDBOOK

CONCURRENT SESSION 3C—BIOMECHANICS 3
Dubious use or misuse of scientific information in commerce and policy making e.g. the swimsuit case Jan Pieter Clarys1 1Vrije Universiteit Brussel, Belgium
Introduction Regardless the known active drag (Da) front crawl differences and similarities between the Marine Test Station (Brussels) data, the Swimming Flume Stockholm findings and the Measuring Active Drag (MAD) Amsterdam system values (Clarys 1985, Holmer and Haglund 1978, Toussaint et al 2004), these approaches have some issues in common. They confirm the difference between passive Drag (Dp) of the gliding part and Da of the movement part without surpassing the boundaries of the fundamental hydrodynamic law of similitude for both propulsion and resistance as a function of speed, including Laminar and turbulent flow.
Purpose and methods Project the swimming resistance data of the last decennia of previous century upon the predicted outcome interpretations of the high-technology swimwear manufacturers (2000–2010)
Results and discussion The High-Technology swimwear fabrics are composed of scientifically advanced materials e.g. spandex and nylon composite material, that promote features such as: improvement of the swimmer’s glide, mimicking marine-animal skin to reduce drag e.g. functional and wavemaking the suit is water-repellent, muscle compressing, enhancing the swimmers’ posture and blood circulation.
Projecting these justifications and interpretations against the non dimensional form relation, the hydrodynamic drag indexes and the body constitutional changes between Da and Dp specifically underwater, one rapidly can confirm that the majority of these arguments are subject to a violation of basic hydrodynamic reasoning.
The reality is the lack of the manufacturer true values and the missing reliability studies of their methodology leading to accurate values.
The impressive quantity of records using the high-tech swimwear is a sufficient argument to accept all quality issues claimed by the manufacturer. The amount of records and the controversial interpretation has resulted in a political FINA decision to ban the high-tech swimsuits bringing science into the domain of morality hereby creating another Olympic controversy. Why ban high-tech swimwear which facilitates movement while in cycling the aerodynamic outfit and bike design improve performance at a level of seconds and even allow for ‘minutes’ over distance. Nor the high-tech swimwear, nor the aerodynamics hardware in cycling do overrule the individuals training and performance effort. Dubious science and discriminating morality?
References 1 Clarys J.P., Hydrodynamics and electromyography: Ergonomic aspects in aquatics. J. Applied Ergonomics (11–24) 1985.
2 Holmer I. and Haglund S., The Swimming Flume: Experience and applications. Int. Series Sports Sciences. In: Eriksson B. and Furbery B. (eds) Swimming Medicine IV; University Park Press, Baltimore (379–385) 1978.
3 Toussaint H.M., Roos P.E., Kolmogorov S., The determination of drag in front crawl swimming. J. of Biomechanics 37 (1655–1663) 2004.
Presenter Professor Jan Pieter Clarys began his career as a researcher for the Belgian National fund for Scientific Research in 1969. His most recent appoints were head of the anatomy department (190-2012) and dean of the Faculty of Physical Education and Physiotherapy (1996–2004) at the Vrijr Univeriteit Brusse. From October 2004 until 2012 he was pro-dean. Jan Pieter became Emeritus Professor in October 2012 but is still involved in research programs. He is part president of the World Commission of Sports Sciences and has presented more than 200 keynotes or invited lectures at international conferences. He’s been directly involved in the organisation of 26 sports science conferences around the world. He’s an editorial board member of The Journal of Electomyography and Kinesiology; The Journal of Sports Medicine and Physical Fitness and the International Journal of Training and Coaching.
BMS2014—ABSTRACTS HANDBOOK 57

The effect of full body swimsuits on swimmers’ morphology and glide performance Georgios Machtsiras1,2, Prashant Valluri1, Ross Sanders3 1The University of Edinburgh, UK, 2Edinburgh Napier University, UK, 3The University of Sydney
Introduction It has been unclear whether full body (FB) swimsuits improve performance by decreasing frictional (Dfr) or pressure drag (Dp). Recent findings indicate that the benefit of wearing FB suits is not linked to Dfr (Oeffner and Lauder, 2012) while the effect of Dp on performance has not been studied. Given that pressure drag is influenced by body morphology, the purpose of the current study was to assess the effect of FB swimsuits on swimmers’ morphology and gliding performance.
Method A male and a female swimmer of international level were scanned with the use of a 3D body scanner while standing in the ‘streamline position’ and wearing either a normal (N) or a FB swimsuit. To assess the effect of swimsuit on swimmers’ morphology, the cross-sectional area (CSA) in the axial plane was computed at different heights from the 3D models and the frontal surface area, the maximum CSA at the level of the pelvis and the thorax as well as the minimum CSA at the level of the lower back were reported. The glide performance was assessed from the kinematic data collected when gliding after a controlled push off the wall, analysed with the use of the Hydro-Kinematic method and reported as the Glide Factor.
Results The frontal surface area was reduced for both participants (1.95% for the male swimmers and 0.92% for the female swimmer) when wearing the FB swimsuit while the CSA at the level of the pelvis, thorax and low back was altered for the male participant (1.95%, 3.67% and 8.21%). The glide efficiency increased significantly only for the male swimmer (16.7% for male and 0.2% for the female swimmer).
Conclusions Considering that only the male swimmer’s body morphology was altered due to the compression of the FB suit, indicating that the swimmer’s body has been flattened, it is suggested that the improved gliding performance is linked to the localised compression effects of the FB suit.
References Oeffner, J. & Lauder, G.V. (2012). The hydrodynamic function of shark skin and two biomimetic applications. The Journal of
Experimental Biology, 215(5), 785–795.
Presenter Dr Georgios Machtsiras is a lecturer at the Edinburgh Napier University and a research assistant at the University of Edinburgh. Georgios’ research interests in swimming biomechanics include: underwater 3D motion capture, 3D scanning, drag/propulsion assessment, Computational Fluid Dynamics and aquatic rehabilitation.
Comparisons of four competitive jammers by biomechanics and physiological parameters in expert male crawl swimmers Didier Chollet1, Frederic Puel1, Daniel Marinho2, Pierre Marie Lepretre3, Benoit Louvet1, John Komar1, Florence Chavallard1, Julien Vantorre1, Ludovic Seifert1 1Rouen University, France, 2Beira Interior, Portugal, 3Amiens University, France
Introduction The evolution of rules about competitive swimsuits require updating the scientific data: for example, the biomechanics or physiological consequences of compressive character are not homogeneous (Benjanuvatra et al, 2002, Chollet et al, 2010, Marinho et al 2011, Tomikawa et al, 2009). The aim of this study was to compare four different competitive jammers relative to the personal usual training swimsuit in well-trained swimmers.
Method Twenty male expert crawl swimmers participated in this study.
Experimentation 1: Ten participants (G1: 603±75 FINA points, 19.5±2.7 years, 183.6±5.1 cm and 71.2±7.5 kg) performed five randomised exercise sessions (jammer JA, JB, JC, JD and a control SS). Each session involved all-out 200-m crawl and 50-m leg trials after a standardised warm-up. During each session, measures of speed, arm
58 BMS2014—ABSTRACTS HANDBOOK
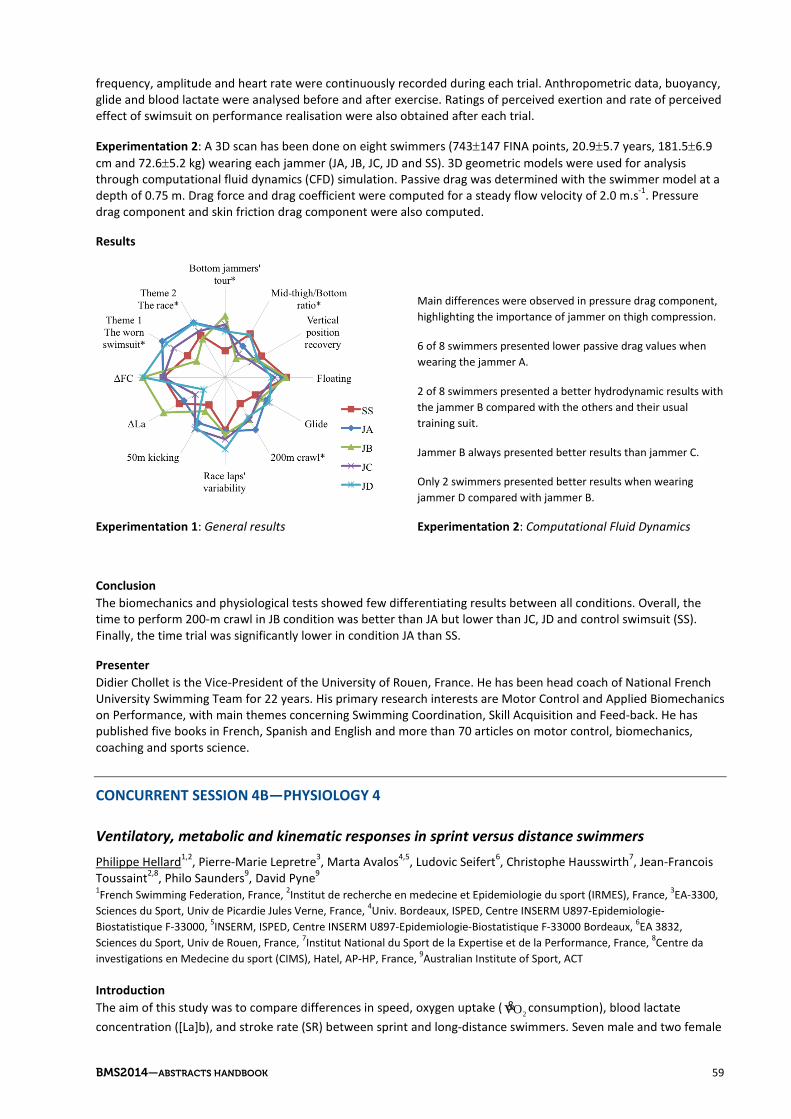
frequency, amplitude and heart rate were continuously recorded during each trial. Anthropometric data, buoyancy, glide and blood lactate were analysed before and after exercise. Ratings of perceived exertion and rate of perceived effect of swimsuit on performance realisation were also obtained after each trial.
Experimentation 2: A 3D scan has been done on eight swimmers (743±147 FINA points, 20.9±5.7 years, 181.5±6.9 cm and 72.6±5.2 kg) wearing each jammer (JA, JB, JC, JD and SS). 3D geometric models were used for analysis through computational fluid dynamics (CFD) simulation. Passive drag was determined with the swimmer model at a depth of 0.75 m. Drag force and drag coefficient were computed for a steady flow velocity of 2.0 m.s-1. Pressure drag component and skin friction drag component were also computed.
Results
Experimentation 1: General results
Main differences were observed in pressure drag component, highlighting the importance of jammer on thigh compression.
6 of 8 swimmers presented lower passive drag values when wearing the jammer A.
2 of 8 swimmers presented a better hydrodynamic results with the jammer B compared with the others and their usual training suit.
Jammer B always presented better results than jammer C.
Only 2 swimmers presented better results when wearing jammer D compared with jammer B.
Experimentation 2: Computational Fluid Dynamics
Conclusion The biomechanics and physiological tests showed few differentiating results between all conditions. Overall, the time to perform 200-m crawl in JB condition was better than JA but lower than JC, JD and control swimsuit (SS). Finally, the time trial was significantly lower in condition JA than SS.
Presenter Didier Chollet is the Vice-President of the University of Rouen, France. He has been head coach of National French University Swimming Team for 22 years. His primary research interests are Motor Control and Applied Biomechanics on Performance, with main themes concerning Swimming Coordination, Skill Acquisition and Feed-back. He has published five books in French, Spanish and English and more than 70 articles on motor control, biomechanics, coaching and sports science.
CONCURRENT SESSION 4B—PHYSIOLOGY 4
Ventilatory, metabolic and kinematic responses in sprint versus distance swimmers Philippe Hellard1,2, Pierre-Marie Lepretre3, Marta Avalos4,5, Ludovic Seifert6, Christophe Hausswirth7, Jean-Francois Toussaint2,8, Philo Saunders9, David Pyne9 1French Swimming Federation, France, 2Institut de recherche en medecine et Epidemiologie du sport (IRMES), France, 3EA-3300, Sciences du Sport, Univ de Picardie Jules Verne, France, 4Univ. Bordeaux, ISPED, Centre INSERM U897-Epidemiologie-Biostatistique F-33000, 5INSERM, ISPED, Centre INSERM U897-Epidemiologie-Biostatistique F-33000 Bordeaux, 6EA 3832, Sciences du Sport, Univ de Rouen, France, 7Institut National du Sport de la Expertise et de la Performance, France, 8Centre da investigations en Medecine du sport (CIMS), Hatel, AP-HP, France, 9Australian Institute of Sport, ACT
Introduction The aim of this study was to compare differences in speed, oxygen uptake ( 2OV& consumption), blood lactate concentration ([La]b), and stroke rate (SR) between sprint and long-distance swimmers. Seven male and two female
BMS2014—ABSTRACTS HANDBOOK 59

elite long-distance swimmers (LD) performance level=89% world record and versus seven male and two female sprint swimmers (S) performance level=88%World record were recruited.
Method Ventilatory, metabolic and kinematic parameters were obtained during a 6 x 300-m incremental swimming exercise to exhaustion. 2OV& kinetics were compared in both groups using a 500-m interval training set (IT500) swum at the lactate threshold (LT). The VO2 data collected during IT500 was modelled using a two-term exponential model VO2 (t) = A0 + A1 × [1 – e – (t – TD1)/τ1)]*u1 + A2 × [1- e -(t – TD2)/τ2. Bootstrapping was used to calculate the coefficient of variation (CV) of the parameter estimates, a measure of the relative variability.
Results Speed at 2OV& max was faster in long distance (1.47 ± 0.06 m.s-1) than in sprint swimmers (1.33 ± 0.08 m.s-1), as was speed at LT (long-distance, 1.42 ± 0.07 m.s-1 vs. sprint 1.20 ± 0.06 m.s-1, (P < 0.01). At LT, speed was also faster for long-distance swimmers (2.9 ± 1.3 mmol.L-1; v LT = 1.42 ± 0.07 m•s-1, equivalent to 96 ± 3% of v 2OV& max) than in sprint swimmers (4.1 ± 1.3 mmol.L-1; v LT = 1.20 ± 0.06 m•s-1, 91 ± 1% of v 2OV& max,(P < 0.01). At LT, the long-distance swimmers performed at higher stroke rate (36.4 ± 4.2 vs. 30.8 ± 0.9 s.min-1) and consumed a larger
2OV& max fraction (58 ± 9 vs. 45 ± 9% of 2OV& max, P < 0.01). The delay for the second exponential term (TD2) which is the slow phase of oxygen uptake adjustment was substantially greater in the long- swimmers (155 vs. 82 sec). Finally, during IT500, a significant correlation was evident between the increase in stroke rate and increase in
2OV& consumption (r=0.78, P< 0.05).
Conclusion Long-distance swimmers are typically 10–15% faster at the lactate threshold and oxygen uptake. In contrast the blood lactate concentration was 40% higher but the stroke rate 15% lower at the lactate threshold in sprint swimmers.
Presenter Dr Philippe Hellard, PhD, Supervisor of Research in the French Swimming Federation since the Research department’s foundation in 2000. His research interests include training and overtraining analysis, biomechanics and physiology of swimming.
Observation of the soft palate while breathing in a simulated swimming Hideki Hara1, Hanaoka Youichi2, Tonogi Morio3, Nakajima Tsuneya4 1Kokugakuin University, 2Tokyo Dental College, 3Nihon University School of Dentistry, 4Tokyo Dental College
Introduction How to control breathing is one of the most difficult things for beginners of swimming. Skilled swimmers can control exhaling routes from the nose to the mouth. This route change may be carried out by soft palate. Controlling the soft palate is difficult because it is controlled by the autonomic nerves. The purpose of this research is to try to find the intentional way of the soft palate control while swimming. This experiment was approved by the university ethic committee and we obtain the informed consents from the subjects.
Method We used the endoscope for observing the motion of the soft palate while simulating breathing of swimming inserted from the nasal cavity and recorded. At the same time, we measured the oral cavity pressure changes. The five subjects who voluntarily participated in this study were healthy university students. Each subject sat on a chair in the laboratory and exhaled in five patterns. 1) Closing the mouth with no oral pressure, then exhaling from the mouth saying ‘Pah’. 2) Closing the mouth with high oral pressure, then exhaling saying ‘Pah’. 3) Exhaling from the nose with ‘Mnn’, then exhaling from the mouth saying ‘Pah’. 4) Exhaling from the nose with ‘Mnn’, then exhaling from the mouth saying ‘Fah’. 5) Exhaling from the nose with no words, then exhaling from the mouth saying ‘Pah’. The equipment had been tested and verified in earlier work 1, 2). We measured oral cavity pressure while simulating motion using pressure transducers (SPC-464; Miller Instruments) simultaneously.
Results The highest oral pressure was Pattern 2 (Figure 1), at the same time, the soft palate moved to the highest position intentionally (Picture).
60 BMS2014—ABSTRACTS HANDBOOK

Conclusions and reference In order to change exhaling route from the nose to the mouse, produce a sound ‘Mnn’ and ‘Pah’ is best way to control the soft palate spontaneously.
References 1 Hara H., et al. (1998). The development of measuring nasal pressure in water, Biomechanics and Medicine in Swimming VIII,
135–139
2 Hara H, et al. (2006) The function of nasal pressure for breathing in the breaststroke, Biomechanics and Medicine in Swimming, No.X, 137–139
Presenter Dr Hideki Hara graduated from the Tokyo Gakugei University Graduate School of Education. Then, he completed his PhD in Physiology at Showa University School of Medicine in 1999. He has been working at Kokugakuin University, the Faculty of Human Development as a professor in the Health and Physical Exercise Department. He continues to study human performance in aquatic activities (swimming, diving and dolphin assisted activities) and also carries out research in the field of growth and development in human being. He is a councillor of the Japan Society of Exercise and Sports Physiology, a councillor of the Japanese Society of Physical Fitness and Sports Medicine, and a member of the board of directors of the Society for Studies of Physical Arts.
Does back crawl require greater energy expenditure than front crawl at equivalent sub-anaerobic threshold speed? Tomohiro Gonjo1, Carla McCabe1, Simon Coleman1, João Paulo Vilas-Boas2, Ricardo Fernandes2, Ross Sanders1,3 1The University of Edinburgh, UK, 2University of Porto, Portugal, 3The University of Sydney
Introduction Several differences in energy expenditure and stroke parameters between front crawl (FC) and back crawl (BC) have been reported (Barbosa et al., 2006, Hellard et al., 2008). However, there have been few studies in which intra-individual comparisons between those two strokes were conducted. Thus, the purpose of this study was to assess the intra-individual differences in energy expenditure between FC and BC at equivalent speed below anaerobic threshold.
Method Seven Portuguese male swimmers volunteered their participation. Since the accuracy of measurement of anaerobic energy expenditure remains uncertain (Thevelein et al., 1984), the testing was conducted at aerobic intensity. Swimmers completed two 300m trials (one for FC, another for BC) at 95% of BC anaerobic threshold speed, with at least 24 hours rest between each trail. Swimmers’ respiratory gas was collected through a low-resistance snorkel and valve system which was connected to a telemetric gas exchange system. The testing speed was controlled by a visual light pacer. Stroke frequencies (SF: cycle/sec) were calculated from the video images recorded at 50 frames per second by a digital video camera. Stroke length (SL: m/cycle) of the swimmer was calculated by dividing speed by SF. Paired t-tests were used to evaluate the intra-individual differences between FC and BC.
BMS2014—ABSTRACTS HANDBOOK 61

Results There were significant differences (p<.01) in energy expenditure (E:mlO2/kg/min) and energy expenditure per stroke (Estroke:mlO2/kg/cycle) between FC (E: 38.91±3.13, Estroke: 1.51±0.17) and BC (E: 48.20±5.31, Estroke: 1.86±0.19). There was no significant differences in SF and SL between FC (SF: 0.43±0.04, SL: 2.53±0.17) and BC (SF: 0.43±0.04, SL: 2.53±0.22).
Conclusion At aerobic speed, there is no difference in stroke parameters between FC and BC. However FC is more economical than BC because the energy required for completing one stroke cycle in BC is greater than FC.
References Barbosa, T. et al. (2006). International Journal of Sports Medicine, 27(11), 894–899.
Hellard, P. et al. (2008). Journal of Sports Sciences, 26(1), 35–46.
Thevelein, X. et al. (1984). Current Topics in Sports Medicine, 668–676.
Presenter Tomohiro Gonjo is a PhD student currently studying in Centre for Aquatics Research and Education, The University of Edinburgh.
Lactate peak in youth swimmers: quantity and time interval for measurement after 50–1500 m maximal efforts in front crawl Rodrigo Zacca1,2, Andre Luiz Lopes1, Bruno Costa Teixeira1, Luana Maciel da Silva1, Cristiano Cardoso de Matos1, Flávio Antônio de Souza Castro1 1Universidade Federal do Rio Grande do Sul, UFRGS, Brasil, 2CAPES Foundation, Ministry of Education of Brasil
Introduction The aim of this study was to compare lactate peak and Area under the curve (AUC) values at 50-, 100-, 200-, 400-, 800- and 1500-m maximal efforts in high level swimmers performing front crawl.
Method 12 (eight males and four females) youth swimmers (15.6 ± 0.9 years old, 63.0 ± 7.2 kg body mass, 1.75± 0.08 m height, and 1.81 ± 0.10 m arm span) volunteered to participate in this study. The protocol involved the performance in a randomised order of 200, 400, 800, and 1500 m all-out effort (24h interval). Capillary blood samples (25 µl) for blood lactate concentration ([La]) analysis were collected after 10 min rest (Rest), after warm-up (Pre) and during the recovery period (1, 3, 5 and 7 min, [La]peak) after each event (50–1500 m) using Accutrend Plus (Roche®). AUC of [La] was calculated by the trapezoidal mathematical method, i.e., the sum of trapezoid areas AUC of [La] was expressed as percentage difference between each distance, with 50 being 100%.
Results Table 1: Time of each event, [LA] values (mmol∙l-1) at rest and pre, the comparison between different time assessment during recovery (1, 3, 5 and 7 min; (*p < 0.05) with the number of swimmers who reached [La]peak recovery assessment, the comparison between [La]peak (mean and SD) of 50, 100, 200, 400, 800 and 1500 m ( p < 0.05; , + and & p < 0.01) and the comparison of AUC of [LA] over time (expressed as percentage difference between each distance, with 50 being 100%).
62 BMS2014—ABSTRACTS HANDBOOK

Rest Pre
Time after each maximal effort
Peak AUC 1 min 3 min 5 min 7 min
50 m 27.1 ± 2.0 s
3.88 ± 0.71
3.31 ± 0.44
10.23 ±1.32
10.78 ±1.75
10.76 ±0,67
- 11.03 ±1.46
100%
nº of swimmers who reached [La]peak 5/12 7/12 - -
100 m 59.8 ± 4.1 s
3.18 ± 0.82
3.01 ± 1.10
11.7 4±1.67
11.85 ±2.19*
9.66 ±2.93*
- 12.38 ±1.82+
+10.5%
nº of swimmers who reached [La]peak 3/12 9/12 - -
200 m 132.1 ± 8.4 s
3.19 ± 0.76
2.85 ± 0.61
12.12 ±1.74*
10.41 ±2.04*
- - 11.98 ±1.67&
+7.5%
nº of swimmers who reached [La]peak 12/12 - - -
400 m 280.2 ± 17.6 s
3.58 ± 0.48
3.22 ± 0.95
10.47 ±1.83
10.04 ±2.91
9.67 ±2.21
5.90 10.78 ±2.03
- 3.1%
nº of swimmers who reached [La]peak 6/12 5/12 1/12 -
800 m 578.9 ± 36.0 s
3.49 ± 0.67
2.63 ± 0.41
9.18 ±1.34
8.92 ±2.02
9.00 ±1.68
8.10 9.64 ±1.59
-11.9%
nº of swimmers who reached [La]peak 7/12 5/12 - -
1500 m 1126.8 ± 67.7 s
3.75 ± 0.99
3.29 ± 0.68
8.78 ±1.79
8.15 ±1.69
5.80 ±0.87
- 9.08 ±1.57+&
-17.9%
nº of swimmers who reached [La]peak 9/12 3/12 - -
Conclusions Area under the curve (AUC) of [La] may be applied in swimming. Factorial ANOVA found no difference between [La]peak of 100 and 200 m, but AUC showed difference of + 3% between 100 and 200m.
References Avlonitou E. (1996) Maximal lactate values following competitive performance varying according to age, sex and swimming style.
J Sports Med Phys Fitness. Mar; 36(1):24–30.
Presenter Flávio Antônio de Souza Castro is from Federal University of Rio Grande do Sul, Brazil, where he teaches swimming and leads the Research Group in Aquatics Sports.
CONCURRENT SESSION 4C—BIOMECHANICS 4
Buoyant (leg-sinking) torque in able-bodied swimmers and swimmers with impaired leg function Carl Payton1, Anna Reid1 1Department of Exercise and Sport Science, Manchester Metropolitan University, UK
Introduction A swimmer’s ability to float statically in a horizontal position is determined largely by the turning effect of their body weight and buoyancy forces. This is termed the buoyant torque. Due to sex differences in body mass distribution, males generally experience a greater buoyant torque than females, resulting in a greater tendency for their legs to sink (e.g. McLean and Hinrichs, 1998). Para-swimmers who are unable to kick, due to impaired leg function, may be disadvantaged over those competitors who can kick. Not only are they unable to use a leg-kick to help maintain horizontal alignment, but their body mass distribution, due to atrophied lower extremities, may differ from that of non-impaired swimmers and so, consequently, may the buoyant (leg-sinking) torque they experience. This study’s aim was to establish whether the buoyant torque differs between swimmers with impaired leg function (ILF) and able bodied (AB) swimmers.
Method Six ILF swimmers and fourteen AB swimmers each lay on a horizontal rigid board supported at one end by a pivot and at the other end by a load cell. Forces were recorded above and then below water. The principle of moments
BMS2014—ABSTRACTS HANDBOOK 63

was used to locate the centres of mass (CoM) and buoyancy (CoB) with: 1) arms by side, 2) one arm above head, and 3) both arms above head. Buoyancy force, obtained from underwater weighing, was multiplied by the CoM-CoB distance to get the buoyant torque.
Results Buoyant Torque (N·m)
Arms by side One arm above head Both arms above head
Group (inhaled/exhaled) (inhaled/exhaled) (inhaled/exhaled)
ILF Males (n=2) 19.3 ± 6.1 / 9.5 ± 0.7 15.5 ± 2.7 / 7.8 ± 0.2 13.1 ± 3.8 / 5.0 ± 0.2
AB Males (n=7) 20.9 ± 11.6 / 11.1 ± 7.3 14.5 ± 8.6 / 10.3 ± 4.3 12.5 ± 9.2 / 9.2 ± 7.2
ILF Females (n=4) 6.5 ± 2.0 / 4.0 ± 2.4 6.0 ± 2.3 / 4.9 ± 3.6 4.3 ± 1.4 / 3.6 ± 1.8
AB Females (n=7) 11.2 ± 3.3 / 6.2 ± 2.5 10.0 ± 3.1 / 7.3 ± 2.9 7.1 ± 3.9 / 5.5 ± 2.6
The CoM and CoB were located closer to the head in the ILF swimmers, when compared to the AB swimmers. The males experienced higher buoyant torques than the females, under all conditions. ILF males had similar buoyant torques to AB males under most conditions, whereas the ILF females generally had lower buoyant torques than the AB females.
Conclusion Despite having a different body mass distribution, swimmers with impaired leg function do not experience a greater buoyant (leg-sinking) torque than able-bodied swimmers of the same sex.
References McLean, S.P. and Hinrichs, R.N. (1998). Sex differences in the centre of buoyancy location of competitive swimmers. Journal of
Sports Sciences, 16, 373–383.
Presenter Dr Carl Payton is a Senior Enterprise Fellow in Biomechanics at Manchester Metropolitan University in the UK. His current research interests are in the biomechanics of elite swimmers with a disability. Carl has led the delivery of biomechanics support services to the Great Britain Para-swimming team since 2000 and he is also a member of the IPC Swimming research group who are focusing on the Para-swimming functional classification system.
Optimising individual stance position in the swim start on the OSB11 Armin Kibele1, Sebastian Fischer1, Kristina Biel1 1Institute for Sports and Sport Science, University of Kassel
Introduction Since 2010, the OSB11 starting block model has been used for national and international championships. It provides clear advantages in swim start performance as compared to the previously used OSB9 device (e.g. Honda et al., 2010). However, there is scarce knowledge on the optimal stance position for swimmers with respect to their individual body length or leg preference (Slawson et al., 2011). Therefore, the purpose of this study was to evaluate systematic variations of the stance parameters of elite swimmers in regard to their swim start performance. Variations of the preferred stance were examined regarding the front leg (left vs. right), the centre of mass (CM) height (low vs. high), the stance width (narrow vs. wide), and a rear vs. a front weighted stance (estimated by the horizontal distance of the hip joint the front edge of the block). The magnitude of the variations was expressed relative to the individual leg length.
Method Fourteen male and five female elite swimmers participated in the study. Changes in the CM height, the stance width, and the horizontal hip joint distance were related to the standard deviations found in a preceding pilot study with six male and seven female elite swimmers. To determine the block settings for each participant, one standard deviation normalised to leg length from the pilot study was subtracted from or added to the preferred stance position for the low vs. high CM height, the narrow vs. wide stance width, and the rear vs. front weighted stance. An overlay reference grid was used for the video display to control for the various stance position settings. For all stance alternatives, including the preferred stance position, swim start performance (time between the starting signal and the head-passage at 5m) the mean value of three repetitions was statistically analysed.
64 BMS2014—ABSTRACTS HANDBOOK

Results Only 4 of the 8 possible stance configurations for each leg proved to be mechanically feasible for the swimmers. These configurations consisted of a wide stance with CM positions: high-back, low-front, and low-back and a narrow stance with CM position high-front. Thirteen of the 19 subjects showed swim start improvements for the stance alternatives larger than or equal to the preferred stance position. For half of the subjects, at least one stance alternative provided a better swim start time than the preferred stance. The mean improvements were as large as 0,06s. The largest individual improvement was 0,14s.
Conclusion The study shows that, for a random sample of elite swimmers, preferred stance could be improved substantially through a variation of the stance parameters. A general trend for an optimal stance position was not detected. However, from the number of improvements observed in the different stance alternatives, it appears that a high CM position with a narrow stance width and a weighted front-foot provides substantial opportunities for swim start improvements.
References Honda KE, Sinclair PJ, Mason BR & Pease DL (2010). A biomechanical comparison of elite swimmers start performance using the
traditional track start and the new kick start. In PL Kjendle, RK Stallman & J Cabri (Eds.), Biom Med Swimming XI. Proc XI Int Symposium Biom Med Swimming. Oslo: Norwegian School of Sport Sciences.
Slawson S, Conway P, Cossor J, Chakravorti N, Le-Sage T & West A (2011). The effect of start block configuration and swimmer kinematics on starting performance in elite swimmers using the Omega OSB11 block. Proc Engineering, 13, 141–147.
Presenter Armin Kibele received his PhD from the University of Freiburg, Germany. Since 2002 he has been Professor for Trainings Science and Movement Science at the University of Kassel, Germany. He is also Adjunct Professor at the Memorial University of Newfoundland.
Should the gliding phase be included in the backstroke starting analysis? Karla de Jesus1, Kelly de Jesus1, Sara T Morais2, Joao Ribeiro1, Ricardo J Fernandes1,2, João Paulo Vilas-Boas1,2 1CIFI2D, Faculty of Sport, University of Porto, Portugal, 2LABIOMEP, University of Porto, Portugal
Introduction The underwater phase in swimming starts has been divided into gliding and underwater kicking (Vantorre et al., 2010). The former corresponds to the period between full immersion and beginning of lower limbs propulsion, and the latter is defined between gliding ending and beginning of upper limbs propulsion (de Jesus et al., 2012; Vantorre et al., 2010). Since swimmers have to perform upper, trunk and lower limbs movements to decrease the vertical displacement after backstroke start full immersion (Green et al., 1987), it might be speculated that propulsive actions occur as soon as swimmers entering the water, evidencing the non-existence of a gliding phase at backstroke start. This study aimed to characterise the underwater phase kinematics at one of the most used backstroke starting variants.
Method After a month of backstroke starting training period, 9 high trained backstroke swimmers (22.22±6.37 yrs, 1.78±0.04 m, 72.67±10.85 kg) performed randomly three 15 m maximal repetitions of the backstroke starting variant with feet parallel and partially emerged and the highest horizontal handgrip with 3 min resting. The best trial in terms of 15 m performance was selected for each swimmer. Six underwater cameras (Oqus underwater, Qualisys AB, Sweden) positioned frontal and laterally to the swimmer’s plane of movement tracked right side reflective markers. The horizontal, vertical and resultant hip velocity-curves were processed using Qualisys Track Manager (Qualisys AB, Sweden). Each individual velocity time-curve was normalised in time from the hallux immersion until the beginning of the upper limbs propulsion. The velocity at full immersion and at five critical instants of the 1st undulatory underwater kicking cycle was assessed at each normalised individual curve. The typical horizontal, vertical and resultant velocity-time curve of the nine swimmers was calculated.
Results Typical curves showed that after the full immersion, swimmers performed a downward kick and achieved lower horizontal and resultant velocity than those displayed at full immersion (1.15±0.18 vs. 2.09±0.26 and 1.62±0.36 vs. 2.39±0.33 m/s, respectively, p≤.05). The transition to the 1st upward kick generated greater horizontal, vertical and resultant velocity than those noted at 1st downward kick (1.79±.18 vs. 1.15±.18, -1.23±.51 vs. -1.0±.34, 2.14±.23 vs.
BMS2014—ABSTRACTS HANDBOOK 65

1.62±.36 m/s, respectively, p≤.05). Compared to the 1st upward kick, swimmers displayed lower horizontal, vertical and resultant velocity at the 1st part of the transition from the 1st up to the 2nd downward kick (1.67±.15 vs. 1.79±.18, -.29±0.21 vs. -1.23±.51, 1.73±.13 vs. 2.14±.23 m/s, respectively, p≤.05). Lower horizontal and resultant velocity was observed at the 2nd downward kick compared to the 2nd part of the transition from 1st up to 2nd downward kick (.96±.22 vs. 1.68±0.14, 1.14±.30 vs. 1.70±.15 m/s, respectively, p≤.05).
Conclusions Subsequently to the full immersion, a downward kick was performed implying the swimmers’ negative acceleration. This detrimental effect on horizontal and resultant velocity components were minimised by continued undulatory underwater cycles, highlighting the absence of the gliding phase (Vantorre et al., 2010) at backstroke start. Future researches should verify the current evidences in other backstroke starting variants.
Acknowledgments CAPES (BEX 0761/12-5/2012-2014) and Santander Totta Bank (PP-IJUP2011-123).
References de Jesus et al. (2012). XXX ISBS; Green et al. (1987). V ISBS; Vantorre, J. et al. (2010). Int. J. Sports Med.
Presenter Karla de Jesus is a PhD candidate who has been investigating the backstroke starting since her Master course. Karla was a swimmer for many years and won many titles, with two Brazilian records in relay swimming events.
Characteristics of an elite swimming start Elaine Tor1,2, David Pease1, Kevin Ball2 1Aquatic Testing, Training and Research Unit, Australian Institute of Sport, 2Institute of Sport, Exercise and Active Living, Victoria University
Introduction The implementation of a new start block to competitive swimming has resulted in a new start technique being utilised. While aspects of this new technique have been previously assessed, there is a need to characterise technical factors in the new swim start and determine if differences exist between male and female athletes as well as between strokes. The aims of this study were to investigate how elite swimmers of both genders use the new start block, compare males and females and freestyle and butterfly start performances.
Method Thirty-six start parameters were calculated for 52 starts from trials collected by the Wetplate Analysis System and Swimtrak system at the Australian Institute of Sport. Subjects were all Australian Olympic or World Championship representatives. Descriptive statistics were calculated on a group basis before parameters were split into; above water and underwater phases for further analysis. Independent t-tests and Cohen’s effect sizes were then calculated to compare groups and strokes.
Results When examining the sub-phases of the start it was found that 11% (0.74 s) was spent in the on block phase, 5% (0.30 s) in the flight phase, 56% (3.69 s) in the underwater phase and 28% (1.81 s) free swimming once the athlete had resurfaced. Males produced significantly larger take-off horizontal velocity (p < 0.001, Large), peak horizontal force (p < 0.001, Large) and were also able to produce faster underwater velocities for all segments. Males also travelled significantly deeper (p < 0.001, Large). These findings resulted in males having significantly faster start performances than females (p < 0.01, Large); on average they were 0.95 s faster to 15 m. When comparing different strokes, butterfly swimmers had a significantly deeper maximum depth (p = 0.01, Large) and breakout distance (p < 0.001, Large) than freestylers, but there was no significant difference in overall start performance (p = 0.74, Small).
Conclusions The results from this study are novel and characterise how elite swimmers utilise the new start block and kick-start technique. The importance of the underwater phase was clearly highlighted as swimmers spent the longest time in this phase. The results also show that there are clear variances in start performance between male and female athletes due to males being able to generate greater force and velocity in the early phases of the start which translate into faster overall start performances. There are also differences present for underwater parameters when comparing butterfly and freestyle, however these differences do not result in differences in time to 15 m.
66 BMS2014—ABSTRACTS HANDBOOK
Presenter Elaine Tor has been working at the Australian Institute of Sport in the Aquatic Testing, Training and Research Unit since 2010. In this time she has been heavily involved with athlete serving and has completed her Honours in swimming competition analysis. She is now a PhD Scholar investigating the main factors that affect the underwater phase of the swimming start.
CONCURRENT SESSION 5B—PHYSIOLOGY 5
Intermittent maximal lactate steady state determination based on 200 m performance Ronaldo Bucken Gobbi1, Carlos Augusto Kalva-Filho2, Eduardo Zapaterra Campos1, Camila Dantas Brum2, Joao Paulo Loures1, Marcelo Papoti3 1Sao Paulo State University, Campus of Rio Claro, 2Sao Paulo State University, Campus of Presidente Prudente, 3Sao Paulo University, EEFERP, Campus of Ribeirão Preto
The aim of the present study was to determine intermittent maximal lactate steady state (iMLSSI) based on a 200m maximum effort. Fourteen state and national swimmers (15 ± 2.3 years, 62.7 ± 12.4 kg e 171 ± 7.5 cm), after a 200m maximum effort (P200) were submitted to five 3000m training sessions (30, 100m bouts separated by 30 seconds of passive interval) with intensities varying between 80 to 95% of P200. At rest, after the 15th and 30th bout, blood samples (25µL from the ear lobe) were collected to determine blood lactate concentrations ([Lac]). Rated o perceived exertion (RPE) was monitored after the 15th and 30th 100m bout. Average of [Lac] and RPE between the 15th and 30th 100m bout were used to characterise the intensity of each session. The relationship between [Lac] and the percentage of P200 were submitted to two mathematical adjustments (2nd order polynomial and linear). iMLSSI was assumed as the swimming intensity corresponding to the major distance between the two adjustments (i.e. Dmax method). The iMLSSI (1.30 ± 0.13 m.s-1) was observed at 91.5 ± 2.38% of P200 (1.42 ± 0.13 m.s-1) corresponding to [Lac] and RPE at 3.45 ± 1.30 mM and 16.33 ± 1.12 u.a respectively. Thus, it’s suggested for intermittent training which the goal is to develop aerobic capacity (i.e. iMLSSI) with 100m bouts with 30 seconds intervals, intensity corresponding to 91.5% of P200.
Presenter Ronaldo Bucken Gobbi is a Master degree student in the Exercise Physiology Lab at São Paulo State University. Throughout his years in research, he developed interest in testing and training swimming. This research was conducted as part of his Master degree dissertation.
Lactate parameters and 100 m freestyle results in male and female youth swimmers Georgia Rozi1, Vassilios Thanopoulos1, Milivoj Dopsaj2, Vasiliki Lampadari3 1Faculty of Physical Education and Sports Science, University of Athens, 2Faculty of Sport and Physical Education, University of Belgrade, Serbia, 3Swimming Coach, OAKA of Athens, Greece
Introduction Individual factors determining performance capacity in swimming are the capacity of the immediate, short term and long term systems of energy production. The amount of anaerobic energy depends on the distance and velocity at which swims are performed, but a significant amount of energy is derived from anaerobic energy release, especially at distance lasting until 120 seconds (Strumbelj et al., 2002).
Method The sample of this study consisted of 20 swimmers, all active short and middle distance swimmers, 10 of them were male of Age=16±1, and 10 were female of Age=16±0.5. Subjects performed 100m freestyle with maximum intensity (100VEL) as a criteria variable. Heart rate (HR) was estimated the first 10sec. Blood capillary samples were taken in 3, 5 and 7min post exercise in order to determine maximum accumulation of lactic acid (LaMAX). The following variables were used as lactate parameters: LaPEAK, LaMAX, t_LaMAX, Index LaPEAK/100VEL, Index LaMAX/100VEL, Index HR/LaPEAK and Index HR/LaMAX (sets of predictive variables).
Results The results of Multiple regression analysis showed that at general level there is statistical significant relationship between 100VEL and system of predictor variables at R2
adj = 0.9762, Standar Error = 0.6853, FANOVA of Regresion = 83.01, p = 0.000. At partial level only two variables are statistically significantly related with 100VEL as well as: LaMAX – t = -6.21,
BMS2014—ABSTRACTS HANDBOOK 67

p = 0.000, and Index LaMAX/100VEL – t = 4.78, p = 0.002. Concerning the gender differences, only statistically significant differences between male and female swimmers were found at: t_LaMAX – t = 1.982, p = 0.039 (347.4±72.4 vs 261.8±87.2 sec for male and female swimmers, respectively).
Conclusion The one trial all-out 100m freestyle testing could be useful and simple method to check the swimmers lactate characteristics at high intensity anaerobic specific strain. The results showed that variables such as LaMAX and Index LaMAX/100VEL could be useful measurements for researchers, regardless to gender at youth age.
References Strumbelj, B., Usaj, A., Kapus, V., Bednarik, J. & Kapus, N. (2002). Acidosis during maximal performance in front crawl swimming
over distances of 100m to 400m. Biomechanics and Medicine in Swimming IX. 409–414. 21–23 June, Saint Ettiene.
Presenter Georgia Rozi graduated on 2008 in National and Kapodistrian University of Athens, Faculty of Physical Education and Sports Science. On 2011 she took the master degree with specialisation in Swimming science. She is now a PhD student in the same University, continuing research in the field of swimming.
Effect of an exhaustive swim exercise on isometric peak torque and stroke parameters Camila Coelho Greco1, Natalia Menezes Bassan1, Thadeu Elias Augusto Siqueira Cesar1, Benedito Sergio Denadai1 1Human Performance Laboratory, São Paulo State University, Brazil
Introduction Fatigue has been defined as the reduced capacity to produce force. Significant changes in swim technique have been demonstrated during exhaustive constant-speed swim tests (Alberty et al., 2009), which have been attributed, at least in part, to the reduced capacity to produce force. The objective of this study was to correlate the changes in the isometric peak torque (IPT) of elbow flexors (EF) and elbow extensors (EE) and the stroke parameters induced by an exhaustive swim.
Method Eight trained swimmers (25.6 ± 6.7 yr., 1.78 ± 0.1 m and 74.9 ± 11.1 kg) performed in different days the following tests: 1) familiarisation to the dynamometer; 2) a 400-m swim trial to determine the aerobic performance (V400); 3) two isometric maximal voluntary contractions of 5 s to determine IPT of EF and EE. These tests were performed before and immediately after an exhaustive constant-speed test at 100%V400.
Results The mean ± SD values of V400 and time to exhaustion were 1.27 ± 0.11 m.s-1 and 194.9 ± 39.6 s, respectively. There were significant reduction on IPT of EF (Pre = 79.6 ± 19 and Post = 67.3 ± 15.4 Nm) and EE (Pre = 98.7 ± 19 Nm and Post = 82.9 ± 22.2 Nm) after the exercise (p < 0.05). The stroke frequency (37.4 ± 4.21 and 41.4 ± 4.76 cycles.min-1) and the stroke length (2.09 ± 0.22 and 1.85 ± 0.13 m.cycle-1) were changed from the beginning to the end of the test, respectively (p < 0.05). No significant correlation (r = -0.55–0.29, p > 0.05) was found between the changes in IPT and stroke parameters.
Conclusions Although a high-intensity exhaustive test may generate significant changes in torque and stroke parameters, the fatigue measured at isometric condition might not explain the changes in stroke parameters.
References Alberty M, Sidney M, Pelayo P, Toussaint HM. Stroking characteristics during time to exhaustion tests. Med Sci Sports Exerc 2009;
41: 637–644
Presenter Dr Camila Coelho Greco completed her PhD in evaluation of aerobic fitness and performance during swimming, and has been studying the physiological responses and indexes for the evaluation of aerobic fitness during swimming, running and cycling.
68 BMS2014—ABSTRACTS HANDBOOK

Validation of an inertial measurement unit for the determination of the longitudinal speed of a swimmer Frederic Puel1, Ludovic Seifert1, Philippe Hellard2 1University of Rouen, 2Federation Francaise de Natation
Introduction The aim of this study was to validate an inertial measurement unit (called CIREN, Figure 1), specifically designed for swimmer movement analysis, by comparison with golden standards for rotational speeds and translational accelerations measurements and the determination of longitudinal speed of the swimmer in global reference mark.
Figure 1
Methods This study was based on 3 different experiments. The first one was conducted in a mechanical lab where CIREN was mounted on a MIKRON HSM 600U, a 5-axis machining centre that can reproduce -and control- chosen trajectories. Different sets of movements where tested (50 repetitions of one-axis rotation or one-axis translation) and Spearman’s correlations (r), normalised pairwise variability index (nPVI) and the percentage of signal outside the confidence interval (CI) of Bland & Altman were computed. The other experiments were conducted in pool where regional to elite swimmers wore CIREN. In experiment 2, CIREN was compared with a Speedometer (Leblanc et al., 2007). Fifteen regional swimmers swam a 25 m in their stroke style specialty. In experiment 3, one international swimmer swam an all-out 25 m in front crawl and comparisons were made between CIREN and 3D kinematics (5 aerial cams, calibration frame with 49 calibration points, 3.67 x 1.63 x 1.42 m).
Results Exp 1. Through the rotations’ test (3418 samples at 150 Hz), 0.82 < r < 0.84 (p < 0.0001), 1.08 < nPVI < 1.21 and the percentage of signal outside CI from 2.67 to 3.16%. Through the translations’ test (3455 samples at 150 Hz), 0.18 < r < 0.28 (p < 0.0001), 2.11 < nPVI < 4.25 and the percentage of signal outside CI from 2.01 to 2.63%. Figures 2 and 3 present respectively rotational speeds and translational accelerations by means of the MIKRON machining tool and CIREN.
Figure 2 Figure 3
Exp 2. Figure 4 presents longitudinal speeds of the hip in breaststroke for Speedometer and CIREN.
00Exp 3. Figure 5 presents longitudinal speeds of the hip in crawl for 3D kinematics and CIREN. In this case r = 0.49 (p < 0.0001), nPVI = 0.11 and the percentage of signal outside CI = 3.57%.
BMS2014—ABSTRACTS HANDBOOK 69
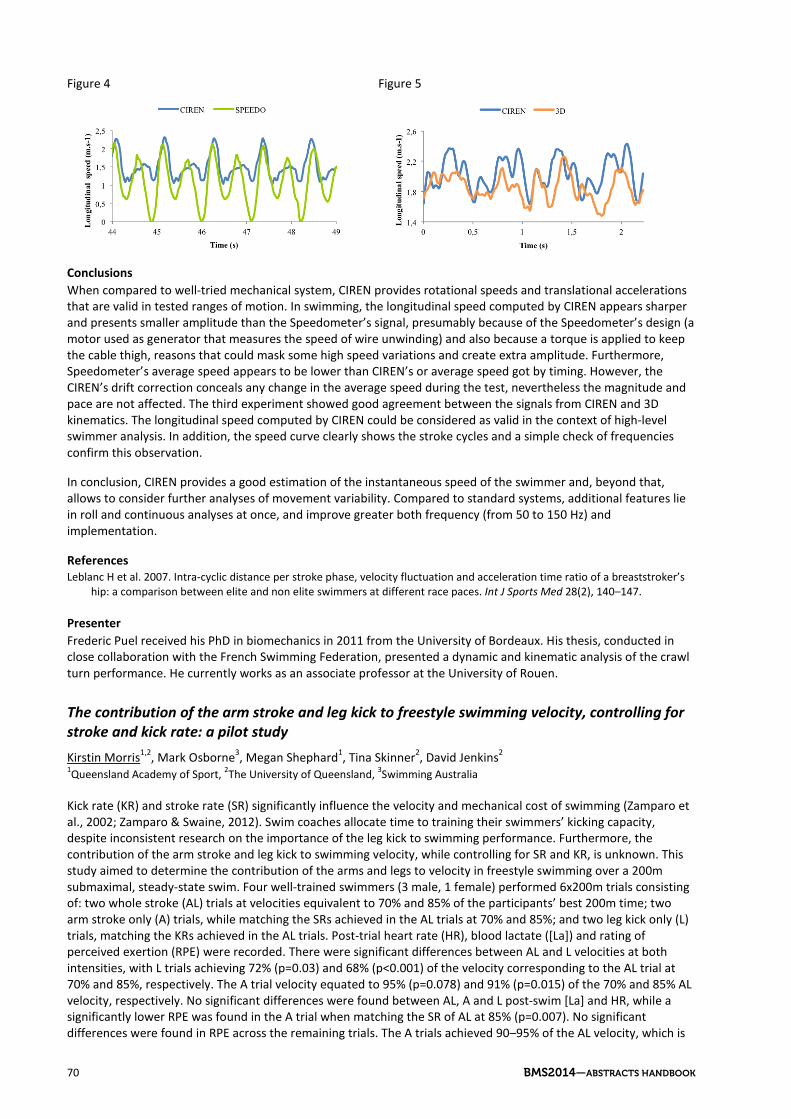
Figure 4 Figure 5
Conclusions When compared to well-tried mechanical system, CIREN provides rotational speeds and translational accelerations that are valid in tested ranges of motion. In swimming, the longitudinal speed computed by CIREN appears sharper and presents smaller amplitude than the Speedometer’s signal, presumably because of the Speedometer’s design (a motor used as generator that measures the speed of wire unwinding) and also because a torque is applied to keep the cable thigh, reasons that could mask some high speed variations and create extra amplitude. Furthermore, Speedometer’s average speed appears to be lower than CIREN’s or average speed got by timing. However, the CIREN’s drift correction conceals any change in the average speed during the test, nevertheless the magnitude and pace are not affected. The third experiment showed good agreement between the signals from CIREN and 3D kinematics. The longitudinal speed computed by CIREN could be considered as valid in the context of high-level swimmer analysis. In addition, the speed curve clearly shows the stroke cycles and a simple check of frequencies confirm this observation.
In conclusion, CIREN provides a good estimation of the instantaneous speed of the swimmer and, beyond that, allows to consider further analyses of movement variability. Compared to standard systems, additional features lie in roll and continuous analyses at once, and improve greater both frequency (from 50 to 150 Hz) and implementation.
References Leblanc H et al. 2007. Intra-cyclic distance per stroke phase, velocity fluctuation and acceleration time ratio of a breaststroker’s
hip: a comparison between elite and non elite swimmers at different race paces. Int J Sports Med 28(2), 140–147.
Presenter Frederic Puel received his PhD in biomechanics in 2011 from the University of Bordeaux. His thesis, conducted in close collaboration with the French Swimming Federation, presented a dynamic and kinematic analysis of the crawl turn performance. He currently works as an associate professor at the University of Rouen.
The contribution of the arm stroke and leg kick to freestyle swimming velocity, controlling for stroke and kick rate: a pilot study Kirstin Morris1,2, Mark Osborne3, Megan Shephard1, Tina Skinner2, David Jenkins2 1Queensland Academy of Sport, 2The University of Queensland, 3Swimming Australia
Kick rate (KR) and stroke rate (SR) significantly influence the velocity and mechanical cost of swimming (Zamparo et al., 2002; Zamparo & Swaine, 2012). Swim coaches allocate time to training their swimmers’ kicking capacity, despite inconsistent research on the importance of the leg kick to swimming performance. Furthermore, the contribution of the arm stroke and leg kick to swimming velocity, while controlling for SR and KR, is unknown. This study aimed to determine the contribution of the arms and legs to velocity in freestyle swimming over a 200m submaximal, steady-state swim. Four well-trained swimmers (3 male, 1 female) performed 6x200m trials consisting of: two whole stroke (AL) trials at velocities equivalent to 70% and 85% of the participants’ best 200m time; two arm stroke only (A) trials, while matching the SRs achieved in the AL trials at 70% and 85%; and two leg kick only (L) trials, matching the KRs achieved in the AL trials. Post-trial heart rate (HR), blood lactate ([La]) and rating of perceived exertion (RPE) were recorded. There were significant differences between AL and L velocities at both intensities, with L trials achieving 72% (p=0.03) and 68% (p<0.001) of the velocity corresponding to the AL trial at 70% and 85%, respectively. The A trial velocity equated to 95% (p=0.078) and 91% (p=0.015) of the 70% and 85% AL velocity, respectively. No significant differences were found between AL, A and L post-swim [La] and HR, while a significantly lower RPE was found in the A trial when matching the SR of AL at 85% (p=0.007). No significant differences were found in RPE across the remaining trials. The A trials achieved 90–95% of the AL velocity, which is
70 BMS2014—ABSTRACTS HANDBOOK

in agreement with Deschodt et al., (1999) and Bucher (1975), who concluded that the leg kick contributes to approximately 10% of the overall velocity in freestyle swimming over 25m and 15m maximal efforts, respectively. The reported results represent preliminary findings. Further trials will be conducted involving all four competitive swimming strokes, with measurement of oxygen consumption to determine the metabolic cost of the arm stroke and leg kick across different strokes.
References Bucher, W. (1975). The influence of the leg kick and the arm stroke on the total speed during the crawl stroke. In L. Lewillie & J.
P. Clarys (Eds.), Swimming II (pp. 180–187). Brussels, Belgium: University Park Press.
Deschodt, V. J., Arsac, L. M. & Rouard, A. H. (1999). Relative contribution of arms and legs in humans to propulsion in 25m sprint front crawl swimming. Eur J Appl Physiol, 80, 192–199.
Zamparo, P., Pendergast, D. R., Termin, B. & Minetti, A. E. (2002). How fins affect the economy and efficiency of human swimming. J Exp Biol, 205, 2665–2676.
Zamparo, P. & Swaine, I. L. (2012). Mechanical and propelling efficiency in swimming derived from exercise using a laboratory-based whole-body swimming ergometer. J Appl Physiol, 113, 584–594.
Presenter Kirstin Morris undertook her Bachelor of Sport and Exercise Science at the University of Queensland, graduating with Class 1 Honours in December 2012. Desperately wanting to work in high performance sport, Mark Osborne convinced her that a PhD was the way to go so she began her PhD journey in January of 2013 with the Queensland Academy of Sport (QAS) and the University of Queensland. She is a member of the QAS swimming physiology servicing team.
Are different methods for the aerobic capacity evaluation providing coherent biomechanical parameters? Jailton Pelarigo1,2,3, Ricardo Fernandes2,3, Ricardo Pimenta2, Higo Leao5, Camila Greco4, João Paulo Vilas-Boas2,3 1The Capes Foundation, Ministry of Education of Brazil, Brazil, 2Faculty of Sport/CIFI2D, University of Porto, Portugal, 3LABIOMEP, University of Porto, Portugal, 4Sao Paulo State University, Brazil, 5Federal University of Pernambuco, Brazil
Introduction Monitoring training process requires reliable methods for aerobic capacity evaluation. Moreover, the different adjustments in the biomechanical parameters can interfere in swimming efficiency, which is a major factor in swimming performance. Therefore, this study aimed to compare swimming biomechanical parameters and velocity among the gold-standard method, i.e. the maximal lactate steady state test (MLSS), and the other main methods employed to evaluate aerobic capacity.
Methods Five elite female swimmers (17.2 ± 2.3 yrs, 1.68 ± 0.04 m, 61.4 ± 5.0 kg) performed in different days: 1) an intermittent incremental protocol until voluntary exhaustion to determine the velocity associated to the individual lactate threshold (ILT), the ventilatory threshold (VT), the heart rate threshold (HRT), the lactate threshold of fixed 3.5mmol.L-1 (LT3.5) and the maximal oxygen uptake (VO2max) (Fernandes et al., 2006); 2) two to three 30min sub-maximal continuous tests to determine the velocity associated to the MLSS (Pelarigo et al., 2011). Swimming velocity, blood lactate concentration, stroke rate (SR), stroke length, (SL) and stroke index (SI) were controlled during all tests. ANOVA repetead measures and regression analysis were performed to test differences between methods (p<0.05).
Results The findings revealed that velocity at the LT3.5 test was higher (1.32 ± 0.08 m.s-1) compared to MLSS, ILT, VT and HRT (1.24 ± 0.09, 1.24 ± 0.06, 1.23 ± 0.06 and 1.25 ± 0.06 m.s-1, respectively). SR was higher during the LT3.5 (35.8 ± 2.2 cycles.min-1) compared to ILT, VT and HRT (32.2 ± 1.5, 31.8 ± 1.0 and 32.3 ± 1.6 cycles.min-1, respectively), however, SR was not significantly different compared with MLSS (34.1 ± 3.0 cycles.min-1). SL at the MLSS (2.18 ± 0.10 m.cycle-1) and LT3.5 (2.22 ± 0.11 m.cycle-1) were lower compared to ILT, VT and HRT (2.31 ± 0.09, 2.32 ± 0.08 and 2.31 ± 0.09 m.cycle-1, respectively). SI was lower during the MLSS (2.71 ± 0.23) compared to ILT, VT, HRT and LT3.5 (2.87 ± 0.21, 2.86 ± 0.21, 2.89 ± 0.20 and 2.93 ± 0.27, respectively). The percentage of SR and SL at MLSS regarding to the VO2max were 89.4 ± 7.0 and 103.2 ± 8.1%, respectively. Furthermore, higher correlation values were obtained between MLSS/ILT and MLSS/VT (p<0.05).
BMS2014—ABSTRACTS HANDBOOK 71

Conclusions These findings suggest that ILT and VT may be better predictors of the gold-standard method for the aerobic capacity evaluation compared to LT3.5 and HRT.
Acknowledgments This research was supported by grants from the Capes Foundation, Ministry of Education of Brazil (BEX: 0536/10-5).
References Fernandes RJ et al (2006). J Sports Med Phys Fitness 46, 373–380.
Pelarigo JG et al. (2011). J Sci Med Sports, 14, 168.e1–168.e5.
Presenter Professor João Paulo Vilas-Boas is a Full Professor at the Faculty of Sport, University of Porto, a member of the Steering Group Biomechanics and Medicine in Swimming of the World Commission of Science in Sport, and a member of the board of the Portuguese Olympic Committee, a former Olympic Swimming Coach and he is the director of the Porto Biomechanics Laboratory, University of Porto, Porto, Portugal.
Effects of sprint interval training on metabolic, mechanical characteristics and swimming performance Futoshi Ogita1, Zhong Huang1, Kazumichi Kurobe1, Gentarou Ozawa1, Aakira Nagira1, Kengo Yotani1, Nobutaka Taguchi1, Hiroyuki Tamaki2 1National Institute of Fitness and Sports, 2Niigata University of Health and Welfare
Introduction Recently, many studies have reported that high-intensity interval training can improve not only anaerobic (glycolytic) metabolism but also aerobic (oxidative) metabolism and that these metabolic adaptations cause improvements in exercise performance. Therefore, we applied this type of training to swimmers, and tested the effects of very high-intensity, low-volume, sprint interval training on metabolic, mechanical characteristics and swimming performance.
Methods Eleven well-trained college swimmers (male n=6; female n=5; age 20±1 yrs) performed sprint interval training (SIT) in swimming flume. The SIT consisted of five 5 s bouts at an intensity which cause exhaustion in around 10 s (~250%V
.O2max) with a 10 s rest between each bout, and was conducted twice/session, 5 days/week, for 4 weeks.
Before and after the training period, maximal oxygen uptake (V.
O2max), maximal accumulated oxygen deficit (MAOD) (Ogita et al. 1996), and swimming economy were measured using a swimming flume, and drag-swimming velocity relationship and maximal propulsive power (MPP) were determined (Toussaint et al. 1988). Furthermore, the best competition time on 50m free style event was also recorded.
Results After the training, no significant changes were found in swimming economy and drag-swimming velocity relationship. On the other hand, V
.O2max, MAOD, and MPP increased significantly (P<0.05). Consequently, the
swimming performance in 50m was significantly improved (Pre; 26.60±1.91 s, Post; 26.18±1.75 s, P<0.01).
Conclusions These results revealed that high-intensity, low-volume, SIT used in this study can improve metabolic capacity such as V
.O2max, MAOD, and MPP. Consequently sprint swimming performance improves but there was no affect on
swimming economy and the drag-swimming velocity relationship.
References Ogita F, Hara M, Tabata I (1996) Anaerobic capacity and maximal oxygen uptake during arm stroke, leg kicking, and whole body
swimming. Acta Physiol Scand, 157: 435–441.
Toussaint HM, de Groot G, Savelberg HHCM, Vervoorn K, Hollander AP, van Ingen Schenau GJ (1988) Active drag related to velocity in male and female swimmers. J Biomech, 21: 435–438.
72 BMS2014—ABSTRACTS HANDBOOK

Presenter Futoshi Ogita graduated with masters degree from the National Institute of Fitness and Sports in 1990 and with his PhD from Vriji Univeriteit in 2000. He is currently a professor at the National Institute of Fitness and Sports. He is currently a councillor of the Physiological Society of Japan, a councillor of the Japan Society of Exercise and Sports Physiology, a member of the Scientific Commission in Asian Federation of Sports Medicine and on the editorial board of Japanese journal Elite Sports Supports.
CONCURRENT SESSION 5C—BIOMECHANICS 5
Torque and power about the joints of the arm during the freestyle stroke Simon Harrison1, Raymond Cohen1, Paul Cleary1 1CSIRO Computational Informatics
Introduction Competitive swimming involves a complicated interplay between athlete strength and technique and the response of the water to the movement of the athlete. Unlike land based sports, where loading from the ground can been measured and used to estimate muscular exertion, it is practically impossible to measure loading on the body from the water and deduce muscular effort. It is not known precisely how modified strength or endurance attributes affect the performance of an athlete, nor is it known how this relationship varies with modified technique or between athletes. Knowledge of the dependence of joint torque and joint power on changes to stroke technique and athlete anthropometry would provide a valuable basis to understand the relationship between muscular effort and performance during competitive swimming.
Computational models of swimming have recently been shown to successfully predict fluid and athlete behaviour during swimming, despite the significant challenges in simulating this environment (Cohen et al. 2012). Traditional computational fluid dynamics (CFD) modelling techniques are not well suited to predicting the interactions between moving bodies in water or the behaviour of the surface of water. Recent progress in this area is attributable in part to the development of methods that can simulate each of the aspects of the physical environment of swimming. Smoothed particle hydrodynamics (SPH) is a method that is especially well suited to modelling the moving and deforming shape of the swimmer skin surface and the dynamic interactions with the fluid.
Method In this study we use a coupled Biomechanical-Smoothed Particle Hydrodynamics (B-SPH) model of swimming to calculate the torques and powers generated by an elite female swimmer performing a freestyle stroke. The athlete is represented in the model by a three dimensional mesh that moves and deforms in a manner that matches video footage captured by three synchronised cameras. The SPH method is applied to calculate the response of the fluid to the swimmer and the forces across the surface of the body. A biomechanical model of the body joints is used to calculate the torque about each joint throughout the stroke cycle. Power is calculated from the net work done by the muscles about each joint to generate torque.
Results The joint torques and powers are shown to vary considerably throughout the stroke cycle and throughout the body. Shoulder and hip joint torques were the largest in magnitude for the limbs. The areas of greatest muscular effort and exertion are identified.
Conclusions The study details the first CFD model able to calculate joint torques and joint powers during swimming. Future applications to modified stroke styles, other strokes and other athletes will elucidate the relationship between technique and muscular effort.
References Cohen, R.C.Z., Cleary P.W. and Mason, B.R. (2012), Simulations of Dolphin Kick Swimming Using Smoothed Particle
Hydrodynamics, Human Movement Science 31(3), 604–619.
Presenter Dr Simon Harrison completed his bachelor’s degrees of Engineering (Mechanical) and Science (Chemistry), and a PhD in the simulation of soft tissue deformation at the University of Western Australia. Subsequent to this, he held a Research Fellow position at the University of Melbourne under Prof Marcus Pandy from 2007 until 2010. In this
BMS2014—ABSTRACTS HANDBOOK 73

position he investigated the biomechanical causes of equine limb injury and human knee osteoarthritis. After a short tenure at DSTO looking at human performance and injury models, he took a position as a Research Scientist at CSIRO in 2011. Currently he applies mesh-free particle methods to problems in the areas of human performance, injury, and health, with a number of research collaborators and industry partners.
The determination of ‘added mass’ of swimmers as a part of studies of unsteady flow Bodo E Ungerechts1, Juergen M Klauck2 1University of Bielefeld, Neurocognition-Biomechanics, Germany, 2SPOHO Colgne, Biomechanics, Germany
Introduction Swimming is a combination of buoyancy and self-induced propulsion under the conditions of cognitive control and limited energy reserves. While the buoyancy acts permanently, self-induced propulsion fluctuates due to the cyclic interaction of the body and water masses, resulting in unsteady flow conditions. There are consequences not only for the calculation of the braking forces. Commonly the braking effect due to flow (D) is determined by towing tests. Here the constant speed (u) is stepwise increased and the result (FW/u) is represented as a curve. The effect that occurs with the change of speed (a), e.g. from start to constant speed, is not recognised. The change (a) is coupled with unsteady flow phenomena. Now the functional relationships between effects to speed and acceleration, respectively are governing braking effects. These functional relationships are detectable by a mathematical model, with an acceleration-related proportionality factor from the experimental linear relationship between drag and speed, which has the unit of mass, as additive mass (called ‘added mass’), respectively. The aim of this paper is the individual determination of the ‘added mass’ of swimmers.
Method 18 younger swimmers are towed by means of an apparatus, Semi-Tethered-Maschine (STM), over a distance of 50 m, powered by constant falling mass. The acceleration is transmitted via a roller system and a rope held by a swimmer in fully extended body position. The instantaneous changes in speed will be registered by using electro-optical system on incremental device, registering the revolutions due to cable tension, yielding in velocity-time-curve via PC. Based on the appropriate equation of motion T – D – (Madd * a) = 0 (T = momentum (motion direction) *t [N], D = momentum against motion direction *t [N], Madd = ‘added mass’ [kg], a = acceleration [m/s²]) Madd finally can be determined precisely per swimmer as factor of proportionality due to Acceleration Reaction (Ungerechts et al., 2003).
Results The time-dependent velocity curve for all investigated swimmers show the same characteristic: largest acceleration occur from rest lasting 8–10 s. When the swimmer’s movement becomes faster, the ingoing constant acceleration is modulated by the interaction of body and displaced water mass yielding in smaller acceleration and finally the resulting velocity curve shows constant values and now the flow becomes quasi-steady. Comparison of the braking effects due to unsteady and steady flow, respectively, shows significant differences. The calculated added- mass-values were proportional to acceleration and yield Madd = | 30–70 | kg depending on the (final) towing speeds between 1.0–1.6 m/s—resulting from different falling weights.
Conclusions In unsteady flow conditions coupled with change of speed the braking effect is strongly influenced by acceleration term. The change of the total moving mass, swimmers’ and water mass, must be taken into account when calculating e.g. the mechanical power. It is known that the ‘added mass’ affects the swimmer’s motion differently depending if the body is a) accelerated which increases the braking effect or b) decelerated which pushed the swimmer due to inertial effects (Klauck, 1999). A breaststroke swimmer with Madd = 70 kg might have an advantage because of powerful thrust due to inertia compared to a swimmer of much lower Madd, however, the meaning for efficiency values is yet to be clarified.
References Klauck J.M. (1999) Swimming speed estimation based on forward dynamics. In: K.L. Keskinen, P.V. Komi, A.P. Hollander (eds.)
BMS VIII. Gummerus Printing, Jyväskylä, 95–100
Ungerechts, B.E., Buckwitz, R., Baehr H. (2003) Principles of non-stationary swimming—a preliminary attempt. In: J C Chartard (ed.) BMS IX, University of St. Etienne, France, 45–50
74 BMS2014—ABSTRACTS HANDBOOK
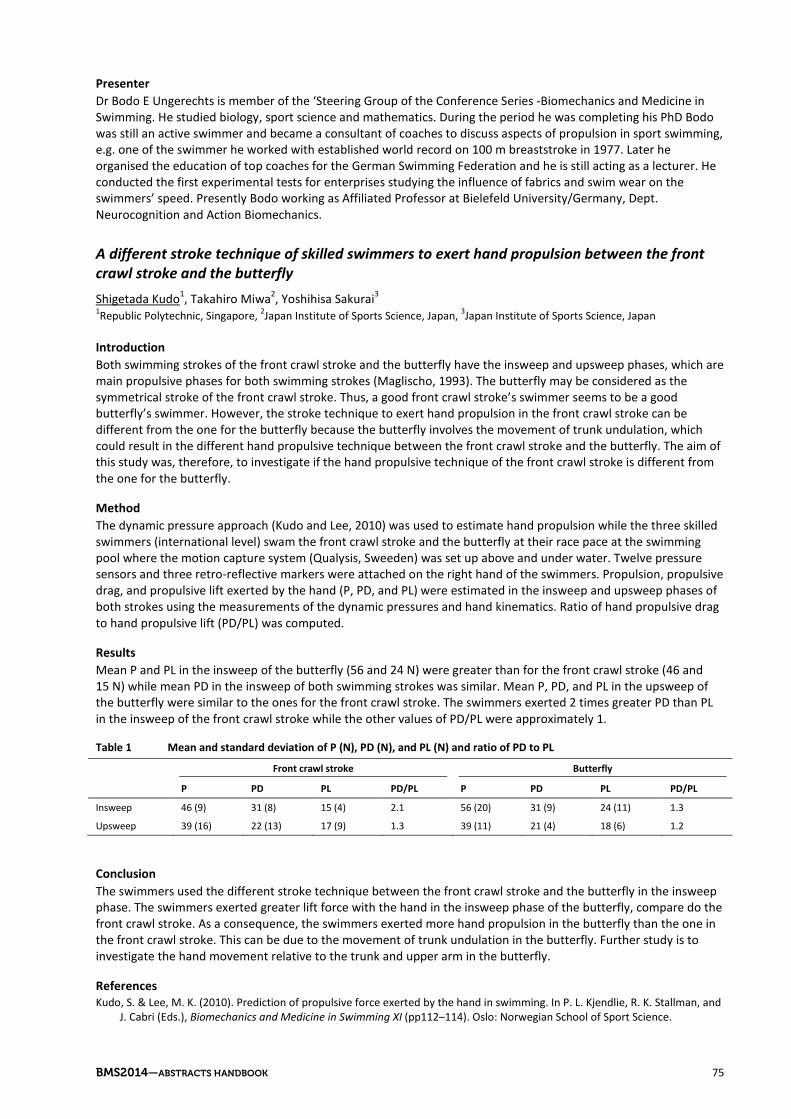
Presenter Dr Bodo E Ungerechts is member of the ‘Steering Group of the Conference Series -Biomechanics and Medicine in Swimming. He studied biology, sport science and mathematics. During the period he was completing his PhD Bodo was still an active swimmer and became a consultant of coaches to discuss aspects of propulsion in sport swimming, e.g. one of the swimmer he worked with established world record on 100 m breaststroke in 1977. Later he organised the education of top coaches for the German Swimming Federation and he is still acting as a lecturer. He conducted the first experimental tests for enterprises studying the influence of fabrics and swim wear on the swimmers’ speed. Presently Bodo working as Affiliated Professor at Bielefeld University/Germany, Dept. Neurocognition and Action Biomechanics.
A different stroke technique of skilled swimmers to exert hand propulsion between the front crawl stroke and the butterfly Shigetada Kudo1, Takahiro Miwa2, Yoshihisa Sakurai3 1Republic Polytechnic, Singapore, 2Japan Institute of Sports Science, Japan, 3Japan Institute of Sports Science, Japan
Introduction Both swimming strokes of the front crawl stroke and the butterfly have the insweep and upsweep phases, which are main propulsive phases for both swimming strokes (Maglischo, 1993). The butterfly may be considered as the symmetrical stroke of the front crawl stroke. Thus, a good front crawl stroke’s swimmer seems to be a good butterfly’s swimmer. However, the stroke technique to exert hand propulsion in the front crawl stroke can be different from the one for the butterfly because the butterfly involves the movement of trunk undulation, which could result in the different hand propulsive technique between the front crawl stroke and the butterfly. The aim of this study was, therefore, to investigate if the hand propulsive technique of the front crawl stroke is different from the one for the butterfly.
Method The dynamic pressure approach (Kudo and Lee, 2010) was used to estimate hand propulsion while the three skilled swimmers (international level) swam the front crawl stroke and the butterfly at their race pace at the swimming pool where the motion capture system (Qualysis, Sweeden) was set up above and under water. Twelve pressure sensors and three retro-reflective markers were attached on the right hand of the swimmers. Propulsion, propulsive drag, and propulsive lift exerted by the hand (P, PD, and PL) were estimated in the insweep and upsweep phases of both strokes using the measurements of the dynamic pressures and hand kinematics. Ratio of hand propulsive drag to hand propulsive lift (PD/PL) was computed.
Results Mean P and PL in the insweep of the butterfly (56 and 24 N) were greater than for the front crawl stroke (46 and 15 N) while mean PD in the insweep of both swimming strokes was similar. Mean P, PD, and PL in the upsweep of the butterfly were similar to the ones for the front crawl stroke. The swimmers exerted 2 times greater PD than PL in the insweep of the front crawl stroke while the other values of PD/PL were approximately 1.
Table 1 Mean and standard deviation of P (N), PD (N), and PL (N) and ratio of PD to PL
Front crawl stroke Butterfly
P PD PL PD/PL P PD PL PD/PL
Insweep 46 (9) 31 (8) 15 (4) 2.1 56 (20) 31 (9) 24 (11) 1.3
Upsweep 39 (16) 22 (13) 17 (9) 1.3 39 (11) 21 (4) 18 (6) 1.2
Conclusion The swimmers used the different stroke technique between the front crawl stroke and the butterfly in the insweep phase. The swimmers exerted greater lift force with the hand in the insweep phase of the butterfly, compare do the front crawl stroke. As a consequence, the swimmers exerted more hand propulsion in the butterfly than the one in the front crawl stroke. This can be due to the movement of trunk undulation in the butterfly. Further study is to investigate the hand movement relative to the trunk and upper arm in the butterfly.
References Kudo, S. & Lee, M. K. (2010). Prediction of propulsive force exerted by the hand in swimming. In P. L. Kjendlie, R. K. Stallman, and
J. Cabri (Eds.), Biomechanics and Medicine in Swimming XI (pp112–114). Oslo: Norwegian School of Sport Science.
BMS2014—ABSTRACTS HANDBOOK 75

Maglischo, E. W. (1993). Swimming even faster. California: Mayfield Publishing Company.
Presenter Dr Shige Kudo is a senior academic staff at Republic Polytechnic. He received a PhD in Biomechanics from School of Physical Education, University of Otago, New Zealand. Shige has been studying the hand propulsion during swimming, the effect of hand acceleration on hydrodynamic force on the hand, and kinematics of aquatic-based walking.
Effect on body kinematics of sculling propulsion in displacement Raul Arellano1, Gracia Lopez-Contreras1, Blanca De la Fuente2, Esther Morales1, Sonia Taladriz1, Lara Gomes3 1Faculty of Sports Sciences, University of Granada, Spain, 2Altitude Training Center of Sierra Nevada, CSD, Spain, 3Universidade Federal do Vale do Sao Francisco, Brasil
Introduction Sculling is a basic propulsive action with four hand movements: outward, supination, inward and pronation. Analysis 3D showed a zigzag path, where hand displacement is mostly forward, with strong hand rotations during the direction’s change (Arellano, 2011). The study aim was to know the effect on body kinematic of sculling propulsion in displacement.
Method Twenty-three subjects participated in the study. Each performed two 20m trials using a normal sculling (arms and elbows fixed close to the water surface making and angular displacement of forearm and hand). A linear encoder tethered to the swimmer’s belt allowed intra-cyclic speed recordings (200 Hz) synchronised with a bottom view video cameras PAL 50Hz. The instantaneous and average hip speed (v) and acceleration (a) were obtained during no less than six sculling cycles. A Butterworth filter with a cut-off frequency of 4Hz was applied. Sculling rate (sr – Hz) and sculling length (sl – m/cycle) were obtained.
Results The average values were: v = 0.48±0.09 m/s, sr=1.32±0.17 Hz and sl=0.36±0.07 m/cyc. A sequentially variation of v and a have been found, specifically related with the propulsive phases. The mean a values were close to zero, showing relevance their peak positive and negative values (range -0.25 to 0.4). The fixed and horizontal position of the body allowed the calculation of total Drag (D=ma) using inverse dynamics2 and for hence the sculling propulsion (D= -15.75 to 26N). Peak +a values were located during the second part of inward and outward hand’s movements and peak—a after transitional rotating phases (pronation and supination)
Conclusions The values of propulsion obtained thanks to the application of inverse dynamics will be a reference to future measurements based on 3D hand kinematics (quasi-static approach), CFD simulations and PIV measurements.
References 1 Arellano, R. Transferring applied hydrodynamics to technical training: ‘The Sculling Project’. Portuguese Journal of Sport
Sciences, Porto, n.11 (sup. 3), p.69–72, 2011.
2 Vilas-Boas, J.P., et al., Determination of the drag coefficient during the first and second gliding positions of the breaststroke underwater stroke. J Appl Biomech, 2010. 26(3): p. 324–31.
76 BMS2014—ABSTRACTS HANDBOOK

Acknowledgments Project funded by Spanish Ministry of Science and Innovation, VI National Plan for Research, Development and Technological Innovation (I+D+i) 2005–2008, Ref: DEP2009-08411.
Presenter Raul Arellano is a professor at the University of Granada, Spain. He is the chief of Biomechanics for the Spanish Olympic Swimming Team. His research interests are propulsion hydrodynamics, swimming competition analysis, swimming start biomechanics.
Difference of hydrodynamic force on foot between front crawl 6-beat and flutter kicking Hiroshi Ichikawa1, Akihiro Kuriki1, Shoichiro Taba1, Masahiro Taguchi1 1Fukuoka University
Introduction The 6-beat kick, which is the most popular rhythm between arms and legs in front crawl swimming, includes three leg beats per one arm stroke (Maglischo E.W. 2003). The three kicking motions would be not same kinematically, because they were affected by rolling motion of whole body. The purpose of the study was to investigate the hydrodynamic difference between 6-beat kicking in front crawl swimming and flutter kicking without rolling of the whole body.
Method A male well-trained college swimmer, whose record of 100m freestyle was 53.5sec, participated the experiment as subject. Trials were 25m kicking with holding kickboard by upper limbs and 25m front crawl swimming with 6-beat kicking. Pressure on the swimmer’s feet was measured during each trial. The pressure sensors were attached on the swimmer’s the 3rd metacarpophalangeal joint (MP joint) of the dorsal and planter sides on both feet. The difference of pressure between dorsal and planter side on each foot was calculated to evaluate hydrodynamic force exerted on swimmer’s foot. And the motion of swimmer’s right upper and lower limb was recorded during 10m to 15m in each trial by underwater camera. The positions of joints of the limbs on the sagittal plane were calculated by two dimensional DLT method.
Results It was observed that the difference of pressure was positive, which meant the larger pressure on the dorsal side than the planter side, during downbeat and negative during upbeat in both kicking and 6-beat trials. In kick trial, the difference of pressure repeated the similar pattern corresponding to the down-upbeat of legs. In 6-beat trial, the positive peak difference of pressures were not similar in 3 downbeats during one stroke cycle. The largest peak in right leg downbeat was observed during downsweep phase of right arm, shortly after the right side hip joint reached deepest point.
Conclusions It would be different between kicking without rolling and 6-beat kicking with rolling hydrodynamically. The whole body rolling would affect kicking motion and produce different hydrodynamic force on swimmer’s foot in 6-beat front crawl swimming.
References Maglischo E.W. Swimming Fastest. Human Kinetics, 2003.
Presenter Dr Hiroshi Suito works at the Aichi Gakuin University in the Faculty of Psychological and Physical Science.
A method to calculate the vertical force produced during the eggbeater kick Nuno Oliveira1, Ross Sanders1,2 1The University of Edinburgh, 2The University of Sydney
Introduction The eggbeater kick is a technique used in water polo and synchronised swimming. Assessing eggbeater kick performance or comparing different performers has been done by determining the height achieved during the kick in the vertical position (Sanders, 1999; Homma & Homma, 2006; Klauck, 2006). Such methods are limited to the
BMS2014—ABSTRACTS HANDBOOK 77

position of one anatomic marker (i.e. vertex, trochanter) and do not account for the subject’s mass or buoyancy factors. This study develops a method to determine the vertical force produced during the eggbeater kick.
Methods Twelve water polo players were recorded by four underwater video cameras and one above water camera while executing the eggbeater kick in the vertical position. Subjects were instructed to maintain as high a position as possible for as long as possible. Anthropometric data were collected using the ‘eZone’ method (Deffeyes & Sanders, 2005; Jensen, 1978). Three dimensional coordinates for the lower limbs comprising the feet, shanks and thighs (FST) and two dimensional coordinates of the above water top of the sternum marker representing the head, arms and trunk (HAT) were manually digitised from the video recordings. To determine the weight and buoyancy factors each subject was weighed and digitised at different water levels from the bottom of the sternum to the neck while suspended in the vertical position using a swimming pool hoist and a harness. A subject-specific second degree regression equation was established from the net weight-buoyancy force and height data to enable prediction of the weight-buoyancy force contribution to net vertical force given the height from the digitised video data as input. The vertical force produced during the cycle at any given time (t) was calculated using the formula:
where is calculated from the regression equation, is the vertical acceleration of the FST system centre of mass, and is the vertical acceleration of the HAT system.
Conclusions The present study suggests a method to obtain instantaneous net force during the eggbeater kick. Anthropometrics of individual subjects are taken into account and it offers the possibility to establish a relationship between the force produced and other variables calculated during the cycle such as pitch angles of the feet and speed of the feet.
References Deffeyes, J. and Sanders, R.H. (2005). ‘Elliptical zone body segment modeling software: digitising, modelling and body segment
parameter calculation’. In Q. Wang (Ed.) Proceedings of XXIII International Symposium on Biomechanics in Sports. The China Institute of Sports Science, (pp. 749–752) Beijing.
Homma, M. & Homma, M. (2005). Coaching points for the technique of the eggbeater kick in synchronized swimming based on three-dimensional motion analysis. Sports Biomechanics, 4, 73–87.
Jensen, R.K. (1978). ‘Estimation of the biomechanical properties of three body types using a photogrammetric method’. Journal of Biomechanics, 11: 349–358.
Sanders, R.H. (1999a). Analysis of the eggbeater kick used to maintain height in water polo. Journal of Applied Biomechanics, 15, 284–291.
Klauck, J., Daniel, K. & Bayat, M. (2006). Goalkeeper’s eggbeater kick in water polo: Kinematics, dynamics and muscular coordination. Portuguese Journal of Sport Sciences, 6, 58.
Presenter Nuno Oliviera is a PhD Student at the Center for Aquatics Research and Education (CARE) at the University of Edinburgh. His background includes studies in sport science and exercise physiology. Current research focus on 3D kinematics and electromyography including the eggbeater kick. Research interests in biomechanics of human performance and rehabilitation.
Variability in coach assessments of technique in front crawl sprint swimming Gina Sacilotto1,3, Peter J Clothier2, Nick Ball3, Bruce R Mason1 1Australian Institute of Sport, 2University of Western Sydney, 3University of Canberra
Introduction When critiquing swim technique, coaches often rely on basic stroke mechanics (stroke rates and lengths) to assess performance and recommend technique alterations based on qualitative analysis. To date no research has investigated the variability between elite coach qualitative assessment of swim technique. Therefore, the aim of this investigation was to compare coach ratings on front crawl sprint swimmers to examine the degree of variability between assessments of technique.
78 BMS2014—ABSTRACTS HANDBOOK
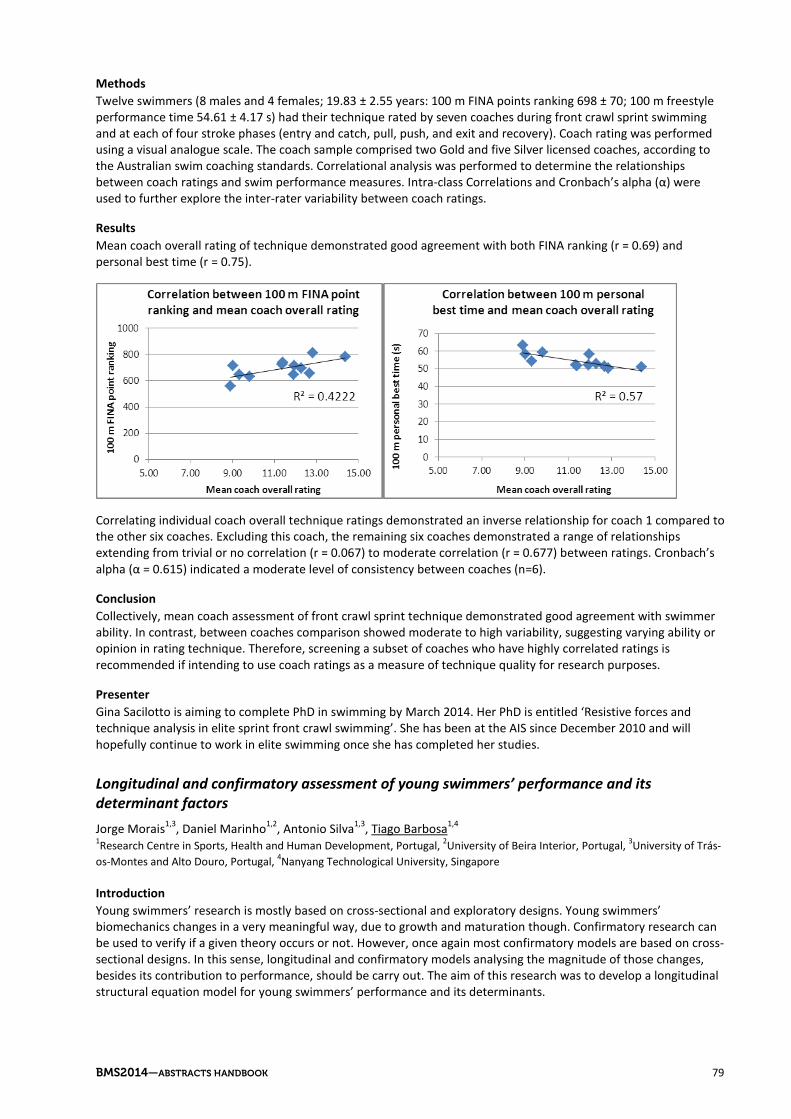
Methods Twelve swimmers (8 males and 4 females; 19.83 ± 2.55 years: 100 m FINA points ranking 698 ± 70; 100 m freestyle performance time 54.61 ± 4.17 s) had their technique rated by seven coaches during front crawl sprint swimming and at each of four stroke phases (entry and catch, pull, push, and exit and recovery). Coach rating was performed using a visual analogue scale. The coach sample comprised two Gold and five Silver licensed coaches, according to the Australian swim coaching standards. Correlational analysis was performed to determine the relationships between coach ratings and swim performance measures. Intra-class Correlations and Cronbach’s alpha (α) were used to further explore the inter-rater variability between coach ratings.
Results Mean coach overall rating of technique demonstrated good agreement with both FINA ranking (r = 0.69) and personal best time (r = 0.75).
Correlating individual coach overall technique ratings demonstrated an inverse relationship for coach 1 compared to the other six coaches. Excluding this coach, the remaining six coaches demonstrated a range of relationships extending from trivial or no correlation (r = 0.067) to moderate correlation (r = 0.677) between ratings. Cronbach’s alpha (α = 0.615) indicated a moderate level of consistency between coaches (n=6).
Conclusion Collectively, mean coach assessment of front crawl sprint technique demonstrated good agreement with swimmer ability. In contrast, between coaches comparison showed moderate to high variability, suggesting varying ability or opinion in rating technique. Therefore, screening a subset of coaches who have highly correlated ratings is recommended if intending to use coach ratings as a measure of technique quality for research purposes.
Presenter Gina Sacilotto is aiming to complete PhD in swimming by March 2014. Her PhD is entitled ‘Resistive forces and technique analysis in elite sprint front crawl swimming’. She has been at the AIS since December 2010 and will hopefully continue to work in elite swimming once she has completed her studies.
Longitudinal and confirmatory assessment of young swimmers’ performance and its determinant factors Jorge Morais1,3, Daniel Marinho1,2, Antonio Silva1,3, Tiago Barbosa1,4 1Research Centre in Sports, Health and Human Development, Portugal, 2University of Beira Interior, Portugal, 3University of Trás-os-Montes and Alto Douro, Portugal, 4Nanyang Technological University, Singapore
Introduction Young swimmers’ research is mostly based on cross-sectional and exploratory designs. Young swimmers’ biomechanics changes in a very meaningful way, due to growth and maturation though. Confirmatory research can be used to verify if a given theory occurs or not. However, once again most confirmatory models are based on cross-sectional designs. In this sense, longitudinal and confirmatory models analysing the magnitude of those changes, besides its contribution to performance, should be carry out. The aim of this research was to develop a longitudinal structural equation model for young swimmers’ performance and its determinants.
BMS2014—ABSTRACTS HANDBOOK 79

Methods Thirty young talented swimmers (14 boys and 16 girls) were followed-up for a competitive season. Evaluations occurred at the beginning (M1-baseline, i.e. immediately before the start of the season), 4 weeks after the start of the season (M2); in the middle (M3) and at the end of the season (M4). Swimmers performed 3 maximal trials of 25-m at Front Crawl with a push-off start. A speedo-meter cable (Swim speedo-meter, Swimsportec, Hildesheim, Germany) was attached to the swimmers’ hip. Two extra maximal trials were performed to assess the hydrodynamic profile with the Velocity Perturbation Method. Active drag, coefficient of active drag, power to overcome drag, stroke frequency, speed fluctuation and arm’s propelling efficiency were selected as main outcomes. Official performance at the 100-m freestyle race was retrieved from a database (less than two weeks between official race and data collection). Structural equation modelling was used to design the longitudinal confirmatory model.
Results Growth confirmatory model showed that performance revealed significant differences between M1 and M2 and M3. In M2 and M3, performance achieved 59% and 99% of the last moment (M4). Overall the selected variables showed a significant direct effect on performance, being the active drag and power to overcome drag the ones with higher contribution. Gender had a significant effect on performance. For the selected variables, the models’ goodness-of-fit ranged between 1.40 ≤ CMIN/DF ≤ 3.74 (i.e. good-reasonable).
Conclusions It was possible to develop a longitudinal confirmatory model for young swimmers’ performance and its determinant factors. Overall the selected variables had a significant direct effect on young swimmers’ performance.
Presenter Dr Tiago Barbosa received a PhD in Sport Sciences—Biomechanics and Physiology from the University of Porto, Portugal. Tiago is with a special leave from the Polytechnic Institute of Braganca (Portugal) where he holds an associate professor position, being at this moment a faculty staff at the Nanyang Technological University (Singapore). Besides that, he holds a part-time position as scientific consultant and sports analyst for the Portuguese Swimming Federation.
CONCURRENT SESSION 6B—PHYSIOLOGY 6
In-water resisted sprint swim training for age-group swimmers Kosuke Kojima1, Chris Brammer1, Tyler Sossong1, Takashi Abe1, Joel Stager1 1Counsilman Center for the Science of Swimming, Indiana University, USA
Introduction While resisted swim training appears to invoke positive effects in adults, results of similar training paradigms with children are unavailable. The purpose of this study was to examine the efficacy of resisted swim training on sprint swim performance and skeletal muscle mass (SMM) in age-group swimmers when compared to typical non-resisted sprint swim training.
Methods Eighteen well-trained age-group swimmers (6 day∙wk-1, 1.5 hr∙session-1, average 3500 m∙session-1) were divided into age-, size-, and performance-matched groups: resisted training (RT, five per sex) and non-resisted sprint training (ST, four per sex). Progressive swim power tests using a semi-tethered training device, Power Rack (P-rack), were used to determine peak power per stroke (PP∙STK-1) at weeks 0, 5, and 11. An Electronic Swim Power Trainer (E-rack) was used to measure their peak power (PPE-rack). RT using the P-rack and a resistive training load (70–80% of the workload at PP∙STK-1) was completed twice per week, consisting of 10 repetitions of a 10-metre sprint on a 1-minute interval. ST utilised the same sprint set without the resistive load. Maximum swim velocity was recorded from mid-pool freestyle sprint (13.7Fr) and 50-metre long course competition (50Fr) times. Muscle tissue thickness was measured using B-mode ultrasound at nine sites of the body for estimating total and regional SMM.
Results Following training, increased height (0.7% and 0.7%), SMM (5.9% and 3.7%), PPE-rack (12.1% and 9.2%), 13.7Fr (2.0% and 4.1%), and 50Fr (3.8% and 3.9%) were observed for both RT and ST, respectively (p < 0.001). Two-way repeated measures ANOVA revealed no time × group interaction for these variables. The 50Fr was correlated with SMM (r =
80 BMS2014—ABSTRACTS HANDBOOK

0.52 and 0.51), PP∙STK-1 (r = 0.77 and 0.88), PPE-rack (r = 0.80 and 0.90), and 13.7Fr (r = 0.92 and 0.94) at weeks 0 and 11, respectively (p < 0.03).
Conclusion As a means to improve sprint swim performance in age-group swimmers, a 10-week of resisted swim training is not any more effective than traditional non-resisted sprint swim training. Despite relationships between SMM, power, and sprint performance and evidence of growth-related changes, no training-specific increases in SMM were evident.
Presenter Kosuke Kojima is a second year PhD student in Human Performance at Indiana University. His academic interests include growth and development, pulmonary and respiratory physiology, and swim performance and training. Ultimately, he aims to bridge the gap between the science of swimming and coaching of swimmers.
Diagnostics of specific working capability and evaluation of adaptation to training workloads during sport season in open water swimmers Alexander Petriaev1 1Saint Petersburg National State University of Physical Education
Introduction The aim of this study was to design a method for diagnostics of specific working capability of swimmers in open water with a specific competitive activities
Method The evaluation of the special preparedness was conducted by means of a swimming step test in form of 10 х 400 m with 1 minute of rest. The individual values of swimming speed for each segment is set during the test. The initial speed is assigned on the basis of 80% of the personal best of the swimmer, with graded enhancement of speed on 400 m with each next segment, reaching the maximum speed on the last one. The test design is as follows: first load step—3 x 400 m, second—2x400 m, third—2x400 m, fourth—2x400 m, and the last one—400 m maximum. The following parameters were analysed after each step’s segment: time of the segment, stroke rate, stroke length, heart rate (via POLAR telemetric monitor). The blood lactate concentration was measured using the Lactate Scout lactometer after each load step at the second minutes of rest. We’ve treated a total of 90 tests among women and 88 among men, all the subjects are national and international level sportsmen specialised in long-distance swimming.
Results Analysing the correlation between the swimming speed and the lactate concentration in the tests we’ve built a lactate curve, which was approximated to exponential curve (fig.1 left). Dividing the derived curve is sections we’ve found the swimming speed zone’s borders, which were different in nature of the energy supply [1].
400 metres segments used in the tests were chosen in correspondence with the average interval between the turning buoys on the distances of 5, 10 and 25 kilometres used in World Championship 2013 in Barcelona. The suggested test corresponds with the features of swimmers’ competitive activities and at the same time permits achieving the stable status of functional systems during the workload step.
Fig 1 Examples of the calculation of individual lactate curves swimmers in the test 10x400 m with increases velocity (left); change of lactate curves in a year training cycle (right).
BMS2014—ABSTRACTS HANDBOOK 81

Blood lactate concentration was: at first step among boys 1,9±0,5 mmol/L, among girls 1,9±0,6 mmol/L; at the end of the 10 pieces among men 9,7±2,5 mmol/L, among women 7,4±1,9 mmol/L.
Conclusions The attribute of the annual cycle of training is increasing speed of swimming in the zone of aerobic productivity (from aerobic threshold—blood lactate 2 mmol/L, to VO2max—blood lactate 8 mmol/L) (fig.1 right). Systematic studying of the dynamics of lactate curves in training allows us to analyse and adjust workload based on it’s size and it’s primary impact on certain systems of the organism.
References 1 Mader, A, H. Liesen, H. Heck, H. Philipp, R. Rost, P. Schürch, and H. Hollmann. Zur Beutreilung der sportspezifischen
Ausdauerleistungsfähigkeit im Labor. Sportarzt Sportmed. 27: 80–88/109–112, 1976.
Presenter Dr Alexander Petriaev is a professor of the swimming department at Saint-Petersburg National State University of Physical Education, Sports and Health. He received his PhD in 1998 from the Research Institute of Physical Culture, St-Petersburg. He is the Organiser and Editor of seven International swimming conference ‘Swimming. Research, training, hydrorehabilitation’ from 2001 to 2013.
Comparing methods for summarising a training load in prediction models of swimming performance Charlotte Scordia1,2, Marta Avalos1,2, Philippe Hellard3,4 1Univ. Bordeaux, ISPED, Centre INSERM U897-Epidemiologie-Biostatistique F-33000, 2INSERM, ISPED, Centre INSERM U897-Epidemiologie-Biostatistique F-33000 Bordeaux, 3Research Department, French Swimming Federation, Paris, France, 4IRMES, Institut de Recherche bioMedicale et d’Epidemiologie du Sport, France
Introduction Training quantifications are valuable for monitoring and prescribing elite swimmers training and indispensable in mathematical models that attempt to accurately predict performance. Modelling the association of training with performance raises an important issue: how should we account for volumes at different training intensities? Mujika et al.1 constructed a training load by adding weighted (by a priori constants representing energetic intensities) volumes from each intensity. Avalos et al.2 computed a training load as the sum of individually normalised (expressed as a percentage of the individual maximum) training intensities. In this study we compared the predictive accuracy of these methods to others based on: alternative normalisations, summary scores derived from data, and machine learning techniques, with recognised predictive qualities, such as Partial least squares or Lasso3.
Methods Training volumes at seven intensity levels (in kilometres and minutes per week, for water and dry-land workouts, respectively) and performances in competition of 138 professional French swimmers were collected during 20 seasons, between 1991 and 2011. Training intensities were determined from lactate thresholds, using measurements of blood lactate concentrations, updated several times throughout the season1-2. This is an observational study with no control on training programs. We assumed that swimmers may react differently to the same training load (interindividual differences) and over time (intraindividual differences), thus we used mixed-effects models adjusted for sex, age, swim distance and specialty. The comparison criterion was the cross-validated mean square prediction error to avoid for over-optimistic results about the quality of the modelling procedures3.
Results Summary scores for three training loads (aerobic/anaerobic/dry-land workouts) with data derived weights showed the best results. However, cross-validated prediction errors were close relative to their variances, which were high.
Conclusions The use of complex machine learning techniques did not lead to more accuracy in predicting performance. Although data derived scores showed the lowest prediction error, the statistical variability was too high for being conclusive. A possible explanation is that the lactate sensitivity to extraneous factors (mode of exercise, technique quality of training, diet or sleep quality prior to test) and the subject-specific variations in lactate thresholds4 introduce not negligible measurement error. As practical recommendation, we suggest completing lactate measurements with athlete/coach questionnaires to better assess the physiological stress associated with the training load. Also, errors-in-variables models might be more appropriated5.
82 BMS2014—ABSTRACTS HANDBOOK

References 1 Mujika et al. Modeled responses to training and taper in competitive swimmers. Med. Sci. Sports Exerc. 1996.
2 Avalos et al. Modeling the training performance relationship using a mixed model in elite swimmers. Med Sci Sports Exerc 2003.
3 Hastie et al. The elements of statistical learning. Data mining, inference and prediction. Springer, 2009.
4 Borresen et al. The quantification of training load, the training response and the effect on performance. Sports Med 2009.
5 Carroll et al. Measurement error in nonlinear models: a modern perspective. Chapman & Hall 2006.
Presenter Marta Avalos is Associate Professor of Public Health (Biostatistics), Epidemiology and Biostatistics INSERM research centre, Bordeaux School of Public Health, Univ Bordeaux Segalen, France.
CONCURRENT SESSION 6C—BIOMECHANICS 6
The effect of pullout timing on breaststroke turn performance Alison Alcock1 1Scotland Institute of Sport, UK
Introduction In breaststroke races, between 20 and 40% of the total event time is spent turning, and the turn times are the most variable of all the swimming strokes, likely because of the greater technical expertise required (Blanksby et al., 1998). The aim of this study was to determine the effect of the timing of the breaststroke pullout on overall turn performance.
Method Five Scottish national-level swimmers (specialist breaststrokers) each performed eight breaststroke turns, four using their ‘normal’ pullout technique, and four using an ‘early’ pullout whereby less time was spent in the initial glide phase and less time was spent at the end of the pullout before the start of the recovery. Trials were recorded using above- and under-water video cameras situated perpendicular to the plane of motion and calibrated for 2D kinematic analysis. The above water camera was used to measure breakout time, breakout distance and the overall performance outcome which was the time from the wall to 13m (this was the maximum distance available within the field of view). A velocity profile of the swimmer from the point of leaving the wall to the point of breakout was achieved by digitising the hip of the swimmer using SiliconCoach Ltd, Dunedin New Zealand) and the under-water camera view.
Results The earlier pullout significantly improved the time taken to reach 13 m (p<0.01). The earlier pullout was on average 0.3 s faster than the normal pullout. The earlier pullout also resulted in a significantly shorter breakout distance and time compared with the normal pullout (p<0.05). The velocity profiles revealed that for these swimmers, the normal pullout contained a large amount of time travelling below their average free swimming speed (from race analysis data), and the earlier pullout reduced this.
Conclusions For these swimmers, the earlier pullout significantly improved the turn times. However consideration must be given to the fact that this also reduced the breakout distance and breakout time thus requiring the swimmers to start swimming earlier and take more strokes per lap which may have physiological implications in a race. The results of this study does not support previous findings that Olympic finalists and semi-finalists with better breaststroke turns travel a further distance underwater (Mason & Cossor, 2001). This may be due to the more elite Olympic swimmers performing the pullout at their optimal time but with a higher initial velocity and a better streamlined position, thus lengthening the amount of time and distance it takes for them to decelerate to their swimming speed. The velocity profiles showed that the optimal timing for the pullout was very individual and based on the time taken to reach their average swimming speed following the glide off the wall. To lengthen the breakout time and distance would require an increase in the initial velocity off the wall and/or the rate at which velocity is lost during the glide phases.
References
BMS2014—ABSTRACTS HANDBOOK 83

Blanksby, B.A., Simpson, J.R., Elliott, B.C. & McElroy, K. (1998). Biomechanical Factors Influencing Breaststroke Turns by Age-Group Swimmers. Journal of Applied Biomechanics, 14, 180–9.
Mason, B.R. & Cossor, J. M. (2001), Swim turn performances at the Sydney 2000 Olympic Games. In: Proceedings of XIX ISBS Conference, 65–69. San Francisco.
Presenter Dr Alison Alcock graduated from Liverpool John Moores University and then came to Australia after to do a three-month biomechanics work experience placement at the Australian Institute of Sport—which somehow turned into 7 years! At the AIS Alison mainly worked with swimming and women’s football. Alison moved to the Sportscotland Institute of Sport in 2011 where she now mainly works with swimming and curling, and manages projects in sport science and innovation.
Lower trunk muscle activity in butterfly swimming Jonas Martens1, Stijn Lievens1, Ingi Einarsson2, Ricardo Fernandes3, Filip Staes1, Daniel Daly1 1KU Leuven, Faculty of Kinesiology and Rehabilitation Sciences, 2University of Iceland, 3Universidade do Porto, Faculdade de Desporto
Introduction The activation patterns of propulsive swimming muscles such as latissimus dorsi or triceps are well documented, especially in the crawl and breaststroke1, but the number of studies on the activity of lower trunk muscles in butterfly is limited. A clear rise in activity of the rectus abdominis ‘in the early stage of the stroke’ was described2. A reciprocal activity in the rectus abdominis and erector spinae was noted and the cocontractions of these antagonistic muscles demonstrated their roles in trunk flexion and extension as well as in its stabilisation3. The purpose of this study was to analyse lower trunk muscle activation in butterfly swimming and examine how this muscle activity is related to arm and leg synchronisation.
Method Two national level male swimmers (PB on 100m butterfly: 56.80s and 59.89s) swam 2x12.5m butterfly at maximal speed without breathing in 3 conditions: full technique with a 2-beat leg kick, arms action only and leg kick only. EMG was obtained with 4 wireless units (KINE, 1600Hz), with the electrodes placed on the left and right Obliquus Externus (OE) and on the left and right Erector Spinae (ES) following the guidelines of SENIAM. To prevent water from interfering with the EMG signal, the units were protected with a water resistant second skin and sport tape. KINE software was used for EMG analysis. Raw data was integrated and normalised to the dynamic maximum. Four 50Hz video cameras recorded the swims in synchronisation with the EMG-signal. Dartfish Prosuite software was used to determine stroke phases and arm and leg synchronisation.
Results Figure 1 shows the average activation (full line) of the 4 investigated muscles in the 3 butterfly conditions ± SD (dotted lines) expressed as a % of the dynamic (y-axis) and related to the arm and leg synchronisation (x-axis).
84 BMS2014—ABSTRACTS HANDBOOK
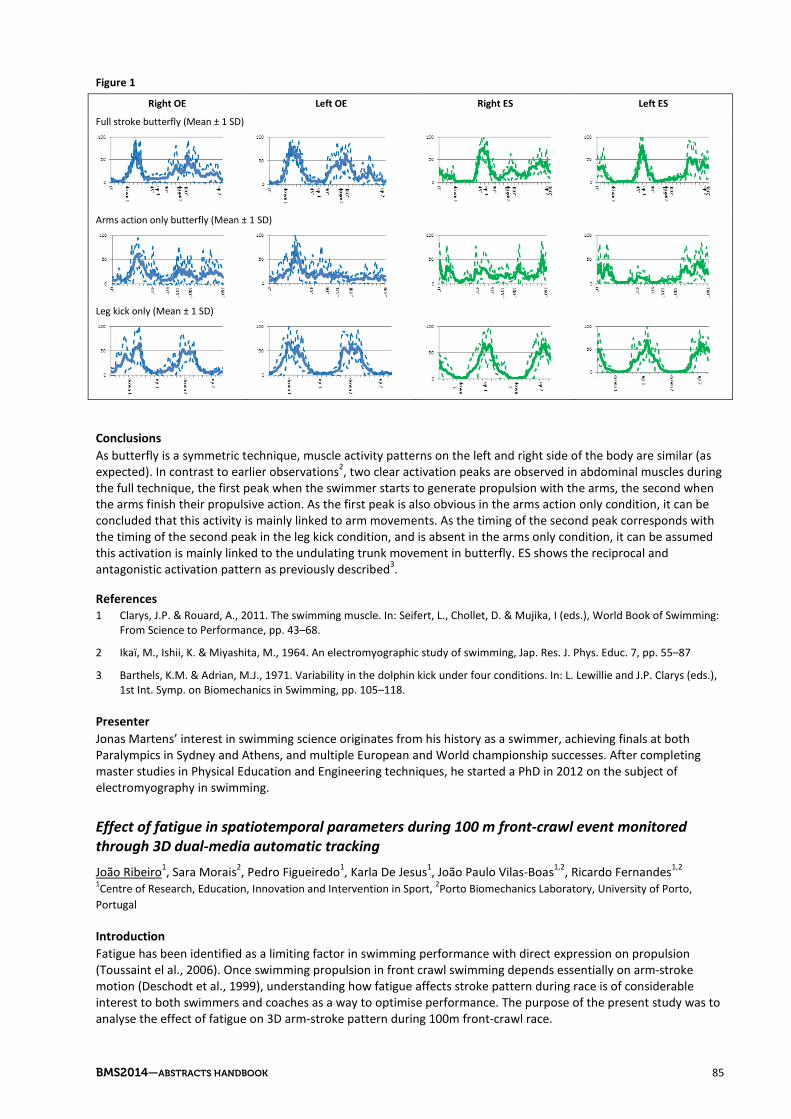
Figure 1
Right OE Left OE Right ES Left ES
Full stroke butterfly (Mean ± 1 SD)
Arms action only butterfly (Mean ± 1 SD)
Leg kick only (Mean ± 1 SD)
Conclusions As butterfly is a symmetric technique, muscle activity patterns on the left and right side of the body are similar (as expected). In contrast to earlier observations2, two clear activation peaks are observed in abdominal muscles during the full technique, the first peak when the swimmer starts to generate propulsion with the arms, the second when the arms finish their propulsive action. As the first peak is also obvious in the arms action only condition, it can be concluded that this activity is mainly linked to arm movements. As the timing of the second peak corresponds with the timing of the second peak in the leg kick condition, and is absent in the arms only condition, it can be assumed this activation is mainly linked to the undulating trunk movement in butterfly. ES shows the reciprocal and antagonistic activation pattern as previously described3.
References 1 Clarys, J.P. & Rouard, A., 2011. The swimming muscle. In: Seifert, L., Chollet, D. & Mujika, I (eds.), World Book of Swimming:
From Science to Performance, pp. 43–68.
2 Ikaï, M., Ishii, K. & Miyashita, M., 1964. An electromyographic study of swimming, Jap. Res. J. Phys. Educ. 7, pp. 55–87
3 Barthels, K.M. & Adrian, M.J., 1971. Variability in the dolphin kick under four conditions. In: L. Lewillie and J.P. Clarys (eds.), 1st Int. Symp. on Biomechanics in Swimming, pp. 105–118.
Presenter Jonas Martens’ interest in swimming science originates from his history as a swimmer, achieving finals at both Paralympics in Sydney and Athens, and multiple European and World championship successes. After completing master studies in Physical Education and Engineering techniques, he started a PhD in 2012 on the subject of electromyography in swimming.
Effect of fatigue in spatiotemporal parameters during 100 m front-crawl event monitored through 3D dual-media automatic tracking João Ribeiro1, Sara Morais2, Pedro Figueiredo1, Karla De Jesus1, João Paulo Vilas-Boas1,2, Ricardo Fernandes1,2 1Centre of Research, Education, Innovation and Intervention in Sport, 2Porto Biomechanics Laboratory, University of Porto, Portugal
Introduction Fatigue has been identified as a limiting factor in swimming performance with direct expression on propulsion (Toussaint el al., 2006). Once swimming propulsion in front crawl swimming depends essentially on arm-stroke motion (Deschodt et al., 1999), understanding how fatigue affects stroke pattern during race is of considerable interest to both swimmers and coaches as a way to optimise performance. The purpose of the present study was to analyse the effect of fatigue on 3D arm-stroke pattern during 100m front-crawl race.
BMS2014—ABSTRACTS HANDBOOK 85

Method Six national level swimmers (25.47±4.69 yrs; 1.82±0.04 m and 73.14±6.14 kg) performed a 100m front-crawl test at maximal intensity. The event was recorded with eight underwater and seven dry land cameras (Qualisys AB, Gothenburg, Sweden) using a seventy-three, full body, reflective marker setup. One complete stroke cycle, without breathing, was analysed for each 25m by means of Qualisys Track Manager (Qualisys AB, Gothenburg, Sweden) and Visual 3D software (C-Motion Inc., Germantown, MD, USA). Swimming velocity, stroke frequency, stroke length, backward amplitude, amplitude slip, hand depth, hand width and range, hand velocity and index of coordination were assessed for each 25m lap (Figueiredo et al., 2013). Differences between the four laps were considered using a repeated measure ANOVA with LSD post-hoc test (p≤.05).
Results Mean±SD, p, and partial eta squared of ANOVA are displayed in Table 1 for spatiotemporal parameters during the 100m race.
Table 1 Mean±SD and statistical comparisons between the laps across the 100m race for the spatiotemporal parameters
Parameters Lap 1 Lap 2 Lap 3 Lap 4 p Partial η2
Velocity (m.s-1) 1.53±0.07 1.45±0.08a 1.33±0.05a,b 1.33±0.07a,b < 0.001 0.83
Stroke frequency (Hz) 0.77±0.08 0.74±0.07 0.69±0.06 0.73±0.04c 0.04 0.42
Stroke length (m) 1.98±0.16 1.97±0.22 1.96±0.13 1.83±0.16a,b,c 0.01 0.51
Backward amplitude (m) 0.53±0.06 0.55±0.05 0.53±0.04 0.56±0.04a,c 0.005 0.56
Amplitude slip (m) 0.12±0.14 0.10±0.15 0.07±0.24 0.03±0.15 0.25 0.24
Hand depth (m) -0.60±0.07 -0.60±0.06 -0.61±0.08 -0.60±0.07 0.59 0.11
Hand width (m) 0.38±0.13 0.35±0.11 0.39±0.11 0.37±0.08 0.22 0.25
Hand range (m) 0.31±0.09 0.30±0.09 0.33±0.08 0.33±0.08 0.06 0.37
Hand velocity (m.s-1) 2.40±0.22 2.30±0.25a 2.12±0.18a,b 2.07±0.14a,b < 0.001 0.84
Index of coordination -10.28±2.22 -11.59±3.00 -10.15±4.20 -8.09±3.34a,b 0.04 0.43 a,b,c Significantly different from the first, second and third lap, respectively. p<0.05.
Significant changes of analysed parameters were observed across the race, with exception of amplitude slip and hand depth, width and range.
Conclusion Fatigue promoted a swimming velocity decline throughout 100m race, as an effect stroke length and hand velocity decreased. Despite that, stroke frequency increased during the last lap as an attempt to maintain velocity. Moreover, swimmers adapted their inter-arm coordination (diminishing the lag time between propulsive phases), and increased the backward amplitude in the last lap. Once hand pattern remained constant along the race (as observed by the non significant variance of hand depth, width and range values), it suggests that swimmers adapt their coordination, rather than stroke pattern, as a response to overcome fatigue.
This fact highlights that the analysis of spatiotemporal variables under the influence of fatigue should be a part of training monitoring as a way to increase performance.
References Deschodt et al. (1999) Eur J Appl Phys, 80(3):192–199.
Figueiredo et al. (2013) Int J Sports Med, 34(1):49–55.
Toussaint et al. (2006) Med Sci Sports Exerc, 38(9), 1635–1642.
Acknowledgment This investigation was supported by grants of Portuguese Science and Technology Foundation (PTDC/DES/101224/2008) (SFRH/BD/81337/2011).
Presenter João Ribeiro is a research fellow of the Portuguese Foundation for Science and Technology. He is currently a PhD student in Faculty of Sport, University of Porto and collaborator of the Centre of Research, Education, Innovation and Intervention in Sport.
86 BMS2014—ABSTRACTS HANDBOOK

CONCURRENT SESSION 7B—PHYSIOLOGY 7
Changes in heart rate during headstand in water Sho Onodera1, Akira Yoshioka2, Sotaro Hayashi3, Tatsuya Saito3, Takuma Wada3, Megumi Murata3, Yasukiyo Tsuchida3, Yusuke Takagi4, Futoshi Ogita5, Hideki Hara6 1Kawasaki University of Medical Welfare, Japan, 2Kagawa University, Japan, 3Graduate School of Kawasaki University of Medical Welfare, Japan, 4Tezukayama University, Japan, 5National Institute of Fitness and Sports, Japan, 6Kokugakuin University, Japan
Introduction A previous study has clarified that heart rate (HR) significantly decreases during standing in water and that the decreases in HR depends upon the depth of immersion1. Headstand posture is often seen during synchronised swimming. However, it has been unclear whether changes in HR at headstand position in water shows the same as that in standing position or not. The purpose of this study was to clarify the changes in HR during headstand posture in water.
Methods Seven Japanese healthy males volunteered to participate in this study. We had informed consent prior to participate in this study. The measurements were done under two conditions, i.e. on land and in water in random order. Participants kept a headstand position on land or in a swimming pool for one min, and the subjects breathed through a compressed gas cylinder for scuba diving in water condition. Water depth was set at 160 cm. Water and room temperature was maintained at 30° and 28°, respectively. HR was continuously measured using water-proof HR monitor.
Results Figure 1 shows the changes in HR in both conditions. HR rapidly decreased within 30s from the beginning of headstand posture in water condition and maintained steady-state after that. The changes in HR in water condition were statistically significant (ANOVA, P<0.05).
On the other hand, HR responses on land condition did not change through the measurement. The HR in water condition (50 (SD: 5) bpm) was significantly lower than those on land condition (68 (SD: 9) bpm)(P<0.05).
Conclusion Our results revealed that HR during headstand in water decreases, which seems to be attributed to diving reflex and an increase in venous return.
BMS2014—ABSTRACTS HANDBOOK 87

Reference 1 Onodera S, et al. Effects of water depth on abdominals aorta and inferior vena during standing in water. J Gravit Physiol,
2001; 59–60.
Presenter Sho Onodera graduated with masters degree from Tokyu Gakugei University in 1980 and with his PhD from The Tokyo Jikeikai University school of Medicine in 1991. He is currently of professor at the Kawasaki University of Medical Welfare. He has been studying relation between characteristics of the water and aquatic exercise. He contributes to the spread of aqua fitness in Japan as Director of the Japan swimming clubs association and to the improvement of the physical fitness of Japanese as Chairperson of the general affairs of the Japanese Society of Physical Fitness and Sports Medicine.
Changes in urine volume and subjective micturition during sitting posture in water Takuma Wada1, Sotaro Hayashi1, Yuka Nose2, Sho Onodera1 1Kawasaki University of Medical Welfare, 2Yasuda Women’s University
Purpose The purpose of this study was to investigate the relationship of the urine volume, subjective micturition, reported thermal sensation, heart rate, blood pressure and rectal temperature during sitting posture in water.
Methods Nine healthy male subjects volunteered for this study. This study consisted of two experimental conditions: the land trial (L) and the water trial (W). The water level was set to the clavicle. Subjects participated in both conditions on different days. Measurement items were urine volume, subjective micturition, reported thermal sensation, heart rate, blood pressure and rectal temperature. The water temperature was 30 degrees Celsius. L condition assumed the sitting position on land for 120 minutes in total. Both conditions began with 30 minutes in a sitting posture on land. Then, for the next 30 minutes, only the W condition sat in water while the L condition sat on land. Finally, for the last 60 minutes, both conditions were back on land in a sitting posture.
Results Urine volume and Subjective micturition after immersion in water, recovery at 30 minutes and recovery at 60 minutes in the W condition was higher than that of L (p<0.05). Reported thermal sensation in water, between recovery at 5 minutes and recovery at 15 minutes in the W condition was higher than that of L (p<0.05). It was thought that it was too cold. Heart rate in water, recovery at 10 minutes and recovery at 15 minutes in the W condition was lower than that of L (p<0.05). Rectal temperature in water at 30 minutes and recovery at 10 minutes in the W condition was lower than that of L (p<0.05). Blood pressure in water and recovery in the W condition was lower than that of L (p<0.05). In water, venous return in the body increases by water pressure. From this a urine volume increased.
Conclusion 1 Urine volume and subjective micturition increases through inundation in water.
2 Urine volume decreases with progress at each time of recovery.
3 The decrease in urine volume at the time of recovery links to a subjective micturition.
Presenter Takuma Wada was interested in the water quality and relationship of exercise in water when he was a junior. He has continued the study after entering graduate school. He continues to study about diuretic action in water. He had his paper about the Effects of water immersion in various water levels on urine volume and subjective micturition announced at the 59th Annual Meeting of the Japan Society of Aerospace and Environmental Medicine in 2013 and won the award prize. He is scheduled to have his paper announced at the BMS congress.
88 BMS2014—ABSTRACTS HANDBOOK

Oxygen uptake kinetics and biomechanical behaviour at different percentages of VO2max Ana Sousa1, Pedro Figueiredo1, Joao Ribeiro1, Ana Silva1, Jailton Pelarigo1, Catarina Cascais1, Joao Paulo Vilas Boas1,2, Ricardo Fernandes1,2 1Centre of Research, Education, Innovation and Intervention in Sport, 2Porto Biomechanics Laboratory, LABIOMEP, University of Porto, Portugal
Introduction The dynamic oxygen uptake (VO2) kinetics at moderate and heavy exercise intensities are well documented in the literature, namely in treadmill running and cycle ergometer exercise1. In swimming, knowing that maximal oxygen uptake (VO2max) is considered one of the primary areas of interest in training and performance diagnosis2, it is odd that VO2 kinetics related studies near this intensity are almost non-existent. The purpose of this study was to compare the VO2 kinetics during three square wave swimming transitions from rest to different percentages of VO2max intensity.
Method Five national level male swimmers (36.6±2.8yrs, 68.1±3.9kg, 1.78±5.3m) performed an incremental protocol to VO2max and corresponding minimum velocity assessment (vVO2max) and three square wave exercise transitions (from rest to 95%, 100% and 105% of VO2max intensity) to assess its time to exhaustion. Ventilatory parameters were collected bxb (and averaged each 5s) using a portable and telemetric gas analyser (K4b2, Cosmed, Italy). A double-exponential model—VO2(t)=A0+A1*(1-exp-(t-TD1/τ1))+A2*(1-exp-(t-TD2/τ2))—and a nonlinear least squares method was implemented for baseline VO2 (A0), amplitudes (A1 and A2), time delays (TD1 and TD2) and time constants (τ1 and τ2) assessment, representing the VO2 kinetics fast (1) and slow (2) components. Biomechanical variables (stroke length—SL, stroke frequency—SF and stroke index—SI) were also assessed on all trials. Comparison between conditions was done using ANOVA repeated measures with Bonferroni post-hoc test (p≤.05).
Results Table 1 shows the mean ± SD values for the VO2 kinetics and biomechanical parameters, with no differences observed for the kinetic parameters between trials, with the exception of A2 between 100% of VO2max and the other conditions. SF increased as intensity raised and SI was lower in 95% and 100% compared to 105% of VO2max intensity.
Exercise intensity
A0
ml.kg-
1.min-1
A1
ml.kg-
1.min-1 TD1 s
τ1 s
A2 ml.kg-
1.min-1 TD2 s
τ2 s
SF Hz
SL m
SI m2/s
95% 17.5±1.1 37.4±5.2 9.1±3.7 14.1±3.2 4.3±1.3 120.5±36.7 87.8±22.7 1.18±0.13* 1.15±0.1 1.54±0.2#
100% 18.2±2.4 35.7±3.1 7.4±2.3 17.4±3.6 7.4±0.8* 76.9±24.4 63.1±13.1 1.27±0.12* 1.12±0.1 1.58±0.2#
105% 18.9±3.9 36.7±5.6 9.1±4.6 19.8±11.4 2.6±0.6 72.5±18.8 72.6±5.6 1.32±0.13* 1.12±0.1 1.67±0.2
*Different from the other two conditions; #Different from condition 105% of VO2max intensity
Conclusions Although presently there is no consensus regarding whether or not the τ1 is unchanged for work rates in the heavy and severe domains compared to the moderate intensity3, our results show that the exercise intensities performed were not sufficient to promote significant changes in both fast and slow components. However, the different intensities promoted an increase in SF and SI, which reflects the mechanic adaptation of the swimmers at higher velocities.
References 1 Sousa et al. (2011) VO2 Kinetics in 200-m Race-Pace Front Crawl Swimming. Int J Sport Med, 32 (10): 765–770.
2 Fernandes et al. (2008) Time limit at VO2max velocity in elite crawl swimmers. Int J Sport Med, 29 (2): 145–150.
3 Jones, A. & Poole, D. (2007). Introduction to oxygen uptake kinetics and historical development of the discipline. In: Jones, A & Poole, D. (eds.): Oxygen uptake kinetics in sport, exercise and medicine. Routledge, London. This study was supported by the Portuguese Science and Technology Foundation PTDC/DES/101224/2008 and SFRH/BD/72610/2010.
Presenter Ana Catarina Sousa is a PhD student at the University of Porto in Portugal. Her areas of scientific interest are Sport Sciences, Sports Physiology specially centred on the studied of physiological responses to different exercises, especially: (i) VO2 kinetics in different cyclic sports (ii) swimming VO2 kinetics within different exercise intensity domains. She was a physical education teacher from 2006 to 2011 and a swimming coach from 2004 to the present.
BMS2014—ABSTRACTS HANDBOOK 89

VO2 slow component assessment along an incremental swimming protocol Ricardo Fernandes1,2, Kelly de Jesus1, Ana Sousa1, Karla de Jesus1, Joao Ribeiro1, João Paulo Vilas-Boas1,2 1CIFI2D, Faculty of Sport, University of Porto, Portugal, 2Porto Biomechanics Laboratory (LABIOMEP), University of Porto, Portugal
Introduction The oxygen uptake (VO2) measurement at the lungs provides an accurate method of estimating its kinetics at the level of working muscles (Jones and Poole, 2005) with one important area of research regarding the mechanistic bases of the VO2 slow component (VO2SC) (Jones and McConnell, 1999). Although it has been well described in heavy intensity exercise domain (particularly in cycling and running performances), its study in swimming is almost inexistent. Thus it was aimed to analyse the VO2SC phenomenon across low to severe intensities.
Method 11 male well trained swimmers (20.4±2.5 yrs, 1.80±0.06 m and 74.1±4.12 kg) performed a front crawl incremental protocol of 7 x 300 m until exhaustion (with increments of 0.05m/s and 30s rest intervals between steps). VO2 was collected bxb using a portable gas analyser (K4b2) connected to the new AquaTrainer respiratory snorkel (both from Cosmed, Italy). VO2SC was assessed using a double exponential regression model with, exponential terms amplitudes (A1 and A2), time delays (TD1 and TD2) and time constants (τ1 and τ2) representing the VO2 kinetics fast (1) and slow (2) components. In addition, the calculation of the VO2SC values through the fixed interval method was also conducted by subtracting the average VO2 observed in the last 40s of each step by the average VO2 observed in the 3rd min of exercise. A paired T-test was used to compare both methods along the incremental test (p ≤ 0.05).
Results Table 1 shows the Mean ± SD values for the VO2SC and other related parameters obtained through mathematical modelling at the 1st, 2nd, 3rd, 4th, 5th, 6th and 7th steps of the incremental intermittent protocol.
1st step 2nd step 3rd step 4th step 5th step 6th step 7th step
A1 (ml.min¯¹) 1874.7±251 1941.4±311 2185.9±207 2260.1±244 2445.3±229 2749.1±385 3082.5±444.6
A2 (VO2SC) (ml.min¯¹) 4.4±7.4 9.93±17.8 11.8±22.3 99.2±66.6 234.9 ±29.6 274.17±103.7 400.8±1.7
TD1 (s) 13.4±4.3 15.6±4.6 17.3±5.4 12.9±5.3 14.2±5.2 13.1±4.1 12.1±4.2
τ1 (s) 25.6±8.0 25.9±5.4 26.2±5.9 30.0±9.9 24.8±8.4 22.3±8.3 22.3±16.1
TD2 (s) 146±49.1 175±22.6 151±40.5 176±34.1 169±37.3 168±34.2 157±32.7
τ2 (s) 274±37.4 280±14.2 268±48.5 266±54.1 274±33.6 262±43.6 210±47.1
The VO2SC mean ± SD values obtained through the fixed interval method at the 1st, 2nd, 3rd, 4th, 5th, 6th and 7th steps of the protocol were: 2.8±9.2, 6.4±13.1, 13.3±6.2, 94.1±49.9, 205.1±13.3, 239±32.9, 301±77.1 ml.min¯¹, respectively. VO2SC mean values were higher using the mathematical modelling compared with the fixed interval method (P ≤ 0.05, d=0.76), but the most relevant finding was the higher VO2SC values found in the three last steps of the protocol (from the 5th until the 7th step), i.e., at intensities higher than the anaerobic threshold.
Conclusions This means that at heavy and severe swimming intensities the higher work rates implied the recruitment of faster but more fatigued fibres, which could lead to less efficient processes, and consequently, to higher VO2SC mean values.
References Jones, A. & McConnell, A. (1999). Eur J Appl Physiol 80: 213–219. Jones, A. & Poole, D. (2005). Med Sci Sport Exerc. doi:
10.1249/01.mss.0000177466.01232.7e.
Acknowledgments PTDC/DES/101224/2008 (FCOMP-01-0124-FEDER-009577) and CAPES 5431-10-7/2011.
Presenter Professor Ricardo J Fernandes was a swimmer and coach at club, regional and national Portuguese teams. Had graduated in Sport Sciences at the Faculty of Sport, University of Porto and achieved master’s degree, also in sport sciences (specialised in high performance sports—swimming). In the same institution he conducted his Ph D on Sport Sciences regarding the characterisation of time to exhaustion at the swimming velocity corresponding to
90 BMS2014—ABSTRACTS HANDBOOK

VO2max. Recently we presented his Habilitation on Sport Sciences. He develops research, manly, in the area of the biophysical characterisation specially centred on the availability and use of energy in aquatic activities (e.g. swimming, rowing and surfing). He is also interested in planning and periodisation, and training control and evaluation of athletes in cyclic and team sports. He publishes papers on scientific journals in a regular basis, presenting an h index of 11.
Left ventricular performance following swim training in Egyptian wheelchair swimmers (amputee versus paraplegic) Magdy Abouzeid1 1Alexandria University
Introduction Athletes with special needs represent a growing population of sports participants. The Special Olympics is an international organisation dedicated to empowering individuals who have physically and intellectual disabilities so they become physically fit through sports training and competition. Subjects with paraplegia and amputation don’t use their legs in their daily lives which may affect myocardial efficiency. According to the law of use, not using the legs is considered to be amongst the factors affect the cardiac deficiency in general.
Purpose The aim of these study was to compare myocardial responses to intensive training (IST), 24 weeks, 6 times per week, 120 min per unit in male wheelchair swimmers (amputee vs. paraplegic).
Subjects and methods To study these effects, seven below-knee amputee swimmers (AM) group aged (18.3 ± 0.9 yr), Ht (168.1 ± 1. 7 cm), Wt (68.2 ± 3.7 kg) were compared with seven paraplegic swimmers (PR) group aged (18.6 ± 0.9 yr), Ht (167.0 ± 2.2 cm), Wt (68.0 ± 4.6 kg). All subjects group under went two-dimension and M-mode echocardiography at rest, and arm crank ergometry exercise test to determine VO2 max before and after 24 weeks of intensive training. All analyses were performed with SPSS using, mean ±S.D and a student’s t. test to estimate differences between the two groups.
Results There were significant differences for myocardial parameters and VO2 max (L/min) after (IST) for both groups. The significant observation in this study indicates that below-knee amputated swimmers showed a greater improvement in myocardial parameters and VO2 max than paraplegic swimmers.
Discussion and conclusion Intensive swim training improved cardiac dimension and function performance, and VO2 max in wheelchair swimmers. The active lower limb muscles increase the ability of the musculoskeletal pump in the legs to be activated thus reducing venous pooling. Persons with scl (spinal cord injury) can benefit greatly by participation in exercise activities.
Presenter Prof Dr Magdy Abouzeid is professor of sport science, physical education at the University of Alexandria University, Faculty of Sports Education, Egypt. He received a PhD(1983) in physiology of swimming training from Alexandria University, Egypt. He has authored over 100 publications in sport science, sport pedagogy, and adapted physical activity, and has edited several books in the area of Aquatics sport training. Dr Magdy Abouzeid is Vice President of International Throwball Federation, member of world organisations and institutions of sport, member of scientific committee and reviewer for the ‘I do movement for culture’, Journal of Martial Arts Anthropology, Member of Egyptian universities Promotion committee(EUPC). Also has been a visiting professor at Suwon University, South Korea (2008–2009).He was awarded with several prestigious international awards including; winner of prince faisal Bin Fahad International Prize for Arab sports research development (Sixth session (Sport Medicine-2008), Dr Magdy was an IOC research scholarship winner, the Award of the 2008ICSEMIS Committee (China, Guangzhou). His current research interests include adaptation to exercise training, training in young athletes, aquatic sports training and its effect on functional capacity, sport for peace and development and other Paralympic research.
BMS2014—ABSTRACTS HANDBOOK 91

CONCURRENT SESSION 7C—BIOMECHANICS 7
Asymmetries produce yaw in breaststroke Ross Sanders1, Carla McCabe2 1Exercise and Sport Science, Faculty of Health Sciences, The University of Sydney, 2ISPEHS, School of Education, The University of Edinburgh, UK
Introduction Swimmers seek to minimise resistive forces in swimming by maintaining ‘streamlined’ alignment. However, asymmetries in technique can generate torques about the vertical axis that cause yaw. The purpose of this study was to assess the patterns of yaw of breaststroke swimmers and to identify the asymmetries in the kinematics that contribute to yaw.
Method Four case studies of Scottish National level swimmers were conducted. Video data from four underwater and two above water cameras were collected during a 4*100m ‘fatigue set’ at maximum effort. One cycle per 100m was analysed using inverse dynamics and a full body model to derive linear and angular kinematics and kinetics. Yaw and torque about the vertical axis were quantified and examined in conjunction with hand and foot speed. Moment arms of the hands and feet with respect to the whole body centre of mass were determined.
Results All swimmers had up to eight degrees of yaw of the trunk during the stroke cycle. The production of yaw could be explained by bilateral differences in hand or foot speed and moment arms. However, the amount of yaw and its underlying links to the kinematics differed among the four swimmers.
Conclusion Rotation of the trunk about the vertical axis is common among breaststroke swimmers and has obvious links to bilateral asymmetries in technique including hand speed and moment arms.
Presenter Professor Ross Sanders is the Head of Exercise and Sport Science in the Faculty of Health Sciences at the University of Sydney (since May 2013). Previously he was the Chair of Sport Science at The University of Edinburgh where he established the Centre for Aquatics Research and Education (CARE). His current research includes the causes and effects of asymmetries in swimming and aquatic exercise to improve coordination.
Do fins alter spatiotemporal and physiological variables in front-crawl all-out effort? Cristiano Cardoso de Matos1,2, Marcos Franken1,2, Rodrigo Zacca1,2, Bruno Costa Teixeira1,3, Flávio Antônio de Souza Castro1,2 1Federal University of Rio Grande do Sul (UFRGS), Brazil, 2Water Sports Research Group, 3Exercise Biochemistry and Physiology Study Group
Introduction Fins are equipment used in training sessions for different purposes, however there are few studies which compare spatiotemporal and physiological responses of this equipment’s in front-crawl in maximal intensity. The aim of this study was to identify and to compare the spatiotemporal and physiological parameters obtained with and without fins of 488 cm² area in maximal intensities of front crawl swimming.
Method Eleven male volunteers (25.8 ± 5.5 years old, 75.2 ± 5.5 kg body mass and 177 ± 6.5 cm height), masters swimmers performed two 50 m all-out in front crawl stroke, with (WF) and without fins (WOF). The spatiotemporal parameters obtained were: swimming velocity (SV), stroke rate (SR), stroke length (SL), stroke phases duration (A, B, C, D, propulsive and not propulsive on breathing side and opposite to breathing side) and index of coordination on both, breathing (IdC 1) and opposite of breathing side (IdC 2), number of kicks (NF), right feet deep (FRD) and left feet deep (FLD). Manuals time keepers and camcorders (60 Hz) were utilised to obtain spatiotemporal parameters. Physiological parameters evaluated were: lactate concentration [LA] and perceived exertion (PE). The [LA] was analysed from capillary blood samples in portable lactimeter three minutes after maximal effort. Perceived exertion
92 BMS2014—ABSTRACTS HANDBOOK

(PE) was collected immediately after each trial using the Borg scale. Foots area were estimated. Paired Student’s t tests were applied for alpha < 0.05.
Results and discussion Fins increased 25% of the foot’s area compared to WOF. Although it may seem insignificant, it was observed an increase in SV when compared WP to WOF. With the use of fins athletes can perform greater propulsive forces due greater contact area with the water in comparison to the area of the foot, increasing (1) propulsive momentum, (2) volume of water displacement and (3) body alignment.
Conclusion Fins with area of 488 cm² may cause limited alterations in spatiotemporal parameters. Still, future longitudinal studies should be undertaken to elucidate further questions regarding to fins training effects.
References 1 Zamparo, P.; et al. An energy balance of front crawl. European Journal of Applied Physiology. v.94, n.1- 2, p.134- 144, 2005.
2 Zamparo, P.; et al. Economy and efficiency of swimming at the surface with fins of different size and stiffness. European Journal of Applied Physiology. v.96, n.4, p.459–470, 2006.
Presenter Flávio Antônio de Souza Castro is from Federal University of Rio Grande do Sul, Brazil, where he teaches swimming and leads the Research Group in Aquatics Sports.
Preference effect on inter-individual variability of body angles during swim start for expert swimmers Julien Vantorre1, João-Paulo Vilas-Boas2, Ricardo Fernandes2, Didier Chollet1, Ludovic Seifert1 1CETAPS Laboratory, University of Rouen, France, 2LABIOMEP, University of Porto, Portugal
Introduction The aim of this study was to analyse inter-individual variability on body angles and velocity between preferential and non-preferential start techniques during aerial phase of swim start.
Method Five expert swimmers—who used grab start as preferential technique—performed six randomised trials (3 in track and 3 grab start) and the best trial in each technique was selected. 3 cameras (2 above water and 1 underwater) placed perpendicularly to the movement allowed a 2D analysis with APAS System from the signal to the entry of the feet in the water. A 20 markers’ body model (De Leva, 1996) was used to determine body angles and velocity of centre of gravity (CG). Body angles were calculated between a local CG (representing an entire limb) and the trunk (shoulder-hip segment). Trials were normalised in 100 values and key points of the start signal, the moment when the feet leaved the block, the hand and feet entry were distinguished.
Results Curves and standard deviations of body angles and velocity of the CG during the aerial phase of the start were summarised in the following figure with key points in bold).
BMS2014—ABSTRACTS HANDBOOK 93

A higher inter-individual variability of CG Arm-Trunk and no significant difference at hand entry showed an adaptation to the task of starting in the two techniques by the expert swimmers (Vantorre et al., 2010). However, lower alignment of upper limb during its entry induced a lower efficiency at entry confirmed with a higher decrease in velocity (Seifert et al., 2010). Concerning CG Leg-trunk, experts had significant higher variability at arms but results were inverted at feet entry showing a process of adaptation during the transition between rotating in the air and enter in the water in a streamlined position. Results also showed a use of various body angles—especially in preferential technique—in the aerial phases (as previously showed by Seifert et al., 2010) suggesting that several behavioural profiles enable to reach effectively the task-goal.
Conclusion These results were fundamental to link with the study of the same technique done on a traditional block versus the OSB11 starting block (Honda et al., 2012; Takeda et al., 2012).
References De Leva, P. (1996). Adjustments to Zatsiorsky-Seluyanov’s segment inertia parameters. Journal of Applied Biomechanics, 29(9),
1223–1230.
Honda, K., Sinclair, P., Mason, B. & Pease, D. (2012). The effect of starting position on elite swim start performance using an angled kick plate. In 30th Annual Conference of Biomechanics in Sports (pp. 72–75). Melbourne.
Seifert, L., Vantorre, J., Lemaitre, F., Chollet, D., Toussaint, H. & Vilas-Boas, J. (2010). Different profiles of the aerial start phase in front crawl. The Journal of strength and conditioning research, 24(2), 507–516.
Takeda, T., Takagi, H. & Tsubakimoto, S. (2012). Effect of inclination and position of new swimming starting block’s back plate on track-start performance. Sports Biomechanics, 11(3), 370–381.
Vantorre, J., Seifert, L., Bideau, B., Nicolas, G., Fernandez, R., Vilas-Boas, J. & Chollet, D. (2010). Influence of swimming start styles on biomechanics and angular momentum. In P. Kjendlie, R. Stallman & J. Cabri (Eds.), Biomechanics and Medecine in Swimming XI (pp. 180–182). Oslo Nordbergtrykk.
Vantorre, J., Seifert, L., Fernandes, R., Vilas-Boas, J. & Chollet, D. (2010). Kinematical profiling of the front crawl start. International Journal of Sport Medecine, 31, 16–21.
Presenter Julien Vantorre completed a PhD in biomechanics and motor control at the university of Rouen, focusing on expertise and variability using the example of swim start movement. He now holds a position at the University of Rouen aiming the teaching of biomechanics, psychology and how to teach and train swimming.
94 BMS2014—ABSTRACTS HANDBOOK
Ludovic Seifert is associate professor at the faculty of Sport Sciences of Rouen in France and works on Sport Biomechanics and Motor Control with a special focus on inter-limb coordination in relation to skills acquisition and high level of expertise achievement.
Hydrodynamic quality factor as an objective quantitative characteristic of assessment of swimming technique Boris Dyshko1, Alexander Kochergin2 1LLC Sport Technology, Russia, 2Centre of Sports Training, Russia
Introduction The intracycle velocity of the body’s common centre of gravity of swimmers in a real competitive and training exercise is known [2,5–7] to change according to the quasi-periodic law regardless swimming technique. It promotes taking some conditions of the mathematical apparatus of oscillation theory to assess the energy efficiency of swimming technique in real motions [3]. The energy efficiency of different swimming styles was estimated using the experiment.
Methods The energy efficiency of the quasi-periodic oscillation process can be estimated via the quality factor [4]. In our case ‘hydrodynamic quality’ К will be equal to
К = Vmax2/(Vmax2 – Vmin2) (1)
where Vmax, m/s - maximum intracycle velocity (ICV) of swimming in one cycle, Vmin, m/s - minimum ICV of swimming in one cycle. The intracycle velocity was measured using the method of hydroacoustic speedography [1] in elite swimmer - male (n=8) and female (n=7) at competitive swimming speeds.
Results The ‘hydrodynamic quality factor’ К (mean group values) in crawl stroke was found to be 3.3 and 3.54, back crawl—3.45 and 3.84, butterfly stroke—1.45 and 1.51, breaststroke: 1.32 and 1.26 for men and women respectively. The average swimming speed for men using all styles was higher than among women. But women dominated in the energy efficiency of the technique compared to men, except for breaststroke.
Conclusions The biomechanical characteristic of ‘hydrodynamic quality factor’ we have suggested can be used to estimate the level of athletes’ technical skills in phased and current examinations and when developing model characteristics of the technique of performance of competitive and training exercises in sports swimming.
References 1 Koygerov, S.V., Molinsky, K.N., Ukstin, A.V. Means of on-line monitoring of elite swimmers’ sports technical training. Teoriya
i praktika fizicheskoy kultury. Moscow. -7 – P.7–9.1984. (In Russian)
2 Kolmogorov, S.V., Turetsky, G.G., Koygerov, S.V., Rumyantseva, O.A. Hydrodynamic characteristics of elite swimmers at various training phases/Teoriya i praktika fizicheskoy kultury. 1991. 12. P. 21–29. (In Russian)
3 Parshin, D.A, Zegrya, G.G, Masterov, V.F. The kinematics of a particle (lecture notes). St. Petersburg: publ. h-se of B.P. Konstantinov St. Petersburg institute of nuclear physics RAS, 1998, 132 P. (In Russian)
4 Skudchik, E. Simple and complex oscillatory systems. Moscow. Mir, 1971, 557 P. (In Russian)
5 Costill, D, Lee, G, D’Acquisto, L. (1987) Video-computer assisted analysis of swimming technique. J. Swim Res 3:5–9.
6 Kolmogorov, S., Duplesheva, O. Active drag, useful mechanical power output and hydrodynamic force coefficient in different swimming strokes at maximal velocity. Journal Biomechanics. 1992. V.25. pp. 311–318.
7 Vilas-Boas, JP, Cunha, P, Figueiras, T, Ferreira, M, Duarte, J (1997) Movement analysis in simultaneous swimming techniques. In: Daniel K, Hoffmann U, Klauck J (Eds.) Cologne swimming symposium. Sport Fahnemann, Verlag, Bocknem, pp 95–103.
Presenter Dr Boris Dyshko, PhD, is the consultant of the Russian National Teams in Biomechanic and training means. His research reaches into biomechanics of elite sport, new training devices and technology of their using and innovation in elite Sport. Now he is CEO of the Sport Technology, LLC. He has more than 150 scientific and application-practice articles and patents in Russia and other countries.
BMS2014—ABSTRACTS HANDBOOK 95

Muscle activation and kinematic differences between breaststroke swimming and technique/drill exercises: a case study of a world champion breaststroker Bjørn Harald Olstad1, Jessy Lauer1, Christoph Zinner2, David Haakonsen1, Jan Cabri1, Per-Ludvik Kjendlie1 1Department of Physical Performance, Norwegian School of Sport Sciences, Norway, 2German Sport U Cologne, I of Training Science and Sport Informatics, Germany
Introduction The aim of this study was to investigate the relationship between muscle activation and kinematics in four different leg muscles during normal breaststroke (BR) swimming and during a technique exercise.
Method One world champion male breaststroker performed one trial of 20m BR at the speeds of 60%, 100% and 2 BR kicks to 1 BR pull at 100% of maximum effort. The phases of each BR cycle and kinematic set-up are defined in Olstad et al. (under review). Muscle activation was recorded according to Olstad et al. (2011). Processing of the sEMG signals is defined in Lauer et al. (2012).
Results The % of integrated EMG for selected phases are displayed in Table 1.
Table 1 The percentage of maximal integrated electromyography for phase 1, 2 and 3 of the breaststroke kick
Gastronemius medialis Tibialis anterior Biceps femoris Rectus femoris
iEMG max 100% 100% 100% 100%
iEMG phase 1 swim 60% 87.36% 3.68% 34.66% 91.75%
iEMG phase 1 swim 100% 79.46% 2.31% 44.35% 78.32%
iEMG phase 1 2kick1pull 100% kick1 56.48% 1.27% 25.42% 43.4%
iEMG phase 1 2kick1pull 100% kick2 71.88% 0.76% 13.99% 33.51%
iEMG phase 3 swim 60% 22.26% 1.93% 12.77% 15.64%
iEMG phase 3 swim 100% 21.45% 1.36% 16.25% 23.00%
iEMG phase 3 2kick1pull 100% kick1 21.85% 0.97% 15.25% 15.46%
iEMG phase 3 2kick1pull 100% kick2 22.2% 1.25% 11.15% 20.16%
iEMG phase 4 swim 60% 59.03% 5.14% 48.59% 69.52%
iEMG phase 4 swim 100% 49.1% 2.46% 37.14% 59.89%
iEMG phase 4 2kick1pull 100% kick1 59.25% 1.28% 22.4% 41.75%
iEMG phase 4 2kick1pull 100% kick2 52.71% 1.57% 23.71% 51.38%
Conclusion BR swimmers perform technique and drill exercises in order to improve their BR swimming. Muscle activation patterns were different with regards to velocity and the technique exercise. More research is needed in order to fully understand what impact these differences have on the normal swimming BR technique.
References Lauer, J. et al. (2013). Phase-dependence of elbow muscle coactivation in front crawl swimming. J Electromyogr Kinesiol, 23(4),
520–5.
Olstad, B. H. et al. (2011). SEMG measurements on land and in water prior to and after 60–90 minutes of submersion (swimming) are highly reliable. Portugese J of SS, 11(Suppl. 2), 763–65.
Olstad, B. H. et al. (in review). A new approach for identifying phases of the breaststroke wave kick using 3D automatic motion tracking. Biomechanics and medicine in swimming XII.
Presenter Bjørn Harald Olstad is an assistant professor at the Norwegian School of Sport Sciences in Oslo. He is currently working towards his PhD: Muscle activation and kinematics in contemporary breaststroke swimming, containing surface electromyographic measurements and three dimensional motion in swimming. He holds a master’s degree on how to coach age-group swimmers for future success and was a former National team member in swimming and lifesaving. He previously worked for the United States Olympic Committee, United States Swimming and with several swim clubs as performance director and coach.
96 BMS2014—ABSTRACTS HANDBOOK

Low-cost prototype development and swim velocity profile identification using neural network associated to generalised extremal optimisation Luciano Ferreira Cruz1, Roberto Zanetti Freire1, Leandro dos Santos Coelho1,2 1Pontifical Catholic University of Parana (PUCPR), 2Federal University of Parana (UFPR)
Introduction Velocity analyses are supportive for coaches in order to improve swimmers’ technique and have been widely studied in order to improve the athletes’ performance. Especially in short distance competitions, small variations in velocity may be the difference between the first and the second place. Velocity measurement can be performed by different sensors, when accelerometers were adopted, due to sensors characteristics a noisy signal can be obtained and additional hardware and/or algorithms may be necessary to filter the signal (Arellano et al., 2010; Coelho et al. 2013; Stamm et al., 2011).
Method This work presents a low-cost prototype development to measure swim velocity considering noise reduction by using a microcontrolled system associated to an incremental encoder. Swim velocity profile identifications have been performed by using a Radial Basis Function Neural Network (RBF-NN) improved by the stochastic Generalised Extremal Optimisation (GEO) method to provide a fast convergence. The proposed RBF-NN training is aimed at adjusting Gaussian basis function centres using GEO, which has just one free parameter to be set, it does not make use of derivatives and can be applied to non-convex or disjoint problems.
Results The velocity data of Brazilian elite male swimmer in crawl stroke have been obtained into a 25 metres test by using the prototype presented in Fig. 01-a. A belt and a nylon line have been used to connect the athlete to the equipment outside the water. The sample time for data acquisition was 50ms limited by the microcontroller specification. Figure 01-b presents the best results for the estimation phase obtained by RBF-NN combined with expectation-maximisation clustering method to tune the Gaussian functions centres and GEO optimisation method to optimise the Gaussian functions spreads. In this design, the pseudo-inverse was employed in the RBF-NN output layer. The proposed RBF-NN obtained a multiple correlation index R² equal to 0.84 has been obtained.
0 50 100 150 200
0
0.1
0.2
0.3
0.4
0.5
0.6
0.7
0.8
0.9
1
sample
velo
city
(m/s
)
real velocityestimated velocity using RBF-NN
(a) (b)
Figure 1 (a) Velocity measurement prototype; (b) Best results using RBF-NN associated to GEO for crawl stroke.
Conclusions By using time series forecasting applied to swim velocity profile identification the reduction points of water resistance can be analysed. Additionally, improvements on swimming techniques in order to raise the continuity of propulsive actions and continue rhythm during swim can also be evaluated.
References Arellano, R., Domínguez-Castells, R., Perez-Infantes, E., Sánchez, E. (2010).Effect of stroke drills on intra-cycle hip velocity in front
crawl. Proc. of the XI Biomechanics and Medicine in Swimming (BMS2010), Oslo, Norway.
BMS2014—ABSTRACTS HANDBOOK 97
Coelho, L. S., Cruz, L. F., Freire, R. Z. (2013). Swim velocity profile identification by using a modified differential evolution method associated with RBF neural network, Proc. of the Third International Conference on Innovative Computing Technology (INTECH2013), London, UK.
Stamm, A., Thiel, D. V., Burkett, B., James, D. A. (2011). Towards determining absolute velocity of freestyle swimming using 3-axis accelerometers, Procedia Engineering, vol. 13, pp. 120–125.
Presenter Dr Roberto Zanetti Freire is professor of the Industrial and Systems Engineering Graduate Program (PPGEPS) at the Pontifical Catholic University of Parana (PUCPR) Brazil. His research areas are related to computational intelligence, identification, optimisation, advanced control, systems simulation and thermal comfort of human beings.
CONCURRENT SESSION 8A—SOCIAL SCIENCES 1
The concepts ‘can swim’ and ‘water competition’ and their relationship: a conceptual model Robert Keig Stallman1,2,3 1The Norwegian Lifesaving Society, 2The Tanzanian Lifesaving Society, 3The Norwegian School of Sport Science
Introduction A concise definition of what swimming really is has yet to be broadly adopted. Such a definition is necessary to advise teachers, instructors and program planners. Appropriate content has protective value in a drowning prevention context.
Methods Four sources of data have been used to construct a definition of ‘CAN SWIM’: 1) a review of content of 25 well known organisations, 2) in depth interviews with drowning survivors, 3) observation of simulated drowning episodes, 4) theoretical movement analysis. Skill alone is often not enough to prevent drowning. Water competence which includes skill, was defined by polling expert opinion. The relationship between swimming skill and water competence was devised as a conceptual model.
Results The resulting definition of swimming skill focuses on essential protective skill elements in an all-around aquatic skill development. Each of these has a protective value of its own as well as collective value when integrated with each other. Water competence is defined to include skill plus the cognitive and affective competencies which provide additional protection, i.e. attitudes, knowledge, judgement, values and behaviour. The conceptual model of the relationship between swimming skill and water competence places skill as the core of water competence with the affective and cognitive qualities as added protective value.
Conclusions Swimming skill is the core of water competence. To the core is then added all cognitive and affective competencies which increase the protective value on, in and around the water. The minimal teaching package which we should deliver, is a water competence package.
References 1 Brenner, R., Moran, K., Stallman, R., Gilchrist, J., McVan, J. (2006). Swimming Abilities, Water Safety Education and
Drowning Prevention. In Handbook on Drowning (Edit, Bierens, J), Springer Verlag, Berlin, pgs 112–117.
2 Stallman, R., Junge, M.†, Blixt, T. (2008). The Teaching of Swimming Based on a Model Derived from the Causes of Drowning. International Journal of Aquatic Research and Education, Human Kinetics, Vol. 2, pgs 372–3
Presenter Robert Keig Stallman is a retired Assoc Prof at Norwegian School of Sport Science. He has been active in many branches of aquatics for over 50 yrs. He has worked in approximately 12 aquatic organisations in 6 countries. He is still actively writing, researching and presenting.
98 BMS2014—ABSTRACTS HANDBOOK

The effects of unsteady water on choice of swimming stroke Per-Ludvik Kjendlie1,3, Tommy Pedersen2, Robert Keig Stallman1, Bjørn Harald Olstad1 1Norwegian School of Sport Sciences, 2Sandefjord Kommune, 3Norwegian Police university College
Introduction Little is known about the transfer of swimming skills from flat, calm conditions to outdoor, unsteady conditions. The aim of the present study was to investigate the velocity decrement of several life-saving, self-rescue and rescue related strokes when introducing waves of different heights.
Methods Thirty-three subjects swam 12 25m sprints each, in a randomised order, in a 3x4 (wave height x stroke) design. The wave heights were flat, medium (ca 20 cm) or large (ca 40 cm), in a specially designed wave-simulating pool. The strokes were front crawl, head-up crawl, back crawl and breaststroke.
Results A repeated measures ANOVA showed a significant effect of stroke, F(3,23)=111.6 (p<0.001), showing that strokes have different levels of performance; and wave height F(2,24)=109.4 (p<0.001), showing that introducing waves reduced velocity, but that there was no interaction effect. The fastest stroke in flat water was not surprisingly, front crawl, followed by head-up crawl, back crawl and breaststroke. When introducing medium or large waves, the order of strokes from fastest to slowest was identical to flat-water conditions. The average velocity decrement when introducing medium and large waves was 4% and 8% respectively.
Conclusion The conclusion is that the rank order of strokes does not change when introducing waves and that no stroke seems to perform relatively better in unsteady water compared to flat water.
Presenter Robert Keig Stallman is a retired Assoc Prof at Norwegian School of Sport Science. He has been active in many branches of aquatics for over 50 yrs. He has worked in approximately 12 aquatic organisations in 6 countries. He is still actively writing, researching and presenting.
Lifesaving—a sport and a tool of rescue: is there danger of negative transfer? Torill Hindmarch1, Trude Aastad1, Robert Keig Stallman1,2,3 1Norwegian Life Saving Society, 2Tanzanian Life Saving Society, 3Norwegian School of Sport Science
Introduction Lifesaving competition now resembles nearly any other organised sport, despite its’ humanitarian origins. It is the nature of competitive sport to search for improvements in performance. Lifesaving is no different. However, there are well established norms for safe rescue. Is it possible that innovations used to reduce time contravene these norms? What are the consequences? Is there danger that non-recommended rescue techniques will be used in real rescue situations? Can this lead to unnecessary risk to both rescuer and casualty?
Methods A literature search of six high profile national lifesaving organisations was conducted, revealing the most widely accepted norms for safe rescue. Video and still pictures of the international program for indoor lifesaving were analysed by observation for contradictions to these safety norms. Then, a selection of lifesaving clubs were observed and evaluated. Questionnaires were given to competitors, coaches and leaders. Finally, video analysis of the S.E.R.C. event was conducted, observing the choices made by lifesavers who had been presented with a scenario problem to solve.
Results The safest of rescue techniques are under-represented in competition. The more spectacular ‘swimming’ rescues are over-represented. Most events contain elements which directly contravene accepted safety norms. The clubs observed trained almost only for the competitive events. Little if any attention was paid to real life scenarios with recommended techniques. Many of the competitors had never been told ‘do this in competition but not in real life’. In solving a SERC problem, a disturbingly large number of choices were made which mimic competitive events and contravene accepted norms for safe rescue.
BMS2014—ABSTRACTS HANDBOOK 99

Conclusions Competition lifesaving has directed the attention of the public to lifesaving and to positive attitudes toward water safety. It has also promulgated competitive techniques unacceptable in real life rescue.
References Inet, R. (2005). Lifesaving Sport: A Technical Manual for the Sport of Lifesaving. The Royal Lifesaving Society UK. Lifesavers Direct,
Lisburn, UK
Presenter Torill Hindmarch has a MA in Early Years Education and worked as an Early Years practitioner. As a nursery school manager, she included swimming and outdoor education in the curriculum. Torill has pioneered aquatic activities for babies and toddlers in Norway since 1981, worked with self rescue and lifesaving for children and adults in England and Norway since 1972. She started three lifesaving clubs for children and young adults in Norway. She now works as an education consultant for the Norwegian Life Saving Society head office in Oslo, responsible for Water Safety education for families and children.
The ‘neglected factor’ in teaching and learning swimming: the teacher. Examples from Norway Dagmar Dahl1 1University of Nordland
Introduction Swimming education is an important topic in Norway, a country with a long coast line and lots of lakes. But not just in terms of the lifesaving aspect but also for health care and physical training swimming is regarded as basic ability. The Norwegian government outlines the aim that all school children should have learned in school to swim by the end of the 4th form. The reality is often quite different from that ideal, in 2003 just half of the children in the 5. form were able to swim 200m (NSF/NSSR 2004). Usually schools and Swimming federation blames first of all the bad teaching conditions in terms of lack of access to swimming halls and lack of time. In fact, especially in the bigger cities that seems to be one of the main reasons. But is this the only one? In this paper we will look on the importance of the teaching quality, i.e. who is teaching swimming, and which education those teachers have received.
Methods This qualitative-descriptive study is carried out by using questionnaires, meta-analysis of former studies, qualitative interviews and observations of schools swimming lessons.
Results/discussion In a random inquiry amongst BA- sports students at two universities in Northern Norway the result rather shows that it is not the number of pool lessons which is the problem, but the quality of the teaching process and the teacher’s own abilities. When looking at the PE- teacher-education one can find a wide range of varieties how the swimming teacher training is organised. While some universities offer a class with duration of 8 hours, there are others with 56 and more lessons and special training in practical teaching. Supplementary teacher trainings for swimming offered in Northern Norway are overbooked and show the need for further education. Also the opinion of what ‘water competency’ or ‘swimming ability’ includes, is characterised by huge differences. The need for a common basis curricula grounded on a shared comprehension of ‘water competency’ is obvious. A successful swimming education is the result of time, facilities AND a good, qualified teacher.
References Madsen,Ø., Irgens, P.: Slik lærer du å svømme. Oslo 2005
Moran, Kevin; Stallman, Robert K.; Kjendlie, Per-Ludvik; Dahl, Dagmar; Blitvich, Jennifer; Petrass, Lauren A.; McElroy, G. Keith; Goya, Toshiaki; Teramoto, Keisuke; Matsui, Atsunori; Shimongata, Shuji. Can You Swim? An Exploration of Measuring Real and Perceived Water Competency. International Journal of Aquatic Research and Education 2012; Volume 6(2), s. 122–135
Norwegian Swimming Federation: Undersøkelse om svømmedyktighet. Oslo 2004
Utdanningsdirektoratet: Svømme-og livredningsopplæring. Oslo 2008
Presenter
several years, including Norwegian School of Sport Sciences, University of Tromsa, Finnmark University College and
100 BMS2014—ABSTRACTS HANDBOOK
Dagmar Dahl has a PhD from the Norwegian School of Sports Sciences. She has taught swimming at universities for

now University of Nordland, as well as being an instructor and trainer at swimschools and clubs for children. At BMS
CONCURRENT SESSION 8B—PHYSIOLOGY 8
Effects of swim training on energetic and performance in women masters swimmers Ines Ferreira1,2, Tiago M Barbosa2,3, Antonio J Silva2,4, Henrque P Neiva2,3, Jose Vilaca-Alves2,4, Mario J Costa2,5, Daniel A Marinho1,2 1University of Beira Interior, Portugal, 2Research Centre in Sports, Health and Human Development, Portugal, 3National Institute of Education, Nanyang Technological University, Singapore, 4University of Trás-os-Montes and Alto Douro. Vila Real, Portugal, 5Polytechnic Institute of Guarda. Guarda, Portugal
Introduction Follow-up the physiological and performance adaptations over a season provide useful information on the chronic responses to training (Costa et al., 2013). Since performance depends among others from energetic determinants (Barbosa et al., 2010), the purpose of this study was to assess the effect of several months of training on energetic profile and performance of women masters’ swimmers.
Methods Eleven female swimmers (34.7 ± 7.6 years-old) were evaluated on three different time periods over the 2012–2013 season: December (M1), March (M2) and June (M3). Each subject performed a 200m freestyle time trial. Oxygen uptake (VO2) was assessed before and immediately after the trial with a breath-by-breath gas analyser (K4b2, Cosmed, Rome, Italy). Capillary blood samples were collected from the year lobe (before, immediately following, 3’ and 6’ after the protocol) to assess blood lactate concentrations with an auto-analyser (Accusport, Boherinnger Mannheim, Germany). It was estimated or assessed the: 200 m freestyle performance, total energy expenditure (Etot), aerobic (Aer), anaerobic lactic (AnL) and alactic (AnAl) partial contributions. Data variation was analysed with ANOVA repeated measures followed by the Bonferroni post-hoc to test differences between time periods.
Results The 200 m performance was 205.18 ± 24.46 s (M1), 197.45 ± 20.96 s (M2) and 193.45 ± 18.12 s (M3). Post-hoc test showed significant differences throughout the season between M1 and M2 (p = 0.04) and between M1 and M3 (p = 0.02). The Etot was 192.81 ± 30.9 KJ (M1), 193.18 ± 20.98 KJ (M2) and 199.77 ± 25.94 KJ (M3). The Aer represented 77.67 ± 3.56% (M1), 79.40 ± 3.63% (M2) and 78.40 ± 5.54% (M3) of the Etot. The AnL had a partial contribution of 9.56 ± 3.58% (M1), 7.95 ± 2.76% (M2) and 9.31 ± 4.71% (M3) for the Etot. The AnAl was 12.76 ± 1.27% (M1), 12.65 ± 1.14% (M2) and 12.30 ±1.48% (M3). No significant variations were determined for the partial contribution of each energetic pathway within the timeframe under study.
Conclusions Women masters’ swimmers significantly improve their 200m freestyle performance over a season. The smooth changes in their energetic profile explain, in part, the decrease in the 200m time. Probably, other performance determinants (e.g. biomechanics) will have an important role in the performance enhancement during a season of training.
References 1 Barbosa TM, Bragada JA, Reis VM, Marinho DA, Carvalho C, Silva AJ (2010). Energetics and biomechanics as determining
factors of swimming performance: updating the state of the art. Journal Science Medicine Sport, 13, 262-269.
2 Costa MJ, Bragada JA, Mejias JE, Louro H, Marinho DA, Silva, AJ, Barbosa TM (2013). Effects of swim training on energetics and performance. International Journal of Sports Medicine, 34(6), 507–513.
Presenter Daniel A Marinho is a lecturer at University of Beira Interior (Portugal) and is a member of the Research Centre in Sports, Health and Human Development.
BMS2014—ABSTRACTS HANDBOOK 101
2010 he presented about ‘Zen and Swimming’. She is still active as a Masters Swimmer.

Bioelectrical impedance vector migration induced by training in young competitive synchronised swimmers Alfredo Irurtia1, Marta Carrasco1,2,3, Lara Rodriguez-Zamora1, Xavier Iglesias1, Daniel Brotons3, Ferran A Rodriguez1 1INEFC-Barcelona Sport Sciences Research Group, Universitat de Barcelona, Spain, 2Universitat Ramon Llull, Spain, 3Sports Medicine Area, Generalitat de Catalunya, Esplugues de Llobregat, Spain
Introduction A synchronised swimming (SS) training session typically includes specific drills, choreographies, and physical conditioning exercises, imposing complex physiological demands (Rodríguez-Zamora et al., 2012). Training volume and intensity differs depending on the age and competitive level of the swimmers. Bioelectrical impedance vector analysis (BIVA) is a non-invasive and safe technique for assessing hydration and body composition changes (Lukaski & Piccoli, 2012). This study applied BIVA to the assessment of hydration changes evoked by SS during a typical training session in swimmers of different age and competitive level.
Method 59 swimmers were divided into 1) pre-juniors (p-JR): mean age 13.9 (SD 0.9) y, body mass (BM) 47.0 (7.2) kg, height 161.8 (8.2) cm, fat mass 15.1 (4.8) %BM, muscle mass 37.6 (5.0) %BM; and 2) juniors (JR): 16.7 (0.9) y, BM 53.7 (4.9) kg, height 165.8 (5.2) cm, fat mass 18.6 (2.6) %BM, muscle mass 38.8 (3.7) %BM. Anthropometric assessment (ISAK) and BIVA analysis were conducted PRE and POST a typical training session [p-JR 2.5 (0.1) h; JR 4.0 (0.2) h]. A multi-frequency wrist-to-ankle BIA meter device (Z-Metrix®, BioparHom, France) was used and 50 kHz whole-body BIA vectors were analysed by the resistance-reactance (R/Xc) graphic method, and Z mean values plotted (Piccoli et al., 1994). PRE-POST differences were tested by paired t-test. Hotelling’s T2 test determined differences in the complex localised vector through the 95% confidence and tolerance intervals.
Results Significant differences were found in whole-body BIA vector in both p-JR (T2=25.6, p=0.003) and JR (T2=25.8, p=0.001). Analysing each component separately, we found:
PRE POST %∆ p-value
Pre-Junior (n=41) BM, kg 47.0 (7.2) 46.7 (7.3) -0.8 (0.6) <0.001
R/h, Ω/m 329.1 (38.3) 339.8 (38.4) 3.4 (4.3) <0.001
Xc/h, Ω/m 40.0 (4.6) 41.3 (4.3) 3.7 (6.4) 0.002
PA, Ω 6.9 (0.5) 7.0 (0.4) 0.3 (5.1) 0.967
Z, Ω 527.9 (53.3) 546.1 (46.6) 3.8 (6.3) <0.001
r (R/h, Xc/h) 0.80 0.85 – --
Junior (n=18) BM, kg 53.7 (4.9) 53.4 (4.9) -0.5 (0.4) <0.001
R/h, Ω/m 303.5 (22.3) 316.4 (30.4) 4.2 (5.3) 0.004
Xc/h, Ω/m 39.9 (2.2) 42.4 (2.9) 6.6 (5.9) <0.001
PA, Ω 7.5 (0.4) 7.7 (0.6) 2.4 (5.9) 0.097
Z, Ω 501.2 (44.2) 516.2 (49.0) 3.1 (5.2) 0.027
r (R/h, Xc/h) 0.63 0.52 – –
Conclusions Both JR and p-JR swimmers showed a migration of the BIA vector characterised by an increase in length (R) and height (Xc), likely as a result of moderate dehydration. Regardless of age and competitive level, a typical SS training session appears to affect the homeostatic hydration level of the swimmers. BIVA analysis seems to be sensitive enough to detect these changes (mean ∆ = 0.5–0.8 %BM). These preliminary results should be considered by coaches, nutritionists, and physicians in order to ensure adequate fluid intake during training.
References Lukaski H.C., Piccoli A. (2012). Handbook of anthropometry. Springer, 287–305, 2012.
Rodríguez-Zamora L., Iglesias X., Barrero A., Chaverri D., Erola P., Rodríguez F.A. PLoS ONE, 7(11):e49098, 2012.
102 BMS2014—ABSTRACTS HANDBOOK

Presenter Ferran A Rodriguez (MD, PhD, FECSS, FACSM) is full professor at INEFC, University of Barcelona, and serves as coordinator of the INEFC Barcelona Sport Sciences Research Group (http://inefcresearch.wordpress.com/). His main areas of research include exercise and sports physiology, bioenergetics, altitude training, physiological testing, swimming and aquatic sports, and talent identification.
Stroke mechanics profile and swimming economy during progressive VO2max test Dalton Pessoa Filho1, Joana Reis2, Francisco Alves2, Camila Greco1, Benedito Denadai1 1Sao Paulo State University (UNESP, Brazil), 2Technical University of Lisbon (UTL, Portugal)
Introduction Distance per stroke (Ds) and stroke rate (SR) over a range of crawl velocities (v) have been argued to be correlated with physiological thresholds of aerobic scope, and thus able to prescribe endurance training (Nomura and Shimoyama, 2003). However, these relationships have not been established from breath-by-breath measurements technique for oxygen uptake (VO2) during maximal aerobic test, neither evidenced the correlation of Ds and SR slopes (Dsslope and SRslope, as well as, the crossing point (Cp) between them) to the determinants of endurance capacity, as: gas exchange threshold (GET), respiratory compensation point (RCP), maximal VO2 (VO2max), and economy (e).
Methods Subjects performed a continuous incremental test (300m per stage) until exhaustion, with stages designed by percentages of v in 400m (%v400). VO2max was calculated as the highest average (10s) value reached during the test (Wakayoshi et al., 1996). GET and RCP were examined visually, using the responses from the VE/VCO2, VE/VO2, PETCO2 and PETO2 parameters. The v corresponding to VO2max (vVO2max), GET (vGET) and RCP (vRCP) was that where each parameter was identified. SR was determined from the time lasting to complete three strokes, using Seiko stopwatch. Ds was calculated from equation v = Ds x SR. A second order polynomial function was applied to adjust Ds (y) and SR (y) to v and VO2 (x). The slopes were determined in x (-b/2a) and y (-D/4a, where D = b2-4ac) given vDsslope, vSRslope, VO2Dsslope, and VO2SRslope. The v and VO2 at Cp (vCp and VO2Cp) were determined from the intersection point of the adjusted algorithms. VO2 (y) and v (x) was adjusted from a power function (f(y) = xn). Economy was quantified at vDsslope, vSRslope, and vCp by means of the individual adjustments of VO2 and v, and by the caloric coefficient for VO2 (20.1kJ). The values of economy was correlated to vVO2max, vGET and vRCP by Pearson`s coefficient, with significant level set at ρ≤0.05.
Results From the values of reference for VO2max (4458.1±645.4ml×min-1) and vVO2max (1.40±0.03m×s-1), the GET and RCP were locating at 63.0±9.5 and 77.2±11.0% of VO2max, and at 86.4±3.7 and 93.8±2.3% of vVO2max, respectively. The observed vCp (113.6±8.7% of vVO2max), VO2Cp (121.6±22.0% of VO2max), vDsslope (85.7±12.7% of vVO2max), VO2Dsslope (68.3±18.4% of VO2max), vSRslope (75.5±10.4% of vVO2max) and VO2SRslope (48.5±11.7% of VO2max) located Cp, Dsslope, and SRslope into severe, heavy and moderate domains of exercise, respectively. The economy from expected VO2 at vDsslope (0.84±0.18kJ) and vSRslope (0.68±0.16kJ) evidenced correlations with GET (0.76 and 0.70, respectively), but at vCp (1.13±0.19kJ) none correlations were observed.
Conclusions Thus, Ds and SR showed an independent turn point profile, as analysed from v and VO2 values, which did not corroborate the results of Wakayoshi et al. (1996). Moreover, Ds and SR influenced better the intensity at GET than RCP, as observed for lactate threshold by Nomura and Shimoyama (2003). In turn, Cp failed to demonstrate influence on aerobic parameters.
References Nomura, T; Shimoyama, Y. The relationship between stroke parameters and physiological responses at the various swim speeds.
Biomech Med Swim IX, 2003.
Wakayoshi, K; D’Acquisto, J; Cappaert, JM; Troup, JP. Relationship between metabolic parameters and stroking technique characteristics in front crawl. Biomech Med Swim VII, 1996.
Presenter Dalton Pessoa Filho is an assistant professor at UNESP, with research field focusing swimming biomechanics and physiological thresholds.
BMS2014—ABSTRACTS HANDBOOK 103

Elite child athlete is our future: bone lumbar spine adaptation in elite Egyptian children monofin swimmers Magdy Abouzeid1 1Alexandria University
Introduction Over the last several years, the monofin has appeared with increasing regularity at swim practices throughout the world. Physical activity during childhood is advocated as one strategy for enhancing peak bone mass as a means to reduce the risk of osteoporosis. Clinical studies have found that non-impact sport like swimming are associated with normal to low bone densities. Little is known about the influence of monofin swimming during childhood on lumbar spine mass. This is a novel descriptive study examining bone mass indices in prepubertal monofin children. The aim of the study was to quantify structural bone lumbar spine adaptation of monofin as a non-weight-bearing sport, and compare the results with non-active healthy age-matched children, and the effects of monofin training on bone health.
Methods Monofin children athletes (n=14, age 12.7±2.6 yr) who had been training for a minimum of 3 years with a volume of 10 h per week were compared with to age-matched control non-active healthy children (n=14, age 13.04±xx yr). All groups underwent dual energy X-ray absorptiometry (DXA) to determine bone density (BMD g/cm2), bone mineral content (BMC g), and bone area (cm2) of lumbar spine (L1-L4) were assessed. Anthropometric parameters (weight, height, chest girth, and leg length), as well as vertical jump was measured.
Results BMD, BMC, and area of lumbar spine of monofin-trained children was significantly greater than control (p=0.01), BMD (1.07±0.08 vs. 0.74±0.05 g/cm2), BMC (44.8± 2.6 vs. 26.9 ± 2.7 g), area (67.7±2.0 vs. 49.4±2.3 cm2). Anthropometrical and muscular power (vertical jump) of monofin was significantly (p=0.01) greater than controls (chest girth (cm) 83.1±3.2 vs. 59.7 ±3.6, leg length (cm) 78.2 ±3.7 vs. 66.5±1.7, vertical jump (cm) was 39.6 ±2.5 vs. 23 ±1.6).
Conclusion Participation in monofin training may enhance BMD, BMC, and area of lumbar spine in prepubertal children, and yield superior morphological shape and fitness, and improved body composition. These positive physiological, anthropometrical, and bone health effects suggest the brisk monofin training can be considered as a useful activity for osteogenic stimulus among prepubertal children.
Presenter Prof Dr Magdy Abouzeid is professor of sport science, physical education at the University of Alexandria University, Faculty of Sports Education, Egypt. He received a PhD(1983) in physiology of swimming training from Alexandria University, Egypt. He has authored over 100 publications in sport science, sport pedagogy, and adapted physical activity, and has edited several books in the area of Aquatics sport training. Dr Magdy Abouzeid is Vice President of International Throwball Federation, member of world organisations and institutions of sport, member of scientific committee and reviewer for the ‘I do movement for culture’, Journal of Martial Arts Anthropology, Member of Egyptian universities Promotion committee(EUPC). Also has been a visiting professor at Suwon University, South Korea (2008–2009).He was awarded with several prestigious international awards including; winner of prince faisal Bin Fahad International Prize for Arab sports research development (Sixth session (Sport Medicine-2008), Dr Magdy was an IOC research scholarship winner, the Award of the 2008ICSEMIS Committee (China, Guangzhou). His current research interests include adaptation to exercise training, training in young athletes, aquatic sports training and its effect on functional capacity, sport for peace and development and other Paralympic research.
104 BMS2014—ABSTRACTS HANDBOOK

CONCURRENT SESSION 8C—BIOMECHANICS 8
Unsteady hydrodynamic forces acting on a robotic arm and its flow field during the crawl stroke Hideki Takagi1, Motomu Nakashima2, Takashi Ozaki3, Kazuo Matsuuchi4 1Faculty of Health and Sport Sciences, University of Tsukuba, 2Department of Mechanical and Control Engineering, Tokyo Institute of Technology, 3SHIMANO INC, 4University of Tsukuba
Introduction In a previous study, we conducted experiments in which we directly measured hydrodynamic forces, pressure distributions, and flow fields around a hand attached to a robotic arm (Takagi et al., 2013). In that study, we investigated simple 2D hand motions; nevertheless, a significant unsteady hydrodynamic phenomenon was observed that reveals the behaviour of certain kinds of vortices play an essential role in generating substantial unsteady hydrodynamic forces. In this study, we use a robotic arm and PIV to clarify the mechanisms by which unsteady forces are generated during 3D crawl-stroke-motions.
Method Measurements were performed for a hand attached to a robotic arm with five degrees of freedom independently controlled by a computer (Nakashima et al, 2012). The computer was programmed so the hand and arm mimicked a human performing the stroke. We adopted an international-level female swimmer as a model, captured kinematic data of the motion of her right upper limb during the crawl stroke, and loaded the data into the computer. We directly measured forces on the hand and pressure distributions around it at 200 Hz; flow fields underwater near the hand were obtained via 2D particle image velocimetry (PIV).
Results The data revealed two mechanisms that generate unsteady forces during a crawl stroke. One is the unsteady lift force generated when hand movement changes direction during the stroke, leading to vortex shedding and bound vortex created around it. This bound vortex circulation results in a lift that contributes to the thrust. The same phenomenon has also been observed in a study of an actual swimmer (Matsuuchi et al., 2009). The other occurs when the hand linearly moves with a large angle of attack, a Kármán vortex street was generated, and clockwise or counterclockwise vortices were alternately shedding from it. At that time, the pressure on the palm side was large and positive, and the pressure difference between the palm and dorsal sides increased, producing a drag force. This drag force must contribute to an increase in the thrust force.
Conclusions We presume that professional swimmers benefit from both mechanisms. Further studies are necessary in which 3D flow fields are measured using a 3D PIV system and a human swimmer.
References Matsuuchi, K., Miwa, T., Nomura, T., Sakakibara, J., Shintani, H., Ungerechts, B.E., 2009. Unsteady flow field around a human
hand and propulsive force in swimming. Journal of Biomechanics 42, 42–47.
Nakashima, M., Takahashi, A., 2012. Clarification of Unsteady Fluid Forces Acting on Limbs in Swimming Using an Underwater Robot Arm (Development of an Underwater Robot Arm and Measurement of Fluid Forces). Journal of Fluid Science and Technology 7, 100–113.
Takagi, H., Nakashima, M., Ozaki, T., Matsuuchi, K., 2013. Unsteady hydrodynamic forces acting on a robotic hand and its flow field. Journal of Biomechanics 46, 1825–1832.
Presenter Hideki Takagi works at the University of Tsukuba teaching a course on biomechanics and swimming practice. He has been engaged in research on the hydrodynamical mechanism for generating thrust force during human swimming.
BMS2014—ABSTRACTS HANDBOOK 105

Effect of jumping timing on resultant height for lift in synchronised swimming Motomu Nakashima1, Go Hatakeyama1, Miwako Homma2, Koji Ito3 1Tokyo Institute of Technology, 2University of Tsukuba, 3Japan Institute of Sports Sciences
Introduction In the ‘lift’ move of synchronised swimming, jumping height is required for evaluation. Therefore, it is quite important to clarify theoretically how the higher jumping height can be achieved. Some technical elements of the synchronised swimming, such as the sculling[1] and the eggbeater kick[2], have been studied from the mechanical viewpoint to date. However, no theoretical approach which can handle the mechanics of a whole move has been conducted. The objectives of this study were to develop the simulation method for the lift of synchronised swimming performed by four swimmers, and to conduct the parameter study in terms of the jumping timing among swimmers.
Method The simulation method was developed by extending the swimming human simulation model ‘SWUM’[3]. An experiment using subject swimmers was carried out to acquire the input data necessary for the simulation, that is, the joint motions and the body geometries of the swimmers. Four female subject swimmers performed the lift in the underwater calibrated area, and their joint angles were acquired by underwater cameras and a motion capture system. Using the input data acquired in the experiment, the simulation of the lift was conducted.
Results The simulated lift motion is shown in the figures. In order to examine the validity of the simulation quantitatively, the simulated and experimental results of the time variation for the vertical displacement of the middle swimmer’s shoulder were compared. Since the maximum discrepancy between the simulation and experiment was merely 5% of the overall elevated distance, the sufficient validity of the present simulation method was confirmed. Using the validated simulation method, the parameter study to increase the jumping height of the upper swimmer was conducted. It was found that the jumping height became maximum when the upper swimmer’s motion was 0.07s earlier.
Conclusions The results of parameter study suggest that the jumping height of the lift changes largely due to even a slight change in the timing of motion between the middle and upper swimmers.
References 1 Ito, S., Trans Japan Soc Mech Eng, Series B, Vol.73, No.734, (2007), pp.2033–2037.
2 Homma, M. and Homma, M., BMS X, (2006), pp.40–42.
3 Nakashima, M., Satou, K. and Miura, Y., J Fluid Sci Tech, Vol.2, No.1, (2007), pp. 56–67.
Presenter Professor Motomu Nakashima received his PhD in 1995. Motomu is now an Associate Professor for Department of Mechanical and Control Engineering in Tokyo Institute of Technology. Motomu’s special interests are computer simulation and its application of swimming.
106 BMS2014—ABSTRACTS HANDBOOK

Computational fluid dynamic analysis of streamlined gliding and freestyle kicking at different depths Andrew Lyttle1,2, Matt Keys1,2, Liang Cheng1, Brian Blanksby1 1University of Western Australia, 2Western Australian Institute of Sport
Introduction Computational Fluid Dynamics (CFD) allows simulation of complex fluid flow regimes and geometry to answer questions that cannot be resolved using current physical testing techniques. The CFD model can predict the propulsion or drag created by each body segment throughout the kick cycle. Therefore, the differences between the forces on the body components when at depth, and at the surface, can be determined. This study aimed to predict the change in net forces for a swimmer gliding and kicking at the water surface compared with a completely submerged swimmer, to gain insights into how and where differences occur.
Methods In a case study approach, the 3D body scan of one world class swimmer was collected. A Finite Volume Method of CFD modelling was used incorporating a realisable K-epsilon turbulence model with a multi-phase fluid domain. Manual video digitising was used to provide the kinematics of the swimmer’s freestyle kick pattern. An initial static CFD model run was performed at 2.00m.s-1 with the swimmer in a streamlined glide position underwater and at the water surface. The wave created around the body was compared to properties obtained via Linear Wave Theory. In a subsequent analysis, underwater freestyle kick simulation at 1.50m.s-1 was compared with the same kicking patterns at the water surface.
Results The differences between the fully submerged and near-surface passive models showed an overall difference of an 18.2% decrease when fully submerged. The overall section of the body above the waist resulted in a 121.7% increase but these increases were counteracted by lower body components. The total change for the lower body components was a 103.5% reduction in drag when compared with the overall submerged segment results. Results from the kicking trials showed higher net forces when kicking underwater compared to the water surface, with a 61.7% change in the momentum/second created.
Conclusion The outcome of this analysis provided an increased level of technical understanding related to the production of net forces during gliding and the freestyle kick. It also demonstrated that forces on various body components can change dramatically from fully submerged to near the surface.
Presenter Andrew Lyttle is the Lead Biomechanist at the Western Australian Institute of Sport where he has been since 2000. Andrew has conducted substantial levels of research into areas from swimming starts and turns; through to being involved in the development of Swimming Computational Fluid Dynamics (CFD) models for analysing swimming technique.
External kinetics measurements in individual and relay swimming starts: a review Luis Mourao1,2, Karla de Jesus1, Kelly de Jesus1, Ricardo Fernandes1,3, João Paulo Vilas-Boas1,3 1CIFI2D, Faculty of Sport, University of Porto, Portugal, 2ESEIG, Porto Politechnique Institute, Vila Conde, Portugal, 3LABIOMEP, University of Porto, Portugal
Introduction Since the 70s, researchers have instrumented swimming starting blocks to measure the external kinetics acting on swimmers (e.g. Stevenson and Morehouse, 1978). As the swimming events have been decided by less than a second, the swimming starting analysis has assumed an important role in sport biomechanists scope. However, the international swimming starting rules and starting block configuration have changed, and none review study was conducted to describe the ‘state of the art’ of starting blocks instrumentation and respective advantages and disadvantages. This study reviewed the swimming literature on starting external kinetics for the purposes of summarising and highlighting existing knowledge, identifying gaps and limitations and challenging new researchers for future projects.
BMS2014—ABSTRACTS HANDBOOK 107

Method A preliminary literature search was performed using PubMed, SportDiscus, Scopus and ISI Web of Knowledge electronic databases, only for English written documents published before September 2013. Keywords including ‘swimming’ and ‘start’ were used to locate documents. Proceedings of the scientific conferences of Biomechanics and Medicine in Swimming (BMS) and the International Society of Biomechanics in Sports (ISBS) from 1970 and 1983, respectively, to 2013 were examined. Included studies were experimental biomechanical approaches in laboratory setting relating to external kinetics assessments on swimming starts. The documents that were available only as abstracts and duplicated studies were excluded.
Results Ultimately, 28 studies were included in this review, of which 10 are peer-review journal articles and 18 are proceedings from the BMS and ISBS Congress series. Twenty-five and 46.42% from the overall starting studies applied the strain gauges and piezoelectric crystals technology, respectively. From the overall included studies, 82.14% analysed the individual ventral starts, followed by 14.28% at backstroke and only 3.57% at relay starts. Twenty-five per cent from the overall ventral starting studies measured the external horizontal and vertical forces acting on the swimmer’s hands. Only one research group has yet published about the upper limbs horizontal force on the backstroke start. Researchers have instrumented the handgrips with load cells or bonded strain gauges directly to the hands bar to measure the overall right and left upper limbs force. To measure the horizontal and resultant lower limbs external kinetics at backstroke starting, researchers have used one force plate, while for ventral starts one and two force plates have been mounted over the starting block to measure mainly the horizontal and vertical reaction force components. Despite most of the research groups have used three-dimensional sensors, only two have studied the lateral force component action on the swimmers’ lower limbs. Moments of force and centre of pressure were assessed once at individual ventral start.
Conclusions Previous studies have presented unique contribution in swimming starts kinetics; however, future researches should focus on devices capabilities improvements based on the current starting block configuration mainly for dorsal and relay starting kinetics analysis purposes, and considering 3D-6DOF analysis of the forces exerted by each of the four limbs.
Acknowledgments CAPES (BEX 0761/12-5/2012-2014) and Santander Totta Bank (PP-IJUP2011-123).
References Stevenson, J.R. & Morehouse, C.A. (1978), In J. Terauds, E.W Bedingfield (Eds.), Swimming Science III (pp.207–214).
Presenter Luis Mourao is a PhD student at the University of Porto.
CONCURRENT SESSION 9A—SOCIAL SCIENCES 2
Exploring beliefs about swimming among children and caregivers: a qualitative analysis Per-Ludvik Kjendlie1,2, Tommy Pedersen3, Trine Thoresen4, Trond Setlo3, Kevin Moran5, Robert Keig Stallman2,6,7 1Norwegian Police Academy, Stavern, 2Norwegian School of Sport Science, 3Sandefjord Community, 4Vestfold University College, 5Auckland University, New Zealand, 6Norwegian Lifesaving Society, 7Tanzanian Lifesaving Society
Introduction Beliefs about what swimming really is may influence expectations in the learning situation. There may be disparity between the ‘providers’ and the ‘clients’. This suggests a need to inform children and caregivers about why specific competencies are important.
Methods As part of a larger study, children (N= 101) and their caregivers (N= 77) were asked to express in writing, their beliefs about what swimming is and about swimming outdoors in waves. All responses were individually recorded. The analysis examined a) the total number and frequency of responses, b) the number of different responses, c) the number of responses per subject, d) the first choices, e) the clusters created when all responses were reduced to similar elements.
108 BMS2014—ABSTRACTS HANDBOOK

Results Few identified more than 2–3 of the 10–12 elements normally recommended. The caregivers had a more nuanced view of what swimming is than the children, with 2.45 (± SD 0.45) responses per subject vs 1.64 (± SD 0.59) responses for the children. Among 101 children, 164 responses were recorded regarding beliefs about swimming, 31 different responses, and 5 clusters of similar responses. Among 77 caregivers, 181 responses were recorded, 37 different responses, and 6 clusters. Regarding the relative risk of swimming outdoors in waves, 116 responses were recorded among the children, 21 different responses, and 9 clusters. Among the care givers 141 responses were recorded, 34 different responses and 7 clusters. The most common responses among children about what swimming is, were: propulsion (28%), to be safe (24%). to float (23%), not to drown (21%). Among caregivers, the most common were: propulsion (53%), to stay afloat (24%).
Conclusions The beliefs of children and parents were less specific and different from expert opinion. The teaching process should include information about the need for certain items in the curriculum.
References 1. International Lifesaving Federation (2012). Basic Aquatic Survival Skill. ILS Position Statement. ILS Drowning Prevention
Commission.
2. Stallman, R., Junge, M, Blixt, T. (2008). Teaching swimming based on a model derived from the causes of drowning. Int. J. of Aquatic Research and Education, 2, 372–382
Presenter Robert Keig Stallman is a retired Assoc Prof at Norwegian School of Sport Science. He has been active in many branches of aquatics for over 50 yrs. He has worked in approximately 12 aquatic organisations in 6 countries. He is still actively writing, researching and presenting.
Can you swim? Teaching teachers of swimming and water safety Jenny Blitvich1, Lauren Petrass1, G Keith McElroy1 1School of Health Sciences, University of Ballarat
Introduction University of Ballarat Exercise and Sport Science degree students must complete a swimming and water safety unit in first year. Their entry level skills vary widely from very limited to national-level competitive swimming. This paper, part of the wider ‘Can you swim’ project, describes a swimming and water safety intervention embedded within their course, designed to enable students to enhance their understanding of knowledge, attitudes and behaviours that contribute to drowning risk; develop personal swimming and survival skills; and establish teaching strategies and sequences for enhancing aquatic skills of others.
Method The ‘Can You Swim Intervention’ survey, modified from the Can You Swim survey (1,2), was completed by 135 students before commencement of the intervention, establishing perceived skill level; water safety knowledge; and self-reported attitudes and behaviour. A practical skills test, matched to the aquatic skills within the survey, followed. The intervention, comprised of 1x1-hour lecture and 2x1-hour practical classes for 11 weeks, was comprehensive, addressing swimming, survival and rescue skills. Given the wide range of entry skills, various strategies were implemented to enable participants to achieve the required standard. Self- and partner-technique analysis was emphasised, and instructor support, both in-class and supplementary to class time, provided. Post intervention, the survey and practical skills testing was repeated and statistical analysis conducted to measure change.
Results Significant improvement in practical skills (400m swim; 100m swim on back; underwater swim; dive) was demonstrated (p<0.001) and perceived swimming ability (rated via a 10 point scale) reflected this change (pre-intervention: M=6.95, SD=1.80; post-intervention: M=7.36, SD=1.44, p=<0.001). Pre-intervention knowledge scores were low (M=37.2%), but improved significantly post-intervention (M=66.4%, p<0.001). There was no significant change in overall attitude scores (p=0.079), although when attitude statements were considered individually, one-third of statements were significantly different, becoming more conservative.
BMS2014—ABSTRACTS HANDBOOK 109

Conclusions The short, comprehensive water safety intervention successfully improved the skills and knowledge of the student participants. While it is important to replicate these findings in a broader sample of participants, this study is the first to provide empirical evidence of the value of a comprehensive aquatic education program as a drowning prevention strategy for young adults.
References 1 Moran K, Stallman R, Kjendlie P, et al. Can you swim? An exploration of measuring real and perceived water competency.
IJARE 2012;6:122–135.
2 Petrass LA, Blitvich JD, McElroy GK, et al. Can you swim? Self-report and actual swimming competence among young adults in Ballarat, Australia. IJARE 2012;6:136–148.
Presenter Associate Professor Jenny Blitvich, Keith McElroy and Lauren Petrass are members of the University of Ballarat Aquatics Research team, and also work collaboratively with an international group of researchers involved in the ‘Can You Swim? Project’. Their research covers a range of topics, including drowning prevention among children, adolescents and young adults; prevention of diving spinal cord injury; caregiver supervision of young children at aquatic environments; water safety for fishers; and improving competitive swimming performance.
Self-rescue in cold water: Nordic conditions Mats Melbye1, Torill Hindmarch1,2 1Norwegian Life Saving Society, 2Norwegian Swimming Federation
During the project, ‘Drowning-preventative Swimming’ (2007–2011,) conducted outdoor, pupils were exposed to cold water, all kinds of weather and other challenging conditions. When considering possible accidents we had to take account the effect of heavy clothing.
In comparing conditions indoors and the swimming skills usually taught, to the conditions outside and the skills needed for self-rescue, we see that we are dealing with opposites. For instance, swimwear gives a low resistance and freedom of movement while being fully clothed gives greater resistance and restricts movement. Warm water enables one to swim effortlessly with the head in the water. Outdoors the high loss of body heat and the need for orientation, necessitates head up skills
The question is what competence is needed for dealing with the challenges in a possible drowning situation?
When looking into the outdoor challenges we will see that they are:
• wide variations in individual ability to cope in cold water
• effects of cold water on the body: cold shock, exhaustion and body cooling
• effects of clothes, waves, currents
• variations between environments
• instability within an environment.
Heat loss is related to movement. In cold water, heat loss when treading water is 34% greater than when lying still. This increases to 50% when swimming and to 82% when drown-proofing.
Conclusion There appears to be an under estimation of personal capabilities in an outdoor aquatic environment which coupled with a lack of awareness of the changeable nature often results in naive risky behaviour. This ignorance seems to be one of the chief causes of drowning.
Swimming lessons need to include skills for survival in a cold outdoor drowning situation in order to:
• personally experience the outdoor environment, determine own capability and realise own limitations related to the actual challenges
• overcome cold shock
110 BMS2014—ABSTRACTS HANDBOOK
• reduce head immersion when falling into water
• achieve a strong leg kick
• use arms effectively under the surface
• use a wide of scope of swimming skills
• swim and float with the head relatively high in the water.
References Melbye, Mats. Selvberging. Drukningsforebyggende svømmeopplæring. Norges Livredningsselskap. Veglederen forlag 2011.
Moran, Real and Perceived Swimming Competency, Risk Estimation, and preventing Drowning among New Zealand Youth.
I Kjendlie, Stallmann og Cabri, Biomechanics and Medicine in Swimming 2010.
Aarvik, Janne Nevra, Overleve. Det hjelper ikke om du flyter, hvis du fryser i hjel, Trygg på sjøen nr. 3 Redningsselskapet 2010.
Presenter Torill Hindmarch has a MA in Early Years Education and worked as an Early Years practitioner. As a nursery school manager, she included swimming and outdoor education in the curriculum. Torill has pioneered aquatic activities for babies and toddlers in Norway since 1981, worked with self rescue and lifesaving for children and adults in England and Norway since 1972. She started three lifesaving clubs for children and young adults in Norway. She now works as an education consultant for the Norwegian Life Saving Society head office in Oslo, responsible for Water Safety education for families and children.
Participation rates and maximal swim performance Andrew Cornett1, Joel Stager2 1Eastern Michigan University, 2Indiana University
Introduction Some regions of the world and/or specific countries perform far better at certain activities than others. Explanations for these disparities frequently include discussion of environmental and/or genetic differences between groups of people. Charness and Gerchak (1996) considered an alternative hypothesis by suggesting that ‘large differences in maximal performance can arise solely from differing participation rates in the target activity’. The purpose of this study was to test the hypothesis that the number of participants in a given geographical region is a significant predictor of the best athletic performance in that area.
Method The 2005–2010 USA Swimming Age Group Detail reports were used to determine the number of swimmers in each age group in each of the 59 local swimming communities (LSCs) in the United States. Also, the USA Swimming Times Database provided access to the best 50-yard Freestyle time in each LSC from 2005–2010 for boys and girls for each age (from 6–19 years). Simple linear regression examined the relationship between the outcome variable (top time) and the predictor variable (log of the number of swimmers) for each combination of age, sex, and calendar year.
Results The log of the number of swimmers in a region was a significant predictor of the top swim time in that region for all 168 combinations of age, sex, and calendar year (p < 0.05) and explained, on average, 41% and as much as 62% of the variance in the top time.
Conclusions These findings have strong implications for national sport strategic policy. Increasing participation in the target activity is one viable strategy for improving regional performance. An alternative, and perhaps more common option, has been to invest considerable resources into existent, high-achieving participants. Further research is required to determine which strategy is more effective at enhancing maximal performance within a geographical region.
Reference Charness, N. & Gerchak, Y. (1996). Participation rates and maximal performance: A log-linear explanation for group differences,
such as Russian and male dominance in chess. Psychological Sciences, 7(1), 46–51.
BMS2014—ABSTRACTS HANDBOOK 111
Presenter Andrew Cornett did his graduate work at Indiana University where he completed master’s degrees in Exercise Physiology and Applied Statistics and a PhD in Human Performance. He is currently an Assistant Professor of Exercise Science at Eastern Michigan University.
CONCURRENT SESSION 9B—BIOMECHANICS 10
The effect of feet placement during the wall contact phase on freestyle turns Jodi Cossor1,2, Sian Slawson1, Paul Conway1, Andrew West1 1Loughborough University, 2High Performance Sport New Zealand
Introduction Freestyle turns have been investigated by a number of researchers with the instrumentation during the wall contact limited to force platforms. The issue with such a method is the inability to determine the position and contribution of individual legs to the overall turn performance. A waterproofed pressure mat was used in this current study to investigate foot orientation as a possible contributor of performance in freestyle turns.
Method Thirty-four university swimmers with an average mass of 76.70 ± 8.56 kg and height 181.41 ± 8.62 cm completed three maximal effort freestyle turns with sufficient rest between each to ensure a full recovery. Measures included 5 m Round Trip Time (RTT), foot placement and orientation on the wall, peak pressure, wall contact time, and maximum depth. Velocity during the last hand entry, and time for wall contact, feet leaving the wall and the first kick were also recorded.
Results Only those trials where both feet came into contact with the sensing area were used for analysis purposes which resulted in 99 of the 102 turns being analysed. Pearson correlations showed significant (p = 0.05) relationships between the criterion measure 5m RTT and (i) rotation time (0.312), (ii) height (-0.718), (iii) mass (-0.739), (iv) tuck index (0.330) and (v) left leg peak pressure (-0.220). Wall contact time, foot width, foot height, orientation, right leg peak pressure and maximum depth did not significantly correlate with freestyle turn performance.
Conclusions This group of swimmers showed similar trends to previous research (Cossor et al. 1999) where turn time was related to the height and mass of the individual while there was no relationship with the placement and pressure of each foot during the wall contact phase and the 5m RTT. Marinho et al. (2010) found an effect on the depth of the swimmer during the glide phase after turns in reducing drag although the maximum depth of the swimmer in this study did not impact on the total turn time. In research examining 8 elite female athletes performing freestyle turns using a 3 m RTT as the criterion measure, Puel et al. (2010) suggested that glide duration and maximal horizontal force were the variables related to improved turning performance. Future research should examine individual foot position on the wall during tumble turns for freestyle specialist swimmers to determine the effect of placement and orientation.
References Cossor, J M, Blanksby, B A & Elliott, B C, 1999. The influence of plyometric training on the freestyle tumble turn. Journal of
Science and Medicine in Sport, 2(2), pp.106–116.
Marinho, D A, Barbosa, T M, Mantripragada, N, Vilas-Boas J P, Rouard, A H, Mantha, V R, Rouboa, A I & Silva, A J, 2010. The gliding phase in swimming: the effect of water depth. In Biomechanics and Medicine in Swimming XI. pp. 122–124. Oslo, Norway.
Puel, F, Morlier, J, Cid, M, Chollet, D & Hellard, P, 2010. Biomechanical factors influencing tumble turn performance of elite female swimmers. In Biomechanics and Medicine in Swimming XI. pp. 155–157. Oslo, Norway.
Presenter Jodi Cossor completed her undergraduate degree at the University of Canberra before completing her Master’s degree at the University of Western Australia looking at the effect of plyometric training on freestyle turns. She worked under the guidance of Dr Bruce Mason for five years at the AIS before moving to the UK to work for British Swimming for eleven years. During this period she commenced her PhD studies in swimming biomechanics through the Mechanical and Manufacturing Engineering department at Loughborough University. In May 2013 Jodi
112 BMS2014—ABSTRACTS HANDBOOK

commenced working for High Performance Sport New Zealand to support their able bodied and Paralympic swimmers.
The importance of sagittal kick symmetry for underwater dolphin kick performance Ryan Atkison1,2, James Dickey1, Volker Nolte1 1The University of Western Ontario, School of Kinesiology, 2Canadian Sport Institute Ontario
Introduction Underwater dolphin kick (UDK) involves simultaneous vertical oscillations of the feet, which are primarily driven by undulations of the body beneath the surface of the water as a means of forward propulsion. Underwater dolphin kick can be broken down into two phases, the downkick and upkick. Advanced swimmers are more effective at the upkick phase than novice swimmers, evidenced by resultant vortex size and structure in the swimmer’s wake1,2. It was therefore the aim of this study to determine how symmetry in the UDK between downkick and upkick is related to UDK performance. Symmetry was assessed by comparing joint angles, frequency, vertical joint velocities and velocity of the CM during the downkick and upkick phases.
Methods Fifteen adult male swimmers between the ages of 18 and 28 (21.5±3.2 years) with at least five years of competitive swimming experience (11.4 ± 5.6 years) ranging from the provincial to the international levels volunteered to participate in the study. Each swimmer was filmed performing three trials of maximum effort UDK over 15 m using an underwater video camera at 30 Hz, secured 0.5m below the water surface and positioned 7.5m from the initial impulse wall. Video frames were manually digitised and each subjects’ single fastest trial was evaluated for between-subject comparisons. Raw data was filtered using a Butterworth filter with cut-off frequencies from 4–5 Hz3. Kinematic variables were calculated for each individual and Pearson product-moment correlations between the average horizontal centre of mass velocity (Vx) and all kinematic variables were calculated. Correlations were considered to be statistically significant at p < 0.05.
Results Horizontal velocity during the downkick, horizontal velocity during the upkick, relative time spent in each phase, maximum chest flexion angle, maximum knee and ankle extension angles, the ratio of flexion/extension for chest, knee and ankle angles, and maximum vertical toe velocity during the upkick phase correlated significantly with Vx (p < 0.05). The ratio of downkick vertical toe velocity/upkick vertical toe velocity was significantly negatively correlated with Vx (p < 0.05).
Conclusions This study tested the hypothesis that faster UDK swimmers would demonstrate a more symmetrical kick than slower UDK swimmers. These results suggest that hyperextended knees and ankles, and symmetrical knee and ankle angles between downkick and upkick phases are important for UDK horizontal velocity. The amount of time spent in each phase may also be an indicator of performance. It appears that most swimmers are able to perform the downkick successfully but have difficulty performing the upkick, likely due to anatomical restrictions at the knees and ankles. These results indicate the importance of kick symmetry for UDK performance, and indicate that performing the upkick phase well appears to be most important for UDK performance.
References 1 Arellano, R. (1999). Vortices and propulsion. In In Applied proceedings: swimming, Perth, W.A., Edith Cowan University,
School of Biomedical and Sports Science, c1999, p.53–66, Australia.
2 Von Loebbecke, A., Mittal, R., Fish, F. & Mark, R. (2009). Propulsive Efficiency of the Underwater Dolphin Kick in Humans. Journal of Biomechanical Engineering, 131, 054504.
3 Winter, D. A. (1990). Biomechanics and motor control of human movement. 1990. John Wiley & Sons, New York.
Presenter Ryan Atkison is an applied sports biomechanist with the Canadian Sport Institute. Ryan completed both his BSc (2008) and MSc (2010) in Kinesiology at the University of Western Ontario, specialising in sport biomechanics. He is also a Certified Strength and Conditioning Specialist with the National Strength and Conditioning Association. Ryan has more than 20 years of experience in the sport of swimming, as an athlete, coach and applied sport scientist. Currently, Ryan provides biomechanics and performance analysis support for swimming based out of the Toronto National Training Centre. In addition, Ryan is an active contributor to regional and national research and innovation
BMS2014—ABSTRACTS HANDBOOK 113

programs aiming to bring world-class biomechanics and performance analysis support to Ontario’s high performance sporting community.
Elliptic model for evaluation of tumble turn in swimming Teruo Nomura1, Toshiaki Goya2, Tetsuro Tanigawa1 1Kyoto Institute of Technology, 2Aichi University of Education
Introduction Much research on kinematic involved tumble turn performance had been made. However, there was not observed parameters to evaluate the trajectory of rotation. The purpose of this study was to evaluate of the tumble turn in swimming based on an elliptical model.
Method Subjects were 15 junior male swimmers at the regional level. The subjects were asked to perform 15m round trip crawl including a tumble turn as fast as possible. Three cameras were set up at pool side, underwater and 15m point. Those have been synchronised by the video mixer. A side view of the turn was analysed for each swimmer by digitising of the head and other anatomical points. 2D coordinates were transformed into real space coordinates using a 2D-DLT algorithm. The trajectory of the head during the rotation period was approximated by an elliptical model. The correlation coefficient among the elliptic index (inclination, major axis, and minor axis) and 15 turn performance index (head depth, 3m turn-in time, 15m turn-out time, so on) were calculated.
Results Mean and standard deviation of the ellipse coefficient were as follows: the inclination showed 65.9 (7.0) deg., the major axis indicated 0.51 (0.08) m, minor axis was 0.34 (0.10) m. The trajectory of head was well fitted to the ellipse model (r=0.90 or more). The inclination had significant correlation (r=0.795, p<0.01) with the 15m turn-out time 7.72 (0.36) sec. Thus, the significant negative correlation (r=-0.766, p<0.01) between the major axis and the head depth -0.59 (0.05) m. Furthermore, the minor axis was significantly positively correlated (r=0.569, p<0.05) with the 3m turn-in time 2.21 (0.12) sec.
Conclusions Shallower inclination of the ellipse had advantageous to turn performance, affirming that the place where rotation starts were the horizontal distance from the swimmer’s head to wall when the head begins to sink underwater (Puel et al., 2012). It seemed that the positive correlation between the minor axis and the turn-in explained a flattened rotation contributed to turn performance.
References Puel, F., Morlier, J., Avalos, M., Mesnard, M., Cid, M. & Hellard, P. (2012). 3D kinematic and dynamic analysis of the front crawl
tumble turn in elite male swimmers. Journal of biomechanics, 45(3), 510–515.
Presenter Dr Teruo Nomura is a Professor of Human Performance Laboratory in Department of Applied Biology at Kyoto Institute of Technology. He is a former chairman of the Scientific Committee in Japan Swimming Federation. Currently he is director of the Japan Society of Coaching Studies and editor of International Journal of Sport and Health Science.
CONCURRENT SESSION 9C—BIOMECHANICS 9
How competitive swimmers adapt their inter-limb coordination to drag perturbation Ludovic Seifert1, Christophe Schnitzler2, John Komar1, Vladislav Dovgalecs1, Chris Button3 1CETAPS EA3832, University of Rouen, France, 2University Marc Bloch, France, 3School of Physical Education, University of Otago, New Zealand
Introduction Swimming skill is mostly analysed in terms of performance outcomes. But understanding expertise goes beyond the ‘how fast can you swim’ question. Adaptability, considered as the capacity of participant to modify their behaviour to respond to subtle modification in the constraint acting on them, might also be a key concept to investigate. By
114 BMS2014—ABSTRACTS HANDBOOK

artificially generating perturbation to the swim stroke in population differing in their expertise level, we hypothesised that better swimmer would exhibit better motor adaptability to constraints than recreational swimmers, brought about by a subtle blend between behavioural stability and flexibility.
Methods Six competitive and six recreational, male swimmers performed an intermittent flume test composed of five randomised stages (60%, 65%, 70%, 75%, 80% of maximum speed) with four minutes of rest between stages. Each stage consisted of swimming freestyle at a predetermined location (above a line marked on the floor of the flume) for 15 cycles at the given speed; then a drag perturbation was applied (the swimmer was towed with a cable 1m backward from the line). Immediately after, the swimmer had to return as fast as possible to above the line, before continuing to swim for 10 further cycles. One lateral camera recorded the number of cycles to recover to the line after the perturbation. Three inertial measurement units (coupling 3D accelerometer, 3D gyroscope, 3D magnetometer, MotionLog, MOVEA©) fixed on the right and left wrist and pelvis were used to compute stroke rate and arm coordination (Dadashi et al., 2013). Arm coordination was assessed by the index of coordination (IdC, Chollet et al., 2000). Arm coordination flexibility was measured by comparing the standard deviation of IdC for 10 cycles prior to and after the perturbation. Inter-arm coordination stability was assessed by the number of cycles needed to recover to: (i) the line, (ii) the initial pattern after the perturbation.
Results Competitive swimmers only needed three to four cycles to go back to the line after the perturbation. The time to come back to their previous coordination mode varied as a function of the flume speed. At highest velocities, it sometimes took up to 10 swim cycles. Recreational swimmers showed two different behaviours, also depending on the speed; either: 1) they were not able to recover the line, or; 2) they were able to recover the black line after eight to nine cycles but without changing significantly their arm coordination pattern.
Conclusion Competitive swimmer seemed to adapt very reactively to the perturbation, by generating acceleration of high magnitude to come back to their previous swim location. This adapting behaviour was accompanied by a much wider range of coordination mode than the recreational group. In contrast, recreational swimmer could only slightly change their coordination mode, and thus often failed to generate sufficient acceleration to complete the task. This might explain why they were only able to cope with small amounts of perturbation. Adaptability to drag perturbation seems thus to be an interesting candidate to investigate expertise level in swimming, and offers promising potential applications to test arm coordination flexibility.
References Chollet D., Chalies S., Chatard J.C. (2000). A new index of coordination for the crawl: description and usefulness. Int J Sports Med,
21, 54–59.
Dadashi F., Crettenand F., Millet G.P., Seifert L., Komar J., Aminian K. (2013). Automatic front-crawl temporal phase detection using adaptive filtering of inertial signals. J Sports Sci, 31, 1251–1260
Presenter Ludovic Seifert is associate professor at the faculty of Sport Sciences of Rouen in France and works on Sport Biomechanics and Motor Control with a special focus on inter-limb coordination in relation to skills acquisition and high level of expertise achievement.
Between stability and flexibility of expert arm–leg coordination in breaststroke swimming John Komar1, Didier Chollet1, Ludovic Seifert1 1CETAPS, University of Rouen
Introduction Analysis of arm–leg coordination in breaststroke swimming has shown that experts were able to dissociate arms and legs propulsive actions in order to achieve a streamlined position of one pair of limbs while the other pair propels (Seifert, et al. 2010). Authors therefore defined a functional role of intra-cyclic variability of arm–leg coordination for expert, when beginners were not able to exhibit this variability and then remained ineffective. In the meantime, a functional role of inter-cyclic variability of arm–leg coordination was revealed in adapting the coordination to different swimming speeds (Komar, et al. In press). In the present study, the aim was to investigate a potential functional role of stability of key points of arm–leg coordination in breaststroke (i.e. regarding different speed conditions and skill levels), therefore redefining expertise as a subtle blend between stability and flexibility.
BMS2014—ABSTRACTS HANDBOOK 115

Method Twenty-one swimmers (7 experts, 7 intermediates, 7 novices) performed in breaststroke two 25m swims at 90% of their maximal speed and two 25m swims at 70% of their maximal speed. During each performed sub-maximal trials, 4 underwater and 2 above water cameras recorded one cycle in the central part of a 25m pool (following Komar, et al. In Press). Digitising of anatomical landmarks on video (wrist, elbow, shoulder hip, knee, ankle) allowed the 3-D reconstruction of knee and elbow joint angles using APAS software. Thereafter, the arm–leg coordination was characterised by the Continuous Relative Phase between these two joints (CRP in degrees). For instance, a CRP close to 0° indicates a glide position with arms and legs fully outstretched (i.e. knees and elbows around 180°), when a CRP close to -180° indicates that elbows are maximally flexed when knees are maximally outstretched or vice versa. Two-way ANOVA (speed * level of expertise) were then performed on key points of the CRP curves (CRP at the beginning of the cycle, maximal value, glide duration (i.e. time with arms and legs outstretched), time spent in in-phase coordination).
Results
Table 1 Significant differences in coordination parameters between level of expertise (*) and speed conditions (♯) (mean and sd are given regardless the speed condition), all p<.05
Level of expertise CRP at the beginning of the cycle (°)* Maximal value of CRP (°)*
Glide duration (% of cycle duration)*
Time spent in in-phase coordination (% of cycle duration)*
Novice M=-41.3 sd=28.1 ♯ M=53.6 sd=22.5 ♯ M=7.4 sd=5.2 M=43.3 sd=15.2 ♯
Intermediate M=-109.0 sd=18.6 ♯ M=45.9 sd=17.2 ♯ M=32.8 sd=11.2 ♯ M=16.3 sd=9.1
Expert M=-172.8 sd=6.2 M=1.1 sd=10.9 M=32.0 sd= 7.1 ♯ M=8.4 sd=3.4
Conclusions As expected, results showed that expertise relates to adapting the arm–leg coordination to the swimming speed. More precisely, this adaptation mainly resides in the glide duration, as expert and intermediate swimmers were able to adapt their glide duration to lower swimming speeds. In the meantime, results also showed that expertise also resides in the stabilisation of key points of the cycle. Indeed, expert swimmers were able to maintain at the beginning of the cycle a value of CRP close to -180° whatever the swimming speed condition, as well as a maximal value close to 0°. Expertise might therefore be defined as both a functional stability and a functional flexibility. In this idea, intermediate swimmers appeared as managing the required flexibility prior to the required stability of key points of the coordination.
References Komar, J., Sanders, R., Chollet, D., Seifert, L. (in Press). Do qualitative changes of inter-limb coordination lead to effectiveness of
aquatic locomotion rather than efficiency. Journal of Applied Biomechanics.
Seifert, L., Leblanc, H., Chollet, D., Delignières, D. (2010). Inter-limb coordination in swimming: effect of speed and skill level. Human Movement Science, 29(1), 103–13.
Presenter John Komar completed last June at the university of Rouen a PhD in motor learning, focusing on learning arm–leg coordination in breaststroke swimming using a non-linear pedagogical approach. He now holds a post-doctoral position at the University of Rouen aiming to model inter-limb coordination in swimming (freestyle and breaststroke) and the dynamics of learning these coordinations.
On the movement behaviour of elite swimmers during the entry phase Sebastian Fischer1, Armin Kibele1 1Institute of Sports and Sport Science, University of Kassel
Introduction Although empirical evidence on the importance of the underwater phase for the swimming start (Guimaraes & Hay, 1985; Vint et al., 2009) and on the gliding phase (Marinho et al., 2010, Elipot et al., 2010) exists, there is little research on the optimal movement behaviour during the entry phase.
116 BMS2014—ABSTRACTS HANDBOOK

Method A 50m sprint test was performed in a cross sectional study on the starting behaviour of 46 elite swimmers (28 males and 18 females, 100m Record in FINA Points: 805 ± 61). The movement behaviour during the entry phase was analysed with a new method to identify segment mid-lines (ABKuS-method by Fischer, 2013). This method allows for body coordinate identification during visual distortion caused by air particles carried along the body surface. A factor analysis (method: varimax with Kaiser normal distribution) in combination with a cluster analysis (method: Ward) was carried out to determine different movement behaviours.
Results In the multivariate analysis, factors such as duration, hip-angle and deflection behaviour at the entry phase, immersion depth, horizontal entry speed, water displacement and kick-effectiveness were identified. These factors account for 87.6% of the total variance in the movement behaviour of the entry phase. Based on these factors, three different movement strategies were detected in the cluster analysis. These strategies consisted of flat entry, pike entry with a quick deflection movement, and pike entry with a delayed deflection movement.
Conclusion For the elite swimmers, different movement strategies during the entry phase were found. These strategies can be attributed to differences in the hip-angle during the water entry, the deflection movement, the duration of the entry phase, as well as the water displacement.
References Elipot M, Dietrich G, Heilard P & Houel N (2010). High-level swimmers’ kinetic efficiency during the underwater phase of a grab
start. J Appl Biom, 26, 501–507.
Fischer, S. (2013). Kinematische und dynamische Analyse des Schwimmstarts vom Block unter besonderer Berücksichtigung der Eintauch- und Übergangsphase [Kinematic and kinetic analysis of the swim starts from the block with spezial emphasis on the entry and transition phase]. Doctoral thesis at the University of Kassel (http://nbn-resolving.de/urn:nbn:de:hebis:34-2013022742534)
Guimaeres ACS & Hay JG (1985). A mechanical analysis of the grab starting technique in swimming. Int J Sport Biom, 1, 25–35.
Marinho DA, Barbosa TM, Mantripragada N, Vilas-Boas J, Rouard A, Mantha V (2010). The gliding phase in swimming: The effect of water depth. In PL Kjendle, RK Stallman & J Cabri (Eds.), Biom Med Swimming XI. Proc XI Int Symposium Biom Med Swimming. Oslo: Norwegian School of Sport Sciences.
Vint P, Hinrichs R, Riewald S, Mason R & McLean S (2009). Effects of handle and block configuration on swim start performance. In IK Andrew, J Harrison & R Anderson (Eds.), XXVII Int Soc Biom Sports Conference. Ireland: Limerick.
Presenter Sebastian Fischer received his PhD from the University of Kassel in 2012.
Effect of different protocol step lengths on swim efficiency and arm coordination in front crawl swimmers Kelly de Jesus1, Karla de Jesus1, J Arturo Abraldes2, J Paulo Vilas-Boas1,3, Ricardo Fernandes1,3 1CIFI2D, Faculty of Sport, University of Porto, Portugal, 2Faculty of Sport Sciences, University of Murcia, Spain, 3Porto Biomechanics Laboratory, University of Porto, Portugal
Introduction In competitive swimming, the evaluation of physiological and biomechanical parameters has been made through protocol step lengths selected from a range from 200 to 400 m (~ 3–7 min or less). However, the duration of the protocol steps is still a controversial issue, since some authors require steps of at least 4 min duration to accurately determine a given variable (Bentley et al. 2007). Fernandes et al. (2011, 2012) showed that shorter step lengths (i.e. 200 m or ≤ 3 min) are valid to assess physiological parameters (e.g. blood lactate concentrations and maximal oxygen uptake), but it remains questionable if shorter step lengths affects swimmers’ biomechanics. It was aimed to compare incremental protocols with different step lengths to observe eventual changes in technique related parameters.
Method 11 national level swimmers (20.4±2.5 yrs, 1.80±0.06 m and 74.1±4.12 kg) performed three variants of a front crawl incremental and intermittent protocol (7x200, 7x300 and 7x400 m) until exhaustion, with increments of 0.05 m/s and 30 s rest intervals between steps, and 48 h between each protocol variant. Swimmers were videotaped in the
BMS2014—ABSTRACTS HANDBOOK 117

sagittal plane at the 7th 25 m lap of each step using a dual-media set up. APASystem was used to obtain the swim efficiency and arm coordination parameters, particularly: (i) intracycle velocity variation of the horizontal displacement of the hip (IVV); (ii) difference between maximal and minimal hip velocity within the stroke cycle (ûv); (iii) propelling efficiency, as a ratio between swimming speed squared and average and speed square (û); (iv) index of coordination (IdC), assessed by measuring lag time between the propulsive phases of each arm and expressed as the percentage of the overall duration of the stroke cycle. Friedman’s test was used to compare each step of the three protocol variants (P ≤ 0.05).
Results Comparison among each step of the incremental protocols variants did not show differences for swim efficiency and arm coordination. The results were respectively for 7x200, 7x300 and 7x400 m (i) IVV 0.16 to 0.18, 0.21 to 0.23, 0.20 to 0.21; (ii) ûv 1.08 to 1.12, 1.05 to 1.26, 0.80 to 0.95; (iii) û1.47 to 1.78, 1.52 to 1.89, 1.54 to 1.80; (iv) IdC -7.6 to -1.89, -8.41 to -0.18, -7.37 to -0.14. All the comparisons for a Mean Rank > 1.50 and a P value > 0.05.
Conclusions Distances of 200, 300 and 400 m did not induce meaningful kinematical and arm coordination differences among the incremental intermittent protocol. As regular training sessions or training camps involves a large number of swimmers to be assessed, spending less time with such procedures will be an advantage not only for research, but also for training purposes. Therefore, due to pragmatic reasoning, a protocol with shorter step lengths (i.e. 200 m) should be adopted for both energetic and biomechanical characterisation since it will increase the logistics efficiency with the minimum impact in the data internal validity.
References Fernandes et al. (2012). Int J Sports Med, 33(12), 1010–1015. Fernandes et al. (2011). Int J Sports Med, 32 (12), 240–246. Bentley
et al. (2007). Sports Med, 37(7), 575–586.
Acknowledgments PTDC/DES/101224/2008 (FCOMP-01-0124-FEDER-009577); CAPES 5431-10-7/2011.
Presenter Kelly de Jesus is a PhD student at Faculty of Sport, University of Porto, Portugal. The work that will be presented is a part of her PhD project, which the theme is related to a biomechanical and bioenergetical characterisation during different incremental protocol step lengths.
CONCURRENT SESSION 10A—SOCIAL SCIENCES 3
Decrement in the performance of swimming skill with the added burden of outer clothing Bente Laakso1,2,3, Ebbe Horneman4, Rannei Grimstad3, Robert Keig Stallman1,5,6 1Norwegian Lifesaving Society, 2Norwegian Swimming Federation, 3Lillehammer Community, 4Lillehammer University College, 5Tanzanian Lifesaving Society, 6Norwegian School of Sport Science
Introduction Most drowning occurs after an involuntary fall into open, deep water. Thus the victim usually is wearing outer clothing. The added burden of clothing may reduce the chance of survival.
Methods Grade Four children (n = 490) swam a 200 metre combined test, twice. Half randomly swam with outer clothing first, half without. The test included a) jump or dive into deep water, b) swim 100 metres on the front, c) stop and rest—both on front and on back, d) swim 100 metres on the back, e) climb out over edge of pool. Each skill was scored from 0 to 2.0, a perfect score being 12.0. The Wilcoxen Signed Rank test was used to test the significance of the difference between treatments. Total scores with and without outer clothing were correlated using the Spearman rho.
Results The average total scores were 10.65 without outer clothing and 8.55 with (of 12.0). The Wilcoxen Z score was 2.79, statistically significant at p = 0.005. The Spearman rho between the two scores was 0.41. Of those who were judged able to swim without outer clothing, a significant number were judged unable to swim with outer clothing. This was
118 BMS2014—ABSTRACTS HANDBOOK

true at whatever level ‘can swim’ was arbitrarily placed. Among those who scored best, the difference between without and with clothing was considerably less than among those who scored poorly.
Conclusions The added burden of clothing significantly affected skill performance. It cannot be assumed that one who can swim without outer clothing, can swim with. The moderate correlation between scores suggests that economical movement may be the quality which transfers from without to with clothing.
References Laakso B, Honeman EK, Grimstad R, Stallman RK (2013). ‘Quantifying the added burden of swimming with clothes’. Presented at
the annual Lifesaving Conference of the Lifesaving Foundation, Dublin, March, 2013.
Presenter Robert Keig Stallman is a retired Assoc Prof at Norwegian School of Sport Science. He has been active in many branches of aquatics for over 50 yrs. He has worked in approximately 12 aquatic organisations in 6 countries. He is still actively writing, researching and presenting.
Self-rescue and baby swimming: combining the child’s perspective with a drowning prevention intention Torill Hindmarch1,2 1Norwegian Life Saving Society, 2Norwegian Swimming Federation
Goals for baby swimming include learning self-rescue, good motor development, family bonding and general wellbeing. Methods of practice have relied on the use of innate survival reflexes to teach breath control. We have concerns regarding the psychological effects of imposing a stressful situation on the baby and how this affects the parent-child relationship. We question the learning process in the light of contemporary research into Early Childhood Education. Is there a risk of traumatisation or negative aquatic development for some children? How important is the child’s well-being in the learning process?
Interviews with experienced baby swimming instructors have given us a wealth of information on the effectiveness of programs and different practices. Work is on-going to enable comparison of practice, while video analysis of baby classes enables us to assess the babies’ reactions to teaching methods. Also parental interviews or questionnaires will help us gain an understanding of their experience of for baby swim classes.
The Introduction of a new award system for self-rescue provided us with benchmarks to make a comparative analysis of goals and attainment between old and new teaching perspectives.
Results are still being collated and analysed but there is evidence of:
• Parents who ‘train’ their child have less successful outcomes than those with a playful approach.
• Where conflict situations occur between parent and child during the class, quite often there is a failure to complete the program.
• Some parents encouraged activities that led to risk-taking behaviour.
• Transference of skills to other situations was not always apparent.
Gentler methods seem to strengthen the parent’s communication with the child, in turn influencing the outcomes for aquatic management.
Parents must be aware of the drowning prevention perspective, as well as an understanding of the child’s perspective, in order to reduce over estimation of abilities.
More research is needed to give us further material on which to develop our strategies and give the best possible aquatic education for our children and their families.
References Trevarthen, C. & Delfield-Butt, J. (2013). Biology of Shared Experience and Language
United Nations. (1989) Convention of the Rights of the Child. New York: UN Convention
BMS2014—ABSTRACTS HANDBOOK 119

Hindmarch, T; The Lifesaving Foundation Drowning Prevention and Rescue Conference 2013
Presenter Torill Hindmarch has a MA in Early Years Education and worked as an Early Years practitioner. As a nursery school manager, she included swimming and outdoor education in the curriculum. Torill has pioneered aquatic activities for babies and toddlers in Norway since 1981, worked with self rescue and lifesaving for children and adults in England and Norway since 1972. She started three lifesaving clubs for children and young adults in Norway. She now works as an education consultant for the Norwegian Life Saving Society head office in Oslo, responsible for Water Safety education for families and children.
Lane bias at the 2013 World Swimming Championships Chris Brammer1, Andrew Cornett2, Joel Stager1 1Counsilman Center for the Science of Swimming, Indiana University, 2School of Health Promotion and Human Performance, Eastern Michigan University
Introduction Anecdotal reports from the 2013 FINA World Swimming Championships in Barcelona suggested that 50-metre performances were biased, presumably due to a current. When swimming towards the finishing end of the pool, swimmers were rumoured to be at a competitive advantage if they were in lanes 7 and 8 and at a disadvantage if they were in lanes 1 and 2. If true, FINA’s mission to ‘provide a fair and drug free sport’ was compromised, and many athletes may have been unduly handicapped or unfairly facilitated. The purpose of this study was to analyse the available performance data in order to determine the merit of these rumours.
Method Performance data from the 2013 FINA World Swimming Championships were analysed. The per cent change in performance time (prelim to semis and semis to final) was calculated for the top-16 swimmers in each 50-metre event. Observations were categorised by lane group (1–4 or 5–8) and compared using a one-way ANOVA. To support the 50-metre analysis, the mean lap difference (odd split – even split) for each lane in the 1500-metre freestyle was compared to the overall mean difference (-.07 s) using one-sample t-tests.
Results Regarding 50-metre performances, there was a significant effect of lane group (F(3,186) = 31.26, p < 0.001). When swimmers transitioned from lanes 1–4 for their first swim to lanes 5–8 for their second, they improved approximately 1%, which was significantly greater than any other group. When swimmers were in lanes 5–8 for their first swim and 1–4 for their second, they were slower by about 0.5%, which was a significantly worse result than other possible scenarios. For the 1500-metre freestyle, the mean difference between odd and even splits was significantly different (p < .05) from the overall mean difference for each lane. The difference moved from decreasingly negative in lanes 1–4 to increasingly positive in lanes 5–8.
Conclusions The existence of a current is the only scenario that we can propose to explain this performance bias. Given that many of the competitors’ careers and income are dependent on a high-ranking championship performance, a change in policy is needed to prevent similar biases from happening in the future.
Presenter Chris Brammer says his experience in and perspective on the art of coaching and science of swim performance has left him with a desire to further our understanding of human performance, and to provide the swimming community with objective information regarding all aspects of swim performance. Along the same lines, he has a keen interest in the development of measurement tools, training devices, and protocols specific to swim performance, and thereby hopes to advance data collection and analysis in the sport of swimming.
120 BMS2014—ABSTRACTS HANDBOOK

Self-training strategies in leisure swimmers: gender and age effects François Potdevin1, Clement Normani1, Michel Sidney2, Patrick Pelayo2 1Lille 2 University, 2Physical, Activity, Muscle and Health (EA 4488), University of Lille, France
Introduction Many well reports described the quantification of physical activity in several fields such as work, home activities or sports. In France 3 millions of people are committed in leisure swimming (Lefevre and Thiery, 2010). They could be defined as self-trained swimmer since they are not registered in any social structure. Paradoxically, few studies have investigated the quantitative and qualitative description of training procedures used by this specific population. It appears to be relevant because self-regulatory training such as goal setting or self-monitoring progress contributes to keeping them physically active (Dishman, 1982). Thus, the purpose of this study was to describe swimming sessions from regular self-trained swimmers from a quantitative and qualitative point of view.
Method 387 self-trained adult swimmers (60.2% of male and 39.8% of female) were recruited through the French website http://www.nageurs.com. All self-reported parameters by the online survey were age, gender, practice frequency, supervision in physical activity experiment, main training target, main reason for swimming choice, swimming session duration and distance, most used swimming stroke and material, quality of the training control, and training evolution during a year. Chi 2 tests were used to assess gender and age effect according distance, duration and materials used. Multiple Correspondences Analysis (MCA) was used to unravel the complex interactions between age, gender and the contents of session variables, and detect typology of self-trained swimmers. Level of confidence was set at .05.
Results Significant gender effect has been detected for swimming session distance (1818.8 ± 644.5 m vs 1453.0±603.3 m, p< .05, respectively for male and female). Kickboard (29.2% vs 18.2%) and fins (16.9% vs 8.4%) are more used by female than by males significantly. On the contrary, pull buoy (32.9% vs 14.9%) and paddles (9.3% vs 1.3%) are more used by male swimmers. MCA highlighted 2 factors axis corresponding respectively to 53% and 11% of the total variance. Axis 1 is accounted by the contents of the swimming session (distance, duration, swimming stroke) and gender, while on the second axis the contribution of age and strategies (evolution of training, training targets and reason for swimming) are dominant.
Conclusions Results have highlighted different training strategies and targets according to gender and age. Male strategy consists in performing higher distance (1818.8±644.5 m vs. 1453.0±603.3, p< 0.05 for male and female respectively) by using several swim stroke and gears involving upper body muscles (front crawl, pull buoy and paddles). More concerned about duration of their sessions, women are mainly using breaststroke. We also have established a connection between motives according to ages and long term strategies. The main motivation for middle aged people appears to be general health benefits by performing identical swimming session without evolution during a year. People aged from 20 to 30 are divided between an identical swimming session strategy and an increase in distance or in intensity strategy during a year. These strategies have to be taken into account in order to improve practical swimming environment and physical education programs.
References Lefebvre, B., and Thiery, P. (2010) Study of physical activity in France. Available from URL
http://www.sports.gouv.fr/index/communication/statistiques/stat-info/stat-info-68
Dishman, R. (1982) Compliance/adherence in health related exercise. Health Psychology 1, 237–267.
Presenter Dr François Potdevin is assistant professor in faculty of sport sciences in Lille, France. His research focuses on swimming with a multidisciplinary approaches.
BMS2014—ABSTRACTS HANDBOOK 121

CONCURRENT SESSION 10B—MEDICINE 1
Evaluation of master swimmers health: the case of French National Championships François Potdevin1, Gilles Vanlerberghe1, Gauthier Zuinquin1, Thierry Pezze1, Denis Theuninck1 1Research Team in Sport and Society
Introduction Among physical activity exercises, swimming is often recommended to increase physical activity and gain health benefits by various authoritative groups and researchers (European society of hypertension, 2003). According to World Health Organization, the health concept has to be defined as ‘a complete state of mental, physical and social well being’ and considered as ‘a resource for every day life’ suggesting a multi-physical-psychological and social parameters analyses in order to study health benefits. ‘Competitive master swimmers’ appeared to be interesting subjects in the study of health benefits by swimming because they spend more time training in comparison with the average sedentary person and allowed a long term effect of this practice. The aim of this study was therefore to assess global health benefits of practice swimming in master population involved in a national level of practice.
Method 490 master swimmers (227 females and 263 males) were recruited during the French master swimming championships. Participants were aged from 25 to 95 years old. Mental and social health was measured by the SF 36 test (Jenkinson et al., 1993). Body Mass index (BMI, kg.m2), and Peak Expiratory Flow (PEF, L.min-1) were measured and considered as physical health parameters. Health scores (SF 36 and PEF) were compared with standard values issued from French or European database. Prevalence of overweight and obesity were defined as, respectively, 25 ≤ BMI < 30 kg/m2 and BMI ≥30 kg/m2. Prevalence of obesity and overweight in master swimmers were compared with French references (Charles et al., 2008). Level of confidence was set at .05.
Results No significant difference was observed between prevalence of overweight and obesity in master swimmers and French population. Results for PEF showed higher pulmonary performances for female swimmers from 25 to 60 years in comparison with standard values. Only men from 40 to 50 years old performed significant higher PEF scores than normative values. SF 36 results showed higher health scores for women concerning physical limitations (from 45 to 64 years old) and vitality (from 25 to 64 years old). Results concerning pain perception showed lower health scores for women swimmers (from 35 to 45 years old). For male, results showed higher health scores for vitality (from 45 to 64 respectively) and lower scores for pain perception (from 35 to 55 years).
Conclusions The no difference of the prevalence of overweight and obesity in master swimmers confirmed the lack of effect of the swimming practice on the bodyweight decrease. A competitive swimming practice for master swimmers appeared to be positive for several parameters of health. Nevertheless, all health parameters were not higher for master swimmer in comparison with standard values. It could be pointed out the higher benefices for women than for men. This could be explained by the lower physical activity of women in a standard population, increasing the difference with women master swimmers in mental and physical health parameters. Surprisingly, the ‘perception of pain’ appeared higher in master swimmers (male and female) whereas ‘vitality’ or ‘physical limitations’ were higher than standard population. Further investigations are needed in order to measure accurately the real benefits of a long swimming practice.
References European Society of Hypertension – European Society of Cardiology guidelines for the management of arterial hypertension.
Guidelines Committee. J Hypertens 2003; 21:1011–1053
Jenkinson C, Angela Coulter A, Lucie Wright L. 1993. Short form 36 (SF36) health survey questionnaire: normative data for adults of working age, British Medical Journal (306), p 1437–1440.
Presenter Dr François Potdevin is assistant professor in faculty of sport sciences in Lille, France. His research focuses on swimming with a multidisciplinary approaches.
122 BMS2014—ABSTRACTS HANDBOOK

Relationships between body composition and success in competitive swimming Milivoj Dopsaj1, Radoje Milic2, Andera di Nino3 1University of Belgrade Faculty of Sport and Physical Education, Serbia, 2University of Ljubljana Faculty of Sport, Slovenia, 3ADN Swim Project, Italy
Introduction Anthropometric characteristics and the somatotype are the elements that describe body shape and composition in humans. Physical characteristics are very important as they are closely related to the results in competitive swimming through the laws of fluid mechanics. The aim of this study was to examine the associations between body composition and maximum achievements in competitive swimming by senior elite swimmers of both genders.
Method The sample consisted of 40 elite swimmers (Females: N=24, Age=19.8±3.6 yrs, BH=171.6±7.4 cm, BM=62.0±7.0 kg, FINA Score 2013=732±84 points; Males: N=16, Age=23.3±4.9 yrs, BH=184.8±5.7 cm, BM=81.2±7.1 kg, FINA Score 2013=778±68 points) from different European countries (RS, SI, RU, EE, BY, TR). Multi-channel electrical bioimpedance was applied to measure the body composition using the InBody720 analyser. In the study, the criterion variable was the value of the absolute best result achieved in the given competition microcycle, expressed as the FINA score 2013, while the predictor variables (N=12) defined the body composition. The original variables were protein mass (kg), fat mass (kg) and skeletal muscle mass (kg); the derived variables were % of protein mass (%), % of fat mass (%), % of skeletal muscle mass (%); and, the index variables were body mass index (kg∙m-2), muscle mass index (kg∙m-2), fat mass index (kg∙m-2), lean body mass index (kg∙m-2) and protein fat index (kg). Body composition was measured in a range of competition microcycles during the seasons of 2011 and 2012 so that the relevant body composition could be compared to the respective maximal result achieved. Statistics were obtained by correlation analysis and multiple regression analysis (MRA).
Results The results showed that in males, the highest correlation was found between the swimming score and the protein fat index (PFI, r=0.573, p=0.000) as the ratio between body protein and fat, while in females it was the skeletal muscle mass (SMM, r=0.600, p=0.000) as the absolute amount of body muscle mass. MRA was used to define the prediction models for swimming achievements associated with body composition. For males, the model comprised 6 variables, with adjR2 = 0.554, St. Err. = 43.6 FINA score; for females, the model comprised 4 variables, with adjR2 = 0.484, St. Err. = 60.0 FINA score.
Conclusions The research results showed that besides anthropometric characteristics and the somatotype, the body composition analysis could contribute significantly to achieving top scores in swimming competitions. In addition, it was found that the differences in body composition between female and male swimmers had different effects on the score so that further research is required in order to reach definite conclusions on the associations between the studied phenomena and the final prediction models for swimming achievements.
References Thanopoulos, V., Dopsaj, M., Nikolopoulos, A. (2006). The relationship of anthropomorphological characteristics of crawl sprint
swimmers of both genders with critical speed at 50 and 100 m. Revista Portuguesa de Ciencias do Desporto (Portugese Journal of Sport Sciences), 6(2): 107–109.
Presenter Milivoj Dopsaj, PhD, Vice dean for Science, Faculty of Sport and Physical Education, Professor, University of Belgrade, Belgrade, Serbia, Department of Theory and Technology of Sports Training Science Analysis and Diagnosis in Sport. Milivoj was national swim team member, and national swim record holder in former Yugoslavia from 1978 to 1989. He was a national team swim coach from 1990 to 1994, and from 2010 until now. Also, he was national triathlon coach from 1996 to 2001 and national youth age groups coach in waterpolo from 2002 to 2009 (U17 and U19). From 2009 to 2012 he was president of Serbian Swim Experts Committee, and from 2013 he is Vice-President of Serbian Swimming Federation. For the past 20 years his research interests have combined technology in science of sports training, competitive swimming, applied swimming abilities, metrology in sports and physical fitness testing.
BMS2014—ABSTRACTS HANDBOOK 123

Ventilation dynamics during race-pace swimming in elite swimmers Marja Paivinen1, Kari L Keskinen2, Heikki O Tikkanen1 1Foundation for Sports and Exercise Medicine, University of Helsinki, 2Finnish Society of Sport Sciences
Introduction Respiratory symptoms are common among swimmers and they have been reported the most during very hard, race pace swimming. It has been suggested that extreme strain with high pulmonary load would have an effect on development of astmatic symptoms among athletes. The aim of the study was to examine pulmonary ventilation during very hard intensity, race pace swimming in elite competitive swimmers.
Methods Fourteen healthy elite swimmers, 7 females and 7 males, 18 years old, with training history of 9 years on the average were studied. Maximal ventilation (VEmax) was measured breath-by-breath during race-pace swimming. Maximal voluntary ventilation (MVV) was measured on land and in water in prone swimming body position. Measurements were performed by portable Cosmed K4b2 analyser. Snorkel build for swimming testing was attached to the breathing valve.
Results During the swim, VEmax was 106 (4) l/min in females and 136 (14) l/min in males. Breathing reserve (Br) was 27% in females and 25% in males when calculated MVV (cMVV) was 35*FEV1 on land. However when FEV1 of the cMVV was measured in water in prone swimming body position, Br decreased to 24% in females and 20% in males. When pooled data on MVV and cMVV measurements on land and water were examined, MVV in water correlated the most with VEmax. During the race pace swim VEmax reached 76% in females and 80% in males of the calculated maximal voluntary ventilation in water.
Discussion Results indicate that during the race pace intensity swimming, the extremely high load on the pulmonary function induce asthmatic respiratory symptoms in elite competitive swimmers. The observation that the VEmax was 76–80% of the cMVV, was higher than the target ventilation at 60% of cMVV which has been used to detect respiratory symptoms in physical exercise on land. Therefore, we suggest that the special effects of swimming and water environment on pulmonary function should be taken into account when diagnosing respiratory hazards in elite swimmers.
References 1 Päivinen MK, Keskinen KL, Tikkanen HO. Swimming and asthma: factors underlying respiratory symptoms in competitive
swimmers. Clin Respir J. 2010 Apr;4(2):97–103.
2 Päivinen MK, Keskinen KL, Tikkanen HO, Swimming and asthma: Differences between women and men. J Allergy 2013
3 Keskinen K.L., Rodriquez F.A., Keskinen O.P. Respiratory snorkel and valve system for breath-by-breath gas analysis in swimming Scand J Med Sci Sports 2003:13:322–329
4 ATS Guidelines for Methacholine and Exercise Challenge Testing—1999. Am J Respir Crit Care Med Vol 161. pp 309–329, 2000
Presenter Marja Paivinen serves as an Exercise Physiologist in the Foundation of Sports and Exercise Medicine which is a Unit of Sports and Exercise Medicine at the University of Helsinki. Mrs Paivinen is a former elite swimmer at world level.
CONCURRENT SESSION 10C—BIOMECHANICS 11
The accuracy of commercially produced accelerometer-based activity monitors as a means of estimating average swim bout speed Brian Wright1,2 1DePauw University, 2Counsilman Center for the Science of Swimming, Indiana University
Introduction A competitive coach’s ability to effectively administer and simultaneously monitor each individual swimmer’s training can be limited during group training. Recent studies have introduced the use of commercial accelerometer-
124 BMS2014—ABSTRACTS HANDBOOK

based activity monitors (ABAM) as an additional tool to quantifying competitive swim speed (Wright & Stager, 2013). The purpose of this study was to compare measured swim speed with two estimated swim speeds. Estimated speeds were based on a previously designed sample-based regression (SBR) model and newly implemented individual-based regression (IBR) models that utilised ABAM activity counts (Wright & Stager, 2013).
Methods IBR equations for swim speed were created for eleven competitive swimmers (Age: 19.1 ± 5.3 years) from a progressive series of four 50m front crawl swims. Swimmers completed a practice session wearing an Actical accelerometer on their right wrist and ankle. Activity counts from arm stroke and leg kick for ten swims observed within the practice session were used to calculate estimated swim speeds. Three values of mean swim speed (i.e. the actual measured swim speed via stopwatch, SBR swim speed, and IBR swim speed) were then compared using a One-way ANOVA.
Results All IBR models were significant (mean R2 = 0.96; p < 0.05 vs. R2 = 0.57; p <0.01 from previously designed SBR model; Wright and Stager, 2013). Results of the One-way ANOVA for swim speed were significant (F2,32 = 11.398; p < 0.001). Post-hoc comparisons revealed that estimates of swim speeds via the SBR model were significantly faster (p < 0.05) than measured swim speeds. IBR swim speeds did not significantly differ from measured swim speeds (p > 0.05).
Conclusions It appears individualised descriptive equations developed via arm stroke and leg kick activity counts improved estimates of average swim speed by accounting for individual variation. ABAM may represent a useful tool to assess and track multiple swimmers simultaneously in a group training environment.
References Wright & Stager (2013). Quantifying competitive swim training using accelerometer-based activity monitors, Sports Eng., 16 (3),
155–164.
Presenter Brian Wright is a former NCAA Division III Collegiate swim coach. He’s currently on the faculty at DePauw University and is affiliated with the Counsilman Center for the Science of Swimming/Indiana University.
A new method to evaluate breaststroke kicking technique using a pressure distribution analysis Takaaki Tsunokawa1, Motomu Nakashima2, Yasuo Sengoku1, Shozo Tsubakimoto1, Hideki Takagi1 1University of Tsukuba, 2Tokyo Institute of Technology
Introduction The purpose of this study was to develop a new method for evaluation of breaststroke kicking motion using a pressure distribution analysis around a foot.
Method To achieve the purpose, two study subjects were set. In the first study, we investigated the reliability of estimated fluid forces acting on a foot during breaststroke kicking. Reliability was verified using a robotic leg. The robotic leg was mounted in the water channel with a dynamometer. And robotic leg was affixed to a foot model. Eight pressure sensors were embedded in the foot model. The relationship between the fluid forces acting on the foot model estimated from pressure distribution and the translational forces measured by the dynamometer was quantified. And the force fluctuations during a kicking cycle were obtained. In the second study was to investigate the relationship between the estimated fluid forces and actual swimming performance. Eleven male swimmers participated in this study. Subjects performed breaststroke kicking motion at maximal effort. And then, fluid forces acting on a foot were estimated from pressure distribution around a foot. The relationship between the fluid forces and swimming velocity was quantified.
Results In the first study, significant correlations between estimated fluid forces from pressure distribution and measured forces by dynamometer were obtained (r = 0.62 to 0.92). And the force fluctuations of estimated forces were accurately synchronised with measured forces. In the second study, significant correlations between estimated fluid forces and swimming velocity were obtained (r = 0.73 to 0.76).
BMS2014—ABSTRACTS HANDBOOK 125

Conclusions The reliability of estimated fluid forces was verified and significant correlations with actual swimming performance were obtained. Therefore, the present methodology can be used to evaluate breaststroke-kicking motions qualitatively and quantitatively, thereby assisting swimmers and their coaches in evaluating and improving their training.
References Nakashima, M., Takahashi, A. Clarification of unsteady fluid forces acting on limbs in swimming using an underwater robot arm.
Journal of Fluid Science and Technology, 7, 100‒113, 2012.
Takagi, H., Wilson, B. Calculating hydrodynamic force by using pressure differences in swimming, Proceedings of the XIII International Symposium on Biomechanics and Medicine in Swimming, 101–106, 1999.
Presenter Takaaki Tsunokawa is part of the Doctoral Program in Physical Education, Health and Sport Sciences, University of Tsukuba, Japan. He is also the swimming team coach of University of Tsukuba.
An analysis of a swimmer’s passive wave resistance using experimental data and CFD simulations Marion James1, Joseph Banks1, Stephen Turnock1, Dominic Hudson1 1Fluid-Structure Interactions Research Group, University of Southampton
Introduction Passive resistance of a swimmer on the free surface has first been researched experimentally. Contribution of wave resistance to total drag for a swimmer with a velocity around 2.0 m.s-1 was found to vary from 5% for Vorontsov and Rumyantsev (2000), to 21% for Toussaint et al. (2002) and up to 60% according to Vennell et al. (2006). The exact resistance breakdown of a swimmer remains unknown due to difficulties in the measurement of wave resistance. As noted by Sato and Hino (2010), this lack of experimental data makes it difficult to validate numerical simulations.
Method In this paper, experimental data of a swimmer’s resistance are presented at three different velocities (1.4 m.s-1, 1.8 m.s-1 and 2.2 m.s-1). Total drag was measured using force blocks on a tow rig (Angus et al., 2011). Moreover, wave height measurements were taken from three wave probes on a longitudinal cut, from which wave resistance can be obtained (Eggers, 1955).
The three conditions tested are then simulated using the open-source computational fluid dynamics code OpenFOAM. The body geometry is a generic human form, morphed into the correct attitude and depth using the above- and under-water video footages recorded during the experiment. 3D Unsteady Reynolds-Averaged Navier-Stokes (URANS) simulations are performed using the volume of fluid method to solve the air-water interface. The various components of resistance over a swimmer’s typical range of speeds are investigated.
Results The numerical methodology is validated with the experimental data gathered and a detailed comparison between simulated and experimental free surface features is undertaken. A similar numerical technique was used by Banks (2013) to assess the passive resistance of a swimmer and total drag was found to agree with both experimental data and potential flow method.
Conclusions The use of a longitudinal wave cut as commonly used in the naval architecture field provides a more accurate way of measuring the wave resistance of a swimmer’s body through the water. These experimental data were used to validate numerical simulations of the passive resistance for a swimmer at the free surface.
References Banks, J. (2013) Modelling the propelled resistance of a freestyle swimmer using Computational Fluid Dynamics, PhD Thesis,
University of Southampton
Eggers, K. (1955), ‘Resistance components of two-body ships’, Jahrbuch der Schiff- bautechnischen Gesellschaft, 49
Toussaint, H.M., van Stralen, M. and Stevens, E. (2002) Wave drag in front crawl swimming. Proceedings of the XXth International Symposium on Biomechanics in Sports, Spain, 279–282
126 BMS2014—ABSTRACTS HANDBOOK

Vennell, R., Pease, D. and Wilson, B. (2006) Wave drag on human swimmers. Journal of Biomechanics, 39, 664–671
Vorontsov, A.R. and Rumyantsev, V.A. (2000) Resistive forces in swimming. In: Zatsiorsky, V. (Ed.), Biomechanics in Sports: Performance Enhancement and Injury Prevention. Vol. IX Encyclopaedia of Sports Medicine. Blackwell, IOC Medical Commission (Chapter 9)
Webb, A.P., Banks, J., Phillips, C.W.G., Hudson, D.A., Taunton, D.J., Turnock, S.R. (2011) Prediction of passive and active drag in swimming, Procedia Engineering, 13, 133–140
Presenter Dr Joseph Banks and Ms Marion James both graduated with a Master in Ship Science from the University of Southampton in 2009 and 2012 respectively. Joseph has successfully received his PhD prize in the summer 2013 and is now pursuing post-doctoral studies in the same department. Marion started her PhD in October 2012 and is carrying on Joseph’s research on the resistance of a swimmer both experimentally and numerically.
Relationships between hand kinematics and hip movement in front crawl Frederic Puel1, Ludovic Seifert1, Florence Chavallard2, Didier Chollet1, Philippe Hellard2 1University of Rouen, 2Federation Francaise de Natation
Introduction Swimming effectiveness is often assessed by intra-cyclic velocity variations (IVV). Recent 3D kinematics studies showed that those IVV could be higher in lateral axis rather than in longitudinal axis (Psycharakis et al., 2010) and linked to hand 3D kinematics (Figueiredo et al., 2012). In the same time, body roll is found to influence performance (Psycharakis & Sanders, 2010). However, the relationships between IVV in the 3D, hip oscillations (yaw, pitch and roll) and the hand 3D kinematics remain unclear and correspond to the aim of this study.
Methods One international female swimmer swam an all-out 25 m in front crawl. She was equipped with 6 body landmarks (left wrist, elbow and shoulder, head, both left and right hips). Both underwater and aerial 3D kinematics have been assessed by multi-camera system (50 Hz, calibration frame with 103 calibration points, 3.67 x 1.63 x 1.42 m, DLT method) while hip 3D oscillations and IVV have been assessed by inertial measurement unit (CIREN). Correlations between hip yaw, pitch and roll and hip IVV in X, Y and Z and hand movements in 3D have to be assessed.
Results 3D kinematics of the arm features 3 key phases of the underwater phase of the stroke cycle (see figure, that presents only translations along Y): A, where the left wrist is on the left of the vertical plane passing through the elbow, itself left of the vertical plane formed by a shoulder; B, where the wrist is between elbow and shoulder; C, where the wrist is on the right of both elbow and shoulder. The beginning of the A phase matches the transition between catch and pull.
Both longitudinal and vertical displacements (along X and Z, respectively) of the hand and the hips and 3D rotations (attitudes) of the hips have also been assessed. Corresponding graphs shows also interesting features.
BMS2014—ABSTRACTS HANDBOOK 127

Conclusions It was observed here that the lateral displacements (translations along the Y axis) of the hips (in green on figure) are limited and presumably hardly discernible on all signals from the 3D kinematic video analysis. The use of an inertial measurement unit (CIREN), that could measure linear accelerations and angular velocities (and assess attitudes: yaw, pitch and roll) should highlight cyclical phenomena and identify the probable correlations between kinematics of the hand and pelvis.
References Figueiredo P, Kjendlie PL, Vilas-Boas JP, Fernandes RJ. (2012). Intracycle velocity variation of the body centre of mass in front
crawl. Int J Sports Med. 33(4):285–90.
Psycharakis SG, Naemi R, Connaboy C, McCabe C, Sanders RH. (2010). Three-dimensional analysis of intracycle velocity fluctuations in front crawl swimming. Scand J Med Sci Sports. 20:128–135.
Psycharakis SG, Sanders RH. (2010). Body roll in swimming: a review. J Sports Sci. 28(3):229–36.
Presenter Frederic Puel received his PhD in 2011 from the University of Bordeaux, Federation Francaise de Natation. He currently works as an associate professor at University of Rouen.
CONCURRENT SESSION 11A—SOCIAL SCIENCES 4
A non-linear pedagogical approach for learning expert coordination patters in swimming John Komar1, François Potdevin2, Didier Chollet1, Ludovic Seifert1 1CETAPS, University of Rouen, 2ER3S, University of Lille 2
Introduction The study of inter-limb coordination in swimming has revealed strong differences between novice and expert swimmers (e.g. Seifert et al., 2010). From a coaching point of view, a non-linear pedagogy (Chow, et al. 2011) encourages learners to re-organise their initial behaviour by motor workspace exploration, rather than imitating an expert behaviour. The aim of this study was therefore to investigate the application of a non-linear pedagogy by using non-prescriptive instructions during learning arm-leg coordination in breaststroke.
Method Three groups of swimmers (G1, n=7; G2, n=6; G3,n=6) were selected into a pool of 120 beginners as they exhibited a superposition of propulsive and recovery actions through their arm-leg coordination in breaststroke and a lack of glide time. Afterwards, a specific program of learning was proposed to each of these groups (16 lessons with 5 trials per lesson) in order to reach the goal of the learning, to decrease the stroke frequency for a stable speed corresponding of 70% of their maximal individual speed. G1 was the control group that received only the goal of the
A B C
128 BMS2014—ABSTRACTS HANDBOOK

learning. Subjects of G2 followed a metronome (aquapacer) that decreased session after session the stroke frequency with no other instruction. G3 received a verbal prescription of the coordination (4 verbal instructions precisely defining the expert coordination. These three conditions were assumed to cover a range from the less prescriptive to the most prescriptive learning condition (from G1 to G3).
The arm-leg coordination patterns were represented by the relative phase between knees and elbow angles (Seifert et al., 2010). These joint angles were measured using motion sensors (MLog, Movea, Grenoble-France) during each trial of each learning session. In the meantime, the duration of each cycle (from one maximal knee flexion to the next maximal knee flexion) allowed the calculation of the performance during learning (i.e. the instantaneous stroke frequency, by dividing the acquisition frequency (200Hz) by the number of data per cycle).
Results Results of performance (i.e. decrease in stroke frequency despite an identical swimming speed) showed an improvement with learning, but no significant difference of stroke frequency between groups at the end of the learning process. However, the study of the coordination patterns revealed that both G1 and G2 groups visited between 8 and 11 different patterns of coordination before stabilising a final one (e.g. figure 1). G3 showed only between 5 and 6 visited patterns during learning. In addition, G2 showed the use of a more efficient pattern of coordination (i.e. longer glide phase and dissociation propulsions) rather than the other groups.
Figure 1 Exhibited coordination during learning
Conclusions Even if no differences in terms of final performance outcome were revealed, the use of a non-prescriptive instruction enhanced the motor exploration during learning (i.e. leaving the initial behaviour) comparing to the use of prescriptive information. This exploration is considered as an optimal way to learn effective and efficient coordination (Newell, 1990), as supported by final coordination exhibited by the pacer group.
References Chow, J-Y, Davids, K, Hristovsky, R., Araujo, D., Passos, P. (2011). Non-Linear pedagogy: learning design for self-organizing
neurobiological systems. New Ideas in Psychology, 29(2), 189–200.
Newell, K. M. (1990). Augmented information and the acquisition of skill. In R. Daugs & K. Bliscke (Eds.), Motor learning and training.
Seifert, L., Leblanc, L, Chollet, D., Delignières, D. (2010). Interlimb coordination in swimming: effect of skill level. Human Movement Science, 29(1), 103–13.
Presenter John Komar completed last June at the university of Rouen a PhD in motor learning, focusing on learning arm–leg coordination in breaststroke swimming using a non-linear pedagogical approach. He now holds a post-doctoral position at the University of Rouen aiming to model inter-limb coordination in swimming (freestyle and breaststroke) and the dynamics of learning these coordinations.
Predicting a nation’s Olympic qualifying swimmers Sian Allen1,2, Will Hopkins1,3, Tom Vandenbogaerde1,2, David Pyne4 1Auckland University of Technology, New Zealand, 2High Performance Sport New Zealand, New Zealand, 3Victoria University, 4Australian Institute of Sport
Introduction The talent identification and development process typically involves deploying resources towards squads of top swimmers selected on the basis of current performance. However, the success of this process has rarely been
BMS2014—ABSTRACTS HANDBOOK 129

evaluated objectively. Here we compare the predictive accuracy of three diagnostic methods for early selection of Australia’s 2012 Olympic qualifying swimmers.
Methods Official performance times from all Australian swimmers in individual Olympic events at 101 age-group and open competitions between 2000 and 2012 were provided by Swimming Australia. Three methods were used to retrospectively simulate early selection of swimmers for a talent-development squad. One method selected swimmers with current-year performances above a certain percentage of world record. The other two methods predicted each swimmer’s 2012 performance and selected swimmers with predicted times faster than a set threshold. These methods involved linear regression of current year swim time and age, and quadratic performance trajectories derived using mixed modelling of each swimmer’s annual best career performance times. For all methods, data up to 2007 were analysed initially. We then repeated each simulation using data up to 2008, 2009, 2010 and 2011. Selection thresholds for all methods and years were set to ensure 90% of Olympic qualifiers with performance data for a given year would be included in the squad.
Results Linear regression of swim time and age generally produced the highest proportions of correctly selected Olympic qualifying swimmers in the squads (10%, 16%, 32%, 42% and 61% for each year from 2007–2011). Corresponding squad sizes were 537, 360, 190, 142 and 100. Smaller squads can be achieved by setting higher selection thresholds, but at the expense of excluding deserving swimmers.
Conclusions Past talent identification and development processes have probably focused resources for Olympic preparation on smaller numbers of swimmers than our analysis has estimated. By targeting resources towards larger groups of swimmers, nations are likely to further improve the talent of those who achieve Olympic qualification times without early access to resources, while also producing more swimmers capable of meeting Olympic qualification times.
Presenter Sian Allen is a PhD student from the Sports Performance Research Institute New Zealand, based at Auckland University of Technology in New Zealand. She also works as a Physiologist/Performance Analyst for Swimming New Zealand and High Performance Sport New Zealand.
Swimming and water safety programs for children between 5 and 14 years old in Australia: a survey of swim school managers’, swimming teachers’ and parents’ perceptions Melissa Savage1, Susan Sturt1, Amy Peden2, Penny Larsen2, Ana Catarina Queiroga2, Justin Scarr2, Richard Franklin2 1Australasian Council for Swimming and Water Safety Teachers, 2Royal Life Saving Society—Australia
AUSTSWIM and Royal Life Saving Society—Australia have conducted research to enhance the understanding of children’s swimming and water safety skill acquisition and achievement levels from varying perspectives, namely swim school managers, swimming teachers and parents. As aquatic skills gained in the formative years are essential for safe aquatic participation and underpin drowning prevention strategies, further understanding provides guidance for the development of aquatic programs, delivery and implementation strategies and training programs for teachers.
The first National survey explored the operations of swim schools across Australia as assessed by over 350 swim school managers, owners and coordinators. The final report of this survey, found that although aquatic programs administered at public and private pools and aquatic facilities were accessible by the general public, there were several barriers to participation Responses justified the implementation of a second survey exploring attitudes of teachers of swimming and water safety in Australia.
A national survey was sent to all teachers of swimming and water safety within AUSTSWIM’s database and other industry contacts as well as using online promotion. The results of over 6,300 teachers were analysed and besides characterising several vocational issues, the research found that, in general, teachers of swimming and water safety agree that the skills children should acquire were adequate and reflect the content of the benchmark as defined in the National Water Safety Education Competency Framework.
Even though there has been substantial growth in the aquatic industry providing greater access to swimming and water safety lessons, there are many children who are not achieving the benchmark competencies equivalent to Royal Life Saving Swim and Survive Level 4 prior to leaving primary school as stated in the Australian Water Safety
130 BMS2014—ABSTRACTS HANDBOOK
Strategy 2012–2015. In fact, it has been observed that some children are not participating on a regular basis or missing out on learning to swim entirely. Little is known about why this is the case, or how parents perceive swimming and water safety programs and their understanding of the importance of acquiring aquatic skills. Children’s drowning risk. Results of stage 1 and 2 of this project, especially of the second, further confirmed the relevance of studying and comparing the perceptions of parents whose children are enrolled in swim lessons in Australia with other parents whose children are not.
In light of the previous findings, additional research was conducted to expand on the findings of the first two surveys through the distribution of a third survey targeting parents of children aged between 5 and 14 years across Australia. This survey aimed not only to understand more about the effectiveness of swimming programs, but also to characterise the group of children accessing swimming and water safety programs and whether there is sufficient opportunity to overcome the barriers identified in the previous surveys.
Detailed information on the findings of the 3 stages of the project and a discussion of the linkages between the three surveys will be presented.
Presenter Melissa Savage has been involved in the aquatic industry in a variety of roles for the past 18 years. She is currently the Program and Services Coordinator for AUSTSWIM. Mel has a Bachelor of Applied Science Leisure and health with Honours and has just completed her Masters in Public Health—Health Promotion. Her presenting experience on a national and international level is extensive including presenting at the World Conference on Drowning Prevention in Vietnam in 2011 and Germany in 2013.
CONCURRENT SESSION 11B—MEDICINE AND PHYSIOTHERAPY
Effect of immersion on angle positioning at elbow joint with and without pre-instruction in trained swimmers Koichi Kaneda1, Tatsuya Hayami2, Yuji Ohgi3, Daijiro Inoue4, Shozo Tsubakimoto4 1Chiba Institute of Technology, 2Shinshu University, 3Keio University, 4Tsukuba University
Introduction The water creates a different sense to human body position. For example, Bock [1] reported that the right forearm immersed in the water deviated upwards than the left which was on the air in a position matching task between both arms. However, there was no investigation conducted in the same arm compared with on the air and in the water environment. The purpose of this study was to investigate the effect of immersion on angle positioning task at elbow joint in competitive swimmers.
Method Fourteen well-trained university male swimmers (Age: 20.7±1.4yr, 10’FINA point: 721.6±94.7) were participated in this study. They conducted two types of elbow joint angle positioning task in the right arm on the air and in the water environment with earpiece and eye mask. In the first session, the subjects conducted 30˚, 60˚ and 90˚ positioning task without pre-instruction. A pre-instructed and re-positioning task on each angle set was conducted in the second session. The air temperature was 26.2±1.1˚C, and 33.8±1.3˚C in the water. Each elbow joint angle was calculated by video taped picture with 2D-DLT method. An absolute angle value was calculated in the first session, and an error of pre-instructed and re-positioning angle in each environment was calculated in the second session. A two-way ANOVA was applied to detect any differences between on the air and in the water environments. A significance level was set at P<0.05.
Results In the first session, there was no significant interaction but the elbow angle in the water environment was significantly underestimated than on the air environment (P <0.05). Each mean difference were 7.4˚, 9.9˚, and 10.0˚ in 30˚, 60˚ and 90˚ positioning tasks, respectively. In the second session, there was no significant difference between environments with the error of pre-instructed and re-positioning angle.
BMS2014—ABSTRACTS HANDBOOK 131

Conclusions There was underestimation in elbow joint angle positioning about 10˚ in the water environment without pre-instruction before the positioning trial. However, the pre-instruction compensated the angle positioning error in the re-positioning trial.
References 1 Bock O. Joint Position Sense in Simulated Changed-Gravity Environments. Aviat Space Environ Med, 1994; 65:621–6.
Presenter Koichi Kaneda is an Associate Professor at Chiba Institute of Technology. He received a PhD in Tsukuba University. His main focus is muscle activity during exercising in water environment for health and rehabilitation.
Pelvic tilt in the swim block start Brett Doring3, Damien O’Meara1, Andrew Hirschhorn2, Jonathon Pearce3 1NSWIS Biomechanics, 2The Clinical Research Institute, 3Norwest Orthopaedic and Sports Physiotherapy
Introduction Swim block start performance influences overall swimming performance(1). Certain biomechanical aspects of the optimum swim block start have been described, including optimum knee and hip flexion angles(2). There are, however, no published investigations examining the effect of pelvic position on swim block start performance. As such there is no current consensus among coaches regarding the optimum pelvic position(3). It may be hypothesised that pelvic position, specifically the degree of posterior pelvic tilt, may affect swim block start performance due to the potential influence on front leg power output, particularly hip extension torque. In the current pilot study, we report a method of measuring pelvic tilt in the swim block start, and the relationship between pelvic tilt and key swim block start performance indicators.
Methods A sample of 8 male elite swimmers participated in the pilot study. Light reflective markers were placed on the lateral aspects of swimmers’ anterior and posterior superior iliac spines (ASIS, PSIS), the greater trochanter, and knee and ankle joints. Swimmers were then asked to voluntarily replicate their usual ‘take your mark’ dive position and were photographed in situ. Each swimmer replicated the dive position three times, with approximately 30 seconds rest between trials. Kinovea software was used to derive two positional variables, i.e. mean knee flexion angle and posterior pelvic tilt, calculated as the angle between the line drawn from ASIS to PSIS and a vertical reference line. Markers were removed, and swimmers completed three maximal effort dive performances. GreenEye software was used to derive four performance variables, i.e. mean block time, horizontal velocity, entry distance and 5-metre time. Spearman’s rank correlation coefficient was used to examine correlations between positional and performance variables.
Results Mean posterior pelvic tilt was 31° (range: 22° to 42°). Mean knee flexion angle was 147° (range: 138° to 158°). There was no significant correlation between posterior pelvic tilt and knee flexion angle (p = 0.493). There was a significant correlation between posterior pelvic tilt and 5-metre time (r2 = 0.656, p = 0.015), i.e. the greater the posterior pelvic tilt the worse the 5-metre time. There were significant negative correlations between knee flexion angle and both of horizontal velocity (r2 = 0.861, p = 0.008) and entry distance (r2 = 0.545, p = 0.037), i.e. the greater the knee flexion angle the worse the horizontal velocity and entry distance.
Conclusion We have reported a novel method of quantifying posterior pelvic tilt in the swim block start. Preliminary data suggests a significant relationship between posterior pelvic tilt and 5-metre time. Further research is warranted (being conducted) to investigate the mechanisms by which posterior pelvic tilt might affect swim start performance, e.g. relationships between pelvic tilt position and hamstrings length and power. Such research will contribute to the development of a complete biomechanical model for the optimum swim block start performance.
References 1 Kaufmann, K. & Street, G. (2011). Influence of block angle on take-off velocity in swim starts. Medicine and Science in Sports
and Exercise, 43(5). Supplement abstract 2319.
132 BMS2014—ABSTRACTS HANDBOOK

2 Honda, K. E., Sinclair, P. J., Mason, B. R. & Pease, D. L. (2010). A biomechanical comparison of elite swimmers’ start performance using the traditional track start and the new kick-start. A paper presented at the XIth International Symposium for Biomechanics and Medicine in Swimming, Oslo, June 16–19, 2010.
3 Wright, B. V., Comett, A. C., White, J. C., Parry, T. E. & Stager, J. M. (2011). Professional swim coach opinions regarding the competitive swim start: A national survey. Medicine and Science in Sports and Exercise, 43(5). Supplement abstract 3243.
Presenter Brett Doring has completed an undergraduate degree in Sports Science at the University of Sydney as well as a master of Physiotherapy. He is currently practicing Physiotherapy full-time at Norwest Orthopaedic and Sports Physiotherapy, with a special interest in Physiotherapy for competitive swimmers. Brett currently holds appointments as the NSW institute of sport swim team Physiotherapist as well as Physiotherapist for the Australian Swim Team and will present on his stream of research investigating the role of pelvic tilt in swim block start performance.
Changes in the conditioning components for the Japanese Universiade swimming teams Hirofumi Jigami1,2, Tomoo Kato2,3, Keisuke Koizumi2,4, Koji Kaneoka2,5 1Tokyo University of Technology, 2Medical Committee, Japan Swimming Federation, 3Toin University of Yokohama, 4Japan Sports Council, 5Waseda University
Introduction Studies on competitive swimmers have reported that lower back injuries are the second most common type of injuries among swimmers following shoulder injuries. Conditioning techniques for swimmers and their coaches are modified according to their needs and the type of injury. It is important to longitudinally analyse conditioning components and the number of conditioning techniques while developing injury prevention programs for swimmers. As most studies among swimmers were cross-sectional surveys, data verifying the effects of injury prevention programs and the conditioning components for swimmers are insufficient. The purpose of this study was to verify the longitudinal changes in the type and number of conditioning components for high-level Japanese swimmers.
Methods The subjects included members of the Japanese national swimming teams that had participated in the Universiade competitions held at Belgrade, Serbia in 2009 and at Kazan, Russia in 2013. Data on conditioning components and the number of body parts that were treated by the trainers were aggregated.
Results The number of trainers for the games held in 2009 and 2013 were 3. The competition was held for 7 days, and the adjustment period was 10 and 12 days in 2009 and 2013, respectively. There were 37 and 38 swimmers in 2009 and 2013, respectively. Further, 243 and 486 conditioning components were used in 2009 and 2013, respectively. Table 1 shows the ratio of body parts that were treated, whereas Table 2 shows the ratio of the conditioning components in these 2 games.
Conclusions The findings of this study revealed that the demand for massage decreased and that for physical evaluation and exercises increased over the 4 years. Further, self-conditioning was found to be very important for swimmers. Our results, which suggest that the Japanese injury prevention program is effective, will be useful while developing programs for increasing the independence and strength of swimmers.
Table 1 Ratio of the body parts treated in 2009 and 2013 Table 2 Ratio of the conditioning components in 2009 and 2013
2009 2013 2009 2013
Whole body (%) 71.1 30.3 Massage (%) 88.7 49.1
Head–back (%) 1.5 11.8 Stretch (%) 2.7 26.5
Shoulder (%) 11.1 26.7 Physical modality (%) 2.1 0.9
Upper extremities (%) 1.7 1.4 Acupuncture (%) 1.1 3.6
Lumbar–pelvic (%) 8.7 19.6 Physical evaluation and exercise (%) 5.4 20.0
Lower extremities (%) 5.8 10.2
BMS2014—ABSTRACTS HANDBOOK 133

Presenter Hirofumi Jigami is a member of Medical Committee, Japan Swimming Federation. He has joined some international competition of swimming as a trainer and physiotherapist.
CONCURRENT SESSION 11C—BIOMECHANICS 12
Real-time sonification in swimming—from pressure changes of displaced water to sound Bodo E Ungerechts1, Daniel Cesarini2, Thomas Hermann3 1University of Bielefeld, Neurocognition-Biomechanics, Germany, 2University of Pisa, Department of Information Engineering, Italy, 3University of Bielefeld, Ambient Intelligence Group, CITEC, Germany
Introduction Effects of aquatic space activities are depending on the interaction of limbs and water mass set in motion. Commonly limbs’ actions are studied intensively but its impact on water motion is less well studied. One reason might that the simple concept of speed dependent drag is thought to be sufficient. However, since water gives way to firm bodies a push-off from water is not possible and a push off from a force like drag neither. The self-induced locomotion is originated on the intermediate effect due to interaction limbs and displaced water mass which can be sensed as well as measured due to changes of static pressure (pstat). Although measured in Pascal, pstat, as a fluidal issue differs from the term ‘pressure’ known from solid state physics. In fishes flow sensing is vital whether they perceive pstat or hear it (pressure wave are similar to sound waves). In human swimming a communication about sensing the flow is not really possible due to e.g. improper terminology. Sonification of the invisible intermediate effects allows for another sensing channel of change in pstat which is not yet used in swimming evaluation [Hermann et al., 2012). The purpose is to present the state of art to provide functional sound of the displaced water mass in real-time while swimming or executing various aquatic space activities.
Method The unsteady flow effects are quantified via Piezo-probes (Ungerechts, 1985), a plastic tube whose flared end lay snugly between the fingers (2 per hand one facing to the back and one to the palmar side) which were connected to sensors (MPX5010DP Freescale Semiconductor, sampling rate 1000 Hz). The data were transferred to a laptop running SuperCollider program and the pressure-differences (palmar-backside of each hand) were transformed into functional sounds presented via loudspeaker. Action and sound were videotaped simultaneously. Three event-based parameter-mapping sonification schemes are selected a) discrete–pitch–mapping, b) amplitude–mapping at constant pitch and c) more aesthetic–mapping. The study focused on the quality of real-time sonification while swimming breaststroke with a remarkable gliding phase.
Results and discussion As a result of the test when the swimmer swam breaststroke on command the quality of the real-time aspect was checked quantitatively. Per 25 m eight 8 stroke cycles were executed. The duration from the first action of hand and sound heard via loudspeaker was 0,123 ± 0,027 s. The delay of 123 ms is not far from reaction threshold of sportive actions. Using the Piezo-probe based tool for Sonification in various aquatic actions can be advised as a major step to enhance perceptions of effects of unsteady flow via sound (instead of prescribing a movement) to enhance communication between swimmers and coaches about flow sensation. A vision is to combine real-time sonification of pressure changes pstat and the audition of an effect variable like mean speed-variation or kinematic aspects of body motion while swimming in a pool.
References Hermann T., Ungerechts B., Toussaint H., Grote, M. (2012) Sonification of Pressure Changes in Swimming for Analysis and
Optimization. In: ICAD, Atlanta, GA, 60–67
Ungerechts B. E. (1985) A description of the reactions of the flow acceleration by an oscillating flexible shark model. In: Biomechanics IX, HKP, Champaign, IL, 492–498
Presenter Dr Bodo E Ungerechts is member of the ‘Steering Group of the Conference Series -Biomechanics and Medicine in Swimming. He studied biology, sport science and mathematics. During the period he was completing his PhD Bodo was still an active swimmer and became a consultant of coaches to discuss aspects of propulsion in sport swimming, e.g. one of the swimmer he worked with established world record on 100 m breaststroke in 1977. Later he organised the education of top coaches for the German Swimming Federation and he is still acting as a lecturer. He
134 BMS2014—ABSTRACTS HANDBOOK
conducted the first experimental tests for enterprises studying the influence of fabrics and swim wear on the swimmers’ speed. Presently Bodo working as Affiliated Professor at Bielefeld University/Germany, Dept. Neurocognition and Action Biomechanics.
A novel dynamometric central for 3D forces and moments assessment in swimming starting João Paulo Vilas-Boas1,2, Karla de Jesus1, Luis Mourco1,3, Helio Roesler1,4, Kelly de Jesus1, Ricardo Fernandes1,2, Mario Vaz2,5 1CIFI2D, Faculty of Sport, University of Porto, Portugal, 2LABIOMEP, University of Porto, Portugal, 3ESEIG, Porto Politechnique Institute, Portugal, 4UDESC, Santa Catarina, Brazil, 5INEGI, Faculty of Engineering, University of Porto, Portugal
Introduction Since Cavanagh et al. (1975), the direct swimmers’ kinetics measurement in starting is one of the interesting areas for biomechanics applied service and research. As classifications in competitive swimming events have continuously been decided by less than a second, sports engineers and biomechanists have designed optimised instrumented starting blocks for other analysis purposes beyond the individual ventral starts (de Jesus et al., in press; Mason, 2012). Despite the noticeable technological advances provided by these devices, there are still limitations which should be considered for full performance assistance. This study aimed to describe the development of a new 3D dynamometric central to assess mainly independent right and left upper and lower limbs external forces and moments at individual and relay starting and turning techniques.
Method A dynamometric central with seven 3D-6DOF waterproof force plates was projected using SolidWorks 3D CAD Premium (Dassault Systèmes SolidWorks Corporation, USA). Five force plates, being four geminated, were designed to measure external right and left upper and lower limbs kinetics at individual and relay starts. Two independent pairs of ventral and dorsal starts handgrips were designed to be fixed each one on a force plate. A starting block was projected to fix the five force plates. The two other geminated force plates were projected to allow the right and left lower limbs kinetics assessment at backstroke start and turning techniques and to be fixed on a special built support at different vertical positions. These two force plates can be customised for contact/exit analysis at relay starts and drag analysis through inverse dynamics. Furthermore, all the seven force plates were projected to be used independently from the dynamometric central. Twenty-four waterproof strain gauges (Kyowa, Electronic Instruments, KFW-5-120-C1-5M2B, Japan) were used in each force plate to register deformations under load. The dynamometric central was projected to comply with the FINA facilities and starting rules. The linear static and model simulations were conducted using Ansys 12.1 (Ansys Workbench 12.1, Swanson Analysis Inc., USA) for deformation and vibrations analysis.
Results The statistic simulations with 8000 N revealed mean strains of ~350 µɛ and ~500 µɛ on the vertical and anterior-posterior direction, respectively for the geminated force-plates, and 300 µɛ and 250 µɛ on the vertical and anterior-posterior direction, respectively for the only non geminated force plate. The modal analysis displayed natural frequencies of 300 Hz for the four geminated force plates, 200 Hz for the two geminated underwater force plates and 180 Hz for the only non geminated force plate. The static simulations for the handgrips with 2000 N indicated mean strain of ~200 µɛ both on the vertical and anterior-posterior direction. Static simulations on the starting block revealed maximal strain of 0.30 mm when 2500 N were applied vertically.
Conclusions Based on these preliminary results, the current dynamometric central might be considered the most modern and versatile tool for starts and turns detailed analysis.
Acknowledgments CAPES (BEX 0761/12-5/2012-2014) and Santander Totta Bank (PP-IJUP2011-123).
References Cavanagh et al. (1975). Swimming II (pp. 43–45); de Jesus, et al. (in press). J. Sports Sci.
Mason, B. et al. (2012). XXX ISBS (pp.249–252).
Presenter Professor João Paulo Vilas-Boas is a Full Professor at the Faculty of Sport, University of Porto, a member of the Steering Group Biomechanics and Medicine in Swimming of the World Commission of Science in Sport, and a
BMS2014—ABSTRACTS HANDBOOK 135

member of the board of the Portuguese Olympic Committee, a former Olympic Swimming Coach and he is the director of the Porto Biomechanics Laboratory, University of Porto, Porto, Portugal.
A new approach for identifying phases of the breaststroke wave kick using 3D automatic motion tracking Bjørn Harald Olstad1, Christoph Zinner2, David Haakonsen1, Jan Cabri1, Per-Ludvik Kjendlie1 1Norwegian School of Sport Sciences, Dep of Physical Performance, Norway, 2German Sport U Cologne, I of Training Science and Sport Informatics, Germany
Introduction Today most competitive breaststrokers swim with a wave style technique using different amplitudes. Seifert et al. (2005) proposed a new index for arm- and leg coordination during flat BR. Today there is no specific index for the wave breaststroke (BR). The purpose of this study was to present a new way of measuring the phases during the BR wave kick allowing for a more careful study of technical aspects in each phase using 3D automatic motion tracking.
Method Three swimmers (two male World champions’ and one female Olympic medallist) performed one trial of 20m normal BR at 100% of maximal effort. Spherical markers at the right trochanter, knee and ankle were recorded with ten underwater motion-capture cameras (Oqus Underwater, Qualisys, Sweden). The second last stroke cycle was analysed. The leg kick was divided into 4 phases: 1) propulsion, from the smallest knee angle during recovery until the first peak in knee angle during propulsion, 2) insweep/wave motion/glide, from end of phase 1 until second peak in knee angle, 3) first part of the recovery, from end of phase 2 until 90 degree knee angle and 4) second part of recovery, from end of phase 3 until legs are back in position 1.
Results The four phases of the BR kick during 100% maximal effort are shown in Table 1.
Table 1 Times (sec), knee angels (°) and slips (mm) are shown for the five phases of the breaststroke kick coordination
#1 #2 #3
P.1 P.2 P.3 P.4 P.1 P.2 P.3 P.4 P.1 P.2 P.3 P.4
Time in phase (sec) .24 .50 .43 .13 .28 .74 .36 .19 .22 .79 .44 .10
Knee angle (°) during phase
48–165
165–178.5
178.5–90
90– 46
43–163
163–172.5
172.5–90
90– 44
64–172.5
172.5–168
168–90
90– 65
#1,2,3 refers to the subjects. P.1,2,3,4,5 refers to the five different phases of the breaststroke kick
Conclusions Previous analysis models assume that all BR kicks finish with feet actively coming together during insweep followed by ‘flat glide’ and active knee bend to start the recovery. Using the previous models for the swimmers tested the phases could not be accurately separated due to the different wave amplitudes in their technique influencing their insweep and knee bend during recovery. Therefore, phase 2 and 3 in the new model proposes to use distinct positions of the markers and peak angels to give a better understanding of the phases in the modern BR technique as well as accounting for different styles of technique.
References Seifert, L. & Chollet, D. (2005). A new index of flat breaststroke propulsion: A comparison of elite men and women. J of Sport
Sciences, 23(3), 309–320.
Presenter Bjørn Harald Olstad is an assistant professor at the Norwegian School of Sport Sciences in Oslo. He is currently working towards his PhD: Muscle activation and kinematics in contemporary breaststroke swimming, containing surface electromyographic measurements and three dimensional motion in swimming. He holds a master’s degree on how to coach age-group swimmers for future success and was a former National team member in swimming and lifesaving. He previously worked for the United States Olympic Committee, United States Swimming and with several swim clubs as performance director and coach.
136 BMS2014—ABSTRACTS HANDBOOK

Poster abstracts
BIOMECHANICS
POSTER 1 Fractal analysis of human aquatic locomotion: an exploratory and descriptive study Tiago Barbosa1,2, Jorge Morais1, Mario Costa2,3, Ludovic Seifert4, David Pendergast5 1Nanyang Technological University, Singapore, 2Research Centre in Sports, Health and Human Development, Portugal, 3Polytechnic Institute of Guarda, Portugal, 4University of Rouen, France, 5University at Buffalo, US
Introduction Fractal analysis has recently been applied to study a wide range of objects/systems in Biology and Medicine to assess non-linear phenomena. Since human swimming is a non-linear behaviour, the aim of this research was to carry out an exploratory and descriptive study to investigate whether human swimming performance can be evaluated using fractal properties.
Methods Eighty-two male swimmers with varying competitive levels (from the local level up to World-ranked athletes) undertook a set of 3x25-m maximal trials using the Front Crawl stroke, with push-off starts. A speedo-meter cable (Swim speedo-meter, Swimsportec, Hildesheim, Germany) was attached to the subjects’ hip (f=50 Hz). Data were exported to a signal processing software (AcqKnowledge v.3.5, Biopac Systems, Santa Barbara, USA) and filtered with a 5 Hz cut-off low-pass 4th order Butterworth. The stroke cycles were normalised to time, since fractal analysis is sensitive to the duration of the observation. Fractal dimension (D) was calculated with the box-counting method from the speed-time graphs. D is an index to characterise fractal patterns or sets and quantify their complexity as a ratio of the change in detail to the change in scale. Descriptive statistics (mean, one standard deviation, median, quartiles) were considered for further analysis.
Results The fractal dimension (Table 1) was lower than that reported for human gait on land. This might be related to the lower range of speeds reached in human swimming in comparison to walking, running or sprinting. Some of the swimmers reached D values close to what is reported for human gait. One might consider that those are the less expert swimmers. Highly-expert swimmers (e.g. World-ranked athletes) avoid significant changes in their speed, having a more ‘smooth’ and uniform motion, as it increases their efficiency, and thus decreases their energy cost.
Table 1 Descriptive statistics of the fractal dimension (D) in human swimming
Avg 1SD Me Min Q1 Q2 Q3 Max
D [dimensionless] 1.079 0.053 1.068 1.010 1.040 1.068 1.109 1.250
Conclusions It can be concluded that human swimming has fractal properties and swimmers’ and their techniques can be evaluated analysed by fractal techniques
Presenter Dr Tiago Barbosa received a PhD in Sport Sciences—Biomechanics and Physiology from the University of Porto, Portugal. Tiago is with a special leave from the Polytechnic Institute of Braganca (Portugal) where he holds an associate professor position, being at this moment a faculty staff at the Nanyang Technological University (Singapore). Besides that, he holds a part-time position as scientific consultant and sports analyst for the Portuguese Swimming Federation.
BMS2014—ABSTRACTS HANDBOOK 137

POSTER 2 Genetic predisposition and the breaststroke biomechanics in swimmers of a youth national team Tiago Barbosa1,2, Mario Costa1,2, Nuno Garrido1,2, Jorge Morais1,2, Hugo Louro1,2, Ana Conceicao1,2, Aldo Costa1,2, Rui Ramos1,2, Telmo Matos1,2, Daniel Marinho1,2, Mario Marques1,2, Ana Pereira1,2, Nuno Batalho1,2, Pedro Morouco1,2, Antonio Silva1,2 1Portuguese Swimming Federation, Portugal, 2Research Centre in Sports, Health and Human Development, Portugal
Introduction Genetics is becoming a popular research outcome for talent ID and as co-variable in intervention or longitudinal researches. The aim of this research was to assess the association between genetic predisposition and several biomechanical variables at breaststroke in swimmers of a youth national team.
Methods Eleven young swimmers from a youth national swim team (eight males and three females) took part in this study. Blood spots were collected for DNA extraction to determine ACE-I/D (II, ID, DD) and ACTN3-R577X (RR, RX, XX) polymorphisms by PCR-RFLP methods (Costa et al, 2012); and assess the strength power predisposition (0 alleles=no-predisposition; 4 alleles=maximal predisposition). As a dry-land strength power measure, three countermovement jumps and squat jumps on a contact mat (Ergojump Digitime 1000, Digest, Finland) were collected, respectively (Garrido et al., 2010). The time and height of the jumps, mechanical work and elastic index were selected as variables. Swimmers undertook a set of 3x25-m maximal trial at Breaststroke. A speedo-meter cable (Swim speedo-meter, Swimsportec, Hildesheim, Germany) was attached to the subjects’ hip to measure the stroke’s average and the maximal speeds (Barbosa et al., 2013). It was calculated the spearmen’s correlation matrix between all selected variables.
Results Overall, genetic predisposition was associated with the countermovement and squat jumps mechanical work (Rs=0.73, P=0.01 for both) but not with the maximal and mean speeds. Dry-land jumps were associated with maximal speed (Rs=0.59, P=0.03) and this one to the average speed (Rs=0.92, P<0.001). Hence, a path-flow might be suggested between genetic predisposition, dry-land strength power, maximal speed (related to the breaststroke kick, i.e., aquatic strength power) and average speed.
Conclusions It can be concluded that in elite youth swimmers the genetic predisposition may play a strong and meaningful role on swimming biomechanics.
References 1 Costa AM, Breitenfeld L, Silva AJ, Pereira A, Izquierdo M, Marques MC (2012). Sports Med 42: 449–458
2 Garrido N, Marinho DA, Reis VM, van den Tilaar R, Costa AM, Silva AJ, Marques MC (2010). J Sports Sci Med 9: 300–310
3 Barbosa TM, Morouço P, Jesus S, Feitosa W, Costa MJ, Marinho DA, Silva AJ, Garrido ND (2013). Int J Sports Med 34: 123–130
Presenter Dr Tiago Barbosa received a PhD in Sport Sciences—Biomechanics and Physiology from the University of Porto, Portugal. Tiago is with a special leave from the Polytechnic Institute of Braganca (Portugal) where he holds an associate professor position, being at this moment a faculty staff at the Nanyang Technological University (Singapore). Besides that, he holds a part-time position as scientific consultant and sports analyst for the Portuguese Swimming Federation.
138 BMS2014—ABSTRACTS HANDBOOK
POSTER 3 Evaluation of motion on underwater monofin swimming for novice Tetsuro Tanigawa1, Masahiro Terada2, Hiroe Kataoka3, Tomoyoshi Matsumoto4, Masashi Kamiya1, Azusa Taguchi1, Noriyuki Kida1, Teruo Nomura1 1Kyobo Institute of Technology, 2Kobe City College of Technology, 3Meiji University of Intergrative Medicine, 4Osaka Kyoiku University
Introduction The difference in motion on surface monofin swimming was clarified professional and novice (Gautier et al., 2004). However, the participants was too fewness to generalise the motion of novice. Therefore a coaching for novice has not been established. The purpose of this study was intended the 110 high school swimmer non-experienced monofin swimming to organise the relationship between swimming velocity and 25m underwater monofin swimming.
Method The participants were taken using (SONY, HXR-MC1) the underwater video camera. The right great trochanter, the right external malleolus and the tip of fin was calculated using the 2D-DLT. The vertical component time (t) series data was applied by a sine wave approximate formula (z = a1*sin(b1*t+c1)+d1*t+e1). Here, a1 indicates a half of vertical amplitude (m), b1 times 2π was Kicking Rate (KR, Hz), c1 means the phase shifting between the external malleolus and tip of the fin (PS, deg), d1 shows the vertical velocity (m/s), and e1 intends the depth of fin (m). The horizontal component time series data was applied by a linear approximate equation (y = a2*t+b2). At this time, a2 shows Kicking Velocity (KV, m/s). Kicking Length KL, m/kick) is calculated that KV divided by KR.
Results and discussion KV (1.83(0.42) m/s) showed a significant positive correlation among KR (1.74(0.43) Hz, r = .533, p = .000), the vertical amplitude (0.27(0.09) m, r = .478, p = .000), KL (1.08(0.24) m/kick, r = .476, p = .000), negative correlation among the depth of fin (-0.66(0.23) m, r = -.278, p = .004), PS (154.6(42.7) deg, r = -.233, p = .016). These points were considered in order to beginners increase KV, faster KR, deeper, longer KL and smaller PS.
Conclusions The motion on underwater monofin swimming for novice was estimated that KR had the highest positive correlation with KV and applied by a sine wave approximate formula.
References Gautier, J., Baly, L., Zanone, P.G. & Watier, B. (2004). A kinematic study of finswimming at surface. Journal of Sports Science and
Medicine, 3, 91–95.
Presenter Tetsuro Tanigawa is a student in the doctor’s program at Kyobo Institute of Technology. Tetsuro is a Japanese finswimmer and the former Asia-record holder of 200m bi-fin. Tetsuro wants to introduce the joy of fin swimming to a lot of people.
POSTER 5 Comparison of intra-abdominal pressure between trained and recreational swimmers during maximal front crawl swimming Shinichiro Moriyama1, Shoichi Kanazawa1, Keiko Yamagata1, Yukio Kitagawa1, Futoshi Ogita2 1Japan Women’s College of Physical Education, 2National Institute of Sports and Fitness in Kanoya
Introduction As an index of trunk stability, intra-abdominal pressure (IAP) increases with swimming velocity (Moriyama et al., 2013). This implies that increasing swimming velocity will promote activation of the trunk muscles related to trunk stability. Stabilising the trunk during exercise in water, which lacks a stable surface, may contribute to the increased production of propulsive power and/or a reduction in drag, compared with exercise on hard ground. Therefore, we speculated that IAP is related to swimming performance.
This study aimed to determine whether IAP during maximal front crawl swimming contributes to performance in both trained, competitive collegiate swimmers and college students with no competitive experience.
BMS2014—ABSTRACTS HANDBOOK 139
Method Ten female collegiate competitive swimmers comprised the athlete (AT) group (mean age, 19.4 ± 0.7 y; mean height, 161.9 ± 5.0 cm; mean weight, 53.8 ± 4.3 kg), and 10 female college students comprised the control (CO) group (mean age, 20.0 ± 0.9 y; mean height, 161.0 ± 3.4 cm; mean weight, 54.6 ± 4.8 kg). Physical characteristics did not significantly differ between the groups. Maximum voluntary IAP was determined using the Valsalva maneuver (IAP-val). The IAP during maximal swimming for 20 m (IAP-swim) was measured and normalised as IAP-val (%maxIAP). Stroke rate (SR) and length (SL) served as stroke indices.
Results Swimming velocity was significantly higher in the AT than in the CO group (1.51 ± 0.04 vs. 0.78 ± 0.12 m/s-1; P<0.01). The SR was significantly higher in the AT than in the CO group (0.8 ± 0.1 vs. 0.4 ± 0.1 Hz; P<0.01), whereas no significant difference was observed in SL (1.8 ± 0.1 vs. 2.0 ± 0.5 m, respectively). The IAP-val was significantly higher in the AT than in the CO group (12.0 ± 2.0 vs. 9.6 ± 2.0 kPa; P<0.05), whereas no significant difference was observed in IAP-swim (3.1 ± 0.7 vs. 2.6 ± 0.9 kPa) and %maxIAP (25.9% ± 5.7 % vs. 29.9% ± 16.3%).
Conclusion IAP during maximal front crawl swimming does not appear to be related to swimming performance.
Reference Moriyama S., et al. (2013). Intra-abdominal pressure during swimming. Int J Sports Med. (In press)
Presenter Shinichiro Moriyama is a lecturer and the head swim coach at Japan Women’s College of Physical Education.
POSTER 6 Using inertial measurement unit for coordination pattern detection and recognition in breaststroke Ludovic Seifert1, John Komar1, Romain Herault2, Didier Chollet1 1CETAPS EA3832, University of Rouen, France, 2LITIS, Nationale Institue of Applied Sciences
Introduction Underwater, kinematic movement analysis is regularly conducted using 3D camera systems providing a high number of spatial-temporal parameters of behaviour. Even if the video analysis has proven his accuracy and usefulness in swimming, the use of such multi-camera systems is highly time consuming and involves many steps that may contribute to increase the error of measurement like calibration and digitising. In that sense, the development of inertial measurement unit (IMU) is a promising way in order to facilitate technique assessment (like stroke rate, velocity variations or stroke phases detection) and to analyse inter-cycle movement variability (Dadashi et al., 2013). The aim of this study was to propose a method using IMU for capturing elbow and knee angles in breaststroke in order to assess inter-limb coordination.
Method Four IMU including gyroscope and magnetometer were located on the forearm and the arm to assess elbow angle, and on the thigh and the leg to assess knee angle with 200Hz rate sampling. The angle is computed as an integration of the gyroscope measure. This integration makes the measurement highly prone to drift. To tackle the drift at low cost 8 steps have been undertaken on each sensor: 1) The vector norm was computed at each instant of the magnetometer sensor. This give us a periodic signal synchronised with the angle signal (from the gyroscope signal); 2) The low frequencies of that signal was captured with a butterworth low-pass filter then a segmentation was extracted from the resulting sinusoid; 3) The peak and the valley of the angle signal were computed for each cycle; 4) The peaks were filtered according to their prominence: a prominence that deviates more than 3 times for upper limbs or 2 times for lower limbs from the standard deviation is not involved in the further computation; 5) The same filtering is done on valleys; 6) A peak-line is computed from the remaining peaks with a spline regression; 7) In the same manner, a base-line is computed from the remaining valleys with a spline regression; 8) The angle is normalised by these wrapping lines: NormalizedAngle(t)=(Angle(t)-BaseLine(t))/(PeakLine(t)-Baseline(t)). From there, angle key points of the cycle have been identified (confirmed by video footage inspection). This data processing did not allow getting absolute value of angle but only relative angle that was normalised between -1 and +1. Angular velocity was also normalised between -1 and +1, then phase angle was computed for each oscillator in order to calculate continuous relative phase between elbow and knee (as previously done by Seifert et al., 2011).
140 BMS2014—ABSTRACTS HANDBOOK

Results Left panel of the figure shows the angle time-series with the base line and peak line used to break the signal cycle-to-cycle and to correct the drift as shown in the centre panel of the figure. Right panel of the figure shows superposed normalised cycles and angle key points detection (start of glide (A) and end of glide (B)), which is useful to interpret propulsion, glide and recovery durations.
Conclusions Even if the proposed method did not allow the definition of real joint positions, measurements allowed the definition of patterns of joint angles and the calculation of inter-limb coordination. This work opens new perspectives in the use of IMU especially for race analysis where cycle-to-cycle assessment is promising. In addition, this method allows a quick data processing and therefore rapid feedback to the swimmer about the assessment.
References Dadashi F., Crettenand F., Millet G.P., Seifert L., Komar J., Aminian K. (2013). Automatic front-crawl temporal phase detection
using adaptive filtering of inertial signals. Journal of Sports Sciences, 31(11), 1251–1260
Seifert, L., Leblanc, H., Herault, R., Komar, J., Button, C., Chollet, D. (2011). Inter-individual variability in the upper – lower limb breaststroke coordination. Human Movement Science, 30(3), 550–565.
Presenter Ludovic Seifert is associate professor at the faculty of Sport Sciences of Rouen in France and works on Sport Biomechanics and Motor Control with a special focus on inter-limb coordination in relation to skills acquisition and high level of expertise achievement.
POSTER 7 How competitors increase their velocity: examination on spatio-temporal, coordination and kinetic parameters
Christophe Schnitzler1, Ludovic Seifert2, Huub Toussaint3, Chris Button4 1LISEC - EA 2310- University of Strasbourg, 2CETAPS Laboratory UPRES EA 3832: University of Rouen, Faculty of Sports Sc, 3Academy of Physical Education, University of Applied Sciences Amsterdam, The Netherlands, 4School of Physical Education, University of Otago, Dunedin, New Zealand
Introduction Theoretically, to swim faster, swimmers can either increase the magnitude of the propulsive force or the time allotted to propulsion, or both parameters. This study sought to understand what are the different strategies used by competitive swimmers when they increase their swim speed.
Methods 11 competitive swimmers undertook a flume swim test at 60% (pace 1), 85% (pace 2) and 100% (pace 3) of their maximal speed. Index of coordination (IdC), propulsive phase duration (PrP), Chollet et al., 2000) and force impulse (Fimp, using force 8 sensors fixed on the dorsal and palmar face of the hand, Schnitzler et al., 2011) were determined and compared across speed using a one-way ANOVAs.
Results As shown in Table 1, stroke rate (SR), IdC, and IN increased with speed while SL and Fimp remained constant in all swimmers.At group level, Fimp did not change with pace; However, inter-individual variations were found in force-velocity profiles: Fimp tended to increase in 2 swimmers, and to decrease in 4 others.
BMS2014—ABSTRACTS HANDBOOK 141

Table 1 Swimmers spatio temporal, coordination and force parameter across paces
Speed (m.s-1) F imp (N.s) SR (stroke.min-1) SL (m) IdC (%) PrP (%)
Pace 1 1.3±0.1b,c 41.2±10.5 35.4±5.0b,c 2.0±0.4 -2.2±4.3c 47.2±5.4c
Pace 2 1.5±0.1a,c 40.3±9.5 44.1±5.1a c 2.0±0.3 -0.6±4.6 48.8±5.2
Pace 3 1.8±0.1a,b 39.2±11.9 52.0±5.5a,b 2.0±0.2 4.6±5.7a 55.5±6.3a
* NS * NS * *
*significant difference with: a: pace 1; b: pace 2; c: pace 3 (p<.05)
Conclusion Our result showed that to swim faster, swimmers all increase their stroke rate but also maximise the time allotted to propulsion within the swim cycle. But surprisingly, we found high inter-individual variations in Fimp and its change over pace. This shows that to swim faster, different motor solutions actually exist. Using coordination and kinetic parameters might shed a new light on how swimmers adapt to a set of changing constraints.
References Chollet, D., Chalies, S. & Chatard, J. C. (2000). A new index of coordination for the crawl: description and usefulness. Int J Sports
Med, 21(1), 54–59.
Schnitzler, C., Brazier, T., et al. (2011). Effect of velocity and added resistance on selected coordination and force parameters in front crawl. J Strength Cond Res.
Presenter Ludovic Seifert is associate professor at the faculty of Sport Sciences of Rouen in France and works on Sport Biomechanics and Motor Control with a special focus on inter-limb coordination in relation to skills acquisition and high level of expertise achievement.
POSTER 8 Pressure induced by unsteady flow in swimming Bodo E Ungerechts1, Juergen M Klauck2 1University of Bielefeld, Neurocognition-Biomechanics, Germany, 2SPOHO Colgne, Biomechanics, Germany
Introduction Water, as a liquid matter of mass-energy-continuum, is different from solid bodies; thus it is not possible to push from water and the term pressure means not the same like in solid body realm although the same unit, Pascal, is applied. Water can be imagined as spacing, incompressible, wetted fluid particles, which obey some particular laws considering temperature, density, viscosity or momentum. When water mass are set in motion e.g. due to displacement by limbs or in currents the term pressure means change of energy-density-per-unit-volume creating change of momentum, simultaneously. Swimming is a combination of buoyancy and self-induced propulsion cognitively controlled under the condition of limited energy- reservoir. Buoyancy and self-induced propulsion depend on the change of energy density per unit-volume, respectively going with change of momentum and its immediate reaction on the centre of mass. Self-induced propulsion means interaction of limbs and water mass while energy is transferred from the organism to the surrounding wet volume creating unsteady flow conditions (Matsuuchi et al. 2009). Measurements of effects of unsteady flow on the interaction are rare. The purpose is to report a) how the unsteady flow pressure is altered due to body undulation of a dolphin model in a flume and b) how spatio-temporal pressure gradients may contribute to powerful propulsion.
Method In flow experiments measurements of pressure distribution acting normal to rigid model’s surface, called static pressure p are established using Piezo-probes. Measurements from head to fluke indicate local changes of p represented by ∆p, the difference between p in undisturbed current in front of the model and p of different points at the model’s surface. After converting ∆p into a pressure coefficient cp the pressure gradient pgrad between adjacent body sections can be calculated. A pressure gradient, which can be positive or negative, has a potential to perform work on the surrounding water mass. This paper focuses pgrad, due to induced change of local energy density of a undulating dolphin model in a flume. In this case changes of pgrad is indicating the effect of undulation (Ungerechts et al, 1985). A comparison of pgrad along a rigid versus undulating body is decisive to understand the unsteady effects on speed more clearly.
142 BMS2014—ABSTRACTS HANDBOOK

Results Undulation change pgrad remarkably in spatio-temporal respect whereas in steady flow the change is solely local. Some videos show and the data per cycle reveal how pgrad yield an intermediate maximum at the peduncle after stepwise increase of pgrad. It means that pgrad becomes negative again towards the fluke just before the pitching fluke is shedding a bound vortex indicating gradual increase of energy-density. This anew local re-drop in pgrad accelerates the water mass per cycle and prevents boundary layer from separation lowering the braking momentum effects due to appropriate timing of teeny whirlpools resulting in vortices whereas in a steady flow the local re-drop would cause a separation of boundary layer.
Conclusions Moreover this anew remarkable increase in energy-density supports the recuperation of some energy put into the flow due to displaced water (pre-formed water). The existing increase in energy-density may power a rapid rise of a starting vortex without demanding more energy from the undulating body which is characteristic for unsteady flow enabling a more powerful vortex ‘carrying as much momentum as possible in relation to their energy’ (Lighthill, 1969).
References Lighthill M.J. (1969) Hydrodynamics of aquatic animal propulsion. Annu. Rev. Fluid Mech., 1,413–446
Matsuuchi K., Miwa T., Nomura T., Sakakibara J., Shintani H., Ungerechts B.E. (2009) Unsteady flow field around a human hand and propulsive force in swimming. J of Biomechanics Vol. 42, Issue 1: 42–47
Ungerechts, B. (1985). A description of the reactions of the flow acceleration by an oscillating flexible shark model. In: K. Winter (ed.), Biomechanics IX, Human Kinetics, Champaign, IL, S. 492–498
Presenter Dr Bodo E Ungerechts is member of the ‘Steering Group of the Conference Series -Biomechanics and Medicine in Swimming. He studied biology, sport science and mathematics. During the period he was completing his PhD Bodo was still an active swimmer and became a consultant of coaches to discuss aspects of propulsion in sport swimming, e.g. one of the swimmer he worked with established world record on 100 m breaststroke in 1977. Later he organised the education of top coaches for the German Swimming Federation and he is still acting as a lecturer. He conducted the first experimental tests for enterprises studying the influence of fabrics and swim wear on the swimmers’ speed. Presently Bodo working as Affiliated Professor at Bielefeld University/Germany, Dept. Neurocognition and Action Biomechanics.
POSTER 9 Tethered swimmers propulsive force modelling based on Takagi-Sugeno Fuzzy Approach Rafael Bartnik Grebogi1, Leandro dos Santos Coelho1,2, Roberto Zanetti Freire2, Luciano Ferreira Cruz2 1Federal University of Parana (UFPR), 2Pontifical Catholic University of Parana (PUCPR)
Introduction The propulsive force of swimming and technique are key factors in the performance of the athlete. The more specific method to evaluate the propulsive force dynamometry is the tethered swimming (Morouço et al., 2008). Tethered swimming enhances the possibility of measuring the maximum force that corresponds to the propelling force that a swimmer must produce to overcome the water resistance at maximum free-swim velocity.
Method Various techniques have been introduced in previous studies to develop mathematical models to tethered swimmer’s propulsive force modelling. The aim of the study was to investigate a Takagi-Sugeno (T-S) fuzzy system (Takagi and Sugeno, 1985), a Computational Intelligence approach, applied to model propulsive force obtained of tethered swimmers tests with Brazilian elite swimmers. The focus of the T-S was to forecast time series of force data. Theoretical justification of fuzzy model as a universal approximator has been given in the last decade. The T-S fuzzy model is a system described by fuzzy IF-THEN rules which can give local linear representation of the nonlinear system by decomposing the whole input space into several partial fuzzy spaces and representing each output space with a linear equation, it also uses data grid partition and a Kalman filter optimisation approach.
Results The force data of Brazilian elite swimmers in crawl stroke swimming (only the arms) were measured using a platform with cables and dynamometer Instrutherm DD-300 connected to a personal computer to store the tension force signals. The swimmers performed a 10-second warm-up, followed by a 30-second high intensity trial of
BMS2014—ABSTRACTS HANDBOOK 143

tethered swimming in order to get the force data. The sampling time was 200 ms according to the dynamometer manufacturer. Figure 1 presents part of a tethered force test and T-S fuzzy modelling results.
0 20 40 60 80 100 120 140 160 180
40
60
80
100
120
140
160
180
200
sample
forc
e (N
)
measured forceestimated force by TS fuzzy system
(a) (b) (c)
Figure 1 (a) Part of the tethered force test video realised with a swimmer; (b) Analysed data (using an image processing software) of a swimmer during a tethered force test; (c) Result of force forecasting using T-S fuzzy system with mean absolute percentage error, MAPE = 4.86.
Conclusions The results of tethered swimming combined with T-S fuzzy modelling can be useful to relationship between swimming speed, asymmetric behaviours of stroke, the propulsive forces, and the instantaneous power. Furthermore, the results obtained were used to establish a prediction model and monitoring for competitive level of fitness in swimmers, which is important to athletes and coaches.
References Morouço, P., Soares, S., Vilas-Boas, J. P., Fernandes, R. J. (2008). Association between 30sec maximal tethered swimming and
swimming performance in front crawl. NACOB—North American Congress on Biomechanics, Ann Arbor, Michigan, USA.
Takagi, T. and Sugeno, M. (1985). Fuzzy identification of systems and its applications to modeling and control, IEEE Transactions on Systems, Man and Cybernetics, vol. 15, no. 1, pp. 116–132.
Presenter Roberto Z Freire is professor of the Industrial and Systems Engineering Graduate Program (PPGEPS) at Pontifical Catholic University of Parana (PUCPR) Brazil. His research areas are related to computational intelligence and simulation, identification, optimisation and advanced control algorithms.
POSTER 10 A new experimental platform for biomechanics in swimming using the swimming humanoid robot ‘SWUMANOID’ Motomu Nakashima1, Changhyun Chung1 1Tokyo Institute of Technology
Introduction Various research approaches have been taken to investigate biomechanics in swimming to date. First approach is the experiment using subject swimmers. For example, the ‘active drag’ during swimming was measured by using subject swimmers[1]. Second approach is the experiment using physical models. For example, the fluid force acting on a hand replica was measured[2]. Third approach is the computer simulation. The fluid forces acting on a swimmer were computationally obtained by solving the flow field around the swimmer[3]. In the present study, a new experimental platform as the fourth approach, in which a swimming humanoid robot is used as a subject swimmer, was proposed. The construction of this platform, such as the development of the robot and its basic test, was conducted in the present study.
Method The swimming humanoid robot, which was named ‘SWUMANOID’, was developed, as shown in the left figure. Its size was half-scale of the actual human. The stature and weight are 890mm and 7.1kg, respectively. It has 20 degrees-of-freedom for joints driven by 20 electric motors. Two basic tests were conducted in order to check the
144 BMS2014—ABSTRACTS HANDBOOK

possibility for utilising the robot to the biomechanical research. One was the experiment in a circulating water tank, in which the robot was mounted on a supporting mechanism, which drove the whole robot. The other was the free swimming experiment in a pool.
Results In the experiment in the circulating water tank, the robot could perform the crawl stroke successfully, as shown in the centre figure. The unsteady thrust produced by the robot was measured as well. The maximum thrust was found to be 0.5~1.5N for several cases. In the free swimming experiment in the pool, the robot also could perform the crawl stroke successfully, as shown in the right figure. The swimming velocity was found to be 0.23m/s.
Conclusions The construction of a new experimental platform using the swimming humanoid robot was successfully conducted. This platform will be able to provide new findings about biomechanics in swimming in near future.
References 1 Toussaint, H.M. et al., Journal of Applied Physiology, Vol. 65, No.6, 2506–2512, (1988).
2 Sidelink, N.O. and Young, B.W., Sports Engineering, Vol. 9, 129–135, (2006).
3 Keys, M. and Lyttle, A., The Impact of Technology II, 587–592, (2007).
Presenter Professor Motomu Nakashima received his PhD in 1995. Motomu is now an Associate Professor for Department of Mechanical and Control Engineering in Tokyo Institute of Technology. Motomu’s special interests are computer simulation and its application of swimming.
POSTER 11 Spatiotemporal and physiological responses to paddle use in front crawl swimming at maximum intensity Cristiano Cardoso de Matos1,2, Marcos Franken1,2, Rodrigo Zacca1,2, Bruno Costa Teixeira1,3, Flávio Antônio de Souza Castro1,2 1Federal University of Rio Grande do Sul (UFRGS), Brazil, 2Water Sports Research Group, 3Exercise Biochemistry and Physiology Study Group
Introduction Paddles are equipment widely used in training sessions; however there are few studies which compare spatiotemporal and physiological responses regarding this equipment in front crawl at maximal intensity. The aim of this study was to identify and to compare the spatiotemporal and physiological parameters obtained with and without paddles of 300 cm² area in maximal intensities of swimming.
Method Eleven male volunteers (25.8 ± 5.5 years old, 75.2 ± 5.5 kg body mass and 177 ± 6.5 cm height), masters swimmers, performed two 50 m all-out in front crawl stroke, with (WP) and without paddles (WOP). The spatiotemporal parameters obtained were: swimming velocity (SV), stroke rate (SR), stroke length (SL), stroke phases duration (A, B, C, D, propulsive and not propulsive on breathing side and opposite to breathing side) and index of coordination on both, breathing (IdC 1) and opposite of breathing side (IdC 2). Manuals timekeepers and camcorders (60 Hz) were utilised to obtain spatiotemporal parameters. Physiological parameters evaluated were: lactate concentration [LA] and perceived exertion (PE). The [LA] was analysed from capillary blood samples in portable lactimeter. Blood was collected from the fingertip three minutes after maximal effort. Perceived exertion (PE) values were collected immediately after each trial using the Borg scale. Hand palm area was estimated.
BMS2014—ABSTRACTS HANDBOOK 145

Results and discussion The paddle has increased 101% of hand palm area; however this increase was unable to change the spatiotemporal variables when WP and WOP were compared. In relation to physiological variables, WP had lower [LA] when compared to WOP. Physiological and spatiotemporal parameters responses could be dependent on three factors: sex, technical level and the increased percentage of the hand area caused by the use of paddles.
Conclusion Paddles with 300 cm2 of area don’t change spatiotemporal parameters in 50 m front crawl all-out and can decrease lactate response. Still, future longitudinal studies should be undertaken to elucidate further questions regarding to training effects.
References 1 Gourgoulis, V.; et al. Hand orientation in hand paddles swimming. International Journal Sports Medicine. v.29, n.5, p.429–
434, 2008.
2 Telles, T., Barbosa, A.C., Campos, M.H., Junior, O.A. Effect of hand paddles and parachute on the index of coordination of competitive crawl-strokers. Journal of Sports Sciences. v.29, n.4, p.431– 438, 2011.
Presenter Flávio Antônio de Souza Castro is from Federal University of Rio Grande do Sul, Brazil, where he teaches swimming and leads the Research Group in Aquatics Sports.
POSTER 12 Swimming kinematics at maximum intensity: comparison between young and adult swimmers Cristiano Cardoso de Matos1,2, Marcos Franken1,2, Flávio Antônio de Souza Castro1,2 1Water Sports Research Group, 2Federal University of Rio Grande do Sul (UFRGS), Brazil
Introduction The performance in swimming is dependent of both, propulsion and drag. Both (propulsion and drag) are dependent on the anthropometric characteristics and influenced by swimming technique. Considering the relations among anthropometric characteristics, propulsion, drag, and kinematics, this study sought to answer the question: which are the differences between young and adults swimmers in kinematic parameters? The objective of this study was to compare, raw and normalised, performance (PER), swimming velocity (SV), stroke rate (SR) and stroke length (SL) by different anthropometric parameters between young and adults swimmers.
Method 38 young competitive swimmers (YCS; 9.8±0.7 years old) and 11 adult competitive swimmers (ACS; 25.8±5.5 years old) were included in this study. All the swimmers performed 50 m all-out front crawl after warm-up in the same 25 m pool. The anthropometric measurements (weight, height, estimated areas of the hand palm and foot) were obtained just before the swimming. PER, SV, SR, and SL were collected by manual time-keeping. The data were normalised by height, and estimated areas of hand palm and foot. To compare raw and normalised data between the groups, Student’s t test for independent data was applied, alpha = 0.05.
Results and discussion When analysed absolute data, the YCS group presented expected lower values of PER, SV, and SL. Normalised for height, the YCS group presented lower values of SV, SR and SL. In contrast, when normalised by hand palm and foot areas, the YCS group presented greater SV, SR and SL. Adult swimmers have larger body size compared to children, these characteristics, together to other factors, as experience, physical conditioning and maturation, directly influence the results of the kinematic data.
Conclusion One should consider normalisation methods to compare and understand kinematic data in swimming. Anthropometric characteristics influence drag and propulsion, which can affect swimming kinematics of young and adult swimmers.
References Kjendlie, P.L., Stallman, R.K., Stray-Gundersen, J. Comparison of swimming techniques of children and adult swimmers. In:
Biomechanics and medicine in swimming IX. Université de Saint-E´tienne, Saint-E´tienne, p. 139–143, 2003.
Kjendlie, P., Stallman, R.K., Gundersen, J.S. Adults have lower stroke rate during submaximal front crawl swimming than children. European Journal Applyed Physiology. v.91, p.649– 655, 2004.
146 BMS2014—ABSTRACTS HANDBOOK

Presenter Flávio Antônio de Souza Castro is from Federal University of Rio Grande do Sul, Brazil, where he teaches swimming and leads the Research Group in Aquatics Sports.
POSTER 13 15th FINA World Championships: stroke parameter changes during women’s 100m finals Amy Bathgate1, Helen Bayne1, Claire Rolt2 1High Performance Centre, University of Pretoria, 2Institute of Sports Research, University of Pretoria
Introduction Stroke rate and stroke length are fundamental variables of aquatic locomotion. Analysis of these parameters and their contribution to performance form a crucial step in the design of effective training programs and race strategies. Analysis of 200m events found improved swimming performance to be associated with different variations in stroke parameters depending on the biomechanical requisites of the task (swimming stroke) (1). The purpose of this study was to compare stroke parameters in swimmers participating in each of the women’s 100m finals at the 15th FINA World Championship. We hypothesised that changes in stroke parameters from the first to the second lap of a 100m race would vary between the swimming strokes.
Methods All eight swimmers in each of the 100m finals (BS: breaststroke, BK: backstroke, FS: freestyle, BF: butterfly) of the 15th FINA World Championships were included in the study. Data was downloaded from a public domain and included swim velocity (V), stroke length (SL), stroke rate (SR), stroke index (SI) (velocity x stroke length) and a ratio of stroke rate to stroke frequency (SR:SL), averaged during the ‘free swim’ sections of the first and second laps of the race. A mixed 2 way ANOVA was performed to assess the interaction effect of time and stroke on these variables.
Results Descriptive results are presented in Table 1. There was a significant interaction effect of time*stroke on each of the variables (p<0.05), indicating that the changes in stroke parameters differed, depending on the strokes.
Table 1 Mean and standard deviations (SD) for each stroke parameter in the first and second lap of the race, and the percentage change from lap one to lap two (∆)
SR SL V SR:SL SI
Lap 1 2 ∆ 1 2 ∆ 1 2 ∆ 1 2 ∆ 1 2 ∆
BS mean 48.6 51.3 5% 1.9 1.7 -11% 1.5 1.4 -6% 26.8 32.1 18% 2.8 2.3 -16%
SD 6.5 8.7 7% 0.3 0.3 5% 0.0 0.0 1% 6.7 10.1 16% 0.4 0.3 5%
BK mean 46.3 45.3 0% 2.1 2.1 -3% 1.6 1.6 -3% 22.0 22.1 7% 3.4 3.2 -6%
SD 2.0 2.2 6% 0.1 0.1 5% 0.0 0.0 2% 1.6 2.4 13% 0.2 0.2 6%
FS mean 50.9 50.3 0% 2.2 2.1 -3% 1.8 1.7 -4% 23.8 24.5 4% 3.9 3.6 -8%
SD 2.8 3.3 4% 0.2 0.1 6% 0.0 0.0 3% 2.9 3.2 9% 0.4 0.3 9%
BF mean 57.5 55.6 -1% 1.8 1.7 -2% 1.7 1.6 -4% 32.0 32.8 2% 3.1 2.7 -7%
SD 2.3 1.5 3% 0.1 0.1 6% 0.0 0.0 3% 2.7 1.9 6% 0.2 0.1 9%
Conclusions Elite swimmers display increased stroke frequency and decreased stroke length in breaststroke in the second lap in comparison to the first, while in comparison, the other strokes display very little change in stroke frequency and smaller decreases in stroke length. These differences are reflected in both the stroke ratio and stroke index, which may be useful measures in providing further insight into race strategies in different strokes. Further research should investigate whether similar trends are found between strokes in male swimmers.
References
1 Hellard, P., et al. (2008). Kinematic measures and stroke variability in elite female 200m swimmers in the four swimming techniques: Athens 2004 Olympic semi-finalists and French National 2004 Championship semi-finalists. Journal of Sports Sciences, 26 (1), 35–46.
BMS2014—ABSTRACTS HANDBOOK 147

Presenter Amy Bathgate has been at the Biomechanics and Video Analysis department of the High Performance Centre (hpc) of the University of Pretoria since 2007. At the hpc, Amy has worked regularly with athletes of all levels from various sporting codes, including Olympic athletes (such as Bridgitte Hartley, Khotso Mokoena, Caster Semenya, Karin Prinsloo, Suzaan van Biljon), and international teams and athletes. She provides technique analysis and support to swimmers and coaches across South Africa and in certain other African countries. She is one of only two Dartfish Certified Instructors in South Africa, and lectures students at the University of Pretoria in both Video Analysis, and Dartfish Certification, while also providing training and support to private Dartfish users.
POSTER 16 The effect of the step-start techniques on swimming times in relay events Sebastian Fischer1, Armin Kibele1 1Institute for Sports and Sport Science, University of Kassel
Introduction Relay starts in competitive swimming differ from individual starts. The take-off behaviour of the second, third, and fourth swimmer has to be matched with the wall contact of the previous swimmer. In a variety of studies, a significant potential for improvement of relay starts with a step start technique has been found (McLean et al., 2000; Kibele & Fischer, 2010; Takeda et al., 2010). Nevertheless, to date, there is a lack of systematic analysis of the effectiveness of this technique. An analysis of the race times from the finals in the 2010 European Championships and the 2011 World Championships was pursued to evaluate the relay start techniques.
Method All swimmers (88 female and 98 male) of the relay finals in these two international events, who also reached at least the semi finals in the corresponding individual race, were included in this study. The race times, the block times, and the change-over times of the relay finals and the individual races given by Omega Timing (www.omegatiming.com) were analysed. Time adjustments were made to compare swimming times in both events. For the relay race, the change-over time was subtracted from the swimming time. For the individual race, the block time was subtracted from the swimming time. The difference between the adjusted swimming times in the relay and the individual race was used as an indicator of the effectiveness of the relay start. Here, negative values indicate an advantage of the relay start.
Results An analysis of variance with repeated measures revealed a highly significant difference for the adjusted swimming times in the 4x100F relay races between the first starter (∆t 0–50m = -0,03s ± 0,36s, n=18) and the following starters (∆t 0–50m = -0,23s ± 0,34s, n=58). In contrast, no differences were found for the second part of the races (∆t 50–100m). No gender effects were detected. When including the medley relays, the above differences remained.
Conclusion The above results show that step-start techniques are beneficial for the relay race in comparison with an individual race. It must be noted that the movement on the starting block in the relay events provides a basis for the subsequent movements. Thus, step-start techniques influence the swim start performance, as well as the performance during the first lap.
References Kibele, A & Fischer, S (2010). Relay Start Strategies in Elite Swimmers. In PL Kjendle, RK Stallman & J Cabri (Eds.), Biom Med
Swimming XI. Proc XI Int Symposium Biom Med Swimming. Oslo: Norwegian School of Sport Sciences.
McLean SP, Holthe MJ, Vint PF, Beckett KD & Hinrichs RN (2000). Addition of an approach to a Swimming Relay Start. J Appl Biom, 16, 342–355.
Takeda T, Takagi H & Tsubakimoto S (2010). Comparison among Three Types of Relay Start in Competitive Swimming. In PL Kjendle, RK Stallman & J Cabri (Eds.), Biom Med Swimming XI. Proc XI Int Symposium Biom Med Swimming. Oslo: Norwegian School of Sport Sciences.
Presenter Sebastian Fischer received his PhD from the University of Kassel in 2012.
148 BMS2014—ABSTRACTS HANDBOOK

POSTER 17 A kinematic analysis of the grab and the track start in swimming—changes in the start performance David Burkhardt1, Johanna Menze1, William R Taylor1, Silvio Lorenzetti1 1ETH Zurich, Institute for Biomechanics, Zurich
Introduction In swimming, the starting technique plays a critical role for the outcome of a competitive race, especially in short distance sprints. The grab start and the track start, whereby the swimmer places the feet either next to each other or in a step position respectively, have long been the standard starting variations (Krüger et al., 2003). Both techniques are still used in high level competitive swimming; however in 2009, new regulations in international swimming led to a new starting block design, the OSB11 (Biel et al., 2010). Major changes of the block design include, amongst others, an increased height and a steeper angle of the block platform, but more importantly an additional kick plate at the rear end of the block (Kibele et al., 2011). These modifications could lead to a definitive start advantage using the step position, which is referred to as the kick start on the OSB11 (Honda et al., 2010). The aim of this study was to identify differences in starting technique between the grab start and the track start based on the quantifications of the swimmers performances, but also quantify the possible benefit of the additional kick plate for improving starting performance.
Methods 17 swimmers (13 males, aged: 18.6±2.3) with an average experience of 9.3 years competitive swimming participated in this study. The different start techniques were evaluated based on kinematic parameters, which indicate influences of the starting characteristics on the subsequent swimming performance. The swimmer’s performance during the start was evaluated according to a 7.5m distance time and the swimmer’s velocity at this point. Additional kinematic parameters (joint and body angles, horizontal velocities, flight distance, immersion length—distance from hand immersion to feet immersion—and times at different distances) were evaluated. Temporal parameters comprised the reaction time (time from signal to first movement), block time (contact time between swimmer and block after the start signal) and flight times (time in air until first immersion). Starts were recorded with a system of four video cameras positioned sagittal of the swimmers, one above and two underwater, as well as posterior of the swimmer (Figure 1). All swimmers completed three starts of each starting type in a random order. Results were statistically analysed using a linear mixed model and possible influences and dependencies were reviewed.
Figure 1 Example of starting analysis
Results No significant advantage between the grab and the track start could be proven on the basis of the obtained results. However, the kick start using the OSB11 block design was found to be superior to the other two techniques, as the 7.5m time was shorter for this starting type (p<0.051) (Table 1). The block time varied strongly between the different starts, and was longest for the grab start and shortest for the kick start. Furthermore, the velocity at take-off correlated with the block times in the case of the grab and the kick start as it increased on account of a longer block time. The minimal immersion length for the kick start could also be a reason for an advantage of this technique.
BMS2014—ABSTRACTS HANDBOOK 149

Table 1 Mean ±SD for the three starting techniques for three parameters
Time to 7.5m [s] Block time [s] Take-off velocity [m/s]
Grab Start 2.99 ± 0.28 0.66 ± 0.04 4.3 ± 0.3
Track Start 2.99 ± 0.28 0.59 ± 0.05 4.4 ± 0.3
Kick Start 2.86 ± 0.30 0.54 ± 0.06 4.2 ± 0.4
Conclusions Although increased time in contact with the starting block leads to improved starting velocities, it seems that the shorter block time for the kick start can be conserved and lead to shorter times at 7.5m and therefore to an improved starting performance.
References 1 Biel,K et al. (2010). Zur Effektivität des neuen Startblocks (OSB11) beim Schrittstart [...], dvs-Symposium 2010.
2 Honda, K.E. et al. (2010). A biomechanical comparison of elite swimmers [...], BMS 2010.
3 Kibele, A. et al.(2011). Biomechanische Grundlagen des Startsprungs im Schwimmen, Sportwissenschaft.
4 Krüger, T. et al. (2003) Biomechanics of the grab and track start technique, BMS IX.
Presenter David Burkhardt studied Human Movement Science at the ETH Zurich and finished his Master in September 2010. During the master program he specialised in Biomechanics. He did a three months internship in 2009 at the IfB within a project about optimisation of fixation in shoulder fractures. He wrote his master thesis ‘Tracking of Upper Body Movements in Rowing’ at the Sensory Motor Systems Lab at the ETH Zurich in 2010. At the moment he works as a research assistant in the Sportbiomechanics-Group of Dr Silvio Lorenzetti. He was a competitive swimmer (national team) for many years and is working as a swimming coach now.
POSTER 19 Strength power and start performance in a national swimming squad Mario Costa1,6, Mario Marques2,6, Hugo Louro3,6, Rui Ramos2,6, Jorge Morais4,6, Ana Conceico3,6, Antonio Silva4,6, Daniel Marinho2,6, Tiago Barbosa5,6 1Polytechnic Institute of Guarda, 2University of Beira Interior, 3Polytechnic Institute of Santarom, 4University of Tras-os-Montes and Alto Douro, 5Nanyang Technological University, 6Research Centre in Sport Sciences, Health and Human Development
Introduction At top-level, in short-distance races, the starting ability plays a major role in final performance. Reaction time and time to leave the block are some of the variables assessed on regular basis. To enhance this stage, practitioners design specific land-based strength training programs to improve lower limbs’ power. The aim of this research was to determine the association between lower limbs strength and several determinants of the starting performance in swimmers of a national squad.
Methods Fourteen adult swimmers included in the roaster of a national team (eight males and six females) took part in this study. As a dry-land strength power measure, three squat jumps and countermovement jumps on a contact mat (Ergojump Digitime 1000, Digest, Finland) were collected (Garrido et al., 2010). The time (in s) and height (in cm) of the jumps were selected as variables. A fixed smith-machine with a linear encoder attached (T-Force, Murcia, Spain) was used to measure the maximal strength (in kg) in full squat exercises (Segovia et al., 2011). Swimmers also undertook a set of three starts from the staring block. The ground reaction force (in BW) in the three dimensional axis (horizontal, vertical and lateral) and reaction time (in s) were obtained by a force platform (Plux, Lisboa, Portugal). It was calculated the spearman’s correlation matrix between all selected variables (P<0.05).
Results Significant associations were found between the maximal full squat strength and both horizontal (Rs=0.73, P<0.01) and vertical (Rs=0.79, P<0.01) ground reaction force components. Vertical ground reaction force component was also associated with squat (Rs=0.62, P<0.05) and countermovement (Rs=0.60, P<0.05) jumps. Associations between the maximal full squat strength and both jumps were also significant (Rs=0.82, P<0.01 and Rs=0.81, P<0.01 for squat and countermovement, respectively). No association was found between reaction time and any of the remaining variables, suggesting that reaction time depends mainly from neuro-muscular responses.
150 BMS2014—ABSTRACTS HANDBOOK

Conclusions It can be concluded that in top-level adult swimmers, the strength power plays an important role in start performance.
References 1 Garrido N, Marinho DA, Reis VM, van den Tilaar R, Costa AM, Silva AJ, Marques MC (2010). J Sports Sci Med 9: 300–310
2 Segovia M, Marques MC, Van den Tillaar R, González-Badillo JJ (2011). Journal of Human Kinetics, 30: 115–122
Presenter Mario Costa holds a PhD in Sport Sciences (2012) at the University of Tras-os-Montes and Alto Douro in Portugal. He is member of the research and evaluation office from the Portuguese Swimming Federation. The main focus of his research is ‘Training interventions in elite swimming mostly related with energetic and biomechanical aspects of performance’.
POSTER 20 Calculation of lower limbs joint torque of Grab and Track start in competitive swimming Sakai Shin1, Takeda Tsuyoshi2, Tsubakimoto Shouzo3, Takagi Hideki3 1Doctoral progress in Physical Education, University of Tsukuba, 2Faculty of Sports Sciences, Waseda University, 3Faculty of Health and Sport Sciences
Introduction Recently, Grab and Track start have been mainly used in swimming competitions. The take-off velocity from the starting block is caused by acting a force on the block by hands and feet. Thus a characteristic of start technique must be clarified by measuring the force acting on the block. Additionally, we can clarify the movement on the starting block in detail by calculating the joint torque from reaction force. Therefore, the purpose of this study was assumed to clarify details of movement on the starting block by means of the joint torque of lower limbs from the measured reaction force.
Method We fabricated a new starting block with built-in biaxial (horizontal and vertical) force gauges which consisted of hand, front-foot, rear-foot-part. The horizontal/vertical component of take-off velocity was calculated as each component of impulse during a movement on the starting block divided by subject’s weight. The joint torque was calculated to use the methodology of Ae et al (2000) from the measured reaction force on starting block.
Results In Grab start, the extension torque was confirmed in the foot and hip joint during movement on starting block. However, the flexion torque was observed in the knee joint from start signal to take-off hands from starting block. After take-off hands from starting block, the knee joint demonstrated the extension torque. In Track start, extension torque was confirmed in foot, knee, and hip joint of the rear leg. On the other hand, the similar result as well as Grab start was shown in front leg. It is thought that the flexion torque of knee joint when jumping movement is a peculiar phenomenon of movement on starting block in competitive swimming.
Conclusions In Grab start, the extension torque was confirmed in foot and hip joint, and the flexion torque was observed in knee joint during movement on starting block. In Track start, extension torque was confirmed in foot, knee, and hip joint of rear leg. On the other hand, the similar result to as Grab start was shown in front leg.
Reference David A. Winter (2009). Biomechanics and Motor Control and Human Movement. 4thbed., Wiley
Maglischo E.W. (2003). Swimming fastest, 265–278. Human Kinetics.
Presenter Sakai Shin is part of the doctoral program at University of Tsukuba, and studying the start phase of competitive swimming.
BMS2014—ABSTRACTS HANDBOOK 151

POSTER 21 What differences between the role of trunk and thigh muscles during undulatory underwater swimming? Hirofumi Shimojo1, Yasuo Sengoku2, Shozo Tsubakimoto2, Hideki Takagi2 1Graduate School of Comprehensive Human Sciences, University of Tsukuba, 2Faculty of Health and Sport Sciences, University of Tsukuba
Introduction The undulatory underwater swimming (UUS) was used after start and turns by many swimmers. Amplitude of upper body was comparatively small amounts of vertical movement and it was considered that the upper body have role of ‘inertial dumper’ during UUS (Connaboy et al., 2007). We hypothesised that the trunk (abdominal part) is more co-contraction than thigh during UUS for stabilise the upper body. The purpose of this study was to investigate the differences between activities of trunk and thigh muscles during UUS.
Method Eight male collage swimmers participated in this study. The swimmers performed UUS at 70%, 80%, 90%, and 95% relative maximal velocity in circular water channel. EMG of four muscles (RA, ES, RF, and BF) were recorded. Seven anatomical landmark (wrist, shoulder, lower rib, hip, knee, ankle, and 5thMPJ) were marked on the swimmers using LED markers. The motion was captured for obtaining the 2D coordinates. Relative difference signals (RDS) was assessed as co-contraction level between the flexor and extensor muscles (RA and ES. BF and RF) (Heuer, 2007).
Results With increasing swimming velocity, kick frequency became higher but kick amplitude was not changed. Although the lower body anatomical points were oscillate largely, the oscillators of upper body were very small. It was observed that co-contraction level of trunk and thigh were not changes even through upper body more stabilise (Table 1). The thigh was more co-contraction than the trunk muscles.
The role of trunk might be damping the momentum from the leg movement travelling to head direction, which correlating to small the cross sectional area. Furthermore, the thigh could be generating the thrust power from knee and hip flexion/extension so that having the role of propulsion drive.
Table 1 Co-contraction level of body part at each velocity
70% V 80% V 90% V 95% V
Trunk 0.79 0.79 0.78 0.77
Thigh 0.62 0.65 0.62 0.68
Low value means more co-contraction.
Conclusions Skilled swimmer could change agonist and antagonist muscle activity alternately even if swimming speed is higher.
References Connaboy, C. et al. (2007). Tadpole, troutor tuna: The equivalence of animal and human aquatic undulatory locomotion.
Proceedings of the XXVth International Symposium on Biomechanics in Sports, Ouro Preto, Brazil.
Heuer, Herbert (2006). Control of the dominant and nondominant hand: exploitation and taming of nonmuscular forces. Exp. Brain Res. 178: 363–373
Presenter Hirofumi Shimojo is interested in dolphin kick performance and motor control/learning.
152 BMS2014—ABSTRACTS HANDBOOK

POSTER 22 Effect of swimming speed on breaststroke movement in a swimming flume Masaaki Ohba1, Yoshimitsu Shimoyama2, Shozo Tsubakimoto3 1Institute of Humanities, Social Sciences and Education, Niigata University, 2Niigata University of Health and Welfare, 3University of Tsukuba
Introduction Competitive swimmers require the capability of changing swimming speed to control their output. Nevertheless, athletes have difficulty controlling their own motion. They attempt to control their own motion according to subjective sensations. Ohba (2010) showed that the degree of swimming velocity (SV, m/s) increase by the stroke rate (SR, strokes/min) increase in breaststroke swimming (BR) was less than in front crawl swimming (FC) because of technical characteristics. This study examined the relation between stroke motion and swimming velocity in a swimming flume during BR in comparison with FC.
Method After giving their consent, eight well-trained college swimmers participated in this study. The 100% velocity of each swimmer was found using a Pre-Test (25-m swimming test with maximal subjective effort). Eight 10-s swim trials were conducted in a swimming flume, consisting of two styles (FC and BR) and four levels of objective speed. The levels were four steps from 70–100% velocity with equal clearance.
A high-speed digital camera recorded the complete underwater arm and leg stroke cycles in a lateral view. Stroke parameters were calculated from videotaped data of the swimmers. The digital video was analysed by digitising 13 points of the body. Data are presented as mean ± standard deviation (SD).
Results Table 1 shows the SR of both strokes for each speed level. A significant positive correlation was found between SV and SR. Changing the swimming velocity depends remarkably upon SR, not only for FC but also for BR. However, both strokes do not have the same ratio of SR increase while stepping up the SV increase. The minimum knee angles and kicking phases of the breaststroke for each velocity showed no significant differences between velocities.
Table 1 SR of each speed level
SV (%) FC–SR(%) BR–SR(%)
70 68.5±5.4 53.1±10.3
80 79.2±5.0 66.7±11.9
90 90.7±2.7 86.1±4.7
100 100 100
Conclusion Results show that the degree of SV increase by SR increase in BR is less than that in FC because it is difficult for swimmers to change the BR kicking motion.
Reference Ohba M., Sato S., Shimoyama Y., Sato D. Effect of subjective effort on stroke timing in breaststroke swimming. Biomechanics and
Medicine in Swimming XI; 274–275 (2010).
Presenter Masaaki Ohba’s speciality is coaching and training of swimming. He is working as associate professor in Niigata University, which has a faculty of education, at centre area in Japan, and mainly researching relationship between stroke timing and subjective effort.
BMS2014—ABSTRACTS HANDBOOK 153

POSTER 23 The time difference between the increase of hand pressure and the beginning of hand’s backward movement during catch in front crawl Yasushi Ikuta1, Hiroshi Ichikawa2, Tomoyoshi Matsumoto1, Masanobu Tachi3, Yuji Matsuda4 1Osaka Kyoiku University, 2Fukuoka University, 3Nara University of Education, 4Japan Institute of Sports Sciences
Introduction In front crawl, the catch is defined as the beginning of hand’s backward movement after its entry into the water (Chollet 2000). From this time point the swimmers begin to accelerate the body forward with the arms (Maglischo 2003). Thus, to accelerate the body forward, an efficient catch technique is essential to effectively applying the propulsive force with the arm. However, no study has described the catch technique in relation to the propulsive force applied with the hand. By measuring the hand pressure, this study aimed to determine the relationship between the hand’s force application and its backward movement during catch in front crawl swimming.
Methods Subjects were two female swimmers. Their personal best for 50m freestyle was 26.85 sec for Subject 1 and 30.50 sec for Subject 2. The swim tests consist of 25m front crawl swimming without kicking at three different velocities (slow, middle and fast). A micro pressure sensor was attached on both palmar and dorsal sides of the subject’s left hand and the pressures during the trials were recorded at 200 Hz. The time of the rapid hand pressure increase during catch was calculated and expressed as a percentage of underwater arm stroke duration (HPI%UW).
Two underwater cameras and three cameras on pool deck were used to record the 15–17.5m section of the trials. Kinematic data were analysed using a three-dimensional direct linear transformation procedure. The time at the beginning of hand’s backward movement was calculated and expressed as a percentage of underwater arm stroke duration (HBM%UW).
Results For Subject 1, HPI%UW was 58.8% for slow, 56.1% for middle and 49.5% for fast. And HBM%UW was 56.2%, 57.1% and 55.3%, for slow, middle and fast, respectively. For subject 2, HPI%UW was 45.3% for slow, 40.9% for middle and 42.1% for fast. And HBM%UW was 62.9%, 52.0% and 52.3%, for slow, middle and fast, respectively. The difference between HPI%UW and HBM%UW were 1.0–5.8% for Subject 1 and 10.2–17.5% for Subject 2.
Conclusions The increase of hand’s force application was almost simultaneously with the backward hand movement for the faster swimmer (Subject 1). However, the slower swimmer (Subject 2) applied force with the hand clearly before the backward hand movement. These results suggested that the slower swimmer had less efficient catch technique, and could not apply the propulsive force effectively in the direction to accelerate the body forward.
References Chollet et al. (2000) A new index of coordination for the crawl: Description and usefulness. International Journal of Sports
Medicine 21: 54–59.
Maglischo (2003) Swimming fastest. Human kinetics, Champaign, p76.
Presenter Dr Yasushi Ikuta is an associate professor of department of sports in Osaka Kyoiku University (OKU). He is head coach of OKU swimming team and a member of science committee of Japan Swimming Federation.
POSTER 24 The effect of hand kinematics and arm coordination on intracyclic velocity as increasing swimming velocity in front crawl Yuji Matsuda1, Yoshihisa Sakurai1, Yasuyuki Kubo1 1Japan Institute of Sports Sciences
Introduction The swimming velocity in a stroke cycle is not stable but fluctuates. The intracyclic velocity variation in a stroke cycle (IVV) was related to the skill levels (Schnitzler C et al., 2008) and swimming efficiency. However it is not clear how the hand kinematics and timing of propulsive action affect the IVV as the average swimming velocity is increased
154 BMS2014—ABSTRACTS HANDBOOK

within a subject. The purpose of this study was to examine the effect of hand kinematics and the timing of propulsive action on IVV as increasing average velocity in front crawl.
Methods Seven high level swimmers participated in the study. The swimmers swam at imposed swimming velocity which were maxima velocity (Vmax), 90 and 95% of Vmax in front crawl. All trials were recorded by using motion capture system that included seventeen under water cameras and eight land cameras. The center of mass was calculated by using body landmarks, and the velocity of whole body was calculated by using the calculated center of mass. Coefficient variance (CV), maximal (Vmax) and minimum velocity (Vmin) in a stroke cycle were used as indicators of IVV. Index of coordination (Idc) was calculated to evaluate the lag time between the propulsive phases of each arm (Chollet et al 2000). Hand velocity was calculated by using finger coordinate and maximal hand velocity was calculated.
Result CV decreased as increasing swimming velocity. Although both Vmax and Vmin were increased as increasing swimming velocity, increase rate of Vmin was significantly higher than that of Vmax. Hand maximal velocity increased as increasing velocity. However the increase rate of hand maximal velocity was smaller than that of average velocity. Idc increased as increasing velocity.
Discussion It is suggested that magnitude of IVV was decreased as increasing swimming velocity, and this was associated with higher increase rate of Vmin. This would be associated with higher continuity of propulsive action. Although increased hand velocity would contribute to the increase in average velocity, especially contribution of change in continuity of propulsive action is large.
Reference Chollet D., Chalies S. & Chatard J.C. (2000). New Index of coordination for the crawl:description and usefulness. Int J Sports Med,
20, 54–59.
Schnitzler C., Seifert L., Ernwein V. & Chollet D. (2008). Arm coordination adaptations assessment in swimming. Int J Sports Med, 29, 480–486.
Presenter Yuji Matsuda received master’s degree in the Graduate School of Human and Environmental Studies, Kyoto University, Kyoto, Japan. In 2013, he was appointed as a researcher of the Japan Institute of Sports Sciences. His major research interests focus on biomechanics in swimming.
POSTER 25 Comparing whole stroke and arm only in front crawl at the mechanical efficiency Kenzo Narita1, Hideko Takagi2, Yasuo Sengoku2, Shozo Tsubakimoto2 1Graduate School of Comprehensive Human Sciences, University of Tsukuba, 2Faculty of Health and Sport Sciences, University of Tsukuba
Introduction It has not been yet revealed how swimming efficiency that was calculated by the rate of consumed energy and mechanical work (swimming speed × drag force) was changed by using lower limbs during front-crawl. Toussaint et al. (1988) researched mechanical efficiency by using MAD-system, however, the experience was performed arm only swimming without lower limb motions. The purpose of this study was to investigate how lower limb motions affect to the mechanical efficiency from the comparison between whole stroke with lower limb motions and arm only stroke by measuring drag force at sub-maximal intensity.
Methods Three elite male swimmers participated in this study. Two trials which the whole stroke and arms only (fixed ankles and supported thighs by a small buoy) in front crawl swimming were performed in the circulating water channel at 1.2 ms-1. Drag forces and oxygen uptake during swimming were measured to calculate mechanical efficiency and energy cost. Drag forces were measured by reference to Takagi et al.1). This method calculated drag forces during swimming from residual thrust (thrust minus the active drag; Tr) that was measured while each flow velocity (V) with at a certain velocity maintained. The Tr and V date were least-squares fitted to regression formula Eq. (1) (Takagi et al. 1)).
BMS2014—ABSTRACTS HANDBOOK 155

Tr = T0 1- (V / V0) n (1)
Where T0 means the thrust at a certain velocity maintained when velocity equals zero, V0 is the theoretically achievable swimming velocity when the residual thrust equals zero and n is an experimental constant.
Results There was not much difference for mechanical efficiency between whole stroke (5.0%) and arms only (4.7%). In the drag force, whole stroke value (56.0 N) was higher than arm only (40.1 N). For the energy cost that indicates swimming economy, whole stroke value (1109Jm-1) was higher than arm only (847Jm-1).
Conclusions Comparing the present study to previous study2), the values of drag forces were almost same value. Thus it is suggested that a methodology of the present study seems to be appropriate.
According to the results, the front crawl swimming with or without lower limb motions showed almost similar mechanical efficiency, and swimming with lower limbs showed higher energy cost than swimming with lower limbs.
References 1 Takagi H, Shimizu Y, Kodan N. A hydrodynamic study of active drag in swimming. JSME International Journal (42), 171–177,
1999.
2 Toussaint HM, Knops W, Groot GD, Hollander AP. The Mechanical efficiency of front crawl swimming. Medicine and Science in Sports and Exercise (22), 402–408, 1990.
Presenter Kenzo Narita is studying of swimming efficiency and interested in how can we swim efficiency at the University of Tsukuba. He was a swimmer.
POSTER 26 Trunk and leg muscle activity during underwater undulatory swimming in male collegiate swimmers Keisuke Kobayashi1, Yasuo Sengoku2, Hideki Takagi2, Shozo Tsubakimoto2 1Graduate School of Comprehensive Human Sciences, University of Tsukuba, 2Faculty of Health and Sport Sciences, University of Tsukuba
Introduction Underwater undulatory swimming (UUS) is an important technic during start and turn phase in competitive swimming, because underwater events are significantly faster than surface swims (Vorontsov, 2000). However, there is few study about muscle activity during UUS. The purpose of this study was to clarify the characteristic of trunk and leg muscle activities during UUS.
Method Seven male collegiate swimmers participated and performed 15 m × 2 times UUS trials at two different subjective efforts (Slow and Fast). The UUS trials were filmed by a camera which was set on the deck at 10 m from starting side. One cycle when the subject passed through 10 m from starting side was investigated in this study. The horizontal centre of mass (CM) velocity, kick amplitude, kicking frequency, joint angles were analysed by 2D-analysis. Surface electromyogram (sEMG) measured 6 muscles, which were rectus abdominis (RA), eretor spinae (ES), rectus femoris (RF), long head of biceps femoris (BF), tibial anterior (TA), medial head of gastrocnemius (GAS). The sEMG was smoothed to an linear envelope and normalised by peak of each muscle’s maximal voluntary contraction (MVC) as %MVC. One cycle of UUS was divided into three phase according to Arellano et al. (2002). Muscle activity at each phase was evaluated as average of %MVC. Differences of muscle activity between two trials and three phases were investigated.
Results The average horizontal CM velocity during each trial were 1.22±0.16 m/s and 1.44±0.12 m/s, respectively (Slow vs Fast, p < 0.05). The average RA, RF and TA activities at all phase of Fast trial were increased significantly compared to Slow trial (Slow vs Fast, p < 0.05). The average all muscle’s activities were not significantly different between three phases in each trials.
156 BMS2014—ABSTRACTS HANDBOOK

Conclusions The increment of UUS velocity is considered to relate to the activity of RA, RF and TA.
References Arellano, R., Pardillo, S. & Gavilán, A. (2002). Underwater undulatory swimming: Kinematic characteristics, vortex generation and
application during the start, turn and swimming strokes. In: Proceedings of the XXth International Symposium on Biomechanics in Sports, Universidad de Granada.
Vorontsov, A. R. & Rumyantsev, V. A. (2000). Resistive forces in swimming. In Zatsiorsky, V.(Ed), Biomechanics in sport (p.185–204). Malden, MA, USA:Blackwell Science.
Presenter Keisuke Kobayashi is studying about muscle activity during swimming at the Graduate School of Comprehensive Human Sciences at the University of Tsukuba.
POSTER 27 Does the attack angle during sculling motion follow the technical recommendation? Lara Elena Gomes1,2, Monica Melo2,3, Marcelo La Torre2,3,4, Flavio Castro2, Jefferson Loss2 1Federal University of Vale do Sao Francisco, Petrolina (PE), Brazil, 2Federal University of Rio Grande do Sul, Porto Alegre (RS), Brazil, 3University of Caxias do Sul, Caxias do Sul (RS), Brazil, 4University of Vale do Rio dos Sinos, Sao Leopoldo (RS), Brazil
Introduction Sculling motion is a propulsive movement that may be performed in synchronised swimming, water polo and swimming. The technical recommendations of this movement are based on results obtained using the quasi-static approach. Since sculling motion is characterised by a substantial application of lift force, based on the quasi-static analysis, the recommended attack angle is between 35–45° (Sanders, 1999). However, the quasi-static approach fails to consider the effect of the variation in speed, orientation and direction of the hand, which can affect force coefficients significantly (Sanders, 1999). Thus, the purpose of this study was to describe the attack angle during the sculling motion.
Method The sample consisted of ten synchronised swimmers (12.07±1.95 years, 1.52±0.09 m, 48.72±12.40 kg), which was asked to perform 15 seconds of sculling motion at a constant intensity, maintaining a stationary vertical position with the head above the water surface. Three-dimensional kinematic data from underwater video analysis were used to calculate the attack angle according to Lauder et al. (2001). Three cycles of sculling motion performed by the right hand were analysed. The time of each cycle of sculling motion was normalised and the average cycle of the three cycles was calculated for each participant. The average cycle was divided into four phases: in-sweep, transition phase from in-sweep to out-sweep, out-sweep and transition phase from out-sweep to in-sweep (Arellano et al., 2006).
Results Most participants presented an attack angle with three characteristic peaks: the first and the third corresponded to the higher values, which occurred during the in-sweep and out-sweep, respectively, and the second peak corresponded to the lower values, which occurred between the other peaks and around the transition phase from in-sweep to out-sweep. Moreover, during the transition phase from in-sweep to out-sweep, most participants presented a negative attack angle, which indicates the hand rotated prior to changing direction.
Conclusions The attack angle varied from -40° to 69° during the sculling motion, which indicates that the angle follows the technical recommendation partially, albeit variability could be seen in the attack angle behaviour between the participants.
References Arellano, R., Terrés-Nicoli, J. & Redondo, J. (2006). Fundamental Hydrodynamics of Swimming Propulsion. Portuguese Journal of
Sports Sciences, 6 (suppl. 2), 15–20.
Lauder, M.A., Dabnichki, P. & Bartlett, R.M. (2001). Improved accuracy and reliability of sweepback angle, pitch angle and hand velocity calculations in swimming. Journal of Biomechanics, 34, 31–39.
Sanders, R. (1999). Hydrodynamic Characteristics of a Swimmer’s Hand. Journal of Applied Biomechanics, 15, 3–27.
BMS2014—ABSTRACTS HANDBOOK 157

Presenter Lara Elena Gomes is PhD candidate at Federal University of Rio Grande do Sul and has worked at Federal University of Vale do Sao Francisco in Brazil.
POSTER 29 Dry-land strength power, stroke mechanics and performance in master swimmers Mario Espada1,2, Teresa Figueiredo1, Irina Lauper1, Aldo M Costa3,4, Mario Marques3,4, Tiago M Barbosa5,4, Antonio J Silva6,4, Ana Pereira1,4 1Polytechnic Institute of Setubal, Portugal, 2Interdisciplinary Centre for the Study of Human Performance, Lisbon, Portugal, 3University og Beira Interior, Covilha, Portugal, 4Research Centre for Sport, Health and Human Development, Vila Real, Portugal, 5Institute of Nanyang Technological University, Singapore, 6University of Tras-os-Montes and Alto Douro, Vila Real, Portugal
Introduction The relationship between stoke mechanics and performance is one of the major points of interests in swimming biomechanics (Barbosa et al., 2010). Ageing is characterised by a progressive decline in strength and muscular function, which might affect performance. The aim of this research was to assess the relationship between dry-land strength power with swimming performance in master swimmers and observe the relationship between stoke mechanics and performance in three swimming distances, 15, 25 and 50 m (T15, T25 and T50, respectively), in master swimmers.
Methods Twenty-four male master swimmers participated in this study (42.0±7.5 years old, 1.74±0.10 m, 74.8±14.1 kg; training experience ≥ 10 years). Stroke rate (SR) was determined as the number of cycles per minute (registered by the mean number of strokes in each 25 m), stroke length (SL) was calculated by dividing velocity by SR, and the product of SL to the velocity allowed the assessment of stroke index (SI). Countermovement jump (CMJ) and 3 kg medicine ball throwing (MBT) were selected as dry-land strength power variables.
Results The swimming velocity associated to T50 (1.39.0±0.23 m.s-1) was significantly lower to T25 and T15 (1.64±0.38 and 2.30±0.49 m.s-1, respectively). Contrarily, t-test revealed that SL was not significantly different between T25 and T50 which indicates that swimmers tend to counteract the emergence of fatigue with SR. SI, which can be used as overall swimming efficiency estimation (Barbosa et al., 2010), was significantly correlated to all three swimming distances performance (p < 0.01) which in turn, were also significantly correlated to CMJ and MBT (27.2±5.0 and 4.3±1.0 m).
Conclusions Our results raise the pertinence of dry-land strength power training in master swimmers. Furthermore, also lead to the assumption of stroke parameters consideration in master swimmers day-to-day swim training. A combined strength power and swimming training program seems to promote enhancement in performance at master level in short swimming distances.
References 1 Barbosa, T.M., Bragada, J.A., Reis, V.M., Marinho, D.A., Carvalho, C., Silva, A.J. (2010). J Sci Med Sport; 13(2): 262–269.
Presenter Antonio J Silva is a professor at the University of Tras-os-Montes and Alto Douro, Vice Rector for Science, Technology and Innovation. He is president of the Portuguese Federation of Swimming. He is a prominent scientific investigator at national and international conferences with publications with high impact in the scientific community.
158 BMS2014—ABSTRACTS HANDBOOK

POSTER 30 Anaerobic critical velocity of master swimmers Mario Espada1,2, Teresa Figueiredo1, Catarina Dias1, Catarina Lopes1, Tiago M Barbosa3,4, Antonio J Silva5,4, Ana Pereira1,4 1Polytechnic Institute of Setubal, Portugal, 2Interdisciplinary Centre for the Study of Human Performance, Lisbon, Portugal, 3Institute of Nanyang Technological University, Singapore, 4Research Centre for Sport, Health and Human Development, Vila Real, Portugal, 5University of Tras-os-Montes and Alto Douro
Introduction Anaerobic capacity estimation might be useful, as it is affordable, less-time consuming and non-invasive way to prescribe training sets. Marinho et al. (2011) found a linear relationship between anaerobic critical velocity (AnCV) and 50 m swimming performance (S50) in young swimmers, suggesting that AnCV could be a relevant parameter to monitor and prescribe anaerobic training sets. The purpose of this study was to analyse the relationship between AnCV and swimming performance in master swimmers. Also, ascertain if AnCV may be determined based in two or three swimming distances, 15, 25 and 50 m (T15, T25 and T50, respectively).
Methods Twenty-four male master swimmers participated in this study (42.0±7.5 years old, 1.74±0.10 m, 74.8±14.1 kg; training experience ≥ 10 years). For each swimmer, the personal best at the short course 50 m front crawl (S50) and 15, 25 and 50 m front crawl sprint with in push-off start were collected with a stopwatch by two expert evaluators. AnCV was determined as the slope of the distance-time trend line. The Pearson´s correlation coefficient was used for correlations, significance was set at p < 0.05.
Results The swimming velocity associated to T50 (1.39.0±0.23 m.s-1) was significantly faster (respectively, t = 9.5, 13.0; p > 0.01) than AnCV25,50 and AnCV15,25,50 (1.31.0±0.23 m.s-1 and 1.29.0±0.22 m.s-1, respectively). T-Test revealed that AnCV25,50 and AnCV15,25,50 were not significantly different (p > 0.01) and Bland-Altman plot bias and limits of agreement between AnCV25,50 and AnCV15,25,50 evidenced that the random scatter of points between the upper and lower confidence limits is indicative of a good fit. Linear regression of T50 on AnCV25,50 revealed that the latter can be predicted with reasonable accuracy from the 25/50 m swim trials, both were strongly associated (r2 = 0.97; SEE = 0.04).
Conclusions The present study evidenced that AnCV may be used in master training and can be determined using two swimming distances (25 and 50 m) to application in day-to-day training basis.
References 1 Marinho, D.A., Amorim, R.A., Costa, A.M., Marques, M.C., Pérez-Turpin, J.A., Neiva, H.P. (2011). Journal of Human Sport &
Exercise; 6(1): 80–86.
Presenter Antonio J Silva is a professor at the University of Tras-os-Montes and Alto Douro, Vice Rector for Science, Technology and Innovation. He is president of the Portuguese Federation of Swimming. He is a prominent scientific investigator at national and international conferences with publications with high impact in the scientific community.
POSTER 31 Relationship between kick start performance and leg muscle strength in competitive swimming Hiroshi Suito1, Kazumasa Ozeki2, Yasuo Ikegami3 1Aichi Gakuin University, 2Osaka University of Health and Sport Science, 3Aichi Shukutoku University
Introduction The short distance in competitive swimming is important for the start phase. Recently, the start in the competitive swimming was using new start block. The start using the new start block (kick start) was reported significant improves horizontal velocity at take-off (Honda, et. al., 2010). It had been reported that the start motion using the new start block, but effects of legs muscle strength on kick start performance is unknown. Therefore, the purpose of this study was to clarify the relationships between the kick start performance and legs muscle strength in competitive swimmers.
BMS2014—ABSTRACTS HANDBOOK 159

Method Subjects were 11 male Japanese competitive swimmers (Age = 20.2 ± 0.8 years, Height = 176.1 ± 6.0 cm, Weight = 68.3 ± 6.4 kg). The start motions of 11 male competitive swimmers were captured two-dimensionally at 120 Hz from the start signal until the entry in the water. The velocity of centre of mass was computed during the start motion. The maximal voluntary isometric knee extension moments of front and rear legs were determined by using an isokinetic dynamometer.
Results A significant correlation coefficient (r = 0627, p < 0.05) was observed between the horizontal velocity at take-off and the maximal moment of front leg, whereas there was no significant correlation (Figure 1). The result of this study suggested a possibility some trainings for muscle strength of the front leg would improve the resultant start performance.
Figure1 Relationship the horizontal velocity at take off and the legs muscle strength (a: front leg, b: rear leg)
Conclusions This study suggested a possibility some trainings for muscle strength of the front leg would improve the resultant start performance.
References Honda, K,E., Sinclair, P. J., Mason, B.R., Pease, D.L. (2010), A biomechanical comparison of elite swimmers start performance
using the traditional track start and the new kick start. Proceedings of biomechanics and medicine in swimming XI: 94–96.
Presenter Dr Hiroshi Suito works at the Aichi Gakuin University in the Faculty of Psychological and Physical Science.
POSTER 32 The evaluation of efficiency in the various leg-kicking techniques in scuba diving Marek Rejman1, Piotr Siermonstowski2 1University School of Physical Education, Wroclaw, Poland, 2Military Insitute of Health, Gdyn
Introduction The aim of this study was to analyse the various techniques of the underwater leg-kicking in terms of their efficiency, defined as an effective and economical use of their surfaces to achieve maximal speed [1, 2]. We hypothesised that identification of the factors determining the efficiency of various leg-kicking provides basis for choosing the optimal techniques adequate to the utilitarian aims undertaken by scuba divers.
Methods Eight skilled scuba divers were filmed when they performed dolphin-, freestyle- and breaststroke-kick, while swimming 25m distance with fins, with the maximal speed, using a standard scuba diving equipment or without it. Videos were analysed using the SIMI software. Average intracycle swimming velocity (a measure of effectiveness), stroke length and stroke rate were calculated. The Stoke Index was estimated too. This factor, according to its
160 BMS2014—ABSTRACTS HANDBOOK
definitions [3] was taken as a measure of economising of propulsion generation. Due to the criterion of the drag minimising by avoiding the changes in velocity, the Index of Stability of Intracycle Velocity, was defined (as the quotient of the sum of the absolute values of the areas estimated under the curve of distribution of instantaneous swimming velocity in time function and the area bordered by the cycle time and the extreme values of this function) and taken as a measure of economising propulsion utilisation. Results of a two-factor analysis of variance (ANOVA) (predicated average marginal), verified by Duncan post hoc test, were standardised.
Results Dolphin-kicking performed with and without diving equipment was the most efficient and it was the nearest to the realisation of the postulate of technique optimisation. The same holds for the crawl-kicking performed with the equipment. The results did not depreciating breaststroke-kicking done with the equipment. The diagnostic value of Index of Stability of Intracycle Velocity for economisation of swimming techniques was confirmed.
Conclusions The reduction of fluctuation in intracycle velocity and technical skills to adjust stroke rate in order to make the stroke longer seem to be the factors determining the efficiency of the leg-kicking techniques analysed. The mentioned skills are applied by reducing the stroke rate while performing dolphin- and breaststroke-kicking without the equipment, by increasing it when crawl-kicking and by increasing it while diving with the equipment for all the techniques.
References 1 Rejman M. and Ochmann B. (2009). Modelling of monofin swimming technique: optimization of feet displacement and fin
strain. J. App Biomech, 25, 340–350.
2 Zamparo P. et al. (2002). How fins affect the economy and efficiency of human swimming. J. Exp. Biol, 205: 2665–2676.
3 Costill D.L. et al. (1985), Energy expenditure during front crawl swimming: predicting success in middle-distance events. Int. J. Sports Med, 6 (5), 266–270.
Presenter Marek Rejman is an associate professor at the University School of Physical Education in Wroclaw, Poland. He has been involved with swimming for the past 25 years. His research interests are in biomechanics, as applied to the areas of competitive swimming, lifesaving, and swimming teaching. For the past 20 year she has focused on the efficient and economical use of the Monofin as a source of propulsion, and is engaged in bridging the gap between coaching and science in developing this focus to assist the Polish Monofin Swimming Team, organising the symposia ‘Science and Swimming’ since 2002 year and co-editing the booklet series ‘Science in Swimming’. He has been published in a number of international journals and he is the author of several conference contributions related with biomechanics of monofin swimming. His research was recognised at the 10th International Symposium for Biomechanics and Medicine in Swimming, Porto 2006, where his research was awarded the prize for the Best Poster Presentation at the conference.
POSTER 33 The evolution of 100m freestyle finals at major championships from 2005 to 2013 Clare Jones1 1Queensland Academy of Sport
Aim To compare the male and female race profiles of the 100m Freestyle finalists at the two most recent Olympic Games and five World Championships events.
Methods Male and female finalists in the 100m freestyle at major international championships from 2005 to 2013 were analysed with race analysis software. Parameters determined included: 50m lap splits, 25m splits, start time (ST): gun to head at 15m, turn in time (TI): head at 45m to feet on wall, turn out time (TO): feet on wall to head at 60m, Turn (T): TI+TO and finish time (FT):head at 95m to touch on wall. Free swimming time (FST) was calculated by subtracting the total skills time (TST) from the overall time (OT), TST= ST+T+FT. The percentage contribution (%C) of each component to the OT and the mean value for each component was calculated for both males and females.
BMS2014—ABSTRACTS HANDBOOK 161

Results Men averaged 47.6% of OT for the first lap compared to women at 48.1% (p<0.001) and 52.4% for the second lap, whereas women averaged 51.9%. There were significant differences between men and women in the first and last 25m segments (p< 0.001). The %C for FST and TST (men: 68.7% and 31.3%, women: 68.3% and 31.7% respectively) was also significantly different (p< 0.001).
Female finalists from 2013 were faster than from 2005 (OT diff. = 1.27s p<0.001). The 2nd (diff. = 0.89s, p<0.001), 3rd (diff. = 0.28s, p<0.05) and 4th (diff. = 0.58s, p<0.05) 25m segments were faster as was the T (diff. = 0.29s p<0.05) and FT (diff. = 0.15s p<0.001). Male finalists from 2013 were 0.67s (p<0.05) faster in OT than from 2005. Most of this occurred in the first 50m lap: 0.51s (p<0.05) and the third 25m segment: 0.26s (p<0.05). The male’s TST in 2013 was significantly faster by 0.33s (p<0.05), primarily due to the T being faster (0.19s; p<0.05).
Conclusion Men and women race the 100m freestyle differently, with variations in the relative segment contribution. The improvements in OT over the last eight years have come from different areas of the race profile for males and females.
Presenter Clare Jones has been working with elite swimmers for over 10 years. She started her career in the Biomechanics department at the Australian Institute of Sport and now works with the Queensland Academy of Sport as their lead Swimming Biomechanist. She also works with the Australian Swim Team and was the Performance Analyst for the team at the recent World Championships in Barcelona.
POSTER 34 Analysis of impact forces during jump exercises in land and aquatic environments in physically active post menopause ladies Filipa Sousa1,2, Leandro Machado1,2, João Paulo Vilas-Boas1,2 1Centre of Research, Education, Innovation and Intervention in Sport (CIFI2D), 2Porto Biomechanics Laboratory (LABIOMEP), University of Porto, Portugal, Porto
Introduction Physical exercise is advised as a preventive and therapeutic strategy against ageing-induce weakness (Marques, Mota et al. 2011). Triplett, Colado and co-workers (2009), suggested several benefits for aquatic jump exercises offering a viable alternative to traditional dry land jump exercises. The large increment in the number of activities of physical conditioning in aquatic environment and in the number of participants, hints the numerous beneficial physical properties that water can provide. The aim of this study was to compare the vertical component of the Ground Reaction Forces (GRF) during the performance of squat jump exercises in dry land and aquatic environment in physically active post-menopause ladies.
Method Thirteen physically active post-menopause ladies (61,8±5,3 years old, 26,7±4,7 kg/m2 of body mass index) participated voluntarily in this study. Before testing, subjects were familiarised with experimental procedures and freely provided written informed consent. In a random order, subjects performed three attempts of one foot and two feet squat jump exercises in dry land and in water over an extensometric subaquatic force platform, that was used to quantify the kinetic data and analyse the impact forces in both environments during squat jump exercises. A Wilcoxon test for paired samples was applied to establish differences between jumps and conditions.
Results The analysis of the results showed that the average peak force of the push-off and landing phases of both jumps was significantly lower in the water compared to dry land jumps (p<0.05). The concentric rate of force developed in the water was significantly lower than in the dry land in the both one foot and two feet conditions. In the landing phase the average impact force was significant lower in water than in dry land for both kinds of jumps. The total average time for both jumps was significantly higher in water than in dry land.
Conclusions The results suggest that water provides an excellent environment for postmenopausal ladies carrying out jumps, as the variables related with exercise intensity are intensified, while variables related with impacts over the musculoskeletal system are smoothed and less harmful.
162 BMS2014—ABSTRACTS HANDBOOK

References Marques, E. A., J. Mota, et al. (2011). ‘Multicomponent training program with weight-bearing exercises elicits favorable bone
density, muscle strength, and balance adaptations in older women.’ Calcified Tissue International 88(2): 117–129.
Triplett, N. T., J. C. Colado, et al. (2009). ‘Concentric and impact forces of single-leg jumps in an aquatic environment versus on land.’ Medicine and Science in Sports and Exercise 41(9): 1790–1796.
Presenter Professor João Paulo Vilas-Boas is a Full Professor at the Faculty of Sport, University of Porto, a member of the Steering Group Biomechanics and Medicine in Swimming of the World Commission of Science in Sport, and a member of the board of the Portuguese Olympic Committee, a former Olympic Swimming Coach and he is the director of the Porto Biomechanics Laboratory, University of Porto, Porto, Portugal.
POSTER 35 Muscle activation during swimming exergame Pooya Soltani1, Pedro Figueiredo1, Ricardo J Fernandes1, Pedro Fonseca1, João Paulo Vilas-Boas1 1Porto Biomechanics Laboratory (LABIOMEP), Faculty of Sport, University of Porto
Swimming exergame may provide low-cost opportunities for teaching and practicing real swimming. Evaluation of muscles involved can allow understanding how much activity induced by computer games approaching real sports. The purpose of this study is to characterise the muscle activation during swimming exergame.
Ten healthy subjects played ‘Michael Phelps: Push the Limit’ swimming exergame by standing in front of Xbox360 and Kinec. Muscle activation for Biceps Brachii (Bi), Triceps Brachii (Tri), Latissimus Dorsi (LD), Upper Trapezius (UT) and Erector Spinae (ES) was recorded on dominant upper limb using a wireless EMG system (Delsys Inc, USA) at sample rate of 2000 Hz and was normalised to the maximal voluntary isometric contraction (MVIC). Electrodes’ placements were in accordance to SENIAM (Freriks et al. 1999). Three MVIC attempts were obtained using Biodex 4 (Biodex Inc, Shirley, NY). EMG data processing was performed using EMGWorks Analysis 4.0 (Delsys Inc, USA) including signal filtering between 20–450 Hz, full-wave rectification and root mean square envelope using a 150 ms window. This process was performed for both MVIC and trials. EMG recordings were divided into a normal swimming and a second phase of fast swimming. Both phases were presented in terms of EMG morphology (average peak value).
Mean±SD relative (%MVIC) EMG values for the studied muscles are presented in the table below.
Bi Tri LD UT ES
Backstroke Normal 4.9±2.4 17.0±16.2 15.4±10.4 47.0±15.5 6.8±4.1
Fast 8.2±5.0 23.7±22.1 21.7±18.1 69.3±18.6 13.4±7.3
Breaststroke Normal 10.0±5.5 19.0±18.2 11.1±6.7 29.0±19.3 5.0±2.6
Fast 18.3±7.2 28.8±31.7 20.6±12.4 46.1±40.8 8.1±4.5
Butterfly Normal 5.6±2.0 23.4±21.3 24.4±32.7 43.8±19.0 5.5±2.4
Fast 9.7±3.9 33.1±26.2 50.8±66.8 65.4±34.4 15.8±10.2
Crawl Normal 8.2±3.1 16.2±15.6 11.8±7.6 39.7±22.5 7.1±4.1
Fast 15.2±4.8 23.0±24.6 22.9±14.9 63.7±31.5 18.1±13.0
Preliminary results show high contributions of UT due to holding the upper limbs in front (shoulder flexed). Particularly high activation values were obtained for back crawl, where more expressive shoulder flexion is required. Lower contributions of other muscles are related to lack of sufficient mechanical resistance. Prevalence of the activity of the Tri relatively to the Bi was observed as expected considering the final acceleration of the lower arm in all swimming techniques. Due to great activity of UT, proper warm up and the use of strategies to transfer the muscle activity is advisable. More results of this ongoing project will be available in the future.
References Freriks, B., Merletti, R., Stegeman, D., Blok, J., Rau, G., Disselhorst-Klug, C. & Hägg, G. (1999). European recommendations for
surface electromyography (pp. 1–122). H. J. Hermens (Ed.). The Netherlands: Roessingh Research and Development.
Presenter Professor João Paulo Vilas-Boas is a Full Professor at the Faculty of Sport, University of Porto, a member of the Steering Group Biomechanics and Medicine in Swimming of the World Commission of Science in Sport, and a
BMS2014—ABSTRACTS HANDBOOK 163

member of the board of the Portuguese Olympic Committee, a former Olympic Swimming Coach and he is the director of the Porto Biomechanics Laboratory, University of Porto, Porto, Portugal.
POSTER 36 Automatic 3D underwater motion capture is highly accurate Per-Ludvik Kjendlie1, David Haakonsen1, Bjørn Harald Olstad1 1Norwegian School of Sport Sciences
Introduction The aim of this study was to investigate the accuracy of a new automatic tracking underwater motion capture system.
Methods A Qualisys motion capture system (Qualisys, Göteborg, Sweden) adapted for underwater use recorded a wand with two spherical markers with an internal distance of 749mm. Six specialised underwater cameras recorded the markers moving in a 3D space of 2.5x1.5x10m for 300s (100Hz). Six underwater trials were compared to 6 trials in a similar setup on land with one technician and another 6 trials on land with a second technician.
Results The average of the 6 cameras residual from the real vs. the recorded wand marker distance was 2.00±0.21 mm for the 6 water tests and 1.64±0.28mm and 1.87±0.24mm for the two land tests with technician #1 and #2 respectively. There was no statistical difference between the technicians for the two land bouts of testing, but the underwater testing showed significantly larger residuals compared to dry land testing (p<0.01).
Conclusions Although the underwater calibration showed significantly larger errors compared to on land testing, the difference of 0.36mm is of no clinical or practical relevance. It can be the effect of wobbling markers during underwater calibration. An accuracy of 2mm for an under water automatic tracking motion capture system is believed to be excellent.
Presenter Bjørn Harald Olstad is an assistant professor at the Norwegian School of Sport Sciences in Oslo. He is currently working towards his PhD: Muscle activation and kinematics in contemporary breaststroke swimming, containing surface electromyographic measurements and three dimensional motion in swimming. He holds a master’s degree on how to coach age-group swimmers for future success and was a former National team member in swimming and lifesaving. He previously worked for the United States Olympic Committee, United States Swimming and with several swim clubs as performance director and coach.
POSTER 37 Centre of mass location in swimming starts Andrew Dragunas1, Ryan Atkison1,2, James Dickey1 1The University of Western Ontario, School of Kinesiology, 2Canadian Sport Institute Ontario
Introduction Swimming start techniques are changing to maximise performance from the new Omega®
OSB11 wedged platform. Research on previous starting platforms has shown that a front-weighted stance has a shorter block time (BT) and slower takeoff velocity (TOV) when compared to a rear-weighted stance1,2; however, we do not know how stance-weighting affects start performance on the new platform. Therefore, the aim of this study was to examine the effect of centre of pressure (CP) location in the starting position on swim start performance (BT, TOV, Time-to-Two metres (TT2)) using the wedged-starting platform.
Methods Eleven adult swimmers (8 men and 3 women; 21.7±2.5 years), ranging from national to international finalists volunteered to participate in this study. A tri-axial force plate, sampling at 1kHz, was secured to the base of a replica Omega® OSB11 starting platform3. On the start platform, a light strip consisting of eight different-coloured LED lights spaced at 0.03m intervals provided low-resolution instantaneous anterior-posterior CP location feedback to the swimmer. Each swimmer performed 24 maximal effort starts, three at each of the eight CP positions, in randomised
164 BMS2014—ABSTRACTS HANDBOOK

order. Each swimmer performed all of their dives with the kick plate in their preferred position. All data were collected using a customised LabVIEW program and were low-pass filtered at 25Hz using a second-order Butterworth filter. For each swimmer, the position with the lowest average TT2 between the three trials was considered the optimal start stance. For each swimmer, the average values of BT, TOV, and TT2 were normalised as the per cent difference from fastest CP position, and Pearson correlations with CP position were obtained for all normalised variables. Correlations were considered to be statistically significant at p<0.05.
Results Normalised TOV correlated significantly with CP position (r=0.720, p<0.05). Optimal position of the CP ranged from the first to sixth position, corresponding to 0.012m to 0.175m from the front of the block respectively. Four swimmers were fastest to two metres from the fourth position, three from the first position, two from the sixth position, one from the fifth position and one from the third position.
Conclusions Similarly to research on previous block models, faster TOV was significantly related to a rear-weighted stance; however, shorter BT was not significantly related to a front-weighted stance. Large differences in optimal CP location between swimmers, evidenced by TT2, indicate that optimal fore-aft lean is dependent on individual swimmer characteristics.
References 1 Breed, R. V. P. & McElroy, G. K. (2000). A biomechanical comparison of the grab, swing and track starts in swimming. Journal
of Human Movement Studies, 39, 277–294.
2 Welcher, R. L., Hinrichs, R. N. & George, T. R. (2008). Front- or rear-weighted track start or grab start: which is the best for female swimmers? Sports Biomechanics, 7, 100–113.
3 Pearson, C. T., McElroy, G. K., Blitvich, J. D., Subic, A., Blanksby, B. A. (1998). A comparison of the swimming start using traditional and modified starting blocks. Journal of Human Movement Studies, 34, 49–66.
Presenter Ryan Atkison is an applied sports biomechanist with the Canadian Sport Institute. Ryan completed both his BSc (2008) and MSc (2010) in Kinesiology at the University of Western Ontario, specialising in sport biomechanics. He is also a Certified Strength and Conditioning Specialist with the National Strength and Conditioning Association. Ryan has more than 20 years of experience in the sport of swimming, as an athlete, coach and applied sport scientist. Currently, Ryan provides biomechanics and performance analysis support for swimming based out of the Toronto National Training Centre. In addition, Ryan is an active contributor to regional and national research and innovation programs aiming to bring world-class biomechanics and performance analysis support to Ontario’s high performance sporting community.
POSTER 38 Real-time measuring system of the distance between the centre of buoyancy and the centre of gravity for swimmers Yasunori Watanabe1, Kohji Wakayoshi1, Takahisa Shiraki1 1Biwako Seikei Sport College
Introduction Swimming is an exercise that is performed in a horizontal posture within the water. Generally, in a horizontal posture there is a ‘gap’ between the center of buoyancy (CB) and the center of mass (CM), considering the CB is at the head side and the CM is found at the leg side (Hay, 1993).
Wherein, with this research we set our goal to construct a real-time measuring system for the distance between the CB and the CM, measuring the vertical direction of force on the hands and legs corresponding to the changes in the ventilation volume, where the swimmer is in a horizontal posture in the water and is breathing freely with a snorkel.
Method Trained swimmers and non-swimmers volunteered for this study. Out of the water, we can set the CG position using the formula y = F • x/W where x is the length between the leg area and the hand area and y is the length between the leg area and the CM position, body weight (W) and (F) being the force exerted on the hand area.
In order to measure the buoyancy and the CB position, we measured the force exerted in a vertical direction on the hand area (F1) and leg area (F2) by attached force sensors. Additionally, we measured the ventilation volume by
BMS2014—ABSTRACTS HANDBOOK 165

attaching a tube to the tip of the snorkel and by using a lung volume measurement system consisting of respiratory sensors.
Results and conclusions The relationship between the ventilation volume and both F1 and F2, and the distance between the CB and the CM indicated extremely good linearity, respectively. Moreover, the distance between the CB and the CM in the neutral buoyancy of the swimmers was significantly shorter than that of non-swimmers. Therefore, it is thought that this measuring system can be utilised as an effective method for evaluating swimming performance.
Reference Hay, J.G. (1993). The Biomechanics of Sports Techniques. Englewood Ciffs, NJ: Prentice-Hall.
Presenter Yasunori Watanabe works at Biwako Seikei Sport College. He has been researching aqua exercise as well as coaching the collegiate water polo team.
POSTER 39 Comparison of race profiles in the 100m freestyle individual and relay events Nicholas Smith1 1Swimming Queensland
Introduction In relay swims (excluding the first leg), swimmers are able to use a ‘fly start’. Instead of waiting for a signal from the starter they must leave the block after the incoming swimmer touches the wall, enabling them to anticipate the time they leave the block. This study will compare the race profiles for swimmers who competed in the 100m freestyle individual and relay finals at two major championships.
Methods Male and female swimmers who competed in the finals of the 100m freestyle and either 4x100m freestyle or medley relays at the 2011 World Championships and 2012 Olympic Games were analysed using race analysis software. Thirty-two swims were analysed (16 individual, 16 ‘fly start’ relay; 8 male, 8 female) for comparison of race parameters, including: block time (BT): gun to feet leaving block, start time (ST): gun to head at 15m, turn time (T): head at 45m to head at 60m, finish time (FT): head at 95m to touch on wall, split times for 25m, 50m and 75m and overall time (OT). The percentage contribution (%C) of each time variable to the OT and the mean value for each component was calculated for both males and females.
Results All subjects had a faster BT (p<0.001) in relay swims. There were significant differences in ST for all subjects between race types (p<0.001). Statistical analysis showed that relay swims had a faster 25m split (p<0.001), 50m split (p<0.05) and 75m split (p<0.05). OT was also faster for relay swims (males diff. = 0.73s, p<0001, females diff. = 0.63s, p<0.05). There was no significant difference in T, FT or 2nd 50m split values between relay and individual swims. The difference between the %C of BT (males 1.03%, females 0.95%) and ST (males 0.78%, females 0.70%) was statistically significant (p<0.001).
Conclusion Both males and females gain an advantage from a fly start in a relay. The significant reduction in BT and ST and other parameters contribute to a faster OT.
Presenter Nicholas Smith is a sport scientist working for Swimming Queensland. He graduated from the University of Queensland in 2010 with a Bachelor of Applied Science (Human Movement Studies) with practical experience in exercise physiology and sport science. He began working in swimming in 2009, providing biomechanical filming and support in training. In 2011, Nick completed his Honours degree in Skill Acquisition, analysing the approach phase of the freestyle tumble turn. In 2012, Nick began a postgraduate scholar position at the Australian Institute of Sport, working in the Aquatic Testing, Training and Research Unit. This position involved detailed biomechanical analysis of swimming skills and technique and providing race analysis at competitions. In September 2012, Nick began working at Swimming Queensland as the Coaching-Science Development Officer. The primary aim of his position is to develop the understanding, skills and knowledge of Queensland coaches. Nick was also selected as the performance
166 BMS2014—ABSTRACTS HANDBOOK

scientist for the Australian Swim Team competing at the 2013 World University Games. He works across multiple sport science disciplines and provides services at training camps, state, national and international competitions.
COMPUTATIONAL FLUID DYNAMICS
POSTER 40 CFD analysis of the drag coefficient during the gliding in swimming Daniel A Marinho1,2, Rui J Ramos1,2, Luisa Novais2,3, Vishveshwar Mantha2,3, Tiago M Barbosa2,4, Abel I Rouboa2,3, Antonio J Silva2,3 1University of Beira Interior, Portugal, 2Research Centre in Sports, Health and Human Development, Portugal, 3University of Tras-os-Montes and Alto Douro. Vila Real, Portugal, 4National Institute of Education, Nanyang Technological University, Singapore
Introduction The swimmer’s body position after immersion determines the success of the start rather than his/her starting body position in the block or during the fly (1). There are swimmers gliding in a lateral position whereas others prefer a prone one. Moreover, during this phase, swimmers may alter their body posture and, as far as some techniques are concerned, swimmers must change the position of the limbs (2). Therefore, the purpose of this study was to analyse the effects of body positions in drag coefficient during the glide in swimming using computational fluid dynamics.
Methods In order to create the three-dimensional digital model computer tomography scans of a human body of a male swimmer were applied (3). The swimmer was modelled as if he were gliding underwater in a streamlined position, at four different body positions: (i) in the prone position, (ii) in a side position with an absolute angle between the horizontal plane with the body coronal plane of 45º (45º of rotation), (iii) in a side position with an absolute angle between the horizontal plane with the body coronal plane of 90º (90º of rotation) and, (iv) in the dorsal position. The boundary conditions of the model were designed to represent the geometry and flow conditions of a part of a lane in a swimming pool. Steady-state computational fluid dynamics analyses were performed using the Fluent® code and the drag coefficient was computed for velocities of 1.5, 2.0 and 2.5 m.s-1 (4).
Results Drag coefficient reaches its lowest value in the prone position, followed by the side position with 45º of rotation (0.29%, 0.15%, 0.01% drag increment for 1.5, 2.0, and 2.5 m.s-1, respectively), the side position with 90º of rotation (1.03%, 0.94%, 0.64% increment), and the dorsal position (2.21%, 1.42%, 0.96% increment), in which the highest value of drag is obtained.
Conclusions Main data shows that the prone position presented the lowest drag coefficient values, whereas dorsal position presented the highest values during the underwater gliding. The prone position seems to be the one that should be adopted after the starts and turns phases of a competitive swimming event, especially during freestyle events and after pushing-off from the wall during the turn where swimmers can freely choose the best body position.
References 1 Vilas-Boas et al, Proceedings of XVIII ISBS, Hong Kong. 113–117, 2000.
2 Marinho et al, J Appl Biomech, 25(3):253–257, 2009.
3 Marinho et al, Braz Arch Biol Techn, 5(2):437–442, 2010.
4 Lyttle et al, Proceedings of BMS VIII, Jyvaskyla. 165–170, 1999.
Presenter Daniel A Marinho is a lecturer at University of Beira Interior (Portugal) and is a member of the Research Centre in Sports, Health and Human Development.
BMS2014—ABSTRACTS HANDBOOK 167
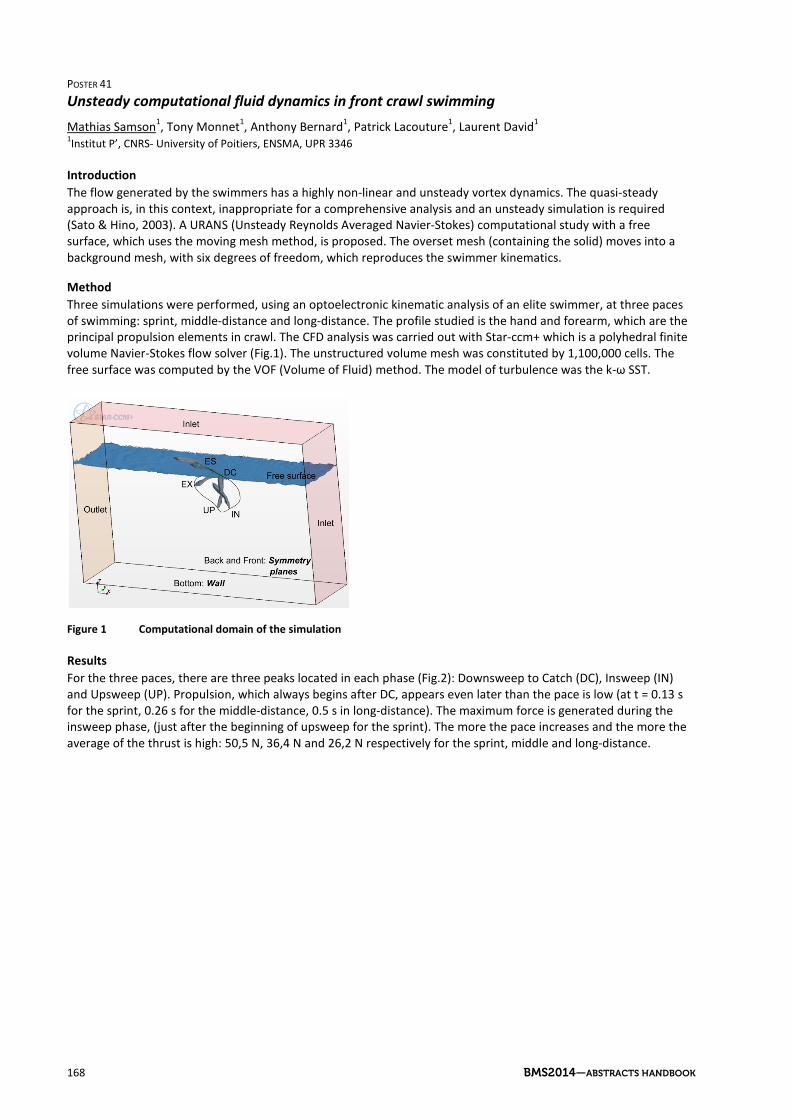
POSTER 41 Unsteady computational fluid dynamics in front crawl swimming Mathias Samson1, Tony Monnet1, Anthony Bernard1, Patrick Lacouture1, Laurent David1 1Institut P’, CNRS- University of Poitiers, ENSMA, UPR 3346
Introduction The flow generated by the swimmers has a highly non-linear and unsteady vortex dynamics. The quasi-steady approach is, in this context, inappropriate for a comprehensive analysis and an unsteady simulation is required (Sato & Hino, 2003). A URANS (Unsteady Reynolds Averaged Navier-Stokes) computational study with a free surface, which uses the moving mesh method, is proposed. The overset mesh (containing the solid) moves into a background mesh, with six degrees of freedom, which reproduces the swimmer kinematics.
Method Three simulations were performed, using an optoelectronic kinematic analysis of an elite swimmer, at three paces of swimming: sprint, middle-distance and long-distance. The profile studied is the hand and forearm, which are the principal propulsion elements in crawl. The CFD analysis was carried out with Star-ccm+ which is a polyhedral finite volume Navier-Stokes flow solver (Fig.1). The unstructured volume mesh was constituted by 1,100,000 cells. The free surface was computed by the VOF (Volume of Fluid) method. The model of turbulence was the k-ω SST.
Figure 1 Computational domain of the simulation
Results For the three paces, there are three peaks located in each phase (Fig.2): Downsweep to Catch (DC), Insweep (IN) and Upsweep (UP). Propulsion, which always begins after DC, appears even later than the pace is low (at t = 0.13 s for the sprint, 0.26 s for the middle-distance, 0.5 s in long-distance). The maximum force is generated during the insweep phase, (just after the beginning of upsweep for the sprint). The more the pace increases and the more the average of the thrust is high: 50,5 N, 36,4 N and 26,2 N respectively for the sprint, middle and long-distance.
168 BMS2014—ABSTRACTS HANDBOOK

Figure 2 Hydrodynamic thrust force acting on the hand-forearm at three paces.
Conclusions Unsteady Numerical simulation is crucial and allows the study of the turbulent flow induced by the three-dimensional path of the arm, which is at present very difficult to study experimentally. This allows to link the kinematics data and the generated forces and thus identify the most propulsive moments of the aquatic stroke.
References Sato, Y. & Hino, T. (2003). Estimation of Thrust of Swimmer’s Hand Using CFD. Second International Symposium on Aqua Bio-
Mechanisms, 71–75.
Presenter Mathias Samson’s research focuses on the flow generated by the strokes of the arms of swimmers in crawl at different paces. These studies, unsteady, are experimental and numerical.
MEDICINE
POSTER 42 Physical fitness and the metabolic syndrome of competitive swimmers with intellectual disability Ingiar Einarsson1, Jonas Martens2, Daniel Daly2, Sigurbjorn Arngramsson1 1University of Iceland, 2KU Leuven, Faculty of Kinesiology and rehabilitation sciences
Introduction It is well known that children and adolescents with intellectual disability (ID) are less physically active, are more likely to be overweight/obese, have lower levels of aerobic fitness (AF), and are more likely to develop metabolic syndrome (MetS) than their able-bodied peers (WID), although no obvious physiological reason for this difference can be observed.
Aim To examine weather swimming training among ID has the same effect on AF and MetS as has been shown for WID.
Method 25ID and 24 WID swimmers all of whom trained for swimming minimum 6 hrs/wk underwent a series of anthropometric measures and AF tests together with a comparison group from the general population of ID (n=51) and WID (n=53). Body fat was measured with DXA and VO2max with a graded bicycle ergometer test using Parvomedics Trumax 2400. Age- and gender-specific cut offs for blood pressure (DBP and SBP), waist circumference (WC), low-density lipoprotein cholesterol (LDL-C), and glucose were used to determine MetS.
Results The general ID population showed the poorest values in all categories of information collected. In both males and females the presence of factors leading to MetS was 2–5 times higher for persons ID than WID.
BMS2014—ABSTRACTS HANDBOOK 169
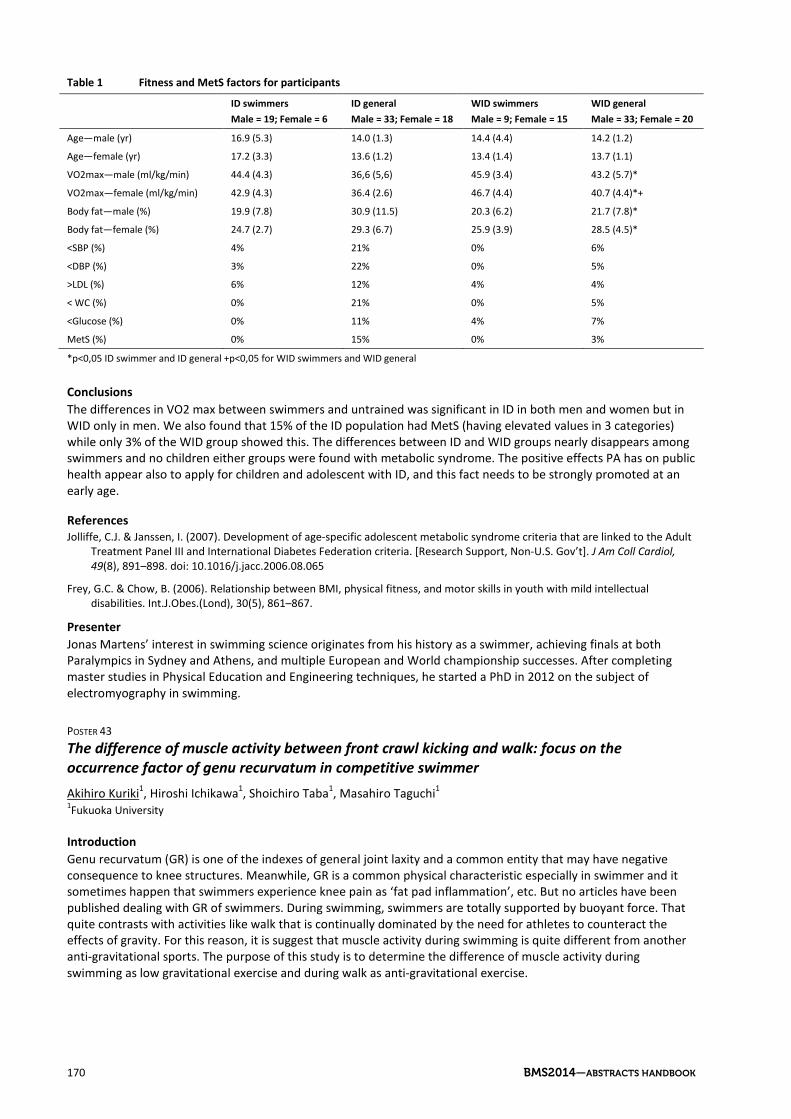
Table 1 Fitness and MetS factors for participants
ID swimmers Male = 19; Female = 6
ID general Male = 33; Female = 18
WID swimmers Male = 9; Female = 15
WID general Male = 33; Female = 20
Age—male (yr) 16.9 (5.3) 14.0 (1.3) 14.4 (4.4) 14.2 (1.2)
Age—female (yr) 17.2 (3.3) 13.6 (1.2) 13.4 (1.4) 13.7 (1.1)
VO2max—male (ml/kg/min) 44.4 (4.3) 36,6 (5,6) 45.9 (3.4) 43.2 (5.7)*
VO2max—female (ml/kg/min) 42.9 (4.3) 36.4 (2.6) 46.7 (4.4) 40.7 (4.4)*+
Body fat—male (%) 19.9 (7.8) 30.9 (11.5) 20.3 (6.2) 21.7 (7.8)*
Body fat—female (%) 24.7 (2.7) 29.3 (6.7) 25.9 (3.9) 28.5 (4.5)*
<SBP (%) 4% 21% 0% 6%
<DBP (%) 3% 22% 0% 5%
>LDL (%) 6% 12% 4% 4%
< WC (%) 0% 21% 0% 5%
<Glucose (%) 0% 11% 4% 7%
MetS (%) 0% 15% 0% 3%
*p<0,05 ID swimmer and ID general +p<0,05 for WID swimmers and WID general
Conclusions The differences in VO2 max between swimmers and untrained was significant in ID in both men and women but in WID only in men. We also found that 15% of the ID population had MetS (having elevated values in 3 categories) while only 3% of the WID group showed this. The differences between ID and WID groups nearly disappears among swimmers and no children either groups were found with metabolic syndrome. The positive effects PA has on public health appear also to apply for children and adolescent with ID, and this fact needs to be strongly promoted at an early age.
References Jolliffe, C.J. & Janssen, I. (2007). Development of age-specific adolescent metabolic syndrome criteria that are linked to the Adult
Treatment Panel III and International Diabetes Federation criteria. [Research Support, Non-U.S. Gov’t]. J Am Coll Cardiol, 49(8), 891–898. doi: 10.1016/j.jacc.2006.08.065
Frey, G.C. & Chow, B. (2006). Relationship between BMI, physical fitness, and motor skills in youth with mild intellectual disabilities. Int.J.Obes.(Lond), 30(5), 861–867.
Presenter Jonas Martens’ interest in swimming science originates from his history as a swimmer, achieving finals at both Paralympics in Sydney and Athens, and multiple European and World championship successes. After completing master studies in Physical Education and Engineering techniques, he started a PhD in 2012 on the subject of electromyography in swimming.
POSTER 43 The difference of muscle activity between front crawl kicking and walk: focus on the occurrence factor of genu recurvatum in competitive swimmer Akihiro Kuriki1, Hiroshi Ichikawa1, Shoichiro Taba1, Masahiro Taguchi1 1Fukuoka University
Introduction Genu recurvatum (GR) is one of the indexes of general joint laxity and a common entity that may have negative consequence to knee structures. Meanwhile, GR is a common physical characteristic especially in swimmer and it sometimes happen that swimmers experience knee pain as ‘fat pad inflammation’, etc. But no articles have been published dealing with GR of swimmers. During swimming, swimmers are totally supported by buoyant force. That quite contrasts with activities like walk that is continually dominated by the need for athletes to counteract the effects of gravity. For this reason, it is suggest that muscle activity during swimming is quite different from another anti-gravitational sports. The purpose of this study is to determine the difference of muscle activity during swimming as low gravitational exercise and during walk as anti-gravitational exercise.
170 BMS2014—ABSTRACTS HANDBOOK
Method Four well-trained collegiate swimmers participated in this experiment. Trials were 25 metres front crawl swimming and 15 metres walk on land. Knee range of motion and muscle activity was measured with underwater sensor and surface electromyogram (EMG) during trials respectively. Surface EMG electrodes were placed on the following muscles, Gluteus Maximus, Rectus Femoris, Vastus Medialis, Semitendinosus, Biceps Femoris and Gastrocnemius.
Results During both front crawl and walk, muscles activity of knee extensor and flexsor was confirmed to generate knee joint movement. But duration time of co-contraction of knee extensor and flexsor at terminal knee extension during front crawl kicking was much shorter than during walk.
Conclusions The co-contraction is important to increase joint stability so that knee joint stability at terminal knee extension during front crawl kicking is potentially lower than during walk. Because the articular surface of knee joint contributes little to the stability, the finding suggests that swimmers would face risk of damage to structures of the knee with kicking down at terminal extension. The characteristic muscle activities might be one of the occurrence factors of GR in swimmer. Prevention of injuries without deteriorating performance in swimming for them should be discussed.
Presenter Akihiro Kuriki is a physiotherapist with a master’s degree in Sports and Health Science. He has been the trainer of National Swim Team of Japan and has an interest in sports injury prevention.
POSTER 44 Lap swimming attenuates age-related declines in balance Whitney Ogle1 1Indiana University
The CDC recommends daily exercise as a means to reduce the risk of falls in the ageing population. Swimming is one of the most popular forms of exercise in most industrialised nations because it provides full body exercise with lower joint forces while, important to consider for exercise prescription for older individuals. Little research has reported the advantages of swimming as compared to other modes of exercise, such as running or resistance training, in regards to preventing falls. As relatively new variables (termed the rambling and trembling components of centre of pressure (COP)) have recently been described by Zatsiorsky & Duarte (1999, 2000), the purpose of this study was to investigate the relationship between swimming and the control of balance in the ageing population.
Men and women 55+ years old were recruited based on their current activity participation: Lap Swimmer (LS) or Sedentary (S). Sway during upright stance was measured on a Kistler force plate with 3x90 second trials with eyes open and eyes closed. Subjects performed a Timed-Up-And-Go (TUG) test to predict risk of falls. All data was analysed in MATLAB to determine mean sway velocity and the ‘rambling’ and ‘trembling’ components of centre of pressure (as described in Tahayori et al., 2012). T-tests were utilised to compare the groups (p<0.05).
Twenty-five subjects were recruited (mean age = 62.8 and 62.6 years for S and LS, respectively). No differences were found between groups in the rambling (X=0.065, Y=0.110) and trembling (X=0.548, Y=0.171) control of balance, nor in TUG (p=0.317). There was a significant difference in COP area (p=0.043), with lap swimmers swaying more.
These results indicate that lap swimmers and age-matched inactive adults have similar risks of falls, however, the control of balance may be attenuated by lap swimming. The significantly higher COP area found in lap swimmers matched with similar central and peripheral control of balance indicate that the lap swimmers were able to stand upright moving greater degrees of freedom without inducing greater control mechanisms of balance. Future research should delineate between swimming exercise intensity and balance parameters and should look at even older individuals.
References Tahayori, B., Riley, Z., Mahmoudian, A., Koceja, D. & Hong, S. (2012). Rambling and trembling in response to body loading. Motor
Control, 16, 144–157.
Zatsiorsky, V. & Duarte, M. (1999). Instant equilibrium point and its migration in standing tasks: rambling and trembling components of the stabilogram. Motor Control, 3, 28–38.
BMS2014—ABSTRACTS HANDBOOK 171

Zatsiorsky, V. & Duarte, M. (2000). Rambling and trembling in quiet stance. Motor Control, 4, 185–200.
Presenter Whitney Ogle earned her Doctorate in Physical Therapy in 2010 and has worked as a physical therapist for three years. She will receive her Masters degree at Indiana University in Exercise Physiology in Fall 2013 and plans to remain at Indiana for her PhD in Human Performance. Her interests include balance, pain, and a little bit of everything else.
PHYSIOTHERAPY
POSTER 46 Spatiotemporal characteristics of walking on land and in water: reliability of measurements and analysis of differences Cristina Cadenas1, Raul Arellano1, Gracia Lopez-Contreras1, Sonia Taladriz1 1Faculty of Sports Sciences, University of Granada, Spain
Introduction Gait is a major sign of independence, quality of life and participation1 and is frequently impaired by a variety of musculoskeletal and neurological conditions or diseases (for example, stroke, cerebral palsy, multiple sclerosis or osteoarthritis)2. To improve the locomotion system, exercises are mainly carried out on dry land although now numerous activities have been proposed in the water environment. Specifically, forward walking (FW) may be one of the most common motor tasks in both environments because it can be practiced by any age-group and with most medical conditions3,4. The purpose of this study was to compare the spatial and temporal characteristics in FW walking on land and in water using 3D kinematics.
Method Eight adults volunteered to participate in the study (age 22.1 ± 1.1 years, height 174.8 ± 7.1 cm, mass 63.37 ± 6.2 kg). The subjects were requested to cover in a randomised order a distance of 10 metres at comfortable speed (controlled by a digital metronome). To avoid the interference of the upper limbs, subjects walked forward with arms crossed at the chest. Reflective markers were placed on their lower limbs and digitalised later to obtain the data. The following variables were computed: speed, stride length, symmetry of step length and support phase duration. In order to assess the reliability of digitising, we calculated the intra-observer ICC ranged 0.97 to 0.99 and inter-observer ICC ranged from 0.98 to 0.99. The spatiotemporal characteristics of the two environments were compared using repeated measures ANOVA. The level of significance was set at p<0.05. This statistical analysis was made using SPSS software version 21.0.
Results On land, the speed was greater than in water (0.88 +- 0.07 vs 0.62+- 0.03 m/s) [p<0,001]. There were significant differences in stride length between environments. During FW walking the stride length was higher on land than in water (1.23 +- 0.12 vs 0.90 +-0.08 m) [p<0,001]. Regarding to the symmetry of step length, relevance differences were observed in environments. In water, subjects were 23% more asymmetry than on land. Overall, support time was smaller in water, with a decrease of 6,4%, compared to on land.
Conclusion The effect of the hydrodynamic resistance in water conditioned the stride length and therefore, the speed in water was lower than on land. Also, the buoyancy force determined that a less support phase duration. The hydrostatic pressure combined with the water drag could modify the symmetry of the step length in water. These changes should be considered to prescribe more accurately walking exercises in water.
References 1 Schmid A, Duncan PW, Studenski S, Lai SM, Richards L, Perera S, et al. Improvements in speed-based gait classifications are
meaningful. Stroke. 2007 Jul;38(7):2096–100.
2 Patterson KK, Nadkarni NK, Black SE, McIlroy WE. Gait symmetry and velocity differ in their relationship to age. Gait Posture. 2012 Apr;35(4):590–4.
3 Chevutschi A, Alberty M, Lensel G, Pardessus V, Thevenon A. Comparison of maximal and spontaneous speeds during walking on dry land and water. Gait Posture. 2009 Apr;29(3):403–7.
172 BMS2014—ABSTRACTS HANDBOOK

4 Barela AMF, Duarte M. Biomechanical characteristics of elderly individuals walking on land and in water. J Electromyogr Kinesiol. 2008 Jun;18(3):446–54.
Presenter Raul Arellano is a professor at the University of Granada, Spain. He is the chief of Biomechanics for the Spanish Olympic Swimming Team. His research interests are propulsion hydrodynamics, swimming competition analysis, swimming start biomechanics.
PHYSIOLOGY
POSTER 47 Prolonged expiration and restricted frequency breathing induces severe hypoxemia during submaximal intensity swimming Argyris Toubekis1, Ricardo Fernandes2, Nickos Beidaris1, Petros Botonis1, Maria Koskolou1 1Kapodistrian University of Athens, 2University of Porto
Introduction Reduced frequency breathing is commonly used during swimming training aiming to induce hypoxemia. However, in most of the cases this practice provokes hypercapnia rather than hypoxemia.1 Recently, prolonged expiration down to the residual volume induced moderate hypoxemia during interval swimming at intensity 95% of the 400-m maximal speed.2 The purpose of the study was to examine the effect of a restricted breathing pattern on blood oxygen saturation (SpO2) and lactate response during submaximal swimming.
Methods Ten male swimmers (age: 23.1±2.2 yrs; VO2max: 47.3±7.2 ml kg-1min-1) performed 75, 100, 175, 200, 275, 300, 375 and 400-m trials at intensity corresponding to 90% of the critical velocity. All trials were performed with freely-selected breathing (N) and with restricted breathing (RB). During RB trials, the swimmers applied prolonged expiration down to the residual volume before each breath for 75-m and freely selected breathing for the subsequent 25 m segment. SpO2 was recorded with pulse oximetry before the start and at the completion of each trial. Blood lactate concentration was determined at the start and after 200 and 400 m. Stroke rate was calculated at the last 25-m of each trial.
Results Swimming speed was similar between conditions (RB: 1.316±0.096 vs. N: 1.314±0.104 m s-1, p>0.05). SpO2 was decreased compared to starting values (99±1%) after 75, 175, 275 and 375 m (72±13; 77±11; 78±18; 75±12%, p<0.05) but not after 100, 200, 300 and 400 m in RB (89±13; 96±4; 95±6; 97±2%, p>0.05), while remained unchanged after all trials in the N condition (98±2%, p>0.05). Lactate concentration after 200 m was increased in RB but not in N compared to starting values and was higher in RB compared to N after 400 m (RB: 4.3±1.5 vs. N: 3.3±1.7 mmol l-1, p<0.05). Stroke rate was higher in RB compared to N condition (RB: 32±4; N: 30±4 cycles min-1, p<0.05).
Discussion Prolonged expiration down to the residual volume, applied before each inspiration, causes severe hypoxemia which is restored with self selected breathing during submaximal intensity swimming. The application of this respiratory manoeuvre during low intensity swimming may increase the activation of glycolysis and stimulate adaptive responses.
References 1 Dicker, S.G., Lofthus, G.K., Thornton, N.W., Brooks, G.A., 1980. Respiratory and heart rate responses to tethered controlled
frequency breathing swimming. Med Sci Sports Exerc, 12, 20–23.
2 Woorons, X., Gamelin, F.X., Lamberto, C., Pichon, A., Richalet, J.P., 2013. Swimmers can train in hypoxia at sea level through voluntary hypoventilation. Respir Physiol Neurobiol, In press, doi: 10.1016/j.resp.2013.08.022.
Presenter Professor Ricardo J Fernandes was a swimmer and coach at club, regional and national Portuguese teams. Had graduated in Sport Sciences at the Faculty of Sport, University of Porto and achieved master’s degree, also in sport sciences (specialised in high performance sports—swimming). In the same institution he conducted his Ph D on Sport Sciences regarding the characterisation of time to exhaustion at the swimming velocity corresponding to VO2max. Recently we presented his Habilitation on Sport Sciences. He develops research, manly, in the area of the
BMS2014—ABSTRACTS HANDBOOK 173

biophysical characterisation specially centred on the availability and use of energy in aquatic activities (e.g. swimming, rowing and surfing). He is also interested in planning and periodisation, and training control and evaluation of athletes in cyclic and team sports. He publishes papers on scientific journals in a regular basis, presenting an h index of 11.
POSTER 49 Are standard warm-up procedures beneficial for sprint races? Henrique P Neiva1,2, Mario C Marques1,2, Tiago M Barbosa2,3, Daniel A Marinho1,2 1University of Beira Interior, Portugal, 2Research Centre in Sports, Health and Human Development, Portugal, 3National Institute of Education, Nanyang Technological University, Singapore
Introduction Researchers suggested that warm-up procedures may optimise athletic performance (Fradkin et al., 2010). The usual changes that are attributed to warm-up, its efficiency in swimmers performance is still not clear though (Neiva et al., 2011). The purpose of this study was to verify the effect of standard warm-up procedures on 50m freestyle swimming performance.
Methods Sixteen competitive swimmers (9 males and 7 females: Age 16.2 ± 1.2 and 16.0 ± 0.8 yrs; Stature 173.38 ± 5.24 and 161.23 ± 8.12 cm; Body mass 62.1 ± 4.1 and 56.5 ± 7.0 kg, respectively) performed two maximal 50m freestyle trials on separate days, with and without a warm-up beforehand, in a randomised order. The warm-up condition replicates the standard procedures. It includes a set of aerobic capacity, kick and drills exercises and a set at the race-swimming pace, in a total of 1000m. Performance (50m free race time), physiological (capillary blood lactate concentrations), psychophysiological (rate of perceived exertion) and biomechanical variables (stroke length, stroke frequency and stroke index) were assessed on both trials. Student’s paired t-tests were used to compare data obtained in the two trials.
Results There was no-significant differences in swimming performance at the 50m freestyle between warm-up and no warm-up conditions (30.96 ± 2.57s and 30.82 ± 2.39s, p=0.48; respectively). Even so, surprisingly, 43.75% of the swimmers performed their best times without warm-up. Likewise, biomechanical variables showed no-significant differences with or without warm-up: stroke rate (0.86 ± 0.09 and 0.86 ± 0.08 Hz, p=0.82), stroke length (1.90 ± 0.16 and 1.91 ± 0.14 m, p=0.73) and stroke index (3.09 ± 0.37 and 3.12 ± 0.36 m2s-1, p=0.58). Additionally, warming up did not presented significant effects in any selected physiological variables: blood lactate concentrations (warm-up 9.29 ± 1.78; no warm-up 8.73 ± 2.43 mmol∙l-1, p=0.45) and ratings of perceived exertion (warm-up 15.50 ± 1.15; no warm-up 15.00 ± 1.26, p=0.18).
Conclusions These findings suggest that standard warm-up does not impair or enhance swimming performance in short-distance races. Nevertheless, one can speculate that the usual warm-up performed by these swimmers was not adequate to this kind of efforts (lasting about 30s). Additionally, some further insight should be gathered about customised warm-up procedures.
References Fradkin AJ, Zazryn TR, Smoliga JM. Effects of warming-up on physical performance: a systematic review with meta-analysis. J
Strength Cond Res 2010; 24(1):140–8.
Neiva H, Morouço P, Marinho DA, Marques MC, Silva AJ. The effect of warm-up on tethered front crawl swimming forces. J Hum Kinet 2011; 29A:113–9.
Presenter Daniel A Marinho is a lecturer at University of Beira Interior (Portugal) and is a member of the Research Centre in Sports, Health and Human Development.
174 BMS2014—ABSTRACTS HANDBOOK

POSTER 50 The influence of apnea in physiological responses of female swimmers Georgia Rozi1, Vassilios Thanopoulos1, Theodoros Platanou1, Milivoj Dopsaj2, Vassiliki Lampadari3 1Faculty of Physical Education and Sports Science, 2Faculty of Sport and Physical Education, University of Belgrade, Serbia, 3Swimming Coach, OAKA of Athens, Greece
Introduction Underwater movement of the feet as a form of apnea, combined with regular swimming has not been studied from the perspective of physiological responses (Maglischo, 2003). The aim of this study was to investigate the maximum concentration of lactic acid in blood, heart rate and performance time of the test 4x50m freestyle swimming (Platonov, 1977; Pelayo et al. 1996) between two different protocols of maximum intensity: a) with normal breathing every 3 strokes one breath and b) 14- 15m underwater movement of the feet and the rest freestyle swimming with every 3 strokes one breath.
Methods The sample consisted of 15 swimmers of competitive level (age: 15 ± 1.0 years, body height: 164.7 ± 8.8cm and body weight: 54.07 ± 9.4kg). Their basic style was the freestyle and all of them were swimmers of short and middle distances. The participants swam 4x50m freestyle swimming with maximum intensity and 10 sec stop. In order to determine the maximum concentration of lactate in blood, capillary blood samples were taken at 3, 5 and 7 minute and analysed with an automatic analyser Lactate Scout Germany. Immediately after exercise, performance time and heart rate were recorded in 4x50m.
Results The ANOVA revealed no statistical significant differences between the two protocols in lactic acid, heart rate and performance time. Maximum production of lactic acid in the test of 4x50m with underwater movement of feet was 10.02±3.05mmol/L and 8.9±3.5mmol/L without underwater movement of feet. Heart rate was 186±6 and 186±7pulse/m and performance time 140.04±8.13 and 138.73±8.01sec respectively.
Conclusion According to the results of this research, apnea during maximum effort in freestyle swimming does not provoke different physiological responses in relation to freestyle swimming with apnea at competitive level swimmers aged 15± 1.0 years. In this investigation, the maximum production of lactic acid, heart rate and time performance are not affected by the form of apnea applied. Apnea as a form of exercise in swimming needs further study in other types of swimming with different protocols.
References 1 Platonov, V.N. (1977). Methodology of diagnosing specific endurance in competitive level swimmers.(In Serbia) Metodica
dijagnostike specijalne izdrziljivosti plivaca vrhunske klase. Izbor Radova iz Strane literature. Plivanje 1. Beograd. p.34–37.
2 Pelayo, P., Mujika, I., Sidney, M. & Chatard, J.C. (1996). Blood lactate recovery measurements, training and performance during a 23 week period of competitive swimming. European Journal of Applied Physiology. 74: 107–113.
Presenter Georgia Rozi graduated on 2008 in National and Kapodistrian University of Athens, Faculty of Physical Education and Sports Science. On 2011 she took the master degree with specialisation in Swimming science. She is now a PhD student in the same University, continuing research in the field of swimming.
POSTER 51 The effect of seasonal training on physical fitness changes in competitive water-polo players Petros Botonis1, Georgia Rozi1, Panagiotis Miliotis1, Spyridoula Ntalapera1, Argyris Toubekis1, Theodoros Platanou1 1School of Physical Education and Sports Science, University of Athens, Greece
Introduction We aimed at investigating the effect of pre-season (PS) and in-season (IS) training on fitness changes in competitive water-polo players.
Methods Eight male national-level players were followed over a training year. An 8-week training program was applied during the PS and IS respectively involving different high-intensity training modes (PS: 4X4 min freestyle swimming at
BMS2014—ABSTRACTS HANDBOOK 175

~106% of V4, with 3-min active recovery in between, twice a week, IS: 8X20m repeated swimming sprints with 10 s rest in between, 4–5 sets, twice a week) concurrently with strength (85–90% 1 repetition maximum, 4–5 repetitions, 4–5 set, PS: twice a week, IS: once a week) and specific water-polo training (sprint, technical and tactical training). PS and IS periods were interspersed with a 3-week recovery training period (low-medium intensity exercises). At the beginning of PS (Baseline) as well as at the end of PS and IS, fitness level was evaluated through an incremental swimming performance test (5X200-m). The speed corresponding to blood lactate concentration of 4.0, 5.0, and 10.0 mmol.l-1 (V4, V5, V10) was calculated from the speed lactate curve by interpolation of a second order polynomial function. The lactate tolerance rating was defined as the differential velocity between blood lactate concentrations of 10.0 and 5.0 mmol.l-1 (V10-V5).A two-way ANOVA with repeated measures was used to identify differences between occasions. The level of significance was set at p<0.05.
Results V4 and V5 and V10 were significantly enhanced after PS compared to baseline (V4, baseline: 1.15±0.03 vs PS: 1.25±0.04 m.s-1, p<0.01; V5, baseline: 1.20±0.03 vs PS: 1.29±0.03 m.s-1; V10, baseline: 1.32±0.04 vs PS: 1.41±0.04 m.s-1) and were attenuated following the IS compared to PS (IS, V4: 1.14±0.08, p<0.01; V5: 1.20±0.05, p<0.01, V10: 1.36±0.05, p<0.01). No changes were observed in V10-V5 after PS (baseline: 0.12±0.03 vs PS: 0.11±0.02 m.s-1, p=0.93), whereas significant improvements were shown after IS (0.16±0.05 m.s-1) compared to PS (p<0.01).
Conclusions Similarly to previous findings (Helgerud et al., 2011), aerobic and anaerobic metabolism were improved after PS. However, the overall training load given in PS and IS might deteriorated physical fitness aspects leading to a some kind of overtraining in IS period.
References Helgerud J, Rodas G, Kemi, OJ., Hoff J. Strength and endurance in elite football players. Int J Sports Med 2011; 32(9): 677–682.
Presenter Georgia Rozi graduated on 2008 in National and Kapodistrian University of Athens, Faculty of Physical Education and Sports Science. On 2011 she took the master degree with specialisation in Swimming science. She is now a PhD student in the same University, continuing research in the field of swimming.
POSTER 52 Is critical stroke rate effective as an index of interval training in competitive swimmers? Yuki Funai1, Masaru Matsunami1, Shoichiro Taba2 1Nishi-Nippon Junior College, 2Fukuoka University
Introduction In endurance interval training in swimming, although swimmers are instructed to swim in a time specified beforehand, instructions regarding swimming pace and stroke rate are rare. Dekerle et al. (2002) showed that critical stroke rate (CSR) was a useful criterion that can control the technical parameters and training intensity in endurance swimming training. However, the previous study examined only the validity of CSR by continuous swimming for 30 minutes. The purpose of this study was to determine whether CSR is effective as an index of intensity interval training in competitive swimmers.
Methods Five well-trained male competitive swimmers (19.6±0.9 yr, 170.8±6.2 cm, and 64.5±4.9 kg) volunteered for this study. CSR, defined as the stroke rate that can theoretically be maintained indefinitely without exhaustion, was expressed as the slope of a regression line between number of stroke cycles and time. Subjects performed maximal 200 m and 400 m front crawl trials for CSR determination in a 50 m pool. Thereafter, swimmers were instructed to perform a 4 × 400 m swimming test at CSR using a tempo trainer that can be attached to the goggles (CSR test), and 4 × 400 m swimming test at a spontaneous stroke rate corresponding to the swimming time in the CSR test (SSR test).
Results Blood lactate, heart rate, and RPE were significantly increased through the CSR and SSR test. Comparing the two tests, RPE was significantly higher, and stroke length was significantly lower in the CSR test in the first bout. On the other hand, there was no significant difference in any of the parameters immediately after these tests.
176 BMS2014—ABSTRACTS HANDBOOK

Conclusions It was suggested that CSR could be a good index in order to monitor aerobic training intensity in interval swimming training. Moreover, it was thought that in training in CSR, load could be applied from the training start time.
p<0.05 from the 1st bout. p<0.05 from the 2nd bout. p<0.05 from the 3rd bout.
1st 2nd 3rd 4thCSR 277.67±2.23 272.30±2.50 270.74±2.31 269.87±2.83
SSR 277.01±2.67 270.64±2.84 269.39±2.02 268.08±2.46CSR 2.90±0.3 2.9±0.5 3.3±0.6 3.6±0.5
SSR 2.2±0.3 2.3±0.4 2.8±0.5 3.2±0.6CSR 148.6±3.8 156.0±3.3 161.6±2.5 165.5±4.3
SSR 141.8±9.8 150.2±6.2 154.4±5.7 159.2±4.6
CSR 13.4±0.7 13.5±0.4 14.6±0.2 15.6±0.5
SSR 11.4±0.5 13.0±0.4 14.0±0.4 15.2±0.4CSR 2.60±0.05 2.65±0.05 2.67±0.06 2.68±0.05
SSR 2.77±0.04 2.72±0.05 2.71±0.05 2.71±0.04
Time(sec)
Blood Lactate(mmol/L)
Heart Rate(bpm)
RPE
Stroke Length(m/stroke)
*
*
a a, ba
a a, ba
a, b
a a, b
a a, b
a a
a a, b
a a, b, ca
a aa
a aa
CSR=Critical Stroke Rate; SSR=Spontaneously Stroke Rate.
Table 1 Physiological and stroke length responses during the interval swimming at CSR and SSR. (n=5, mean±SE)
a b cSignificant differences (p<0.05) between CSR and SSR.*
Reference Dekerle J, Sidney M, Hespel JM, Pelayo P. Validity and reliability of critical speed, critical stroke rate, and anaerobic capacity in
relation to front crawl swimming performances. Int J Sports Med (2002) 23: 93–98
Presenter Yuki Funai obtained a Master of Physical Education at Chukyo university. Currently, he is studying the training intensity of competitive swimmers. As part of the research on the training intensity in competitive swimmers, this study investigated whether stroke parameter is effective as an index of intensity interval training.
POSTER 54 The effects of hypercapnic-hypoxic training on strength respiratory muscles and swimming performance of elite swimmers Dajana Zoretic1 1Faculty of Kinesiology, University of Zagreb
Introduction Hypercapnia is known as a powerful cerebral vasodilator and ventilatory stimulants and represents an elevated partial pressure of carbon dioxide (pCO2) in arterial blood (Ivancev, 2009). Breathing muscles work while swimming is less economical because they have to, because of the short breaths; contract faster to gain a greater respiratory volume (Kapus, 2008). Specifically, breathing is difficult because the muscles involved in breathing performed additional work (Lomax & McConnell, 2003). The aim of this research is to determine the effects of hypercapnic-hypoxic training on result at 100 metres crawl swimming, together with determining respiratory muscles strength.
Methods In order to collect data testing is carried out on 26 top swimmers (control (C, n = 14) and experimental (E, n = 12)) in the following tests: the strength of respiratory muscles, the result of the 100m freestyle swim and the number of breaths during that race.
Results Results based on Wilks’Lambda = 0.42790, p = 0.000 at significant level p<0.05, we see that there is a statistically significant difference in multivariate space progress between groups ‘repeated measures MANOVA’. A series of two-way univariate analysis of variance ‘repeated measures ANOVA’ showed that all the variables show statistically significant differences in progress between groups (MIP, p = 0.006, MEP, p <0.0001, R100, p <0.0001, FB, p = 0.000).
BMS2014—ABSTRACTS HANDBOOK 177

Discussion Because of the increased strength of respiratory muscles in swimmers of experimental group it is possible that there was an increased volume of breathing with each inhale and exhale. Greater amount of air in the lungs has a positive effect on the amount of oxygen available, the elimination of excess CO2 and the very buoyancy of swimmers. They were also able to achieve better result in 100m crawl swim as well as a reduced number of breaths during that swim. Breathing during swimming interferes with propulsion and causes time imbalance between the two strokes and is recommended for swimmers (Lerda et al., 2001; Seifert et al., 2007), especially in shorter races to try to swim with the smaller number of breaths.
References 1 Kapus, J. (2008). Ucinki vzdrzljivostne vadbe z nizjo frekvenco dihanja. Doktorska disertacija. Univerza v Ljubljani fakulteta za
sport.
2 Ivancev, V. (2009). Specificnosti cerebrovaskularnog, kardiorespiracijskog i simpatickog zivcanog odgovora na ugljicni dioksid u ronilaca na dah. Doktorska disertacija. Medicinski fakultet, Sveuciliste u Splitu.
3 Lerda, R., Cardelli, C., Chollet, D. (2001). Analysis of the interactions between breathing and arm actions in the front crawl. Journal of Human Movement Studies. 40: 129–144.
4 Lomax, M.E. McConnell, A.K. (2003). Inspiratory muscle fatigue in swimmers after asingle 200 m swim. Journal of Sports Sciences, 21 (8), 659–664.
5 Seifert, L., Chollet, D., Chatard, J.C. (2007). Kinematic changes during a 100-m front crawl: effects of performance level and gender. Medicine & Science in Sports.1784–1793.
Presenter Dr Dajana Zoretic works at the Faculty of Kinesiology, University of Zagreb and is head of the program and the implementation of training young swimmers in Zagreb. Dajana was a elite swimmer and currently is involved in freediving and belong to the group of the best freedivers in the World on pool disciplines. Dajana is head strength and conditioning coach of Croatian male junior water polo representation. Scientific areas of interest are the effects of hypercapnia and hypoxia on haematological parameters, ventilation parameters, the chemoreceptors and swimming performance.
POSTER 55 Does four weeks of simple reaction time training improve start performance in swimming? Pierre-Marie Lepretre1, Laurie Kazarine1, Didier Chollet2, Frederic Puel2, Ricardo Fernandes3 1APERE, EA-3300, UFR-STAPS, Universite de Picardie Jules Verne, France, 2CETAPS, EA-3832, UFR-STAPS, Universite de Rouen, France, 3Gabinete de Natao Faculdade de Desporto, Universidade do Porto, Portugal
Introduction Start performance, as defined by time to 15-m, has been used as an indicator of overall performance in sprint swimming [1, 5]. However, there is limited information regarding the key time to response to start (RT) that influence swimming start performance [2, 3]. The aim of this study was to investigate the effect of RT training on start performance in sprint swimming trials.
Methods Eight male French national sprint swimmers (17.5±0.9years, 174.0±0.1cm, 65.6±10.4kg) performed, before and after 4 weeks of training, 3 repetitions of squat jump (SJ), counter movement jump (CMJ) and start on swimming start block on a Microgate Optojump optical measurement system [4]. Short-term training session consisted to plyometric session associated to 3 days a week, a swimming start training based on simple reaction time with different stimuli: visual, auditory, combined (visual and auditory).
Results Pearson correlation revealed time to perform 15-m was inversely related with height performance in SJ (r=-0.82, p=0.013) and CMJ (r=-0.85, p=0.007) after but not before training (SJ: r=-0.61, p=0.111; CMJ: r=-0.60, p=0.113). Time to perform 15-m was significantly related to RT measured on the block during auditory swimming start before (r=0.89, p=0.019) and after training session (r=0.83, p=0.022). No significant relationship was found between the change in RT and the difference in the time to perform 15-m with training (r=0.61, p=0.109). Finally, there was no significant change in 15-m swimming start (before training: 6.81±0.56s vs. after training: 6.74±0.50s) with a small Effect size (Cohen’s d: 0.13).
178 BMS2014—ABSTRACTS HANDBOOK

Conclusion This study provides start training with stimuli associated to plyometric training induced neuromuscular adaptations rather than strength improvement, which was directly transferable in swimming start condition.
References 1 Balilionis G, Nepocatych S, Ellis CM, Richardson MT, Neggers YH, Bishop PA. Effects of different types of warm-up on
swimming performance, reaction time, and dive distance. J Strength Cond Res. 2012 Dec;26(12):3297–303.
2 Bussières N. La contribution de départ sur la performance finale en natation pour un sprint chez 30 nageurs. http://depot-e.uqtr.ca/1555/1/030008767.pdf. p18–20.
3 de la Fuente B, Arellano R. Effect of start time feedback on swimming start performance. XIth International Spymposium of Biomechanics and Medicine in Swimming, Olso, Norway 2010, Chapter 4. Training and Performance, pp249–251.
4 Glatthorn JF, Gouge S, Nussbaumer S, Stauffacher S, Impellizzeri FM, Maffiuletti NA. Validity and reliability of Optojump photoelectric cells for estimating vertical jump height. J Strength Cond Res. 2011 Feb;25(2):556–60.
5 Slawson SE, Conway PP, Cossor J, Chakravorti N, West AA. The categorisation of swimming start performance with reference to force generation on the main block and footrest components of the Omega OSB11 start blocks. J Sports Sci. 2013;31(5):468–78.
Presenter Didier Chollet is the Vice-President of the University of Rouen, France. He has been head coach of National French University Swimming Team for 22 years. His primary research interests are Motor Control and Applied Biomechanics on Performance, with main themes concerning Swimming Coordination, Skill Acquisition and Feed-back. He has published five books in French, Spanish and English and more than 70 articles on motor control, biomechanics, coaching and sports science.
POSTER 56 Water immersion in supine position increases the pulse wave velocity Tatsuya Saito1, Terumasa Takahara2, Masahiro Nishimura3, Yusuke Takagi4, Megumi Murata1, Akira Yoshioka5, Sho Onodera6 1Graduate School, Kawasaki University of Medical Welfare, Okayama, Japan, 2University of Human Arts and Sciences, Saitama, Japan, 3Tottori University, Tottori, Japan, 4Tezukayama University, Nara, Japan, 5Kagawa University, Kagawa, Japan, 6Kawasaki University of Medical Welfare, Okayama, Japan
Introduction Pulse wave velocity (PWV) is useful method to evaluate arterial stiffness. Heart rate (HR) and systolic blood pressure (SBP) are potentially influential factors of PWV1,2). Therefore, we hypothesised that PWV of land was higher than that of in water set a water temperature at 30° because of the contribution change in circulatory response by the characterisation of water. The purpose of this study was to investigate the effect of water immersion in supine position on PWV.
Methods Thirteen Japanese healthy young males volunteered to participate in the present study. The subjects remained in a supine position in two different conditions: land condition (room temperature: 28.6 ± 0.4°) and water condition (water temperature: 30°). Subjects went to the laboratory and lay quietly for at least 15 minutes before measurement. Measurement parameters were brachii-ankle PWV (baPWV), HR, BP (SBP, diastolic BP; DBP) and the scale of a subjective thermal sensation (STSS). Each parameter was measured in supine position at after 5 minutes from experiment was started in both conditions.
Results baPWV, DBP and STSS in water condition were significantly higher than that of land condition (P<0.05). There were no significant difference between the conditions in HR and SBP, respectively. STSS in water condition showed as ‘cool’. The water temperature of this study was not able to keep body temperature at water immersion. However, this study supposes that the change was not seen in rectal temperature because water immersion time was 5 minutes. There is the possibility that baPWV was influenced by skin vasoconstriction during supine position in water.
Conclusion Our conclusion is that the water immersion could contribute to the constriction of a blood vessel of arterial stiffness.
BMS2014—ABSTRACTS HANDBOOK 179

References 1 Hashimoto J et al: Pulse wave velocity and the second derivative of the finger photoplethysmogram in treated hypertensive
patients: their relationship and associating factors. J Hypertens 20: 2415–2422, 2002.
2 Yamashina A et al: Nomogram of the relation of brachial-ankle pulse wave velocity with blood pressure. Hypertens Res 26: 801–806, 2003.
Presenter Tatsuya Saito was interested in the water quality and relationship of exercise in water when he was a junior. He has continued the study after entering graduate school. He continues to study about effect of supine position in water on arterial stiffness.
POSTER 57 Very fast oxygen kinetics in all-out unimpeded 50- to 400-m swims in elite sprinters and non-sprinters Diego Chaverri1, Thorsten Schuller2, Anna Barrero1, Ricard Cesari1, Uwe Hoffmann2, Xavier Iglesias1, Ferran A Rodriguez1 1GRCE, INEFC-Barcelona, Universitat de Barcelona (Barcelona, Spain), 2Institut for Physiologie und Anatomie, Deutsche Sporthochschule Kaln, Germany
Introduction Peak V’O2 has been shown to be a good predictor of performance in 100 and 400 m in competitive swimmers (Rodríguez et al. 2003). Reaching high V’O2peak values during high-intensity swimming depends on the speed of the V’O2 kinetics, which can be measured at the pulmonary level. However, the assessment of V’O2 kinetics in swimmers requires using cumbersome equipment that can limit the full expression of high-speed swimming technique and of the specifically trained muscles. We have previously reported that competitive swimmers are capable of reaching ∼95% of V’O2max during an all-out 100-m swim (Rodríguez et al. 1999). In an attempt to contrast these findings, this study compared the VO2peak reached during three different all-out unimpeded swims over 50 up to 400 m in elite swimmers.
Methods Participants were 39 male (M) and female (F) elite swimmers, from which 12 (7M, 5F) were sprinters (S) and 27 (5M, 22F) were non-sprinters (NS). All subjects performed 50- and 400-m front crawl time-trial tests, and 100- (S) or 200-m (NS) time-trials in their best personal stroke. Respiratory gases were collected during 3 minutes during the immediate recovery. Peak V’O2 was taken as the immediate post-exercise 20-s average. Differences in V’O2peak intra-group (test) and inter-group (sex) were tested using RM-ANOVA. Significance level was set at P<0.05.
Results No differences were found in V’O2peak reached at the three swimming distances (50, 100 or 200, and 400 m, respectively) neither in S (3215±665, 3358±755, 3384±750 ml∙min-1) nor in NS (3056±668, 3159±769, 3177±773 ml∙min-1). In the S group, 5 swimmers (42%) reached their highest V’O2peak at 400 m, 3 (25%) in 100 m, and 3 in 50 m. In the NS group, 9 swimmers (33%) reached their highest V’O2peak at each of the three distances. No differences were observed either when data were stratified by sex.
Discussion V’O2peak measured after a maximal 400-m swim does not differ from V’O2max measured at maximal incremental tests on the treadmill and the cycle ergometer in competitive swimmers (Rodríguez, 2000). Present results confirm the extremely fast V’O2 kinetics exhibited by elite swimmers, who are often capable of reaching their highest V’O2peak even at very short time intervals (i.e. during 50 or 100-m all-out swims in some cases). They are also in agreement with our previous observation that the rate of increase (i.e. time constant) of V’O2 during a 100-m maximal swim (∼23 s) is shorter than in a 400-m maximal swim (∼30 s) (Rodríguez et al. 2003). It is also in accordance with the finding of a direct relationship between V’O2peak and all-out 200-m swimming speed, which was also strongly correlated with the amplitude of the fast component (Sousa et al. 2011). This very fast VO2 kinetics, particularly in the shorter distances, can be explained by a more intense activation of the lower limb and trunk muscles during kicking in the faster swims (Rodríguez et al. 2010).
References Rodríguez FA. Cardiorespiratory and metabolic field testing in swimming and water polo: from physiological concepts to practical
methods. BMS VIII (Jyväskylä), 219–226, 1999.
180 BMS2014—ABSTRACTS HANDBOOK

Rodríguez FA. (2000). J Sports Med Phys Fitness 40(2), 87–95.
Rodríguez FA, Keskinen KL, Keskinen OP, Malvela M. Oxygen uptake kinetics during free swimming: a pilot study. BMS IX (Saint-Étienne), 379–384, 2003.
Sousa AC, Figueiredo P, Oliveira NL, Oliveira J, Silva AJ, Keskinen KL, Rodríguez FA, Machado LJ, Vilas-Boas JP, Fernandes RJ. (2011). V’O2 kinetics in 200-m race-pace front crawl swimming. Int J Sports Med, 32(10), 765,770, 2011.
Rodríguez FA, Lätt E, Jürimäe J, Mäestu J, Purge P, Rämson R, Haljaste K, Keskinen KL, Jürimäe T. Oxygen uptake kinetics in all-out arm stroke, leg kicking and whole stroke front crawl 100-m swims. BMS XI (Oslo), 110–111, 2010.
Presenter Ferran A Rodriguez (MD, PhD, FECSS, FACSM) is full professor at INEFC, University of Barcelona, and serves as coordinator of the INEFC Barcelona Sport Sciences Research Group (http://inefcresearch.wordpress.com/). His main areas of research include exercise and sports physiology, bioenergetics, altitude training, physiological testing, swimming and aquatic sports, and talent identification.
POSTER 58 Physiological characteristics of Thai swimmers: an exploratory approach Phornpot Chainok1, Piyaporn Tumnark1, Carlo Baldari2, João Paulo Vilas-Boas1,3, Ricardo Fernandes1,3 1Faculty of Sport, Centre of Research and Education, Innovation and Intervention, 2Health Sciences Department, University of Rome, Italy, 3Porto Biomechanics Laboratory, University of Porto, Portugal
Introduction The evaluation of the swimming determinant factors is considered a fundamental tool for increasing the efficiency of training processes and prediction the performance. The bioenergetical studies of swimming are based upon the characterisation of the capacity and power of the aerobic and the anaerobic systems, through the assessment of well-defined physiological parameters. It is considered that coaches should understand the metabolic profile of each swimming event, what is required most for a particular swimmer, and how to strengthen her/his weak points, to develop effective and specific training programs. The purpose of this study was to conduct an exploratory study of the physiological characteristics most related to Thai swimmers performance.
Methods Six middle-distance national swimmers, 3 girls (16.77 ± 2.16 years, 54.33 ± 0.58 kg and 167 ± 5.20 m, 64.30± 7.83 s and 140.00±14.38 s at the 100 and 200 m) and 3 boys (16.73± 1.19 years, 72.67 ± 2.08 kg and 172.00 ± 2.65 m, 53.80± 0.61 s, 127.61± 0.57s at the 100 and 200 m) participated in the study. Each swimmer performed the totaling test: aerobic critical velocity, incremental intermittent protocal, time limit at vVO2max, and anaerobic critical velocity.VO2 was collected breath-by-breath (averaged 10s) using a K4b2portable gas analyser connected to the new Aqua Trainer respiratory snorkel (Cosmed, Italy). Blood lactate concentrations ([La-]) were also assessed from the earlobe of the swimmers.
Results The aerobic critical velocity values were 1.17 m∙s-1for girl (n=1), 1.34 ± 0.08 m∙s-1for boys (n=2), individual anaerobic threshold occurred at 1.9 mmol∙l-1 for girl (n=1), 2.9 mmol∙l-1for boy (n=1) and the corresponding velocities were 1.29 ms-1 for girl (n=1), 1.36 m∙s-1for boy (n=1). Mean VO2max were 55 l∙min-1 for girl (n=1), 64 l∙min-1 for boy (n=1) and the corresponding vVO2max was 1.42 m∙s-1for girl (n=1), 1.46 m∙s-1for boy (n=1). Mean TLim value was 220.5 s for girl (n=1), 221.0 s for boy (n=1). Mean anaerobic critical velocity values were 1.54 m∙s-1for girl (n=1), 1.65 ± 0.07 m∙s-1 for boys (n=2), and lactate concentration values at the end of the series were 8.7 mmol∙l-1 for girl (n=1), 10.80 ± 4.10 mmol∙l-1 for boys (n=2).
Conclusions The exploratory physiologic profile of Thai swimmers allowed understanding that they are within the intervals available in literature for other samples of competitive swimmers, particularly if we try to narrow this interval considering the swimmer’s competitive level. Attempts are being made nowadays to link all these bioenergetics factors into a coherent process to help coaches, and swimmers, enhance swimming performance at each swimming event.
Presenter Phornpot Chainok is a PhD student at Faculty of Sport at the University of Porto, Portugal and a lecturer at Faculty of Sport Science of Burapha University, Thailand. He has an interest and work on swimming particularly in the area
BMS2014—ABSTRACTS HANDBOOK 181

of biomechanics applied to swimming. His research will address key question and focused on swimming turn techniques.
POSTER 59 Relationship among perceived exertion and physiological parameters during interval training series under critical velocity intensity Flávio Antônio de Souza Castro1, Marcos Franken1, Priscila Mazzola1, Rodrigo Zacca1,2 1UFRGS, 2UP
Introduction The aim of this study was to investigate the relationship among perceived exertion (PE) and blood lactate concentrations ([LA]), tryptophan ([TRP]) and prolactin ([PRL]) plasma concentrations in training series under critical velocity intensity (CV-2par) obtained by the tby the two-parameter model.
Method Fourteen competitive swimmers (21.1±7.3 years old, 74.2±7.0 kg body mass, 1.79 ± 0.60 m height, 1.86 ± 0.8 m arm span and 77.4 ± 4.6% of the World Record over 400 m freestyle in 25 m pool) volunteered for this study. The CV-2par was determined by 200 and 400 m front crawl at maximum intensity. The participants performed a series of 400 m trials until exhaustion under the percentage of 100% of CV-2par. Participants were asked to perform the largest possible trials of 400 m in the pre-set speed (individualised; resting of 40 seconds between each trial). After the first and last trials of 400 m, the swimmers reported the EP in general by means of the Borg’s scale of 15 points and were recorded [LA]. Already [TRP] and [PRL] were determined at rest and in a state of exhaustion. The swim pace was controlled by means of an underwater visual pacer. Correlations among PE and [TRP], [PRL], and [LA] were tested with the Kendall’s tau test.
Results Five swimmers performed five 400 m trials; four performed four trials and just five performed just two trials. Mean swimming velocity was 1.37±0.1 m.s-1. Significant correlation (tau = 0.544, p <0.05) was found just between EP and [LA] in the final trial of the series (Table 1).
Table 1 Correlation matrix of the Kendall’s tau test between perceived exertion (PE) and plasma concentrations of tryptophan ([TRP]), prolactin ([PRL]) and blood lactate ([LA]) in initial and final 400 m trials. N = 14.
[TRP] [PRL] [LA]
Initial trial tau = -0.48 tau = -0.321 tau = 0.049
p = 0.489 p = 0.134 p = 0.818
Final trial tau = -0.336 tau = -0.137 tau = 0.544
p = 0.119 p = 0.525 p = 0.013*
Conclusions Under CV-2par intensity, increasing PE and lactate concentration is correlated, in an non-linear behaviour. Tryptophan and prolactine concentrations are not correlated to the PE, as firstly hypothesised.
References Franken M; Zacca R; Castro FAS. (2011) Critical velocity in swimming: fundamentals and application. Motriz, vol. 17, no. 1, pp.
209–222.
Presenter Flávio Antônio de Souza Castro is from Federal University of Rio Grande do Sul, Brazil, where he teaches swimming and leads the Research Group in Aquatics Sports.
182 BMS2014—ABSTRACTS HANDBOOK

POSTER 60 Active, passive and mixed warm-ups: do they have the same effect on swimming performance? Sarah Adams1, Georgios Machtsiras1, Stelios Psycharakis1 1Edinburgh Napier University, Edinburgh,UK
Introduction A warm up can be active (AWU), passive (PWU) or mixed (MWU), which is a combination of AWU and PWU. A PWU involves raising the muscle or core temperature by external means (e.g. saunas, hot showers, heating pads, massage), while an AWU involves exercise. Both AWUs and PWUs have been shown to improve performance (e.g. Bishop 2003a; 2003b). However MWUs have rarely been studied, while the effectiveness of different WU types on swimming performance has not been investigated. The purpose of this study was to compare the effects of an AWU, PWU and MWU on performance of a 100m maximum swimming sprint.
Method Eight male competitive swimmers completed each of the three WU types in a randomised order with a 7-day period between subsequent sessions. Following each WU, swimmers had a 20-minute rest and then performed a maximum 100m swim on their specialised stroke. The time taken to complete the 100m trial was the performance measure. The rating of perceived exertion (RPE) was measured immediately post WU, while heart rate (HR) was measured pre and post WU and pre and post the maximum swim. During the 20-minute rest, the swimmers’ psychological state was assessed with the CSAI-2 questionnaire.
Results Post WU HR and RPE had the lowest values following the AWU and the highest values following the PWU (p<0.01). Pre performance HR increased significantly relative to pre WU HR for all conditions (p≤0.01). The CSAI-2 questionnaire revealed relatively low levels of anxiety for all conditions, and modest to high levels of self confidence.
Conclusions No WU appeared to be superior to the others with respect to swimming performance. However, although the AWU and MWU produced nearly identical performance, cognitive anxiety and self confidence scores, there was a tendency, albeit a not significant one, for somewhat worse scores after the PWU in all these variables.
References Bishop D, 2003a. Warm up I: Potential mechanisms and the effects of passive warm up on performance. Sports Medicine,
33:439–454.
Bishop D, 2003b. Warm up II: Performance changes following active warm up and how to structure the warm up. Sports Medicine, 33: 483–498.
Presenter Dr Georgios Machtsiras is a lecturer at the Edinburgh Napier University and a research assistant at the University of Edinburgh. Georgios’ research interests in swimming biomechanics include: underwater 3D motion capture, 3D scanning, drag/propulsion assessment, Computational Fluid Dynamics and aquatic rehabilitation.
POSTER 61 Physiological and performance benefits for elite swimmers in the presence of different training volumes and intensities Gustavo Antonio Meliscki1, Gabriela Cristina Meliscki1, Enrico Fuini Puggina2, Marcelo Papoti2, Milton Cesar Foss1, Maria Cristina Foss-Freitas1 1Faculdade de Medicina de Ribeirao Preto, FMRP/USP, 2Escola de Educaio Fasica e Esportes de Ribeirao Preto, EEFERP/USP
Introduction The quantitation of the progress of performance is essential for elite sports1. However, performance is influenced by various factors such as training intensity and volume2. Thus, the objective of the present study was to compare the effects training volume and intensity in elite swimmers.
Methods 20 swimmers performed a program of 18 weeks of training. They were divided into two groups submitted to two different types of training during a period of 6 weeks: high volume training (HVT) and high intensity training (HIT).
BMS2014—ABSTRACTS HANDBOOK 183
Each type of training was preceded and followed by an identical baseline period (8 weeks) and taper period (4 weeks). Evaluation of performance (critical velocity=CV; lactate peak=LP, and lactate removal=LR) and biochemical exams (hematocrit=Hct and hemoglobin=Hb) were carried out before the beginning of training (T1), at the end of the baseline period (T2), at the end of the specific period (T3), and at the end of the polishing period (T4).
Results The HVT group showed a 5.18% progress of CV when T1 (1.35±0.14) was compared to T4 (1.42±0.09)(p>0.05), while the HIT group showed a 6.66% progress between T1 (1.35±0.09) and T4 (1.44±0.08)(p<0.05). When LP was compared between the T2 and T4 periods, the HVT group showed a 59% increase (p<0.05), while the HIT group showed a 532% increase (p<0.05). The LR of the HVT group was 237% higher at T4 than at T2, and the LT of the HIT group was 541% higher at T4 than at T2. Hb and Hct concentrations increased 13.90% and 12.26%, respectively, at T4 in the HIT group compared to T1. While, the HVT group showed a 4.84% increase in Hb and 1.88% reduction of Hct.
Conclusions High intensity training for a period of 6 weeks seems to promote better physiological adaptations, as well as a better performance among elite swimmers.
References 1 FAUDE, O.; et al. Volume vs. Intensity in the training of competitive swimmers. Int J Sports Med, 29:906–912, 2008.
2 MUJIKA, I. Intense training: the key to optimal performance before and during the taper. Scand J Med Sci Sports 20:24–31, 2010.
Presenter Gustavo Meliscki is a professor at the graduation courses of physiotherapy and physical education at the University of Ribeirão Preto, UNAERP. He is a member of the National Society of Sports Physiotherapy, SONAFE, and coordinator of the Centre of Expertise in Rehabilitation and Sports Performance, Cerde. Gustavo Meliscki studied his undergraduate degree in physiotherapy from the University of Ribeirao Preto, UNAERP (2010). He studied enhancement in sports physiotherapy at National Society of Sports Physiotherapy, SONAFE (2012) and recieved his Master of Science of Medicine by Faculty of Medicine of Ribeirao Preto, USP (2012). He is currently pursuing a PhD at the department of Internal Medicine, Division of Endocrinology and Metabolism, Faculty of Medicine of Ribeirão Preto, USP. He served as physiotherapist at the Football team Ribeirao Preto ‘Challengers’. Currently he is physiotherapist at the UNAERP swim team and ATOS Brazilian Jiu Jitsu team.
POSTER 62 A support inertial sensor tool for the swimmer’s interval training Yuji Ohgi1, Koichi Kaneda2, Akira Takakura3 1Keio University, 2Chiba Institute of Technology, 3Seiko Instruments Inc
Introduction Interval training is the most popular style in the swimming training. For the interval training, coaches have been used a stopwatch for the time measurement more than half a century. In parallel with the time measurement and its call, they have to watch and instruct swimmers’ stroke skill as well. However, it is difficult for them to accomplish simultaneously those tasks for all swimmers. For this difficulty, the authors propose a new approach for the daily training session to assist both the swimmers and coaches. A modern pedometer has a sophisticated algorithm not only for the step counting but also the estimation of the energy expenditure [1, 2]. The authors aimed to develop a similar sensor tool for the training on the competitive swimming. The purpose of this study was to classify states of the swimmer in the interval training and quantify their training intensity using body-attached accelerometer. The term, ‘state’ here represents the swimming and rest phases, start, turn, goal touch instants and stroke styles in the interval training as the qualitative parameters. In addition, the swimming time and stroke rate are also included as the quantitative parameters.
Method The authors developed a chest band style water proofed triple axis accelerometer (±2g at 32Hz). Forty-five well-trained university swimmers and thirty-nine masters swimmers were recruited for this research. Subjects wore an accelerometer chest belt and swam the controlled interval training menu with four stroke styles. In order to observe the subject’s motion, two video cameras were settle up from the side and bird’s eye view. The coach’s manual recording did the measurement of swimmer’s every bout by the stopwatch.
184 BMS2014—ABSTRACTS HANDBOOK

Results The ‘state’ during the interval training, such as swimming/resting, start, turn goal touch were identified by using the unique characteristics of the time sequence of the chest acceleration. Then, swimming record for each bout was estimated only using the sensor data. We compared these estimated swimming time and the manual recoding time for the validation. In addition to the time estimation, data mining method, such as artificial neural network, decision tree were adopted for the stroke style classification with high accuracy (91.1% for the college swimmers).
Conclusion The qualitative and quantitative assessment of the swimming interval training was accomplished using the inertial sensor with our invented algorithm. Depending on the swimmer’s skill level, we should choose appropriate data mining strategy.
References 1 Brezmes T., et al. ‘Activity Recognition from Accelerometer Data on a Mobile Phone’, Lecture Notes in Computer Science,
2009, Volume 5518, Distributed Computing, Artificial Intelligence, Bioinformatics, Soft Computing, and Ambient Assisted Living (2009), 796–799
2 Ohgi, Y., Kaneda, K., Tanaka, C., Wireless Activity Monitoring System for Water Walking, Proc. of Biomechanics and Medicine in Swimming XI. Norway, Oslo, 6, pp.130–131,2010.
Presenter Yuji Ohgi completed his initial studies in sports and health sciences at University of Tsukuba and completed his PhD in media and governance at Keio University in 2003. Since 2005, he has been an associate professor at the Graduate School of Media and Governance at Keio University and this year took over as chair of the university’s Sports Dynamics and Informatics Laboratory. He is a steering committee member of Japan Society of Sciences in Swimming and Water Exercise and steering committee member of Sports and Human Dynamics in Japan’s Society of Mechanical Engineering.
POSTER 63 Elite paralympic swimming: high performance centre environments improves sleep Nicola Rowley1, Jonathan Leeder1, Carl Payton2 1English Institute of Sport, SportCity, Manchester, 2Manchester Metropolitan University, UK
Introduction Lack of sleep can adversely affect athletic populations by contributing to inadequate recovery and maladaptation to training, as well as negative influence on motor learning and skill acquisition. Sleep is therefore a fundamental component to elite Paralympic swimming due to the need to recover from large training volumes and acquisition of swimming skills.
Performance question Elite Paralympic swimmers (PS) are based in either ‘home programs’ (HP; sub-optimal training times) or at ‘high performance centres’ (HPC; flexible training times). Although anecdotally suggested, the influence of time of day of training on sleep and recovery has not been objectively investigated in this cohort. Therefore, this investigation aimed to ascertain if HPC swimmers experienced better sleep quality and quantity than HP swimmers.
Methods Twelve PS (7 female and 5 male) wore an actigraphy wristwatch for 14±6 days within their home environment. Five athletes trained at a HPC and 7 within their HP’s. Sleep variables of time in bed (TIB), actual sleep time (AST), sleep efficiency (SE) and sleep latency (SL) were analysed between groups (HP VS HPC). Sleep was also compared preceding either early morning training, starting before 7am (EMt) and rest mornings (Rest)
Results In comparison with HP swimmers, HPC swimmers had more AST (7:10±1:14 VS 6:38±1:44, p<0.05), shorter onset of SL (26±30min VS 39±35min, p<0.05) and greater SE (83.4±5.9% VS 79.7±9.8%, p<0.01). Specifically, EMt get up times showed HPC swimmers got up later (06:01±1:01 VS 05:31±0:58) gaining more AST (6:45±0:59 VS 5:41±1:00, p<0.01) than HP. Both groups went to bed earlier the night preceding EMt compared to Rest (p<0.01), with HPC swimmers having a shorter onset of SL (26±23min VS 43±38min). Home program swimmers displayed a decrease in SE the night before EMt in comparison to Rest (77±9% VS 82±9%, p<0.01).
BMS2014—ABSTRACTS HANDBOOK 185

Conclusion The HPC training environment provides 30 minutes more AST per night and superior sleep quality than training in a HP. It is speculated the HPC swimmers had less variation over a training week adopting better circadian rhythm reducing their SL period. Sleep routines influenced by training schedules of HP athletes could have long term negative influences on recovery.
Presenter Dr Carl Payton is a Senior Enterprise Fellow in Biomechanics at Manchester Metropolitan University in the UK. His current research interests are in the biomechanics of elite swimmers with a disability. Carl has led the delivery of biomechanics support services to the Great Britain Para-swimming team since 2000 and he is also a member of the IPC Swimming research group who are focusing on the Para-swimming functional classification system.
SOCIAL SCIENCES, HUMANITIES AND PEDAGOGICS
POSTER 65 Balanced progress: optimal protection in a survival context Robert Keig Stallman1,2,3 1Norwegian Lifesaving Society, 2Tanzanian Lifesaving Society, 3The Norwegian School of Sport Science
Introduction In any drowning episode, there is usually some factor, some weak or missing skill, which triggers the emergency. At any given stage of aquatic skill development, the optimal level of protection is achieved when all essential elements are evenly developed. Elsewhere, the principles of such development have been described as a) equally proficient on front and back, b) equally proficient underwater and at the surface, c) possession of a well balanced and all around aquatic skill base1. A common example of persons without balanced development are those who are moderately skilful on the front but very weak on the back (or vice versa).
Methods A conceptual model is presented on the premise that the weakest element in a person’s skill profile is most likely to trigger an emergency situation in the water, i.e. a potential drowning. The chain is only as strong as the weakest link. From a previous study, in depth interviews with drowning survivors have uncovered typical weaknesses in skill development1.
Results When skill development is uneven, weak spots or holes are left in the foundation. Because foundational skills are weak or missing, the next row of bricks (skills) is weaker. Pressure grows as the wall gets higher. One missing brick leads to another. A fault line develops. Finally, the wall collapses. A weak or missing essential survival element has triggered a drowning episode.
Conclusions Water safety education must strive for balanced development of essential protective skills.
References 1 Stallman, R., Junge, M.†, Blixt, T. (2008). The Teaching of Swimming Based on a Model Derived from the Causes of
Drowning. International Journal of Aquatic Research and Education, Human Kinetics, Vol. 2, pgs 372–3.
2 Langendorfer, S.J. & Bruya, L.D.(1995). Aquatic readiness. Champaign, IL: Human Kinetics
Presenter Robert Keig Stallman is a retired Assoc Prof at Norwegian School of Sport Science. He has been active in many branches of aquatics for over 50 yrs. He has worked in approximately 12 aquatic organisations in 6 countries. He is still actively writing, researching and presenting.
186 BMS2014—ABSTRACTS HANDBOOK

POSTER 66 ‘Chunusi’—an east African folk tale—or is it? Parallels between myth and demographic fact Sia Emmanuelli Msuya1,2, Adventina Mlaki2, Robert Keig Stallman3,4,5 1Kilimanjaro Christian Medical University College, 2Better Health for African Mothers and Children, 3Norwegian Lifesaving Society, 4Tanzanian Lifesaving Society, 5Norwegian School of Sport Science
Introduction Chunusi is variously described among Swahili speakers as a power or a spirit which lurks in deep water and pulls unsuspecting victims under. A devil, it cannot be seen or touched. It may be male or female. It eats its victims and prefers males who cannot swim. It tends to be found where the rocks are not seen and takes most of its victims in the afternoon, when the Chunusi gather and dance ‘ngoma’.
Methods In depth interviews were conducted with a convenience sample of both children and adults. The sample of children was stratified by age in an attempt to discern at what age belief turned to myth. The adults included both persons with no children as well as parents. The interview guide consisted of open ended questions in an attempt to get people to talk freely. The subjects were encouraged to search their experience and their memory in a free flowing narration in order to elicit uninhibited response.
Results Children of 11 years or less exhibited strong belief and were convincing in their narrations. At about 12 years they began to show some understanding that maybe Chunusi was a story, albeit with a moral. When asked, most caregivers admitted that Chunusi is a conscious strategy to frighten children away from dangerous water. Parallels with fact included time of day, gender of victims, and environment. Surprisingly, a small number of adults also exhibited ‘belief’ in the creature which pulls people under water and devours them.
Conclusions The vivid portrayal of belief suggests an effective strategy. That male non-swimmers are the primary target reinforces the need for swimming instruction. Drowning is a serious public health problem in East Africa though statistics are unavailable. Multiple interventions are needed at all levels.
Presenter Robert Keig Stallman is a retired Assoc Prof at Norwegian School of Sport Science. He has been active in many branches of aquatics for over 50 yrs. He has worked in approximately 12 aquatic organisations in 6 countries. He is still actively writing, researching and presenting.
POSTER 67 ‘Parallel teaching’—a tool for individualising teaching and optimising learning Robert Keig Stallman1,2,3 1Norwegian Lifesaving Society, 2Tanzanian Lifesaving Society, 3The Norwegian School of Sport Science
Introduction Optimal learning is achieved when each individual is encouraged to learn according to their own needs and prior experience. This has been a focus of modern educational theory for some time. Yet swimming instructors often find it difficult to individualise this way. Its’ easier to ‘teach’ if all learners are treated alike. But they are not alike. The optimal progression for one may not be optimal for another. Optimal learning may be difficult to achieve. The consequence of not individualising, however, is that there are always some learners left behind.
Methods Teaching in traditional fashion was observed and pupil progress recorded. In an experimental group, wherever there appear pairs of skills which are opposites, for example floating on the front and back, both were presented at the same time. Natural selection according to needs and experience subconsciously guided the pupils own ‘decision’. In this way, all were empowered to progress—none were left behind. Pupils were later guided to work on the ‘other’ skill, that which they had not chosen first. Thereafter, both skills were practiced interchangeably. The pupils quickly became equally proficient at both. Other ‘pairs’ were a) gliding on front and back, b) rolling from front to back and back to front, c) kicking on front and back, d) pulling on front and back, e) a beginners combined stroking on front and back. Symmetric arm movements (breaststroke like) and diagonal movements (crawl like), were introduced at the same time.
BMS2014—ABSTRACTS HANDBOOK 187

Results Individualising in this way was not more difficult nor did it require more time. Pupil progress appeared to be at least as great if not greater. Fewer episodes of learners being ‘left behind’ were experienced.
Conclusions The teachers and pupils were observed to experience a greater level of motivation and satisfaction. Fewer episodes of learners ‘lagging behind’ were observed. Parallel teaching helps all to find their own, optimal progression.
References Langendorfer, S.J. & Bruya, L.D.(1995). Aquatic readiness. Champaign, IL: Human Kinetics
Presenter Robert Keig Stallman is a retired Assoc Prof at Norwegian School of Sport Science. He has been active in many branches of aquatics for over 50 yrs. He has worked in approximately 12 aquatic organisations in 6 countries. He is still actively writing, researching and presenting.
COACHING
POSTER 68 Change of critical speed in swimmers aged 10–11 years old Vassilios Thanopoulos1, Georgia Rozi1, Eirini Hatzilia3, Milivoj Dopsaj2, Vasiliki Lampadari4 1Faculty of Physical Education and Sports Science. University of Athens, 2Faculty of Sport and Physical Education, University of Belgrade, Serbia, 3Swimming Coach, Peristeri Club of Athens, Greece, 4Swimming Coach, OAKA of Athens, Greece
Introduction Critical speed has occupied researchers in finding the normal sense of it and the perfect way to use it in the coaching process (Toubekis et al., 2013). Critical speed (Wakayoshi et al., 1992a) is used as an alternative method because it is simple, cheap and non- intrusive. It is important for the coach to know the speed that he should use without causing unwanted burden to swimmers during a training cycle. The purpose of this research was to study the critical speed in three different phases. In the second phase of basic preparation of the summer cycle, the preparatory and pre-competition phase in male and female swimmers aged 10 to 11 years.
Methods The research involved 16 male and female swimmers. Seven of them (n = 7) were boys age: 10.9 ± 0.9 years and nine (n = 9) were girls age: 11.0 ± 0.7 years. The athletes swam the distances of 50m, 100m, 200m and 400m with maximum intensity, starting from the water. The test was repeated three times during the investigation.
Results The univariate analysis of variance showed that there were no statistically significant differences between the different measurements in critical speed. Also, there were no statistically significant differences between the two genders. At individual level, statistically significant difference was observed between the measurements of critical speed for girls (Sig .000) and boys (Sig .002), which showed that the critical speed improved from the first to the last measurement.
Conclusion This non-intrusive procedure may be easily applied as a practical indicator of endurance in young swimmers. From the findings of this research it appears that critical speed can be an evaluation key for assessing aerobic capacity. The results of the research can lead to the following conclusion:
Critical speed obtained with a mathematical procedure, may change from period to period investigating individually boys and girls. In future research it is proposed to study measurements covering the whole period of coaching and to evaluate greater number of athletes.
References 1 Toubekis A. G., Tokmakidis S.P., (2013), Metabolic responses at various intensities relative to critical swimming velocity, J
Strength Cond Res. 2013 Jun;27(6):1731–41
188 BMS2014—ABSTRACTS HANDBOOK

2 Wakayoshi, K., Yoshida, T., Udo M., Kasai, T., Moritani, T., Mutoh Y. & Miyashita M. (1992a). A simple method for determining critical speed as swimming fatigue threshold in competitive swimming. Int. J. Sports Med, Vol 13(5), pp.367–371.
Presenter Georgia Rozi graduated on 2008 in National and Kapodistrian University of Athens, Faculty of Physical Education and Sports Science. On 2011 she took the master degree with specialisation in Swimming science. She is now a PhD student in the same University, continuing research in the field of swimming.
POSTER 70 Analysis of team free routine choreography in synchronised swimming at the FINA World Championships 2011 Haruka Fujishima1, Miwako Homma2 1Japan Institute of Sports Sciences, 2University of Tsukuba
Introduction In free routines one panel of judges evaluates Technical Merit (execution, synchronisation, and difficulty) and the other panel of judges evaluates Artistic Impression (choreography, musical interpretation, and manner of presentation). Judges mark scores for these six areas according to a rating scale, and scores of 0 to 10 points are awarded in 0.1-point increments. They have no clear explicit criteria, so the subjective judgment of the individual judge is crucial. It is important for some objective criteria be implemented to reduce the subjective element from such judgments. This study quantitatively analysed the choreography of team free routines in synchronised swimming and examined the characteristics of choreography in each score range (Table 1).
Methods 24 participating team free routines in the 14th FINA World Swimming Championships 2011 were analysed. Movements in team free routines were classified based on the method presented by Homma (1997) (Fig. 1). Analysis was for the number of pattern changes, and the distribution, performance time, and the number of performances of each movement.
Results There were no significant difference between score ranges and the number of movements or movement times. Factors notably separating ‘very good (8.9–8.0 scores)’ or better and ‘good (7.9–7.0 scores)’ or worse score ranges were the total number of patterns (p < 0.05), the number of surface changes (p < 0.05), and the performance time of layout positions (p < 0.05).
Conclusions The result suggests that aiming for a ‘very good’ score requires complex pattern changes, consideration of figure start positions, and a rapidly developing routine. This study showed no significant difference between score ranges and the number of movements or movement times, likely because high choreography scores are possible regardless of movement numbers or times due to differences in variety, creativity, transitions, and pool coverage.
References 1 Homma M. A Study of the Components of the Team Free Routines in Synchronized Swimming at the Atlanta Olympic
Games. Undogaku Kenkyu, Univ. of Tsukuba, 13:9–20, 1997.
BMS2014—ABSTRACTS HANDBOOK 189

2 Teresa Alentejano, Dru Marshall, and Gordon Bell. University of Alberta, Edmonton, Alberta, Canada. A Time–Motion Analysis of Elite Solo Synchronized Swimming. International Journal of Sports Physiology and Performance, 3, 31–40, 2008.
Presenter Haruka Fujishima was born in Hiroshima in 1986, and had an early fascination with swimming. She began synchronised swimming when she was 8, and went on to graduate Japan Woman`s College of Physical Education and University of Tukuba for Master of Sport Sciences. She has since coached synchronised swimming to a wide range of athletes both within Japan and abroad, including the Indian National Team. She is currently working at the Japan Institute of Sports Sciences.
POSTER 71 Teaching the apnea turn using functional movement analysis approach Bodo E Ungerechts1, Carsten Goosses2 1University of Bielefeld, Neurocognition-Biomechanics, Germany, 2Coaches Academy of DOSB, Cologne, Germany
Introduction The Apnoe-turn, a new approach with dive to the wall, touch the wall fully submerged, change the direction and push-off from the wall, fully submerged, respectively which was presented by Kishimoto et al (2010) showed differences to conventional turns focusing on speed per phase, claiming ‘As a result, Apnea turn has the possibility to improve performance in the turn phase.’ In order to introduce this completely new variant of turn to the swimmers at home several steps have to be made. At first the idea has to be conveyed to young swimmers which can be best done using Functional Movement Analysis approach (FMAA) resulting into appropriate learning steps (Ungerechts & Klauck, 2006). Basically FMAA considered each action to serve a purpose of function. After reporting the functions via three steps, (1) draft version, (2) action description and (3) functional allocation, main and auxiliary phases need to be identified. The main action phase is that action which is the core of the movement, whereas auxiliary actions are preparatory, assisting or crossover means. Finally all actions are transferred into appropriate tasks. The task representing main action is presented first in teaching. After one task is mastered sufficiently by finding own solutions independently other tasks follow. The purpose is to report a) the learning development of the swimmers during a training period and b) results of their first race with apnea-turns in butterfly and breaststroke.
Method The study, projected for 10 weeks, starting with FMAA. 19 swimmers, aged 14,4 ± .74 y preparing for their fist national championships, participated in the following steps: pre-test (analysis of conventional turn in races), instruction courses, and practical units 3 x per week finishing with post-test (Apnea-turns in races). Analysis items were user-friendly: times per various phases. Main strategies of mediation were: presenting draft version plus video-sequences, imitation of the whole movement and video taping, then the Apnea-turn were executed in particular sessions in 3 weeks, without time pressure, another 3 weeks attention was placed on fast approach to the wall, 3 weeks adding fast push off attention and shaping towards the race. At the end of each sub period conventional and apnea-turns in both symmetrical stokes were filmed for time analysis.
Result and conclusion The comparison of conventional and apnea turns was based on the difference of times of various phases. Over 10 weeks a trend was that the differences became shorter. Five swimmers managed to execute apnea turns better. In the final race situation 25 underwater turns in both symmetrical stokes were analysed showing that the times for 30 m were shorter compared to the race analysis before the specific training period resulting in higher score points.
male female
Stroke Pretest Fina-Points
Posttest Fina-Points
Pretest Fina-Points
Posttest Fina-Points
Butterfly 428 456 458 475
Breaststroke 574 560 406 481
As a consequence girls and boys should be learn to practice the apnea turn to be make decision later which variant suits them best.
190 BMS2014—ABSTRACTS HANDBOOK
References Kishimoto, T., Takeda, T., Sugimoto, S., Tsubakimoto, S., Takagi, H. (2010) An Analysis of an Underwater Turn for Butterfly and
Breaststroke. In: P-L Kjendlie, R K Stallman & J Cabri (Eds) BMS XI. Published by the Norwegian School of Sport Science, Oslo. 108–109
Ungerechts B. E. & Klauck J. M. (2006) Consequences of non-stationary flow effects for functional attribution of swimming strokes. In: J.P. Vilas-Boas, F. Alves, A. Marques (eds.), BMS X. Portuguese Journal of Sport Sciences, Vol. 6, Suppl. 2, 109–111.
Presenter Dr Bodo E Ungerechts is member of the ‘Steering Group of the Conference Series -Biomechanics and Medicine in Swimming. He studied biology, sport science and mathematics. During the period he was completing his PhD Bodo was still an active swimmer and became a consultant of coaches to discuss aspects of propulsion in sport swimming, e.g. one of the swimmer he worked with established world record on 100 m breaststroke in 1977. Later he organised the education of top coaches for the German Swimming Federation and he is still acting as a lecturer. He conducted the first experimental tests for enterprises studying the influence of fabrics and swim wear on the swimmers’ speed. Presently Bodo working as Affiliated Professor at Bielefeld University/Germany, Dept. Neurocognition and Action Biomechanics.
POSTER 72 Stroke rate and stroke length profile when swimming at critical velocity assessed by a four-parameter model Rodrigo Zacca1,2, Felipe Collares Mora1, Camila Dias de Castro1, Marcos Franken1, Flávio Antônio de Souza Castro1 1Universidade Federal do Rio Grande do Sul, UFRGS, Brasil, 2CAPES Foundation, Ministry of Education of Brasil
Introduction The purpose of this study was to verify stroke rate (SR) and stroke length (SL) chosen by the swimmer when swimming at critical velocity calculated from the four-parameter model (CV4par).
Method Ten (seven males and three females) front crawl age group swimmers (15.6 ± 0.9 years old, 63.2 ± 7.7 kg body mass, 1.75 ± 0.09 m height, and 1.81 ± 0.1 m arm span and 277.3 ± 15.3 s = 80.0 ± 3.3% of the 25m pool World Record over 400 m freestyle) volunteered for this study. Within a 8-days period, swimmers performed maximum efforts of 50, 100, 200, 400, 800 and 1500 m in front crawl (randomised order and with 24h interval in-between). In a 2nd moment, they swam a rectangular test consisting of up to six sets of 10 min at CV4par (45 s recovery between each set) or until exhaustion. To determine swimming velocity, SR and SL for every 25 m for all trials and rectangular test, a 10 m sector was defined in the centre of the swimming pool to minimise the effects of swimmer’s impulse of each turn. Performances of all tests (50–1500m) were used to calculate individual CV4par as previously described by Zacca et al. (2010), i.e. expressing the swimming velocity as a function of time. SR and SL were normalised by the percentage of time swimming at CV4par along the rectangular test.
BMS2014—ABSTRACTS HANDBOOK 191

Results
Table 1 Mean and standard deviation of time and swimming velocity from each event, and CV4par SR, SL, distance and time when swimming at CV4par
192 BMS2014—ABSTRACTS HANDBOOK

Conclusions There is no stabilisation in SL and SR along the rectangular test at CV4par. SR increases and SL decreases, suggesting fatigue. This behaviour suggests that CV4par is performed in an intensity which is close to the upper boundary of the heavy intensity domain.
Reference 1 Zacca R; Wenzel BM; Piccin JS; Marcilio NR; Lopes AL; and Souza Castro FA. (2010) Critical velocity, anaerobic distance
capacity, maximal instantaneous velocity and aerobic inertia in sprint and endurance young swimmers. European Journal of Applied Physiology 110, 121–131.
Presenter Flávio Antônio de Souza Castro is from Federal University of Rio Grande do Sul, Brazil, where he teaches swimming and leads the Research Group in Aquatics Sports.
POSTER 73 Multidimensional connection between dry-land and in-water physical fitness in water polo players aged up to 14 years Zoran Bratusa1, Milivoj Dopsaj1, Zoran Milenkovic2 1University of Belgrade, Faculty of Sport and Physical Education, Serbia, 2Waterpolo Club ‘Partizan’, Serbia
Introduction Water polo players realise their process in water, as basic training, and as dry-land exercises as additional training. Both training forms are important and have their aims and tasks aimed at sports-training development of water polo players especially for junior players. As both training forms must be functionally anl logically connected wholes, this paper is aimed at determining the relation of dry-land and in-water physical fitness in water polo players aged up to 14 years.
Method The quantitative type of research included a sample of respondents consisting of 42 randomly chosen water polo players from the Republic of Serbia (average age 13.2±0.5 years, BH = 171.8±8 cm, BM = 63.5±8 kg, and length of training 4.36±1.43 years). The players were tested for general dry-land physical fitness (long jump; 10 push-ups; 30 s sit-ups; agility—bench sit and reach) and test battery indicating general physical fitness in pool (15m crawl; 25m crawl; 50m crawl; 200m crawl; 25 m legs crawl; 25 m breaststroke kicks; 25 m eggbeater kick; 25 m with head up; 25m swimming with the ball). The results are analysed by descriptive analysis, followed by multidimensional scoring transformation into the scores of general fitness of players in water and dry. By applying linear regression analysis the level of connection Between the observed variables of general dry-land and in-water physical fitness was established.
Results The results have showed that connection of general scores of dry-land and in-water physical fitness in water polo players aged up to 14 years is at the level of 20.4% (AdjR2 = 0.204) and is statistically significant on the level F=11.56, p=0.002.
Conclusion Based on the obtained results it can be concludes that it is of utmost importance that training process of water polo players aged 14 years is performed parallel both in water and out of the pool because this way more efficient positive transfer of mutual physical fitness of the players is in focus. Although the results indicate that positive connection of fitness in two different environments (water and dry land) only 1/5, while the remaining 80% of independence indicate the inevitability of both training methods, structurally and functionally connected so that they develop all physical features, is particularly important for regular sports-competitive development of junior water polo players.
References Bratusa, Z., Perisic, M., Dopsaj, M. (2010). General indexes of crawl swimming velocity of junior water polo players in a mach. In:
Kjendle, P-L., Stallman, R. K., Cabri, J. (Eds.). Biomechanics and Medicine in Swimming XI (p. 245–246), Oslo, Norway: Norwegian School of Sport Sciences.
Presenter Zoran Bratusa is a teaching assistant at the University of Belgrad, an associate lecturer at Sports Academy, Beograd and an associate lecturer at the College for Sport Coaches, Belgrad. He is a member of the Serbian Water Polo
BMS2014—ABSTRACTS HANDBOOK 193

Association and is on the board of the Sailing Association of Serbia. His research interests are the theory and method of water polo and the theory and method of sport training.
POSTER 74 Performance analysis of elite female water polo teams in World Championships 2013 Itaru Enomoto1, Daisuke Kobayashi2, Masaaki Suga3, Takahisa Minami4 1Kamakura Women’s University, 2Fujimura Swimming School, 3Oita Prefectural College of Arts and Culture, 4Naruto University of Education
Introduction This study aimed to compare the performance characteristics between high- and low-ranking teams in the female water polo tournament at the FINA World Championships 2013. Official scores of the said teams were subjected to notational analysis to generate performance indicators.
Method Data on 2,500 shots and 682 exclusion fouls were obtained from official score sheets, which were provided by the organising committee of FINA World Championships. Performance indicators were defined from official scores as follows: number of shots and goals by style (centre, action, 5 m, counter attack, exclusion, or penalty), shot results (goal, goal keeper (GK) saving), exclusion fouls (in field or in centre), goal percentage, and GK saving percentage for each style of shot. The playing frequency of the performance indicators in offence and defence were calculated per match. The 16 participating teams were divided into four groups based on their final rankings in the championships as follows: 1st to 4th teams (G1), 5th to 8th teams (G2), 9th to 12th teams (G3), and 13th to 16th teams (G4). All performance indicators were compared among the four groups to clarify the differences in performance characteristics by ranking. ANOVA or Kruskal-Wallis test and post-hoc tests were applied as statistical processing tools. The level of significance was set at p<0.05.
Results In terms of offence characteristics, G1 showed a significantly higher number of frequencies compared with the other groups in counter attack shots (2.4±2.4 vs. 0.5±0.6, 0.8±1.1, 0.5±0.8) and counter attack goals (1.7±2.0 vs. 0.3±0.5, 0.6±0.9, 0.3±0.6). G4 showed a significantly lower number of frequencies compared with the other groups in total shots (20.9±5.4 vs. 29.9±5.8, 30.5±5.6, 29.6±4.5) and action goals (1.2±1.3 vs. 3.5±2.8, 4.5±2.9, 2.3±2.3). As for defence characteristics, G1 showed a significantly lower number of frequencies than the other groups in action shots (7.4±3.6 vs. 12.0±4.9, 12.4±5.2, 12.9±5.4), total shots (24.1±5.7 vs. 28.5±5.0, 30.0±4.8, 34.1±6.5), and GK savings in counter attacks (0.6±0.9 vs. 0.1±0.4, 0.1±0.3, 0.1±0.3). G4 showed a significantly higher number of frequencies compared with the other groups in counter attack shots (2.8±2.7 vs. 0.6±1.0, 0.8±1.2, 0.9±1.5), action goals (5.9±3.9 vs. 1.3±1.1, 3.7±1.9, 3.1±2.2), centre goals (3.1±2.3 vs. 1.3±1.2, 1.0±1.2, 1.6±1.3), and GK saving percentage (20.5%±6.6% vs. 31.3±9.6%, 28.1±8.6%, 29.9±10.1%).
Conclusion This study showed the discrepancies for shots and GK saving among the ranked groups. Higher-ranking teams showed outstanding ability for counter attack in offence and defence. They likewise have a strong defensive capability in preventing opponents’ shots. Lower-ranking teams were worse than the other teams in action shots, centre shots, and counter shots. Their GK saving ability needed improvement to raise their final ranking in the international tournament.
Presenter Itaru Enomoto is a Member of Water Polo Committee, Japan Swimming Federation; Member of Science Committee, Japan Swimming Federation and a Member of Steering Committee, Japanese Society of Sciences in Swimming and Water Exercise.
194 BMS2014—ABSTRACTS HANDBOOK

POSTER 75 Effect of leg-sinking torque on energy expenditure during leg-kicking Rio Nara1, Syuntaro Ito1, Yasuhiro Baba1, Daisuke Sato2, Hiroshi Ichikawa1, Yoshimitsu Shimoyama1 1Niigata University of Health and Welfare, 2Fukuoka University
Introduction Leg-sinking torque is generated by the distance between the centre of mass (CM) and centre of buoyancy (CB) when the swimmer attempts to maintain the stream-line position. Although several studies have reported leg-sinking torque at a passive position, few have reported the effects of torque on energy expenditure during swimming. In addition, previous studies have suggested the generation of leg-sinking torque by both the arm-stroke and CM-CB distance during crawl-swimming, whereas the torque was generated only by CM-CB distance during leg-kicking. Therefore, the present study aimed to investigate the effects of leg-sinking torque generated by the CM-CB distance on energy expenditure during leg-kicking.
Methods To investigate the alterations in leg-sinking torque, two varieties of swimsuits were used: normal swimsuit (NS) and the loaded swimsuit (LS), which was secured with 2kg of lead. The study group comprised 10 competitive male college swimmers. The CM and CB measuring tests (Fig.1) were conducted using the reaction board method, and an intermittent-progressive test was conducted using the tethered leg-kicking method for evaluating the energy expenditure at every stage of tethered load.
B=W-(S1-L1)…(1)
B・XCB=W・XCM…(2)
Plug in (1) for (2)
XCB=W・XCM /(W-S1+L1)
CM-CB distance=XCB-XCM
Leg-sinking torque=CM-CB distance・B
L1Fig.1 Determining the CM-CB distance and leg-sinking torque
Results The CM-CB distance and leg-sinking torque were significantly greater with LS than with NS. Consequently, the energy expenditure at every stage of tethered load was significantly higher with LS than with NS (Fig.2).
0
500
1000
1500
2000
2500
3000
3500
1kg 1.5kg 2kg 2.5kg 3kg
Ener
gyEx
pend
iture
(ml/m
in)
負荷装着水着
ノーマル水着
LSNS
1.0 1.5 2.0 2.5 3.0
**
***
*P<0.05
Tethered load(kgf)
Fig.2 Changes in energy expenditure at every stage during tethered leg-kicking
Conclusion The findings of this study suggested that the leg- sinking torque would bear an effect on energy expenditure at various stages during tethered leg- kicking.
BMS2014—ABSTRACTS HANDBOOK 195

Reference Zamparo.P,et al. Effect of the underwater torque on the energy cost, drag and efficiency of front crawl swimming. European
Journal of Applied Physiology 73 195–201.1996.
Presenter Rio Nara is an assistant associate at Niigata University of Health and Welfare. She is a Coach of Swim Team at the University.
POSTER 76 Determination of optimum conditions in sprint-assisted training for competitive swimmers Tetsuya Tanaka1, Yutaka Yoshimura2, Yusuke Takahashi2, Michio Yasukawa3, Kazuo Oishi4 1Department of Industrial and Systems Engineering, Chuo University, Tokyo Japan, 2Institute of Health and Physical Sciences, Chuo University, Tokyo Japan, 3Faculty of Science and Engineering, Chuo University, Tokyo Japan, 4Department of Sport and Wellness, Rikkyo University, Saitama, Japan
Introduction As the outcome of a swimming race is decided by only a fraction of a second, many different training methods have been devised to improve performance. One such training method commonly used by coaches and competitive swimmers presently is sprint-assisted training. This training aims to improve the swimmers ability to apply force over a greater distance without decreasing the stroke rate. However, the most appropriate assist velocity is unknown.
Purpose The purpose of this study was to determine the most appropriate assist velocity for competitive swimmers during sprint-assisted training.
Methods The study included 8 male Japanese collegiate competitive swimmers. A pulling assist system with a velocity meter (Maglischo, 2003), including a wire line to pull the subjects, was used. This system recorded intracyclic velocity variations precisely during 25 m maximum effort freestyle swimming, with the assist velocity ranging from 2.0 m/s to 2.5 m/s. An underwater video analysis system was used to check the stroke technique of the subjects. Using the intracyclic velocity variations and the video data, the distance per stroke (DPS) and the stroke rate were determined. Each subject’s report of appropriate assist velocity was recorded through a structured interview individually.
Results The increment of DPS for each swimmer accompanied with the assist mean velocity enhancement (Jonckheere-Terpstra test, P < 0.038). There was no significant relationship between the stroke rate and the assist mean velocity (Jonckheere-Terpstra test, P < 0.128). The regression line obtained was as follows: Y = 1.215X − 0.4541 (where Y = DPS of the appropriate assist velocity, X = DPS of the assist mean velocity [2.2 m/s]). The findings showed a significant relationship between the DPS of the appropriate assist velocity and the DPS of the mean velocity (2.2 m/s) (R2 = 0.941, F = 96.77, P < 0.001).
Conclusion The findings of the present study revealed the optimum assist conditions for competitive swimmers.
Reference Maglischo, E. W. (2003) Swimming Fastest. Human Kinetics.
Presenter Tetsuya Tanaka is studying at the Department of Industrial and Systems Engineering, Graduate School of Science and Engineering, Chuo University, Tokyo where he is majoring in statistics.
196 BMS2014—ABSTRACTS HANDBOOK

POSTER 77 A simple field test for the assessment of aerobic swimming fitness: a multidimensional approach Milivoj Dopsaj1, Andrea de Nino2 1University of Belgrade Faculty of Sport and Physical Education, Belgrade, Serbia, 2ADN Swim Project, Italy
Introduction The aerobic energy system is basic for the support of a wide range of endurance effort in sport. Both in training and competition, swimmers will benefit from a well-developed aerobic energy system regardless of the type of performance required in sprint, middle distance or long distance swimming. The aim of this research was to define a simple, valid and user-friendly field test for the coach to assess the levels of actual aerobic fitness independent of the type of swimmer (sprint, middle or long distance), conducted by using only two simple variables: the swimming pace and the achieved lactate concentrations.
Method The sample consisted of 16 elite swimmers from different European countries (RS, RU and BA), with the freestyle as their main or first additional technique (10 males, age = 22.3±3.9 yrs, FINA 2013 score = 801±56; and 6 females, age = 19.1±2.6, FINA 2013 score = 707±59). Throughout the annual preparation cycle, all respondents swam the 12 x 100 m test in the regime of 1:30 min:sec using the crawl stroke as the model simulation of aerobic stress. All sets of the test series were measured by a chronometric method. On completion of full test set, after 60 seconds of recovery, capillary blood from the finger was sampled to determine lactate concentrations (NOVA Lactate Plus, USA). Multidimensional scaling was applied to the results of the average swimming pace in a series and of lactate concentrations in order to define the two-dimensional specification equation as the mathematical model for the assessment of aerobic swimming fitness. The level of aerobic fitness was expressed numerically, using the score scale between 0 and 100 points as a hypothetical minimum and maximum.
Results The results showed that the average aerobic model set of the swimming pace was: Males = 67.97±1.86 s, with lactate concentrations after 60 s of recovery at the level of 7.11±2.18 mmol/L; and Females = 72.01±1.35 s, with lactate concentrations after 60 s of recovery at the level of 7.63±2.86 mmol/L. The defined two-dimensional mathematical equations for the assessment of aerobic swimming fitness according to gender were: Males: y = 381.276—(Set mean time (s) 4.480)—(La after 60s of recovery ∙ 3.749), and for Females: y = 515.318—(Set mean time (s)∙6.153)-(La after 60s of recovery ∙ 2.913).
Conclusions The results showed that it was possible to define a mathematical model for a practical field test that can be used for managing the training process. This provides a practical tool that can allow coaches to control the efficiency of the applied training model with more accuracy, by assessing the adaptation of swimmers in terms of aerobic fitness.
References Olbrecht, J. (2000). The Science of Winning. Swimshop, Luton, England.
Presenter Milivoj Dopsaj, PhD, Vice dean for Science, Faculty of Sport and Physical Education, Professor, University of Belgrade, Belgrade, Serbia, Department of Theory and Technology of Sports Training Science Analysis and Diagnosis in Sport. Milivoj was national swim team member, and national swim record holder in former Yugoslavia from 1978 to 1989. He was a national team swim coach from 1990 to 1994, and from 2010 until now. Also, he was national triathlon coach from 1996 to 2001 and national youth age groups coach in waterpolo from 2002 to 2009 (U17 and U19). From 2009 to 2012 he was president of Serbian Swim Experts Committee, and from 2013 he is Vice-President of Serbian Swimming Federation. For the past 20 years his research interests have combined technology in science of sports training, competitive swimming, applied swimming abilities, metrology in sports and physical fitness testing.
BMS2014—ABSTRACTS HANDBOOK 197

POSTER 78 Competitive swim start safety: distance from the wall at maximum head depth Andrew Cornett1, Joel Stager2 1Eastern Michigan University, 2Indiana University
Introduction The majority of the research on competitive swim start safety has focused on the maximum head depth attained during execution of the start and head velocity at that depth. The attention to these two variables seems justified as governing bodies in the sport of swimming, such as the Fédération Internationale de Natation (FINA), mandate the minimum allowable water depth at the starting end of competitive pools, presumably as a means of protecting athletes executing starts from injury due to contact with the pool bottom. However, there is a third variable that must be considered when assessing start safety: the horizontal distance from the wall at maximum head depth (DIST). Current FINA rules state that the minimum water depth must be 1.35m at the starting end of the pool, extending from a distance of 1m from the starting wall to a distance of at least 6m. The purpose of the present analysis was to assess, based upon empirical observation and existent published data, whether or not this mandate is appropriate.
Method In particular, we recorded the group mean and maximum DIST for each study that provided such data and reviewed data obtained from starts we previously digitised.
Results Of the studies examined, we found the greatest group mean DIST to be 5.55 ± 0.45m when experienced competitive swimmers executed starts from a standard block. And when considering individual DIST values, we noticed that all four studies we analysed had at least one swimmer with a DIST value in excess of 6m.
Conclusion Maximum head depths during competitive swim starts commonly occur at distances exceeding the mandated distance at which minimum depth is to be measured and presumably maintained (i.e., 6m). While we cannot readily identify a specific distance from our analysis of the literature, we do know that the greatest reported distance from the starting wall at maximum head depth was 6.67m. From this, we recommend that competitive venue requirements be revised such that minimum depth is measured at and maintained for a distance of at least 7m from the starting wall.
Presenter Andrew Cornett did his graduate work at Indiana University where he completed master’s degrees in Exercise Physiology and Applied Statistics and a PhD in Human Performance. He is currently an Assistant Professor of Exercise Science at Eastern Michigan University.
POSTER 79 Examination of resistance training in competitive swimming Shoichiro Taba1, Hiroshi Ichikawa1, Masaru Matsunami2, Masahiro Taguchi1, Akihiro Kuriki1 1Fukuoka University, Fukuoka, Japan, 2Nishi-Nippon Junior College, Fukuoka, Japan
Introduction Power swim training, such as sprint-resisted swimming (Maglischo E.W. 2003), has been advocated as a method to increase the power output of muscles in competitive swimming. During such training, it is important to control the stroke rate (SR) and to maintain good swimming technique. To that end, this study is aimed at examining the influence that power swim training—having a controlled SR—has on a swimmer’s muscular activity.
Methods A well-trained male swimmer, who was a freestyle sprinter, participated in the experiment as a subject. The trials conducted were a 25-m front crawl swim under four conditions: I) normal maximal effort swimming, II) maximal effort swimming with a drag object, III) normal swimming with controlled SR as per Trial II, and IV) swimming with a drag object and controlled SR as per Trial I. A nylon parachute was attached to a belt on the swimmer’s waist in Trials II and IV. The SR was controlled using a waterproofed metronome attached to the swimmer’s head in Trials III and IV. In all the trials, surface EMGs on the eight muscles, were measured using a wireless surface EMG logger
198 BMS2014—ABSTRACTS HANDBOOK

system. The motion of the left arm while swimming was recorded by an underwater digital video camera mounted on the swimmer’s left side.
Results The SRs were 55.0, 45.1, 45.4 and 55.2 stroke/min in Trials I, II, III and IV, respectively. In the EMG analysis, the triceps brachii started activating between the arm entry and catch phase in all trials. It was observed that the activation of the triceps brachii fell in the latter half of the pull phase in Trials I, III, and IV.
Conclusion A resisted load in power swim training changes the SR and the power output of muscles. It was suggested that the controlling to increase the SR would not always have to place an extra load on the muscles, although the resisted load, such as the parachute, would produce more power output at push of the arm stroke.
References Maglischo E.W. (2003). Swimming Fastest. Human Kinetic.
Presenter Shoichiro Taba is the Fukuoka University swimming club head coach. He has specialised in research that is related to the practice.
POSTER 81 Development of a new software for analysing performance in competition Florence Garnier1,2, Djamel Benarab3, Ayman Al-Falou3, Antoine Verney4, Didier Chollet2, Philippe Hellard1 1Federation Francaise de Natation, 2CETAPS, University of Rouen, 3VISION ISEN, University of Brest, 4ACTRIS, Brest
Introduction Performance analysis in competition brings essential information concerning technical strategies used by swimmers. In 2009, the French Swimming Federation (FFN) started using the Swimwatch (NatriSoft Inc.) software permitting a reduction in the time needed to give results to the coaches.
For this protocol, mobile cameras are placed alongside of the pool. The operators are asked to manually and visually identify performance indicators of interest (e.g. reaction time, intermediate times, stroke rate, stroke length) during each lap of the race. For reliability, observations must be repeated a minimum of two times. However, there are multiple sources of errors (visual or manual imprecisions, parallax troubles…). Furthermore, many other nations have developed similar analysis processes. In order to achieve a technological advantage and to answer new requests from coaches, our main goal was to develop a software allowing operators to 1/ act more quickly and more practically, and 2/ calculate more parameters more precisely (respiratory frequency, kinematic parameters
Method The first goal was to design a more functional software. In this regard, our software allows for the use at a larger video screen improving the usability for the operators. Furthermore, the logical process has been reorganised so that only one view of the video is necessary to analyse all parameters. A huge data base has been created with more than 10,000 performance analysis, which allows the coaches and the analysts to readily compare within and between individuals and across competitive seasons.
The second goal involved two major scientific questions: first the calibration of the pool in international competition, and second the automatic recognition and tracking of the swimmers.
Concerning the improvement of the precision in the kinematic analysis, a transferable geometric model of the environment has been used, based on the standardised dimensions of the lanes enforced by the FINA. By integrating these known parameters, the calibration method developed effectively corrects to reconstruction errors attributed to the camera position.
The second major question involved how to develop a robust automatic tracking method that could maintain the swimmer in the field of view without any worn markers. The biggest difficulty lied in an ‘uncoupling effect’ (target loss, due to distortion, interferences or concealment). Overcoming uncoupling effect involved the collective use of temporal 3D and a multipist approach (even after a long concealment period).
BMS2014—ABSTRACTS HANDBOOK 199

Conclusions The first tests carried out with this software showed a good usability. The first results emphasised the importance of using multipist and temporal 3D for the automatic tracking of the swimmer. Other different techniques are now being tested to improve the speed and the validity of the tracking.
Presenter Dr Philippe Hellard is the Director of Research of the French Swimming Federation, Civil servant of the Ministry of Youth Sports and Associative Activities and Assistant to the Technical Director of the French Swimming Federation. Dr Hellard is also a researcher associated with the National Institute of Sports and Physical Education (INSEP) and a researcher associated with the Institute of Biomedical and Epidemiology Sports Research (IRMES). Dr Hellard is married with two children and lives in France.
POSTER 82 Relationship between heart rate variability and performance during taper and competition in elite swimmers Philippe Hellard1,2, Cecile Savin1, Christophe Hausswirth3, Jean-Francois Toussaint2,4, Philo Saunders5, David Pyne5 1French Swimming Federation, Paris, France, 2Institut de recherche en medecine et Epidemiologie du sport (IRMES), Paris, FR, 3Institut National du Sport de la Expertise et de la Performance, Paris, France, 4Centre da investigations en Medecine du sport (CIMS), Hatel, AP-HP, Paris, FR, 5Australian Institute of Sport, Canberra, ACT 2616, AUS
The aims of this study were to assess changes in heart rate variability (HRV) during a 3-week intensive training period, followed by 3 weeks of taper and one week of competition, and correlate changes in HRV with changes in performance (ΔP). In thirteen elite swimmers (6 female, 7 male Their mean age, body weight and height at inclusion in the study was 18,3 ± 1,2 years, 55 ± 3 kg, and 167 ± 5 cm for females and 19,2 ± 1,7 years, 74 ± 2 kg and 181 ± 5 cm for males. All subjects had a history of more than 5 years of practice at national and international level. Diurnal standard indices of HRV were assessed by time domain and spectral analysis at the end of each period in supine (SU), supine control breathing (CB) and standing position (ST), and compared to a control age-and sex-matched sedentary group. The weekly training volume performed in dry-land workout (DL) and for swimming, under and above the individual anaerobic threshold (respectively LI and HI) was recorded. During the taper the swimming training load decreased substantially as well as the parasympathetic indices in standing position SD1ST (28.7 ± 18.8 vs. 18.8 ± 14.3 ms); RMSSD ST (40.6 ± 41.3 vs. 26.5 ± 20.2 ms); HFST, (1141.9 ± 2733.6 vs. 400.7 ± 608.8 ms2) (P<0.05). Conversely, during the competition period, several HRV indices increased pNN50SU, (0.19 ± 0.08 vs. 0.22 ± 0.09%); RMSSDSU, (68.4 ± 32.7 vs. 82.2 ± 35.9 ms); LFSU, (2301.7 ± 1699.5 vs. 2491 ± 1690 ms2); SD1CB, (55.7 ± 22.7 vs. 70.1 ± 38.1 ms); RMSSDCB, (78.4 ± 31.9 vs. 98.3 ± 53.3 ms); HFCB, (3694.2 ± 2482.5 vs. 5342.9 ± 4403.4 ms2); (P<0.05). Improvement in ΔP was positively correlated with an increase in HFCB and a decrease in LFCB expressed in normalised units (r²=0.64, r²=-0.64, P<0.05). The decrease in low intensity training during the competition was correlated to the increase in LF/HFCB (r² = 0.64, P<0.05). Heart rate variability decreased during taper and increased during competition. During the competition week, low intensity training was associated with a higher maintenance of parasympathetic modulation.
Presenter Dr Philippe Hellard is the Director of Research of the French Swimming Federation, Civil servant of the Ministry of Youth Sports and Associative Activities and Assistant to the Technical Director of the French Swimming Federation. Dr Hellard is also a researcher associated with the National Institute of Sports and Physical Education (INSEP) and a researcher associated with the Institute of Biomedical and Epidemiology Sports Research (IRMES). Dr Hellard is married with two children and lives in France.
POSTER 83 Can swimmers with Down syndrome follow a visual pacer in an incremental protocol? Ana Querido1, Rui Corredeira1, João Paulo Vilas-Boas1, Daniel Daly2, Ricardo Fernandes1 1University of Porto, Cifi2D, 2KULeuven, Belgium
Introduction Down syndrome (DS) is one of the most common genetic cause of intellectual disability. Despite this, there is a very pronounced lack of knowledge on factors leading to sport success in these individuals, particularly in swimming. The aim of this study was to verify if swimmers with DS are able to follow a visual pacer, and also maintain their velocity when swimming without the pacer.
200 BMS2014—ABSTRACTS HANDBOOK

Method Eight male swimmers with DS, all participants at the 2nd European Swimming Championships for DS participated in the study. All swimmers performed a 4x100 m front crawl incremental protocol. Each 100 m was divided in 2x50 m with a 10 sec rest. After each 100 m, swimmers stopped for 1 min. First 50 m were conducted with the visual pacer (Pacer 2 Swim, by KulzerTEC), and second 50 m without the pacer. In this case, the swimmers should maintain the same speed of the first 50 m. The 4x100 m speed was 75%, 80%, 85%, and 90% from each swimmer best time at the 100 m front crawl, from the 1st until the 4th repetition. All swimmers performed 3x50 m at the 1st pace speed with the lights on, in order to become familiar with the device. Correlations were performed with the SPSS 17.0 between the 50 m with pacer, and without pacer, and between the 50 m with pacer and target time, and 50 m without pacer and target time, for all intensities. Global correlations were also analysed. Significant differences were set at 0.05.
Results For all swimming intensities, the only significant correlations were found between 50 m with the pacer and the target time (0.82 for 75%, 0.92 for 80%, 0.90 for 85%, and 0.98 for 90%). With all intensities together, significant correlations were found. Nevertheless, there were only observable high correlations between swimming with the pacer and target time (0.90); a correlation of 0.51 was found between swimming with and without the pacer, and a correlation of 0.46 was found between swimming without the pacer and the target time.
Conclusion DS swimmers seem capable of follow the visual pacer, even at an incremental protocol. Also, these swimmers were not able to maintain the swimming speed when performing the 50 m without pacer. Therefore, non significant correlations were found between swimming with and without the pacer, and between swimming without the pacer and the target time. As a conclusion, we might refer that the swimming pacer may be a helpful training instrument for training swimmers with DS.
References Irving C., Basu A., Richmond S., Burn J. & Wren C. (2008) Twenty-year trends in prevalence and survival of Down syndrome.
European Journal of Human Genetics 16 (11), 1336–40.
Presenter Ana Querida is a PhD student studying swimming and Down syndrome.
POSTER 84 Differences in stroke length, frequency and velocity for the men’s 100m long course freestyle for international and Norwegian finalists Bjørn Harald Olstad1, Halvor Ekeland1 1Norwegian School of Sport Sciences, Department of Physical Performance, Norway
Introduction Race analysis (RA) data on where improvements are needed in order for national swimmers to reach the international level is scarcely found. In Norway, only one study about RA has been published (Kjendlie et al. 2006). The purpose of this study was therefore to use RA for investigating differences in stroke length (SL), stroke frequency (SF) and swimming velocity (SV) during different segments of a race in order to compare finalists in the men’s 100m long course freestyle from international championships (IF) with national finalists (NF).
Method Thirty-two swimmers were divided into two groups. IF consisted of the eight finalists from the European championship 2011 and the World championship 2012. NF consisted of finalists from the Norwegian championship the same years. All races were recorded using a Canon HV40, filming at 25 frames/sec. The camera was placed approximately at 25m and between 2–5m above the water surface. The races were divided into different segments, 0–15m, 15–25m, 25–35m, 35–45m, 50–65m, 65–75m, 75–85m, 85–95m and 95–99,5m. The average of two stroke cycles in each segment was analysed for SL, SF and SV using Kinovea 0.8.15 (www.kinovea.org).
Results Significant differences between IF and NF are shown in Table 1.
BMS2014—ABSTRACTS HANDBOOK 201

IF had a large decrease in SL from 2.39m at the 25–35m segment to 2.3m between 35–45m. NF had a smaller decrease from 2.28m to 2.26m. SF also decreased more for IF (53.71 to 52.11 strokes/min) than for NF (50.23 to 49.61), indicating that this segment NF lost the least SV to IF.
Conclusions The significantly lower SV throughout the race for NF is due to shorter SL and lower SF compared to the IF. Even though NF only showed significant lower SL in certain segments of the race there is still a clear tendency for SL to be too low throughout the whole race. NF should also focus on the 25–35m segment of the race where they lose the most SV to IF.
References Kjendlie, P.-L., et al. (2006). Stroke frequency strategies of international and national swimmers in 100m races. Portuguese J of
Sport Sciences, 6 (Suppl. 2), 52–54.
Presenter Bjørn Harald Olstad is an assistant professor at the Norwegian School of Sport Sciences in Oslo. He is currently working towards his PhD: Muscle activation and kinematics in contemporary breaststroke swimming, containing surface electromyographic measurements and three dimensional motion in swimming. He holds a master’s degree on how to coach age-group swimmers for future success and was a former National team member in swimming and lifesaving. He previously worked for the United States Olympic Committee, United States Swimming and with several swim clubs as performance director and coach.
POSTER 86 Shot velocity and technical–tactical variables in elite water polo: Australia versus finalist teams in the 2013 World Championships Sofia Canossa1, Jose Arturo Abraldes2, Joao Pedro Castro3, Susana Maria Soares4, Ricardo Fernandes5, Julio Manuel Garganta6 1Center of Research, Education, Innovation and Intervention in Sport (CIFI2D), Fa, 2Faculty of Sports Sciences, University of Murcia, Spain, 3Faculty of Sport, University of Porto, 4Center of Research, Education, Innovation and Intervention in Sport (CIFI2D), Fa, 5Laboratory of Biomechanics of Porto, Faculty of Sport, University of Porto (LABI, 6Center of Research, Education, Innovation and Intervention in Sport (CIFI2D), Fa
The throwing ability is identified as one of the most decisive actions in the game. The high level competitions are ideal moments to study the elite performance. The purpose of the present study was: (i) to find if there are differences of shooting speed between Australian national team and the finalists of the 2013 world championships; (ii) to find if there are differences regarding the percentage of occurrence of shooting type, provenance action before the shot, defensive blocking and men up play; (iii) to reveal the efficacy values and offensive productivity of the two groups.
202 BMS2014—ABSTRACTS HANDBOOK

Throwing velocities (319 shots) of 11 water polo matches were assessed, in the last water polo world championships (Hungary, Montenegro and Australian national teams). The games were recorded for posterior observation and analysis. The official information of the tournament (Omega) was also used. Throwing velocities were assessed with radar[1] (StalkerPro, USA). Observation methodology was applied and conducted by two experts, and, technical-tactical variables were chosen considering previous researches.[2,3] Efficacy values and game offensive productivity where computed, taking in account the coefficients of efficacy explained in several studies[1]. Means plus standard deviations of shot velocity were calculated for descriptive data analysis. Normality of data was checked (kolmogorov-smirnov test). An independent sample T-Test was applied to determine differences in throwing velocities between groups. Frequencies of occurrence of each variable were calculated and compared trough a Chi-Square Test. Significance level was set at 5%. All analyses were conducted using SPSS for Windows (v.18).
As the findings, no differences were found for Mean±SD shooting speed between Australia and the finalist, in the total of throws and in the goal shots (18.28±2.54vs.18.59±2.94 m.s-1 and 18.87±2.61vs.18.64 ±2.97 m.s-1). Also, it was not found difference on the shooting type and in the occurrence of direct opposition to the shot. However, the finalists show a tendency to throw at goal without frontal defensive block, more than Australian team (52.2%vs.44.7%). It was found significant difference in the provenance of the shot between groups, being the assistance via dry pass the most frequent and chosen by the finalist teams (55.8%vs.39.8%) whereas Australia opts most frequently for the assistance to the water (43.7%vs.24.5%). Also, it was found significant difference on the occurrence of men up plays (20.4%vs.36.1%). Absolute and relative throw efficacy, and also, the offensive productivity of Australian team vs. the finalists were respectively 18.52%vs.26.66±3.90%, 28.30%vs.38.75±4.82% and 65.43%vs.68.60±1.54%.
The findings of the present study lead to the inference that the main difference of the two study groups must be related with performance indicators of tactical nature, such as group and team tactical resources. Further investigations focused in notational analysis should be conducted for the development of Australian water polo, aiming to improve their sport performance.
References 1 Vila H, Abraldes JA, Alcaraz PE, Rodríguez N, Ferragut C. Tactical and shooting variables that determine win or loss in top-
Level in water polo. Int J Perform Anal Sport 2011; 11:486–98.
2 Hughes,MD and Bartlett, RM. The use of performance indicators in performance analysis. J Sports Sci 2002; 20: 739–754.
3 Lupo C, Tessitore A, Capranica L. Notational analysis of elite and sub-elite water polo matches. J Strength Cond Res 2010; 24(1): 223–9.
Presenter Professor Ricardo J Fernandes was a swimmer and coach at club, regional and national Portuguese teams. Had graduated in Sport Sciences at the Faculty of Sport, University of Porto and achieved master’s degree, also in sport sciences (specialised in high performance sports—swimming). In the same institution he conducted his Ph D on Sport Sciences regarding the characterisation of time to exhaustion at the swimming velocity corresponding to VO2max. Recently we presented his Habilitation on Sport Sciences. He develops research, manly, in the area of the biophysical characterisation specially centred on the availability and use of energy in aquatic activities (e.g. swimming, rowing and surfing). He is also interested in planning and periodisation, and training control and evaluation of athletes in cyclic and team sports. He publishes papers on scientific journals in a regular basis, presenting an h index of 11.
BMS2014—ABSTRACTS HANDBOOK 203

Index of presenters
A
Abouzeid, Magdy .................................................................. 91, 104
Alcock, Alison ................................................................................ 83
Allen, Sian ................................................................................... 129
Arellano, Raul ........................................................................ 76, 172
Atkison, Ryan ...................................................................... 113, 164
Avalos, Marta ................................................................................ 82
B
Banks, Joseph .............................................................................. 126
Barber, Mike ................................................................................. 47
Barbosa, Tiago .............................................................. 79, 137, 138
Barden, John ................................................................................. 47
Bathgate, Amy ............................................................................ 147
Becker, Theodore .......................................................................... 48
Blanch, Peter ................................................................................. 30
Blitvich, Jenny ............................................................................. 109
Brammer, Chris ........................................................................... 120
Bratusa, Zoran ............................................................................. 193
Burkhardt, David ......................................................................... 149
C
Chainok, Phornpot ...................................................................... 181
Chiu, Chuang-Yuan ........................................................................ 50
Chollet, Didier ............................................................................... 58
Clarys, Jan Pieter ........................................................................... 57
Cohen, Raymond ........................................................................... 28
Colantonio, Emilson ...................................................................... 33
Cornett, Andrew ................................................................. 111, 198
Cossor, Jodi ................................................................................. 112
Costa, Mario................................................................................ 150
Costill, David ................................................................................. 28
D
Dahl, Dagmar .............................................................................. 100
de Jesus, Karla ............................................................................... 65
de Jesus, Kelly ............................................................................. 117
de Souza Castro, Flávio Antônio ......... 56, 62, 92, 145, 146, 182, 191
Dekerle, Jeanne ............................................................................ 40
Dopsaj, Milivoj .................................................................... 123, 197
Doring, Brett ............................................................................... 132
Dyshko, Boris ................................................................................ 95
E
Enomoto, Itaru ............................................................................ 194
F
Fernandes, Ricardo ................................................ 90, 173, 178, 202
Fischer, Sebastian ............................................................... 116, 148
Fish, Frank ..................................................................................... 26
Fricker, Peter................................................................................. 29
Fujishima, Haruka ....................................................................... 189
Funai, Yuki ................................................................................... 176
G
Gobbi, Ronaldo Bucken ................................................................. 67
Gomes, Lara Elena ....................................................................... 157
Gonjo, Tomohiro ........................................................................... 61
Greco, Camila Coelho .............................................................. 55, 68
H
Hara, Hideki ................................................................................... 60
Harrison, Simon ............................................................................. 73
Havriluk, Rod ................................................................................. 32
Hazrati, Pendar .............................................................................. 36
Hellard, Philippe ...................................................... 26, 59, 199, 200
Hindmarch, Torill ........................................................... 99, 110, 119
Homma, Miwako ........................................................................... 51
I
Ichikawa, Hiroshi ........................................................................... 77
Ikuta, Yasushi .............................................................................. 154
J
James, Marion ............................................................................. 126
Jigami, Hirofumi .......................................................................... 133
Jones, Clare ................................................................................. 161
K
Kaneda, Koichi ............................................................................. 131
Kibele, Armin ................................................................................. 64
Kobayashi, Keisuke ...................................................................... 156
Kochergin, Alexander .................................................................... 95
Kojima, Kosuke .............................................................................. 80
Komar, John ........................................................................ 115, 128
Kudo, Shigetada ............................................................................ 75
Kuriki, Akihiro .............................................................................. 170
L
Langendorfer, Steve ...................................................................... 29
Lyttle, Andrew ............................................................................. 107
M
Machtsiras, Georgios ............................................................. 58, 183
Maloney, Michael .......................................................................... 37
Marinho, Daniel A ....................................................... 101, 167, 174
Martens, Jonas ...................................................................... 84, 169
Mason, Bruce ................................................................................ 34
Matsuda, Yuji .............................................................................. 154
McCabe, Carla ............................................................................... 47
McGowan, Courtney ..................................................................... 43
Meliscki, Gustavo Antonio........................................................... 183
Mitchell, Lachlan ........................................................................... 41
Moriyama, Shinichiro .................................................................. 139
204 BMS2014—ABSTRACTS HANDBOOK

Morris, Kirstin ................................................................................ 70
Mourao, Luis ............................................................................... 107
N
Nakashima, Motomu ........................................................... 106, 144
Nara, Rio ...................................................................................... 195
Narita, Kenzo ............................................................................... 155
Newton, Robert ............................................................................. 27
Nomura, Teruo ............................................................................ 114
O
Ogita, Futoshi ................................................................................ 72
Ogle, Whitney.............................................................................. 171
Ohba, Masaaki ............................................................................. 153
Ohgi, Yuji ..................................................................................... 184
Oliveira, Nuno ............................................................................... 77
Olstad, Bjørn Harald ........................................ 96, 99, 136, 164, 201
Onodera, Sho ................................................................................ 87
P
Paivinen, Marja ........................................................................... 124
Payton, Carl ........................................................................... 63, 185
Pessoa Filho, Dalton .................................................................... 103
Petriaev, Alexander ....................................................................... 81
Potdevin, François ............................................................... 121, 122
Puel, Frederic ........................................................................ 69, 127
Q
Querido, Ana ............................................................................... 200
R
Rejman, Marek ............................................................................ 160
Ribeiro, João .................................................................................. 85
Rodriguez, Ferran A ................................................. 44, 45, 102, 180
Rozi, Georgia ................................................................. 67, 175, 188
S
Sacilotto, Gina ............................................................................... 78
Saito, Tatsuya .............................................................................. 179
Samson, Mathias ......................................................................... 168
Sanders, Ross ................................................................................ 92
Sasaki, Yosuke ............................................................................... 42
Savage, Melissa .......................................................................... 130
Schuller, Thorsten ......................................................................... 41
Seifert, Ludovic ...................................................... 93, 114, 140, 141
Sengoku, Yasuo ............................................................................. 52
Shephard, Megan ......................................................................... 33
Shimojo, Hirofumi ....................................................................... 152
Shimoyama, Yoshimitsu ................................................................ 54
Shin, Sakai ................................................................................... 151
Silva, Ana ...................................................................................... 49
Silva, Antonio J..................................................................... 158, 159
Smith, Nicholas ........................................................................... 166
Sousa, Ana .................................................................................... 89
Stager, Joel ................................................................................... 39
Stallman, Robert Keig .............................. 46, 98, 108, 118, 186, 187
Suito, Hiroshi .............................................................................. 159
Sweetenham, Bill .......................................................................... 25
T
Taba, Shoichiro ........................................................................... 198
Takagi, Hideki ............................................................................. 105
Tanaka, Tetsuya .......................................................................... 196
Tanigawa, Tetsuro ...................................................................... 139
Tor, Elaine ..................................................................................... 66
Tsunokawa, Takaaki .................................................................... 125
U
Ungerechts, Bodo E ............................................... 74, 134, 142, 190
V
Vantorre, Julien ............................................................................ 93
Vilas-Boas, João Paulo ............................... 25, 38, 71, 135, 162, 163
Vorontsov, Andrei ....................................................................26, 53
W
Wada, Takuma .............................................................................. 88
Watanabe, Yasunori ................................................................... 165
Waters, Amy ................................................................................. 31
Wright, Brian .............................................................................. 124
Z
Zanetti Freire, Roberto ..........................................................97, 143
Zoretic, Dajana............................................................................ 177
BMS2014—ABSTRACTS HANDBOOK 205