minerals.usgs.gov€¦ · xls file · web view · 2010-08-05t23 t22 t21 t20 t19 t18 t17 t16 t15...
TRANSCRIPT

This file includes an advance release of the report as it will appear in the USGS Minerals Yearbook 2008, volume III, Area Reports—International.
The Mineral Industries of Latin America in 2008 [advance release]This workbook includes an embedded Word document and 23 tables (see tabs below).
This icon is linked to an embedded text document. Double-click on the icon to view the text document.
Posted: August 5, 2010
Latin America 2008 Text

TABLE 1THE AMERICAS: AREA AND POPULATION IN 2008
Region and country (square kilometers) (thousands)North America:
Canada 9,984,670 33,311Mexico 1,964,375 106,350
9,826,675 304,060Total 21,775,720 443,721
Central America and the Caribbean:Antigua and Barbuda 443 86Aruba 193 105Bahamas, The 13,940 335Barbados 431 255Belize 22,966 310Bermuda 53 64Costa Rica 51,100 4,527Cuba 110,860 11,247Dominica 754 73Dominican Republic 48,730 9,838El Salvador 21,040 6,134Grenada 344 106Guadeloupe 1,780 448Guatemala 108,890 13,676Haiti 27,750 9,780Honduras 112,090 7,242Jamaica 10,991 2,689Martinique 1,100 402Montserrat 102 5,100###Netherlands Antilles 960 194Nicaragua 129,494 5,678Panama 78,200 3,395Saint Kitts and Nevis 261 49Saint Lucia 616 170Saint Vincent and the Grenadines 389 109Trinidad and Tobago 5,128 1,338
17,154 4,187Total 765,759 87,537
South America:Argentina 2,780,400 39,876Bolivia 1,098,580 9,684Brazil 8,514,875 191,972Chile 756,950 16,758Colombia 1,138,915 44,534Ecuador 283,560 13,479French Guiana 83,534 222Guyana 214,970 763Paraguay 406,750 6,227Peru 1,285,215 28,837Suriname 163,820 515Uruguay 176,215 3,334Venezuela 912,050 27,943
Total 17,815,834 384,144Americas total 40,357,313 915,402World total 148,940,000 6,692,030
U.S. Virgin Islands.
Area1 Estimated population2
United States3
Other4
1Source: U.S. Central Intelligence Agency, The World Factbook 2009.2Source: The World Bank, 2008 World Development Indicators Database.3Excludes Puerto Rico and U.S. Virgin Islands4Includes Anguilla, British Virgin Islands, Cayman Islands, Puerto Rico, Turks and Caicos Islands, and
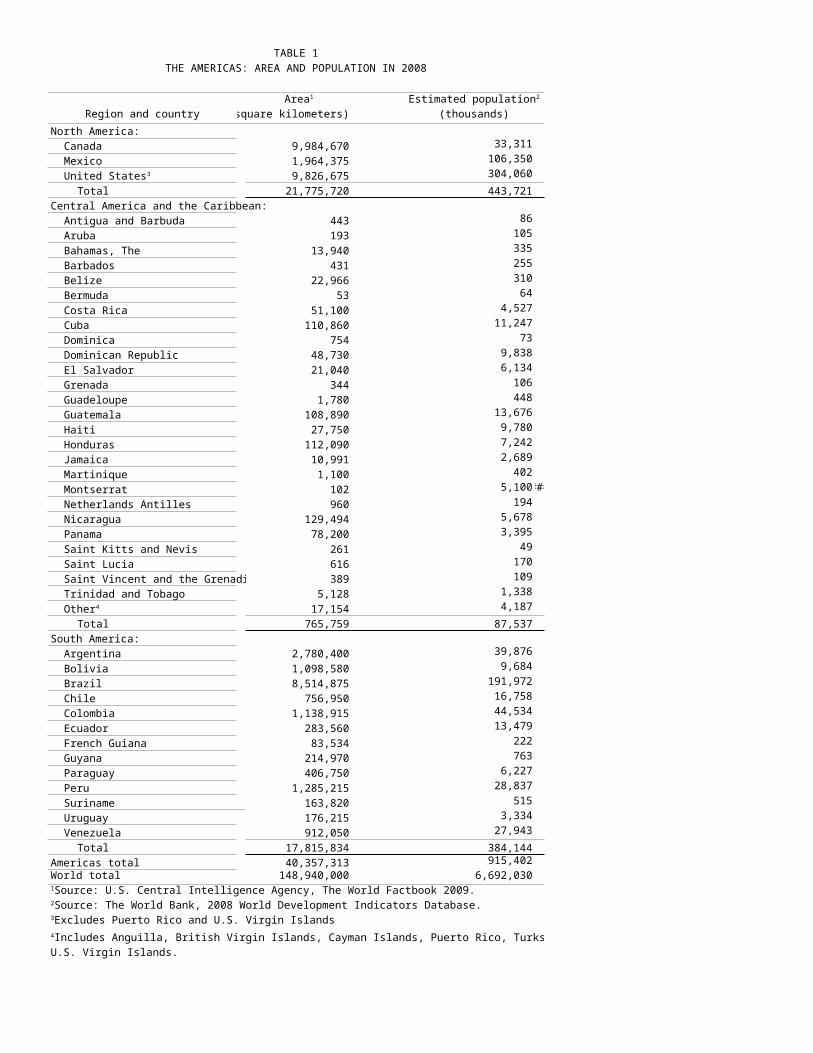
TABLE 2
Gross domestic product based on Real gross domestic productpurchasing power parity growth rate
Gross value Per capita (percentage)Region and country (million dollars) (dollars) 2006 2007 2008
North America:Canada 1,300,410 39,098 2.9 2.5 0.4Mexico 1,550,540 14,120 5.1 3.3 1.3United States 14,441,430 47,439.93 2.7 2.1 0.4
Total 17,292,380 XX XX XX XXCentral America and the Caribbean:
Antigua and Barbuda 1,627 19,340 12.4 6.9 2.8Aruba NA NA NA NA NABahamas, The 9,383 27,735 4.3 0.7 -1.7Barbados 5,231 18,977 3.2 3.4 0.2Belize 2,548 7,954 4.7 1.2 3.8Bermuda NA NA NA NA NACosta Rica 48,663 10,735 8.8 7.8 2.6Cuba NA NA NA NA NADominica 727 10,133 3.8 1.8 3.2Dominican Republic 76,728 8,619 10.7 8.5 5.3El Salvador 43,748 7,564 4.2 4.7 2.5Grenada 1,181 11,464 -2.3 4.9 2.2Guadeloupe NA NA NA NA NAGuatemala 67,117 4,907 5.4 6.3 4.0Haiti 11,570 1,317 2.3 3.4 1.2Honduras 32,779 4,275 6.7 6.3 4.0Jamaica 24,199 8,967 2.7 1.5 -1.0Martinique NA NA NA NA NAMontserrat NA NA NA NA NANetherlands Antilles NA NA NA NA NANicaragua 16,709 2,698 3.9 3.2 3.2Panama 38,667 11,362 8.5 11.5 9.2Saint Kitts and Nevis 732 13,826 5.3 0.9 2.4Saint Lucia 1,827 10,750 5.0 1.7 0.7Saint Vincent and the Grenadines 1,087 10,163 7.6 7.0 0.9Trinidad and Tobago 26,536 20,338 13.5 4.6 2.3
85,558 XX XX XX XXTotal 496,617 XX XX XX XX
South America:Argentina 572,668 14,408 8.5 8.7 6.8Bolivia 43,570 4,345 4.8 4.6 6.1Brazil 1,984,450 10,466 4.0 5.7 5.1Chile 243,357 14,529 4.6 4.7 3.2Colombia 397,249 8,229 6.9 7.5 2.5Ecuador 108,389 7,786 3.9 2.5 6.5French Guiana NA NA NA NA NAGuyana 3,082 4,029 5.1 5.4 3.0Paraguay 29,451 4,786 4.3 6.8 5.8Peru 246,283 8,594 7.7 8.9 9.8Suriname 4,364 8,188 4.5 5.4 6.0Uruguay 42,624 12,785 4.6 7.6 8.9Venezuela 359,210 12,806 10.3 8.4 4.8
Total 4,034,697 XX XX XX XXAmericas total 21,823,694 XX XX XX XXWorld total 69,489,850 XX XX XX XXNA Not available. XX Not applicable.
in source or date of reporting.
THE AMERICAS: GROSS DOMESTIC PRODUCT1, 2
Other3
1Source: International Monetary Fund, World Economic Outlook Database, October 2009.2Gross domestic product listed may differ from that reported in individual country chapters owing to differences

3Includes Anguilla, British Virgin Islands, Cayman Islands, Puerto Rico, Turks and Caicos Islands, and U.S. Virgin Islands.

TABLE 3
Location Site Commodity CompanyArgentina E Cerro Negro Au, Ag Andean Resources Ltd. 1.5 Moz Au, 17.3 Moz Ag Extensive work program.
Do. P Cerro Vanguardia Au, Ag Anglogold Ashanti Ltd. 3.1 Moz Au, 55.9 Moz Ag Extensive drilling.Brazil P Corrego do Sitio Au Do. 1.47 Moz Au Do.
Do. D Lamego Au Do. Data not released Do.Canada E Afton Cu, Au Abacus Mining and Exploration Corp. 1.1 Mt Cu, 2.3 Moz Au Extensive drilling.
Do. E Berg Cu, Mo, Ag Terrane Metals Corp. 1.1 Mt Cu, 136,000 t Mo, 25.4 Moz Ag Do.Do. F Bloom Lake Iron ore Consol. Thompson Iron Mines Ltd. 190 Mt Fe Extensive work program.Do. E Central Mineral Belt U, V Crosshair Exploration & Mining Corp. Do.Do. F Detour Lake Au Detour Gold Corp. 10.8 Moz Au Extensive drilling.Do. E Eleonore Au Goldcorp Inc. 2.5 Moz Au Extensive work program.Do. E Foxtrot Diamond Stornoway Diamond Corp. 6.96 Mcarat diamond Extensive drilling.Do. F Gahcho Kue Diamond De Beers Canada Exploration Inc. 23.6 Mcarat diamond Do.Do. F Hidden Bay U Cameco Corp. Do.Do. E Joanna Au Aurizon Mines Ltd. 438,000 oz Au Do.Do. E Kerr-Sulphurets Au, Cu Seabridge Gold Inc. 19.7 Moz Au, 2.4 Mt Cu Extensive work program.Do. E Kwanika Au, Cu Serengeti Resources Inc. Data not released Do.Do. E Lalor Lake Zn, Cu, Au, Ag HudBay Minerals Inc. 300,000 t Zn, 24,000 t Cu, 210,000 oz Au, 2.2 Moz Ag Do.Do. E Larder Lake Au Bear Lake Gold Ltd. Data not released Extensive drilling.Do. E Magusi River Cu, Zn, Au, Ag Globex Mining Enterprises Inc. 27,600 t Cu, 43,100 t Zn, 49,800 oz Au, 1.8 Moz Ag Do.Do. F Malartic Au Osisko Mining Corp. 7.7 Moz Au Extensive work program.Do. E Matoush U Strateco Resources Inc. Extensive drilling.Do. E Meliadine West Au Comaplex Minerals Corp. 1.8 Moz Au Do.Do. E Midwest Northeast U Hathor Exploration Ltd. Data not released Do.Do. E New Britannia Au Garson Gold Corp. 449,000 oz Au Do.Do. E Nunavik Nickel Ni, Cu, Co, PGE, Au Canadian Royalties Inc. 162,000 t Ni, 198,000 t Cu, 8,700 t Co, Extensive work program.
1.5 Moz PGM, 84,000 oz AuDo. E Rambler Cu, Au, Ag, Zn Rambler Metals and Mining plc. 184,000 t Cu, 97,500 oz Au, 688,000 oz Ag, 6,700 t Zn Extensive drilling.Do. E Roche Bay Iron ore Advanced Explorations Inc. Data not released Do.Do. E Ruddock Creek Zn, Pb Selkirk Metals Corp. Data not released Do.Do. E Sisson Brook W, Mo Geodex Minerals Ltd. Do.Do. E Young-Davidson Au Northgate Minerals Corp. 3.3 Moz Au Do.
Chile E Apoquinda Cu Apoquindo Resources Inc. 200,000 t Cu Do.Do. E El Espino Au, Cu Explorator Resource Inc. 282,000 oz Au, 142,000 t Cu Do.Do. P Escondida Cu BHP Billiton Ltd. 34 Mt Cu Do.Do. E Pan de Azucar Cu, Au, Ag, Mo Centenario Copper Corp. 168,000 t Cu, 230,000 oz Au, 2.4 Moz Ag, 3,900 t Mo Extensive work program.Do. E Pelusa Cu Do. 160,000 t Cu Extensive drilling.Do. P Zaldivar Cu Barrick Gold Corp. 3.1 Moz Au Extensive work program.
Colombia F Angostura Au, Ag Greystar Resources Ltd. 11.6 Moz Au, 61.7 Moz Ag Extensive drilling.Do. E Gramalote Au B2Gold Corp. 2.4 Moz Au (inferred) Do.
Mexico E Camino Rojo Au, Ag, Zn, Pb Canplats Resources Corp. 3.5 Moz Au, 60.7 Moz Ag, 600,000 t Zn, 310,000 t Pb Do.Do. E Juanicipio Ag, Au, Pb, Zn Mag Silver Corp. 237 Moz Ag, 480,000 oz Au, 169,000 t Pb, Do.
288,000 t Zn (inferred)See footnotes at end of table.
SELECTED SIGNIFICANT LATIN AMERICA AND CANADA EXPLORATION IN 20081
Type2 Resource3 Exploration4
3,400 t U3O8, 5,300 t V2O5
8,500 t U3O8
1,700 t U3O8
149,000 t WO3, 49,000 t Mo

TABLE 3—Continued
Location Site Commodity CompanyNicaragua F Orosi Au Central Sun Mining Corp. 709,000 oz Au Extensive drilling.Peru E La Granja Cu, Zn Rio Tinto plc 14.1 Mt Cu, 2.8 Mt Zn Do.
Do. P Tintaya Cu, Au, Mo, Ag Xstrata plc 3.7 Mt Cu, 2 Moz Au, 26,300 t Mo, 31.4 Moz Ag Do.
V, vanadium; and Zn, zinc. Abbreviations used in this table for units of measurement are as follows: Mcarat, million carats; Moz, million troy ounces; Mt, million metric tons; oz, troy ounces; t, metric tons.
SELECTED SIGNIFICANT LATIN AMERICA AND CANADA EXPLORATION IN 20081
Type2 Resource3 Exploration4
1Abbreviations used in this table for commodities are as follows: Au, gold; Ag, silver; Co, cobalt; Cu, copper; Mo, molybdenum; Ni, nickel; Pb, lead; PGE, platinum-group elements; U, uranium;
2D—Approved for development; E—Active exploration; F—Feasibility work ongoing/completed; P—Exploration at producing site.3Based on 2008 data reported from various sources, resource values reflect measured + indicated resources, unless otherwise reported. Data not verified by the U.S. Geological Survey.4Significance of activity defined by either quantity of drilling or investment expenditure for exploration work program.

TABLE 4
(Thousand metric tons unless otherwise specified)
Metals Copper, Nickel, Silver, Tin, mine
Aluminum mine Gold, Iron and steel Lead, mine mine mine output, output, Metal, output, Au content Iron ore, output, output, Ag content Sn content
Country Bauxite primary Cu content (kilograms) gross weight Steel, crude Pb content Ni content (metric tons) (metric tons)Argentina -- 394 157 42,046 -- 5,543 21 -- 356 --Bolivia -- -- 1 8,405 -- -- 82 -- 1,114 17,319
28,098 1,895 220 48,373 351,677 33,716 25 54 37 13,000Chile -- -- 5,330 39,162 9,316 1,560 4 -- 1,405 --Colombia -- -- 2 13,411 475 1,125 -- 64 9 --Costa Rica -- -- -- 198 -- -- -- -- -- --Cuba -- -- -- -- -- 274 -- 67 -- --Dominican Republic NA -- -- -- -- 60 -- NA -- --
-- -- -- 800 -- 85 -- -- (2) --El Salvador -- -- -- -- -- 72 -- -- -- --French Guiana -- -- -- 2,000 -- -- -- -- -- --
-- -- -- 7,500 30 250 (2) -- 100 --Guyana 2,098 -- -- 8,131 -- -- -- -- -- --Honduras -- -- (2) 2,561 -- -- 3 -- 12 --Jamaica 14,363 -- -- -- -- -- -- -- -- --Mexico -- -- 269 50,817 11,688 17,230 141 -- 3,236 NANicaragua -- -- -- 3,400 -- -- -- -- 3 --Panama -- -- -- -- -- -- -- -- -- --Paraguay -- -- -- -- -- 130 -- -- -- --
-- -- 1,268 179,870 7,823 750 345 -- 3,686 39,037Suriname 5,230 -- -- 10,300 -- -- -- -- -- --Trinidad and Tobago -- -- -- -- -- 675 -- -- -- --Uruguay -- -- -- 2,182 16 70 -- -- -- --
5,500 610 -- 10,100 23,000 5,000 -- 20 -- ---- -- -- 5 -- -- -- -- -- --
Total 55,300 2,900 7,250 429,000 404,000 66,500 621 206 9,960 69,400Share of world total 26% 7% 47% 22% 18% 5% 16% 8% 46% 27%
-- 3,120 607 95,044 31,273 15,130 79 260 728 --Share of world total -- 8% 4% 5% 1% 1% 2% 10% 3% --United States NA 2,660 1,310 233,000 53,600 91,900 410 -- 1,260 --Share of world total NA 7% 8% 12% 2% 7% 10% -- 6% --
Total Western Hemisphere 55,300 8,680 9,160 758,000 489,000 174,000 1,110 465 11,900 69,400Share of world total 26% 22% 59% 38% 22% 13% 28% 18% 56% 27%World total 213,000 39,600 15,500 1,970,000 2,210,000 1,330,000 3,980 2,540 21,500 256,000
See footnotes at end of table.
LATIN AMERICA AND CANADA: PRODUCTION OF SELECTED MINERAL COMMODITIES IN 20081
Brazilp
e
e
e
Ecuadore
e
e
Guatemalae
e
e e
Perup e
e e
e
Venezuelae
Other3 e
Canadap

TABLE 4—Continued
(Thousand metric tons unless otherwise specified)
Mineral fuels and related materialsPetroleum
Metals— Crude,Continued Natural gas including Refinery
Zinc, mine Industrial minerals Dry Plant liquids condensate products output, Phosphate (million (thousand (thousand (thousand
Zn content Cement, Coal, cubic 42-gallon 42-gallon 42-gallonCountry (metric tons) hydraulic Gypsum content Salt all grades meters) barrels) barrels) barrels)
Argentina 30,349 9,703 1,257 -- 1,681 208 44,100 -- 229,723 140,900Bolivia 383,618 1,985 5 -- 45 -- 14,895 4,800 14,233 11,000
173,933 46,500 1,923 2,242 7,020 6,732 18,941 4,904 876,000 725,620Chile 40,519 4,622 774 7 6,431 534 1,828 3,500 966 82,573Colombia -- 10,456 200 8 221 73,500 5,023 8,577 214,620 88,149Costa Rica -- 2,500 -- -- NA -- -- -- -- 4,900Cuba -- 1,707 -- -- 157 -- 1,161 -- 19,366 10,112
-- 4,000 350 -- 50 -- -- -- -- 12,000Ecuador -- 5,493 -- -- -- -- 680 300 184,746 53,093
-- 1,300 6 -- 30 -- -- -- -- 6,200French Guiana -- 62 -- -- -- -- -- -- -- --
-- 2,500 500 -- 50 -- (2) -- 4,500 --Guyana -- -- -- -- -- -- -- -- -- --
7,700 1,800 6 -- 40 -- -- -- -- --Jamaica -- 725 238 -- 19 -- -- -- -- 299,000Mexico 453,588 40,111 5,135 291 8,809 15,894 35,772 133,590 1,019,080 476,655
-- 530 40 -- 30 -- -- -- -- 5,200-- 1,050 -- -- 18 -- -- -- -- ---- 600 5 -- -- -- -- -- -- 2,660
1,602,597 6,862 495 17 1,276 136 1,750 12,236 28,027 63,201Suriname -- 65 -- -- -- -- -- -- 5,400 2,325
-- 800 -- -- -- -- NA 12,500 45,000 55,000-- 620 1,150 -- -- -- -- -- -- 15,300-- 11,000 7 115 350 7,457 28,500 78,500 920,000 434,000-- 1,040 -- -- 1,773 -- 12 -- 365 169,800
Total 2,690,000 156,000 12,100 2,680 28,000 104,000 153,000 259,000 3,560,000 2,660,000Share of world total 24% 6% 9% 5% 11% 2% 5% 10% 13% 9%
678,177 13,672 5,740 210 14,386 67,749 157,949 172,200 1,004,000 745,000Share of world total 6% (2) 4% (2) 6% 1% 5% 7% 4% 2%United States 778,000 87,600 17,900 8,590 47,300 1,060,000 577,000 689,000 1,940,000 6,620,000Share of world total 7% 3% 13% 17% 3% 16% 19% 28% 7% 22%
Total Western Hemisphere 4,150,000 257,000 35,700 11,500 89,700 1,240,000 888,000 1,120,000 6,500,000 10,000,000Share of world total 37% 9% 25% 23% 36% 18% 30% 45% 23% 33%
LATIN AMERICA AND CANADA: PRODUCTION OF SELECTED MINERAL COMMODITIES IN 20081
rock, P2O5
e p e p p
Brazilp
e e
e
e
Dominican Republice
e
El Salvadore
e
Guatemalae
Hondurase
e e
Nicaraguae
Panamae
Paraguaye
Perup
e e
Trinidad and Tobagoe
Uruguaye
Venezuelae 4
Other3 e
Canadap e e

World total 11,300,000 2,840,000 142,000 50,300 256,000 6,680,000 2,990,000 2,490,000 27,700,000 30,200,000See footnotes at end of table.
TABLE 4—ContinuedLATIN AMERICA AND CANADA: PRODUCTION OF SELECTED MINERAL COMMODITIES IN 20081
eEstimated; estimated data, U.S. data, and world totals are rounded to no more than three significant digits. pPreliminary. NA Not available. -- Zero or zero percent.1Totals may not add due to independent rounding. Percentages are calculated on unrounded data. Table includes data available as of June 21, 2010.2Less than 1/2 unit.3Includes Aruba, Barbados, Belize, Guadeloupe, Haiti, Martinique, and the Netherlands Antilles.4Reported figure.

TABLE 5
(Thousand metric tons)
Country 1995 2000 2005 2008Brazil 10,200 13,800 22,034 24,754 29,500 30,000 32,000Dominican Republic -- -- 535 NA -- -- --Guyana 2,028 2,471 1,648 2,098 2,100 2,100 2,100Jamaica 10,900 11,100 14,116 14,363 13,000 13,000 13,000Suriname 3,530 3,610 4,757 5,230 5,250 5,300 5,500Venezuela 5,020 4,360 5,900 5,500 5,500 5,500 5,500
Total 31,700 35,300 49,000 51,900 55,000 56,000 58,000
LATIN AMERICA AND CANADA: HISTORIC AND PROJECTED BAUXITE MINE PRODUCTION, 1995-20151
2011e 2013e 2015e
eEstimated. NA Not available. -- Negligible or no production.1Estimated data and totals are rounded to no more than three significant digits; may not add to totals shown.

TABLE 6
(Thousand metric tons)
Country 1995 2000 2005 2008Argentina 196 278 270 393 400 400 400Brazil 1,272 2 1,490 1,749 2,187 2,300 2,400 2,500Canada 2,170 2,518 2 2 2 3,170 3,300 2 3,400 2 3,400 ###Mexico 139 2 348 574 600 600 700 700Suriname 28 -- -- -- -- -- --Venezuela 630 571 615 610 610 610 610
Total 4,400 5,200 6,200 7,000 7,200 7,500 7,600
LATIN AMERICA AND CANADA: HISTORIC AND PROJECTED PRIMARY AND SECONDARY ALUMINUM PRODUCTION, 1995-2015 1
2011e 2013e 2015e
eEstimated. -- Negligible or no production. 1Estimated data and totals are rounded to no more than three significant digits; may not add to totals shown. 2Includes secondary aluminum production.

TABLE 7
(Metal content in thousand metric tons)
Country 1995 2000 2005 2008Argentina -- 145 187 157 175 200 300Bolivia 1 1 1 1 1 1 1Brazil 49 32 133 220 230 240 250Canada 726 634 595 607 600 640 640Chile 2,489 4,602 5,321 5,330 5,500 5,700 5,900Colombia 11 10 9 5 6 7 7Ecuador -- -- -- -- -- 6 6Mexico 335 365 429 267 300 320 350Peru 444 554 1,010 1,268 1,300 1,350 1,400
Total 4,100 6,300 7,700 7,900 8,100 8,500 8,900
LATIN AMERICA AND CANADA: HISTORIC AND PROJECTED COPPER MINE PRODUCTION, 1995-20151
2011e 2013e 2015e
eEstimated. -- Negligible or no production. 1Estimated data and totals are rounded to no more than three significant digits; may not add to totals shown.

TABLE 8
(Thousand metric tons)
Country 1995 2000 2005 200816 16 16 NA -- -- --
Brazil 219 233 224 244 250 260 270Canada 614 613 515 470 520 520 520
1,490 2,668 2,824 3,060 3,200 3,400 3,400Mexico 212 411 416 314 345 360 390
444 452 512 464 500 550 600Total 3,000 4,400 4,500 4,600 4,800 5,100 5,200
LATIN AMERICA AND CANADA: HISTORIC AND PROJECTED REFINED COPPER PRODUCTION, 1995-20151
2011e 2013e 2015e
Argentina2
Chile3
Peru3
eEstimated. NA Not available. -- Negligible or no production.1Estimated data and totals are rounded to no more than three significant digits; may not add to totals shown. 2Secondary only.3Primary only.

TABLE 9
(Au content in kilograms)
Country 1995 2000 2005 2008Argentina 837 26,000 27,904 42,046 45,000 50,000 55,000Belize 5 7 (2) 5 5 5 5Bolivia 14,400 12,000 8,871 8,405 4,000 4,000 4,000Brazil 63,300 50,400 38,293 54,000 55,000 55,500 60,000Canada 152,000 156,200 120,541 95,044 98,000 105,000 100,000Chile 44,585 54,100 40,447 39,162 40,000 45,000 55,000Colombia 21,100 37,000 35,783 34,321 42,000 47,000 47,000Costa Rica 400 50 424 198 300 500 500Cuba 184 1,000 -- -- -- -- --Dominican Republic 3,280 -- -- -- 8,500 25,000 30,000Ecuador 7,410 2,870 5,338 800 7,500 8,000 9,000French Guiana 3,000 3,492 1,955 2,000 2,000 2,000 2,000Guatemala 30 140 741 7,500 9,000 10,000 10,000Guyana 9,005 13,510 8,325 8,131 8,150 8,200 8,300Honduras 111 878 4,438 2,561 1,000 1,000 1,000Mexico 20,300 26,400 30,356 51,000 60,000 65,000 65,000Nicaragua 1,320 3,670 3,674 3,400 2,200 2,000 2,000Panama 1,100 -- -- -- 1,500 2,000 2,000Peru 56,000 139,000 208,002 179,870 180,000 180,000 180,000Suriname 300 300 10,619 10,300 10,500 11,000 11,500Uruguay 900 2,180 3,151 2,182 2,200 2,250 2,300Venezuela 7,260 7,330 10,480 10,100 10,500 11,000 12,000
Total 407,000 537,000 559,000 551,000 590,000 640,000 660,000
LATIN AMERICA AND CANADA: HISTORIC AND PROJECTED GOLD MINE PRODUCTION, 1995-20151
2011e 2013e 2015e
eEstimated. -- Negligible or no production. 1Estimated data and totals are rounded to no more than three significant digits; may not add to totals shown. 2Less than 1/2 unit.

TABLE 10
(Fe content in thousand metric tons)
Country Iron content 1995 2000 2005 2008Argentina 68% -- -- -- -- 300 500 500Bolivia 65% -- -- -- -- -- -- 1,000Brazil 66% 113,000 141,000 186,891 233,514 235,000 240,000 250,000
64% 24,600 22,700 19,333 19,700 25,000 28,000 28,000Chile 61% 5,200 5,400 4,707 5,670 6,000 6,000 6,000Colombia 55% 300 363 325 261 300 300 300Cuba 45% 9 9 9 -- -- -- --Guatemala 65% 1 10 7 19 5 5 5Mexico 60% 5,630 6,800 7,012 7,013 7,000 7,000 7,000Peru 68% 3,950 2,810 4,565 5,244 5,300 5,300 5,400Uruguay 50% 3 4 12 16 17 18 20Venezuela 65% 12,600 11,100 13,000 15,200 15,500 16,000 16,500
Total XX 165,000 190,000 236,000 287,000 290,000 300,000 320,000
LATIN AMERICA AND CANADA: HISTORIC AND PROJECTED IRON ORE PRODUCTION, 1995-20151
2011e 2013e 2015e
Canada2
eEstimated. XX Not applicable. -- Negligible or no production. 1Estimated data and totals are rounded to no more than three significant digits; may not add to totals shown.2Includes beneficiated and direct-shipping ore.

TABLE 11
(Thousand metric tons)
Country 1995 2000 2005 2008Argentina 3,620 4,470 5,386 5,543 5,700 5,700 5,700Brazil 25,100 27,900 31,631 33,716 33,800 34,000 35,000Canada 14,400 15,900 15,327 15,130 16,000 18,000 18,000Chile 1,010 1,350 1,537 1,560 1,600 1,700 1,700Colombia 792 660 842 1,125 1,300 1,300 1,300Cuba 207 327 245 274 280 280 280Dominican Republic -- 36 60 60 70 70 70Ecuador 35 58 84 85 85 85 85El Salvador 28 41 48 72 80 80 80Guatemala NA 166 207 250 250 300 300Jamaica 25 -- -- -- -- -- --Mexico 12,100 15,600 16,202 17,230 14,000 17,000 19,000Paraguay 96 77 101 130 135 140 150Peru 515 2 749 750 750 750 750 750Trinidad and Tobago 738 753 711 675 700 700 700Uruguay 40 38 64 68 70 71 72Venezuela 3,630 3,840 4,907 5,000 5,000 5,000 5,000
Total 62,300 72,000 78,100 80,100 80,000 85,000 88,000
LATIN AMERICA AND CANADA: HISTORIC AND PROJECTED CRUDE STEEL PRODUCTION, 1995-20151
2011e 2013e 2015e
eEstimated. NA Not available. -- Negligible or no production.1Estimated data and totals are rounded to no more than three significant digits; may not add to totals shown. 2Ingots and castings.

TABLE 12
(Ni content in metric tons)
Country 1995 2000 2005 2008Brazil 29,100 45,300 74,198 54,060 54,500 55,000 56,500Canada 182,000 191,000 199,932 259,588 180,000 280,000 280,000Colombia 24,200 59,000 89,000 64,200 60,000 60,000 60,000Cuba 41,000 68,100 73,753 67,265 87,000 90,000 96,000Dominican Republic 46,500 39,900 53,124 20,000 10,000 20,000 30,000Venezuela -- 2,540 20,000 20,000 20,000 20,000 20,000
Total 323,000 406,000 510,000 485,000 410,000 530,000 540,000
LATIN AMERICA AND CANADA: HISTORIC AND PROJECTED NICKEL MINE PRODUCTION, 1995-20151
2011e 2013e 2015e
eEstimated. -- Negligible or no production. 1Estimated data and totals are rounded to no more than three significant digits; may not add to totals shown.

TABLE 13
(Pt content in kilograms)
Country 1995 2000 2005 2008Canada 7,000 5,700 6,075 7,000 9,000 9,000 9,000Colombia 973 339 1,082 1,370 1,200 1,200 1,200
Total 8,000 6,000 7,200 8,400 10,000 10,000 10,000
LATIN AMERICA AND CANADA: HISTORIC AND PROJECTED PLATINUM MINE PRODUCTION, 1995-20151
2011e 2013e 2015e
eEstimated.1Estimated data and totals are rounded to no more than three significant digits; may not add to totals shown.

TABLE 14LATIN AMERICA AND CANADA: HISTORIC AND PROJECTED PALLADIUM MINE PRODUCTION, 1995-2015
(Pd content in kilograms)
Country 1995 2000 2005 2008Canada 8,900 10,400 10,400 10,000 15,000 15,000 15,000
2011e 2013e 2015e
eEstimated; estimated data are rounded to no more than three significant digits.

TABLE 15
(Sn content in metric tons)
Country 1995 2000 2005 2008Argentina 1 4 1 1 1 1 1Bolivia 14,733 12,293 18,640 17,319 19,500 20,000 25,000Brazil 17,316 14,200 11,739 13,000 13,500 14,000 14,500Peru 22,331 70,901 42,145 39,037 40,000 41,000 42,000
Total 54,400 97,400 72,500 69,400 73,000 75,000 81,500
LATIN AMERICA AND CANADA: HISTORIC AND PROJECTED TIN MINE PRODUCTION, 1995-20151
2011e 2013e 2015e
eEstimated.1Estimated data and totals are rounded to no more than three significant digits; may not add to totals shown.

TABLE 16
(Metric tons)
Country 1995 2000 2005 2008Argentina -- -- 120 -- 150 150 150Brazil 17,039 14,023 9,236 10,558 11,000 11,500 12,000Bolivia 17,664 9,353 13,841 12,666 15,000 18,000 20,000Mexico 770 1,200 17 15 17 19 19Peru 22,262 37,410 36,733 38,865 39,000 39,500 40,000
Total 57,700 62,000 59,800 62,100 65,000 69,000 72,000
LATIN AMERICA AND CANADA: HISTORIC AND PROJECTED TIN METAL PRODUCTION, 1995-20151
2011e 2013e 2015e
eEstimated. -- Negligible or no production. 1Estimated data and totals are rounded to no more than three significant digits; may not add to totals shown.
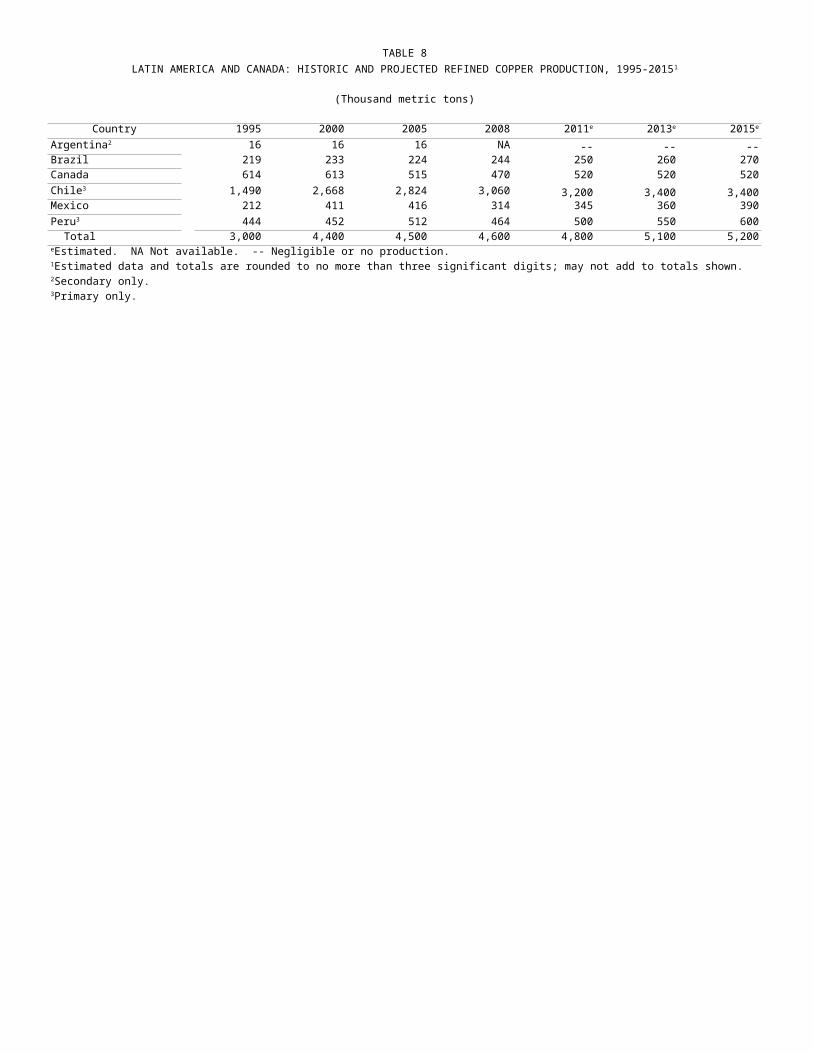
TABLE 17
(Zn content in thousand metric tons)
Country 1995 2000 2005 2008Argentina 32 35 30 30 30 30 30Bolivia 146 149 160 384 400 390 380Brazil 189 100 171 174 180 185 190Canada 1,120 1,000 667 678 800 800 800Chile 35 31 29 41 30 35 35Colombia -- 40 -- -- -- -- --Ecuador (2) (2) -- -- -- -- --Honduras 27 31 43 28 33 33 33Mexico 364 393 456 454 455 455 455Peru 692 910 1,202 1,603 1,650 1,700 1,750
Total 2,610 2,690 2,760 3,390 3,600 3,600 3,700
LATIN AMERICA AND CANADA: HISTORIC AND PROJECTED ZINC MINE PRODUCTION, 1995-20151
2011e 2013e 2015e
eEstimated. -- Negligible or no production. 1Estimated data and totals are rounded to no more than three significant digits; may not add to totals shown. 2Less than 1/2 unit.

TABLE 18
(Thousand metric tons)
Country 1995 2000 2005 2008Argentina 36 39 40 43 40 40 40Bolivia -- -- -- -- -- -- 30Brazil 206 199 267 249 250 300 350
720 780 724 764 850 850 850223 235 327 305 320 350 350159 200 162 190 200 250 300
Total 1,300 1,500 1,500 1,600 1,700 1,800 1,900
LATIN AMERICA AND CANADA: HISTORIC AND PROJECTED ZINC METAL PRODUCTION, 1995-20151
2011e 2013e 2015e
Canada2
Mexico2
Peru2
eEstimated. -- Negligible or no production. 1Estimated data and totals are rounded to no more than three significant digits; may not add to totals shown. 2Primary only.

TABLE 19
(Thousand carats)
Country 1995 2000 2005 2008Brazil 1,280 1,600 208 182 185 190 195Canada -- 2,530 12,314 14,803 9,000 10,000 10,000Guyana 52 82 357 169 175 180 200Venezuela 296 110 115 115 115 115 115
Total 1,600 4,300 13,000 15,300 9,500 10,500 10,500
LATIN AMERICA AND CANADA: HISTORIC AND PROJECTED DIAMOND MINE PRODUCTION, 1995-20151
2011e 2013e 2015e
eEstimated. -- Negligible or no production. 1Estimated data and totals are rounded to no more than three significant digits; may not add to totals shown.
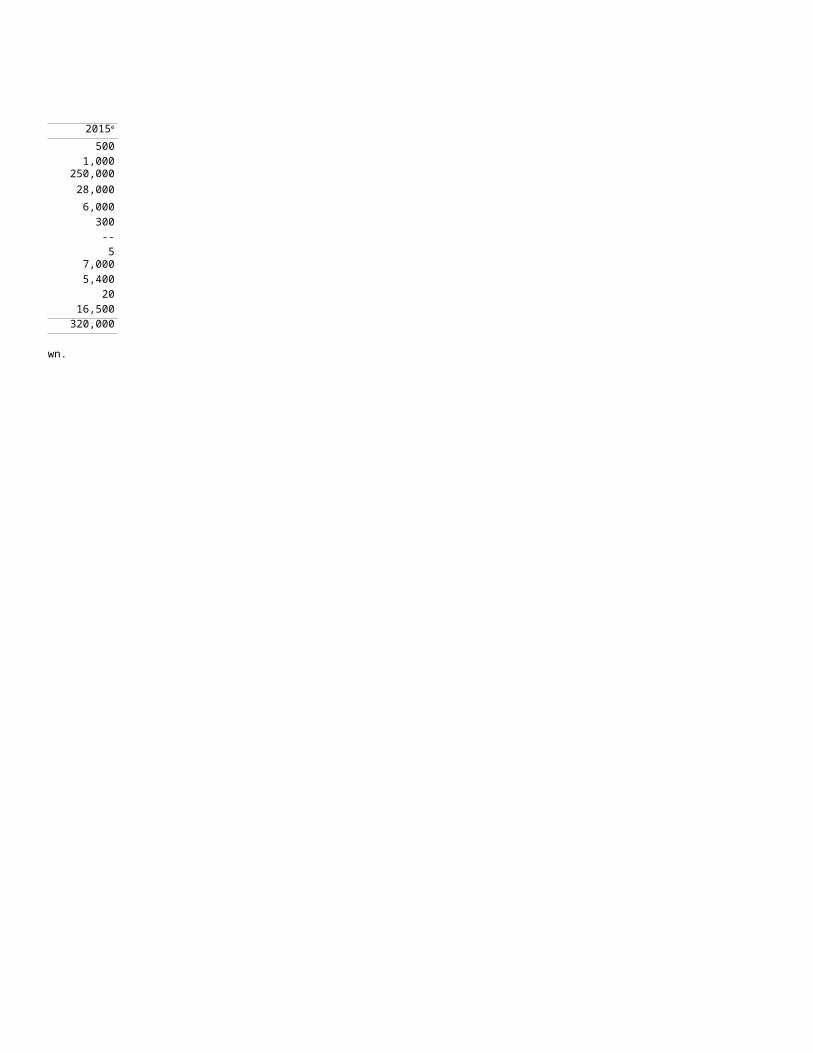
TABLE 20
(Li content in metric tons)
Country 1995 2000 2005 2008Argentina 15 25 2,800 1,200 2,000 6,000 8,000Bolivia -- -- -- -- -- -- 5,600Brazil 170 260 210 210 210 210 210Canada 630 670 670 650 -- -- --Chile 2,432 6,740 8,303 10,582 10,000 10,000 10,000
Total 3,200 7,700 12,000 12,600 12,000 16,000 24,000
LATIN AMERICA AND CANADA: HISTORIC AND PROJECTED LITHIUM PRODUCTION, 1995-20151
2011e 2013e 2015e
eEstimated. -- Negligible or no production. 1Estimated data and totals are rounded to no more than three significant digits; may not add to totals shown.
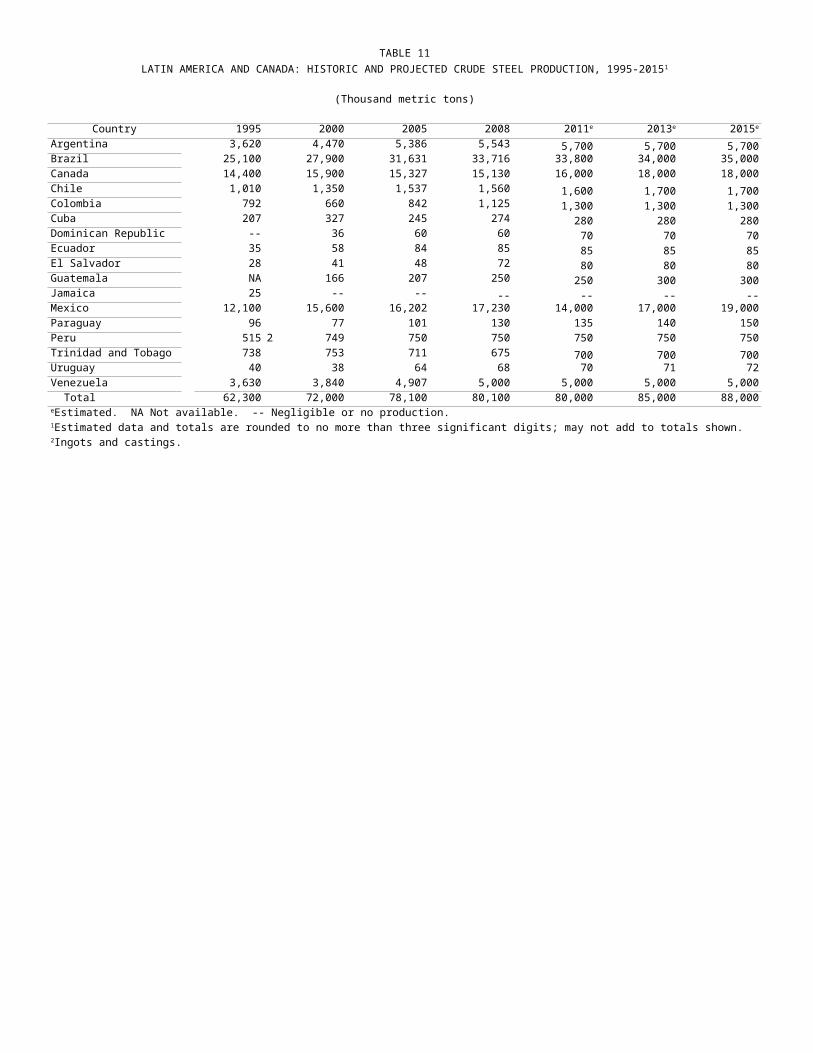
TABLE 21
(Thousand metric tons)
Country 1995 2000 2005 2008Argentina 305 246 320 208 300 300 300Brazil 2,780 6,000 6,480 6,732 6,750 6,800 6,850
75,000 69,200 67,555 67,749 75,000 75,000 75,000Chile 1,490 509 732 534 700 1,000 1,500Colombia 26,000 38,200 59,064 73,500 100,000 100,000 100,000
11,200 14,300 11,750 15,894 12,000 12,000 12,00080 27 22 136 140 145 150
Venezuela 4,260 7,910 7,195 7,457 7,500 7,550 7,600Total 121,000 136,000 153,000 172,000 202,000 200,000 200,000
LATIN AMERICA AND CANADA: HISTORIC AND PROJECTED SALABLE COAL PRODUCTION, 1995-20151
2011e 2013e 2015e
Canada2
Mexico2
Peru2
eEstimated.1Estimated data and totals are rounded to no more than three significant digits; may not add to totals shown. 2Run of mine.

TABLE 22
Country 1995 2000 2005 2008Argentina 68 -- -- -- -- -- --
-- 20 129 130 130 130 130Canada 12,400 12,600 14,854 10,261 10,000 12,000 17,000
Total 12,500 12,600 15,000 10,400 10,000 12,000 17,000
LATIN AMERICA AND CANADA: HISTORIC AND PROJECTED URANIUM PRODUCTION, 1995-20151
(U3O8 content in metric tons)
2011e 2013e 2015e
Brazil2
eEstimated. -- Negligible or no production. 1Estimated data and totals are rounded to no more than three significant digits; may not add to totals shown. 2Source: Anuário Mineral Brasileiro 2001-2006.

TABLE 23LATIN AMERICA AND CANADA: APPARENT CONSUMPTION FOR SELECTED COUNTRIES
(Thousand metric tons)
Commodity and country 2000 2008 Percent changeAluminum, unwrought:
Argentina 105 148 41%Brazil 743 1,548 108%Canada 948 357 -62%Chile 15 16 10%Colombia 32 43 34%Mexico 375 998 166%Peru NA -1 NA
Cement, portland, other than white: Argentina 6,221 9,688 56%Brazil 39,710 46,121 16%Canada 8,271 11,300 37%Chile 3,469 4,800 38%Colombia 5,469 9,310 70%Mexico 29,400 38,965 33%Peru 3,646 6,799 86%
Copper, refined: Argentina 49 14 -71%Brazil 331 403 22%Canada 2,272 199 -91%Chile 84 56 -33%Colombia 5 -8 -278%Mexico 464 311 -33%Peru 55 73 33%
Steel, finished and semifinished: Argentina 2,970 4,790 61%Brazil 15,760 24,000 52%Canada 17,800 14,279 -20%Chile 1,465 2,572 76%Colombia 1,695 2,937 73%Mexico 14,143 16,268 15%Peru 825 2,159 162%
NA Not available.
Sources: United Nations Commodity Trade Statistics Database; U.S. Geological Survey Minerals Yearbook 2008, Area reports—International—Latin America and Canada; World Steel Association, 2010, Steel statistical yearbook 2009, p. 95.