xxxix.?the freezing points of alloys containing zinc and another metal
TRANSCRIPT

HEYCOCK AND NEVILLE : THE FREEZING POINTS OF ALLOYS. 383
XXXIX.-The Freezing Poifits of Alloys ~ontainin~y Ziiic and a ~ ~ o t h e r Metal.
By CHARLES THOMAS HEYCOCK and FRANCIS HENRY NEVILLE.
I N T R O D U C T I o N.
THE present paper contains the results O F experiments most of which were carried out in 1894 and 1895, but some, including the greater part of the zinc-silver and the zinc-tin series, were performed in 1S96. The results are not so complete as we hard hoped t o make them, but in so large a subject it is hopeless t o aim at completeness, and the fact that an increasing number of students is now occupied with the cryo-
Publ
ishe
d on
01
Janu
ary
1897
. Dow
nloa
ded
by L
omon
osov
Mos
cow
Sta
te U
nive
rsity
on
13/0
2/20
14 1
2:39
:43.
View Article Online / Journal Homepage / Table of Contents for this issue

384 HEYCOCK A N D NEVILLE : THE FREEZING POINTS OF ALLOYS
scopic study of alloys renders such an aim less necessary, for it may be hoped that one worker's results will cclmplement and correct those of anothef AT. Henri Gautier+ has lately published an investigation of the melting points of several alloys, including zinc-silver, tha t must cover the same ground as our own experiments on tha t pair of metals, but as me had obtained some reniarkable results with dilute solutions of silver in zinc before we were awnre tha t he was occupied with the subject, me have thought it worth mhilc to complete our zinc-silver freezing point curve. I n order that our work might have the value attaching to an independent investigation, we have not allowed our- selves the pleasure of studying his paper, although very possibly we might have been saved from some errors by doing so.
The freezing points were determined by means of platinum resistance pyrometers identical with those described in a previous paper (Trans., 1895,67, 160). As the methods of using the pyrometers and reducing their reading to the centigrade-air scale are fully described in tha t paper, we content ourselves in thc present case wiLh stating t.he centi- grade tempera tures without explanation.
Zinc is, in some respects, a inore troublesome metal to use as a solvent than any other, either of higher or lower inelting point, tha t we linve as yet employed ; for in working near 400°, we have been unable to find any substance which could be used to protect the surface of the molten alloy from oxidation. The paraffins, which we had employed up to the melting point of lead, were too volatile or decomposed at the higher temperature. The plan of introducing ,z jet of coal-gas into the crucible so that it impinged on the surface of the molten metal was adopted; but although oxygen was thus, to some extent, excluded from the crucible, the reducing action of the unlit coal-gas at so low a temperature as 400" was probably very slight. W e do not, however, think that oxidation took place to such an extent as seriously to impair the accuracy of our results.
The alloys were vigorously slirred by a plunging ring stirrer which just fitted the cylindrical crucible. This stirrer was of clay in a few of the earlier experiments, but afterwards we invariably used a stirrer made of gas carbon. In general, this stirrer was worked by a water motor, but in a few cases it was worked by hand.
The experiments at temperatures below 500" were generally carried out in an improvised furnace which allowed of n somewhat more rapid rate of cooling than did Fletcher's furnaces. The base of this furnace was a, slab of fire-clay perforated by a circular hole about 2 inches in diameter, and the walls were formed by a cylinder of sheet asbestos. Resting on the top of this cylinder was a circular plate of thick sheet asbestos having a central hole. This formed the top of the furnace, and a
* Covzpt. read., 1896 ; 123, 172-174.
Publ
ishe
d on
01
Janu
ary
1897
. Dow
nloa
ded
by L
omon
osov
Mos
cow
Sta
te U
nive
rsity
on
13/0
2/20
14 1
2:39
:43.
View Article Online

CONTAINING ZINC AND ANOTHER METAL. 355
cylindrical cast iron crucible with walls half-an-inch thick jusli fitted the hole in the asbestos top and was thus suspended axially within the furnace. The true crucible of plumbago, which contained the alloy, was a cylinder exactly fitting the inside of the iron crucible. The whole structure rested on an iron tripod so tha t a Bunsen burner could be placed underneath and raised until the flame more 01' less entered the hole in the base of the furnace. This arrangement gave us the power of heating rapidly, together with very steady temperatures, and some control over the la te of cooling. W e shall call this furnace A, to dis- tinguish i t from the Fletcher's furnace aucl from other arrangements sometimes employed.
At the commencement of a series of experiments, a known weight of one metal was melted in the crucible and its freezing point determined. Successive known weights of the second metal were then added, the freezing point being determined after each addition. Except in the case of the silver-zinc zlloys, where me were forced to resort to chemical analysis, t,he composition of the alloy was deduced from the weights of metal used. This plan, at the comparatively lorn temperatures needed for zinc, and provided that care is taken t o minitnise oxidation, is pro- bably ns trustworthy as a n analysis, at all events when the series of experiments is not too prolonged.
The results are given in tabular form and also expressed as curves. Each pair of metals has n separate table allotted'to it, and a t the head of the table me state the nature of the alloy and the weight used of what we may term the solvent metal.
The first column gives the percentage by weight of the second metal present.
The second column gives the atomic percentage of the second metal, or, in other words, the empirical formula of the alloy-thus a silver-zinc alloy having 20 atomic per cents. of zinc would have the formula Ag,,Zn,,. This column is calculated from column 1, and from the atomic weights of the metals.
The third column gives the temperature a t which the alloy begins to solidify-the freezing point or f. p., as we shall, for shortness, term it. It is often easy to recccl this temperature to 0*01", although the tmce temperature is no doubt rarely obtained so nearly as this. We think, however, that in certain cases our results would lose in accuracy by re- jecting the second decimal place, me have therefore usually retained it.
The fourth column, the atomic fall, is obtained by dividing the total depression of the freezing point by the atomic percentage cif the second matal. It is clear that if, as should be the case for dilute solu- tions, the depressions are proportional to the concentrations, then the atomic fall ought a t least, for the same pair of metals, t o be a constant. This column is only given for dilute solutions. It is useful, because it
Publ
ishe
d on
01
Janu
ary
1897
. Dow
nloa
ded
by L
omon
osov
Mos
cow
Sta
te U
nive
rsity
on
13/0
2/20
14 1
2:39
:43.
View Article Online

386 HEYCOCK AND NEVILLE : THE FREEZING POINTS OF ALLOTS
shows a t once whether the experiments are consistent with one another. It must be remembered, however, that, for very dilute solutions, the atomic fall necessarily appears to be irregular, as, from the method of calculating it, the experimental error is in such cases greatly magnified.
I n the freezing point curves (pp. 404 and 422), the temperature is measured vertically upwards and is indicated by numbers placed at the side of the page or in some cases by numbers placed immediately below the line of the curve. The composition is indicated in atomic per- centages, the numbers being placed either along the top or bottom of the page, or in some cases by numbers immediately above the line of the curve. The plan of placing the numbers close to the curve is convenient when it is necessary to make the curve of each pair of metals an independent figure having its own zero, as in Figures 4 and 15. The individual experiments are indicated in the figures by black dots lying on or near the line of the curve.
It will be seen from the tables tha t we in several cases give more than one series of experiments for the same metallic pair in which the starting point is the same pure metal. But the freezing points of the pure metal in two such series, obtained at different times and probably with different thermometers, are certain to differ a little. W e there- fore, before charting these series, add to or subtract from every term of one of them the small constant quantity which is needed to make the f. p. of the pure metal the same in both; for example, in all the complete f. p. ciirves the f . p. of zinc is taken as 419.*
The paper is divided into two almost independent sections. The first deals with those metals which, when added to zinc, begin by lowering its freezing point, the second deals with those metals which raise the freezing point of the zinc.
A reader can most readily obtain an idea of our results by turning a t once to the second part of each section in which the individual curves and their meaning are discussed,
SECTION I.
Me!ccZs wluiclb Lowey the Freezing Point of Zinc.
Amongst the metals whose alloys we have examined, we find tha t the freezing point of zinc is lowered by tin, bismuth, thallium, cad- mium, lead, antimony, magnesium or aluminium.
Our experiments with these metals are embodied in Tables I to VIII, and in Figures 1 to 1 2 (p. 404).
* I11 all the experiments rangiiig over three years in time, and made with many different I,yrometers, t h e extreme divergence from the mean freezing point of zinc was +_ 0.7".
Publ
ishe
d on
01
Janu
ary
1897
. Dow
nloa
ded
by L
omon
osov
Mos
cow
Sta
te U
nive
rsity
on
13/0
2/20
14 1
2:39
:43.
View Article Online
CONTAINING ZINC! AND ANOTHER METAL.
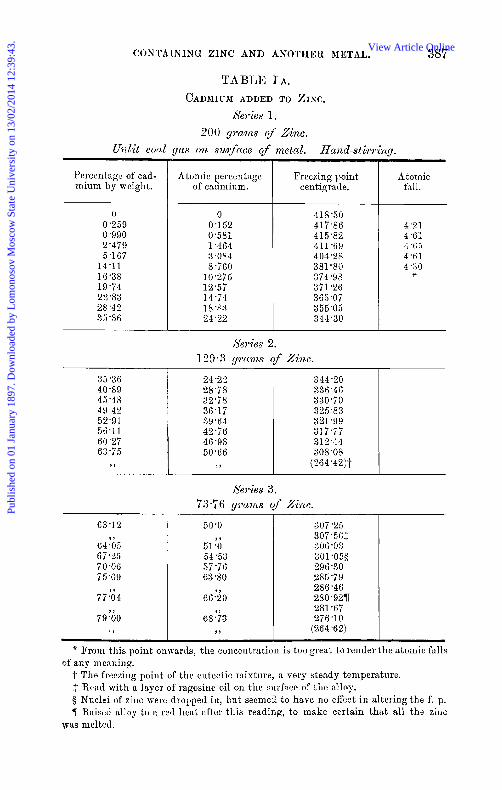
TABLE IA. CADAIIUN ADDED T O Zmc.
Sei-ies 1. 200 panzs o f Zinc.
Unlit coal gas o n surfcccce o f metul.
38'7
lIund-stiwing.
307 '25 ~ 307'56:
306-03 30 1 *05$ 296.30 285.79 286'48 250'9211 281.67 276'10
(264'62)
Percentag!: of cad- mium by wcight.
0 0.259 0.990 2'479 5.167
14-11 16.38 19'74 22.83 28'42 35-36
35.36 40'59 45'48 49.42 52.91 56-11 60'27 63.75
> P
Atomic percentage of cadmium.
0 0 '1 52 0.581 1'464 3.0,94 8.760
10'275 1 2 5 7 14'74 18.83 24-22
Freezing point centigrade.
Atomic fall.
418-50 417.86 415'82 411.69 404'28 381.80 374.98 371 '26 365.07 355'05 341-30
4.21 4 *61 4 % 5 4.61 4 3 0 *
Series 2. 129.3 gi'unts of zi1tc.
24.2 2 28-78 32'78 36.1 7 39.64 42'76 46-98 50.66
Y P
344'20 336,46 330'70 325.83 321 '99 31 7 7 7 31244 308'08
(264'42)t
Series 3. 73.76 grunts o f Z i n c .
79 '60
50'0
51 '6 54.53 57-76 ti3.80
6S*'iO
68 ' j 3
~~ ~ ~~
* From this point onwards, the cvnccntratioii is too great to render the atomic falls
.i- The freezing point of the cutcctic mixture, a very steady temperature. $ Read with a layer of ragosiiie oil on the surface of the alloy. § Nuclei of zinc were dropped in, but seemed to have no effect in altering the f. p. 7l Raised alloy to a rcct heat after this reading, to make certain that all the zirie
of any meaning.
was melted.
Publ
ishe
d on
01
Janu
ary
1897
. Dow
nloa
ded
by L
omon
osov
Mos
cow
Sta
te U
nive
rsity
on
13/0
2/20
14 1
2:39
:43.
View Article Online

388 HEYCOCK AND NEVILLE : THE FREEZING POISTS OF ALLOYS
TABLE 1 , ~ .
ZINC ADDED TO CADMIUM.
Swies 1.
2 5 0 grams of cadmium.
Percentage of zinc by weight.
0 0.145 0.290 0-686 1'450 2.230 3.832 5 -708 8.760
12.72 18'42 25'69
3i116
Atomic percentage of zinc.
0 0-249 0.495 1.168 2.456 3.756 6,385 9'390
14-12 19-96 27.87 37.17
44)-'80
Series 2.
225 grams of Cndmium.
Freezing point centigrade,
320-55 319.88 319.33 317.32 313'77 309'51 302.74 295.03 284.41 273'10 267.04 28954
(264.56) 300.21
10.11 12'90 15.72
16.15 20.22 24.20
2$'50
26% 28-85
7 5
279.40 272.92 266'62
(264 '43) 264.76
(964.54) 264.54 269.06
(264 '50)
With the exception of the eutectic points, which could be found by allowing the mixture to cool, and which were quite constant for many minutes, all the freezing points of alloys, rich in both cadmium and zinc, were difficult to observe exactly. They were read with the aid of a metronome to mark the rate of cooling; there was no period of absolutely constant temperature, but, at the point recorded, the rate of cooling suddenly became three or four times as slow as it had been until then.
Publ
ishe
d on
01
Janu
ary
1897
. Dow
nloa
ded
by L
omon
osov
Mos
cow
Sta
te U
nive
rsity
on
13/0
2/20
14 1
2:39
:43.
View Article Online

CONTAINING ZINC AND ANOTHER METAL. 389
TABLE IIA. ALIJMINIUM ADDED TO ZINC.
400 grams of Zinc. Coal gas buwzing over the surfucs of f i e metal.
Percentage of alu- minium by weight.
0 0'41 0-82 1'23 2 -03 3-20 5'47 7 '64
14.53 18'87 18'86 25 '06 30.37 36'22
9 'il
Atoniic percentage of aluminium.
0 0 '99 1'96 2.91 4'76 7.41
12-28 16.67
20 *'64 29'14 36'00
51.34 57'87
Freezing point centigrade.
418% 414.5 410'4 407'7 401 -4 392'2
(380*6)* (380'9)' 404'9 418'4 447.3 466'1t 464'9x 492% 508'4t 525 '4
Atomic fall.
4.13 4.11 3.76
+ Very steady eutectic temperatures.
$ The f. p. of residue.
The mass was nearly solid before the
Extracted a portion, weighed it, and continued the experiment with the residue, first of these two points was reached.
TABLE I1 B.
ZINC ADDED TO ALUMINIUM. I75 g?*ams of Aluminium.
Percentage of zinc by weight.
0 0 '90 2'34 3 '42 5'83 8 -76
11.98 I 8 *23 25-22 31-10 38'39 44-27 49 -1 3
56.39
6l'bO 65-80
53%5
Atomic percentage of zinc.
0 0'374 0'981 1-44 2-50 3.82 5'33 8 -44
12-24 15.73 20.49 24-73 28'54
32 ' *k 34.84
44'31 39'%
~
Freezing point centigrade.
654'5 652.5 650'4 648'7 644.9 639-5 634.4 623.2 613'0 598.7 584.5 571 '1 560 '2s
542-211 541 *4TT 530.8 518.2
54;:5
Atomic fall.
5 *35 4.18 4 -03 3'84 3-93 3 '77 3.71 3.64 3 -55 3 -41
0 After this reading, a weighed amount was extracted, and the experiment con-
11 After this reading, we extracted a weighed portion.
VOL. LXXI. E E
tinued with the residue. I t will be seen that the f. p. was unchanged.
The f. p. of the residue.
Publ
ishe
d on
01
Janu
ary
1897
. Dow
nloa
ded
by L
omon
osov
Mos
cow
Sta
te U
nive
rsity
on
13/0
2/20
14 1
2:39
:43.
View Article Online
390 HEYCOCK AND NEVILLE: T H E FREEZING POINTS OF ALLOYS
1
Series 1.
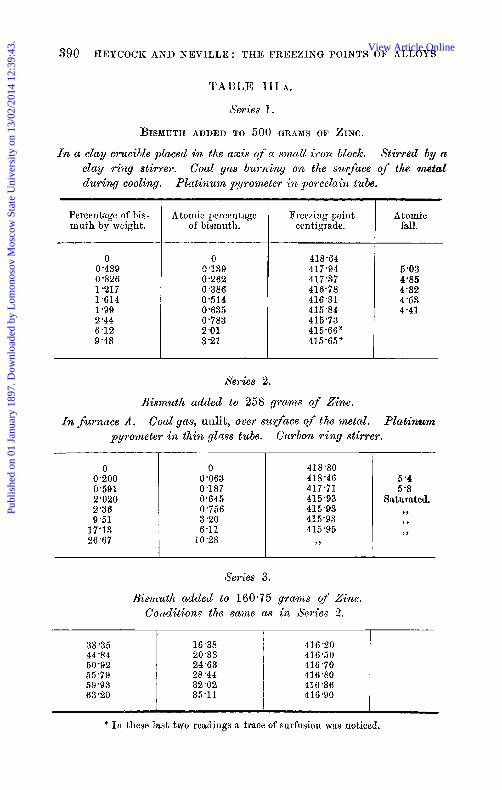
BISMUTH ADDED TO 500 GRANS OF ZINC.
In a clay cruci6le placed in the a x i s of a s m c d i v o n block. Stirred by ct Coal yccs burning o n the stwface of the metaZ clay r ing stirre?..
dur ing cooling. Platinum pyrometer in porcelain tu6e.
Percentage of bis- muth by weight.
0 0'439 0'826 1.217 1-614 1 -99 2 '44 6-12 9 -48
Atomic percentage of bismuth.
0 0.139 0.262 0.386 0.514 0.635 0-783 2.01 3 '21
Freezing point cen t.igrade.
Atomic fall.
418.64 417.94 417'37 416-78 416.31 415.84 415'73 415.66" 415.65*
5 *03 4.85 4'82 4-53 4.41
I I 1
Seiaies 2.
Bismuth added t o 258 grams of Zinc.
In f u r n a c e A . Coal g m , unlit, over s w f a c e of the metal. Platinum pgrorneter in thin glass tube. Carbon r i n g stirrer.
0 0-200 0'591 2.020 2 '36 9 -51
17.13 26.67
38 *35 44-84 50.92 55.79 59-93 63-20
0 0'063 0.187 0.645 0.756 3.20 6-11
10 '2s
41 8 *80 418'46 417.71 415.93 415.93 415'93 415.95
> )
5 *4 5 '8
Saturated. Y Y
> t
J Y
Seyies 3.
Bismut?b added to 160.75 grams c,f Zinc. Co,bditions the same us in Series 2.
16.38 20.38 24 '63 28 '44 32'02 35.11
416'20 416.50 416'70 416.80 416'86 416.90
* In these last t w o readings a trace of surfusion was noticed.
Publ
ishe
d on
01
Janu
ary
1897
. Dow
nloa
ded
by L
omon
osov
Mos
cow
Sta
te U
nive
rsity
on
13/0
2/20
14 1
2:39
:43.
View Article Online

CONTAINING ZINC AND ANOTHER METAL. 391
From 6.11 atomic per cents. of bismuth to the end of Series 3, each freezing point is an extremely steady temperature ; in fact, the tempera- ture was watched for nearly five minutes after reading the freezing point and no fall in temperature noticed, We did not venture to allow the mass to solidify completely, lest the metal in setting should crush the glass tube of the pyrometer.
A very rapid stir was maintained during Series 3. A t the end of Series 3, the alloy, after being well melted, was allowed
to cool slowly, and the ingot of metal was finally extracted from the crucible. It weighed 431 grams, and there was also a little on the pyrometer stem and the stirrer. The weight of the metals used was 437 grams. The alloy consisted of two layers, the lower about twice the amount of the upper. They were easily separated by a blow from a hammer.
The constants of the pyrometer were found to be the same at the beginning and end of the experiments, hence the slight upward creep of the freezing points along the flat of the curve is probably a real phenomenon, perhaps due to an impurity in the bismuth.
TABLE IIIB.
Conditions the same as in Tuble III A, fleyies 2 and 3. ZINC ADDED TO 300 GRAMS OF BISMUTH.
Percentage weight of zinc.
0 1.336 1.954 3'218 4'116 7'142 8'633
11 '63
14 '68 15.49
17';5
ZZ*'iO 26'15
Atomic percentage of zinc.
0 4'12 5.95 9 -55
12 '00 19'63 23-08 29'47
34.'60 36.78
47 '62 52'93
Freezing point centigrade.
269'37 261 '81 258'60 254.51 254.37 343'0 358.1 387.3
409-4 41 6 '9 417.8 417.8 41 7.9 417.2 416%
388-3
Atomic fall.
1.835 1.810
Saturated. 2 )
After each addition of zinc, it was necessary to heat the alloy to the melting point of zinc to bring about solution.
I n the freezing points, down to 12 atomic per cents. of zinc, surfn- aion was generally noted, sometimes to the extent of 2'.
The point at 12 atomic per cents. of zinc was a very steady tempera- ture. Here the rate of cooling mas carefully watched from 50' aboye the recorded temperature, but no higher freezing point could be found.
E E 2
Publ
ishe
d on
01
Janu
ary
1897
. Dow
nloa
ded
by L
omon
osov
Mos
cow
Sta
te U
nive
rsity
on
13/0
2/20
14 1
2:39
:43.
View Article Online

392 HEYCOCK AND NEVILLE : THE FREEZIKG POINTS O F ALLOYS
A t 19.63 atomic per cents. of zinc, the freezing point was somewhat fugitive ; this is always the case a t the first points on the branch of the curve ascending from the lower eutectic flat towards the melting point of the less fusible metal.
The experiments of Table I11 B were carried out with a sample of bismuth, believed t o be specially pure, which was used by Griffiths in his determination of the freezing point (PM. Fg-ans., 1891, A, p. 150). H e then got 269.22' as the mean of his results. It is inter- esting to note that our number, obtained without any special attempt to arrive a t a standard result, differs from his by only 0.15'. His platinum thermometers were of a different type from ours, and the conditions of the experiment in other respects not the same. We think it very doubtful whether, even a t these moderate temperatures, two mercury thermometers would have given so close an agreement.
TABLE IVA. TIN ADDED TO ZINC.
Series 1. 700 gvams of Zinc.
A n eady series of experiments. The conditions not specially noted.
Percentage weight of t in present.
0 0.549 1-088 1.795 3.152 3-450 4'873
Atomic percentage of tin.
0 0.305 0.606 l*OO4 1,772 1.944 2.763
Freezing point centigrade.
419.57 417.82 416.18 414.14 410.53 409'82 406.40
Atomic fall.
5.7 5.6 5-40 5-10 5.02 4-76
Seiies 2.
150 grccrns o f Zinc. In furnace A . Carbon stirrev.
0 3'23 6-25
11.77 16 *67 23-08 2 9 5 7 35'04 41'14 49'07 55-12
0 1.81 3 5 6 6-88 9.98
14-26 18-88 23'02 27-94 34.83 40 -53
418.86 409.80 402.61 393.16 387 *38 380.56" 374.81 370'07 364.37" 355.62 347 5 6
5 '00 4 $6
* After these readings, the crucible was too full ; a. portion of the alloy was there- fore extracted in a molten state, weighed, and the experiment continued with the residue.
Publ
ishe
d on
01
Janu
ary
1897
. Dow
nloa
ded
by L
omon
osov
Mos
cow
Sta
te U
nive
rsity
on
13/0
2/20
14 1
2:39
:43.
View Article Online
COKTAINING ZINC AND ANOTHER METAL. 393
Percentage weight Atomic of tin present. of tin.
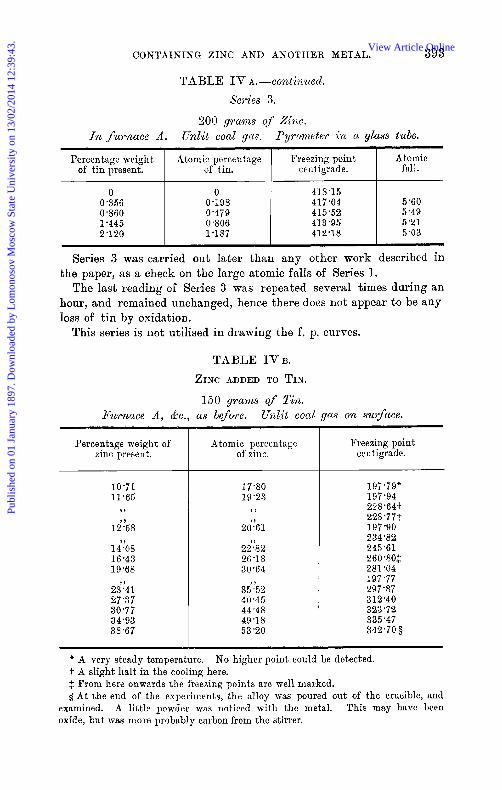
TABLE IV A.-COlLti?tUed. Ser ies 3.
200 gl.anuzs 0s ZillC.
1% furnace A . Unlit coal gem. P y r o m e t e ~ i m a glass tube.
Atomic fali.
0 0.356 0.860 1.445 2.120
0 0.198 0'479 0 -806 1.187
418'15 417.04 415.52 41 3 -95 412.18
5.60 5 -49 5.21 5.03
~~
Series 3 was carried out later than any other work described in the paper, as a check on the large atomic falls of Series 1.
The last reading of Series 3 was repeated several times during an hour, and remained unchanged, hence there does not appear to be any loss of t in by oxidation.
This series is not utilised in drawing the f. p. curves.
TABLE IVB. ZINC ADDED TO TIN.
150 g r a m s of Ti?&. P u r n a c e A , &c., as before. Unlit cocd gccs o n suqface.
Percentage weight of zinc present.
Atomic percentage of zinc.
Freezing point centigrade.
10.71 11.65
d 1 5 8
16.43 19.68
2i*'41 27.37 30.77 34.93 38.67
9 ,
1 4 0 8
17.80 19'23
2d*'6l
2d*'82 26'18 30'64
3i152 40'45 44'45 49'18 53'20
I )
197.79" 197'94 228'64t 228-77t 197'90 234.82 245.61 260 *80$ 281'04 197.77
312'40 323'72 335.47 342'70 §
2 9 i w
* A very steady temperature. .t. A slight halt in the cooling here. $ From here onwards the freexing points are well marked. § At the end of the experiments, the alloy was poured out of the crucible, and
A little powder mas noticed with the metal. This may have been
No higher point could be detected.
examined. oxide, but mas more probably carbon from the stirrer.
Publ
ishe
d on
01
Janu
ary
1897
. Dow
nloa
ded
by L
omon
osov
Mos
cow
Sta
te U
nive
rsity
on
13/0
2/20
14 1
2:39
:43.
View Article Online

394 HEYCOCK AND NEVILLE : THE FREEZING POINTS OF ALLOYS
TABLE V.
LEAD ADDED TO 550 GRAMS OF ZINC.
In Salamander crucible in cb smalZ PZetcher lilt& fuwzace. coal gas b u m i m g on the s w f x c e during coolimg.
A little
Percentage weight of lead.
Atomic percentage of lead.
Freezing point centigrade.
Atomic fall.
0 0-315 0'628 0.939 1.25 2 *01 4.95 15.15
0 0 . lo 0.20 0.299 0'398 0'646 1 '62 5-35
419-22 418'7.2 418'16 417.74 417.73 417.73 417'63 417'63
5 '0 5 '3 4.95*
-t. ~~ ~~
* This, and all the followisg freezing points, are the same, because the zinc is These freezing points of the saturated alloy were very constant saturated with lead.
temperatures, and became more constant with each addition of lead. j. The stationary temperature here lasted 13 minutes without change.
TA4BLE VI.
ANTIMONY ADDED TO 250 GRAMS OF ZINC.
Coal gas burrning over the surface of the metal.
Percentage of auti- mony by weight.
0 0.273 0'669
1 -26 > Y
2 ')2)3 3 *37 4.47
Atomic pepcentage of antimony.
0 0.149 0.365
0?99
1 *;3
> >
1'86 2.49
Freezing point centigrade.
418.78 418.10 417.02 416.66 414.80 414.52 414'67 412% 412.57 412.65
Atomic fall.
4.5 4 '8 5 .8 4.98 6 '3$ 5 *1 4.84
§
$ The experiments were resumed here after a night's interval.
3 A very steady temperature.
Before the reading, the alloy was heated to a red heat to ensure the solution of the antimony.
Publ
ishe
d on
01
Janu
ary
1897
. Dow
nloa
ded
by L
omon
osov
Mos
cow
Sta
te U
nive
rsity
on
13/0
2/20
14 1
2:39
:43.
View Article Online
CONTAINING ZINC AND ANOTHER METAL. 395
~ 419 416.62 414.35 410-04 408.84
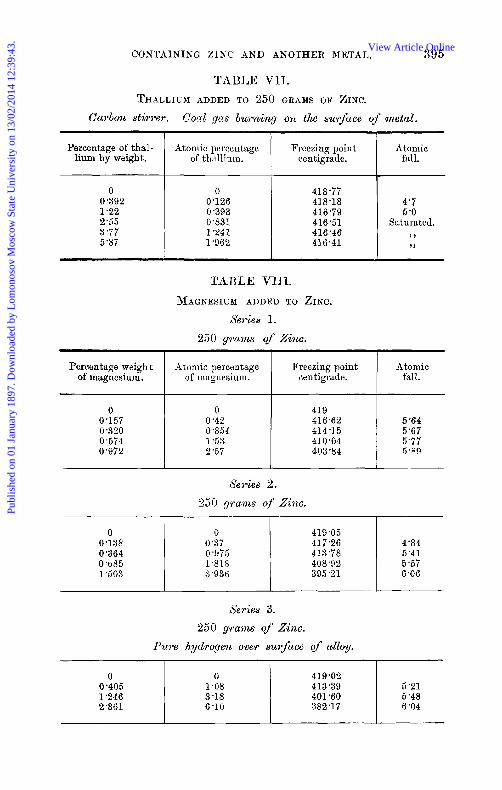
TABLE V1I. THALLIUM ADDED TO 250 GRAMS OF ZINC.
Carbon stirwr. Coal gas b w n i n y o n tlhe surfcice of metal.
Percentage of thal- lium by weight.
Atomic percentage of thallium.
Freezing point centigrade.
Atomic fall.
0 0.392 1.22 2-85 3.77 5-87
0 0'126 0-393 0.831 1 '241 1'962
418.77 418.18 416'79 416.51 416'46 416-41
4'7 5'0
Saturated.
TABLE vm. MAGNESIUM ADDED TO ZINC.
Seyies 1.
250 gvurns of Zio~c.
Percentage weight of magnesium.
Atomic percentage of maguesium.
Freezing point centigrade.
Atomic fall.
0 0.157 0.320 0.574 0'972
0 0 '42 0'854 1'53 2 *57
5'64 5 '67 5.77 5-89
se2vies 2 . 250 grams of Zinc.
0 0.138 0'364 0.685 1'503
0 0 *37 0.975 1'818 3'936
419.05 417.26 413.78 408'92 395'21
4'84 5 '41 5'57 6 '06
Series 3. 250 grams of Zinc.
Ptcre hydrogen over suyface of ulloy.
0 0'405 1 '246 2'361
0 1.08 3 . la 6 '10
41.9'02 413-39 401 *60 382'17
5 '21 5 '48 6'04
Publ
ishe
d on
01
Janu
ary
1897
. Dow
nloa
ded
by L
omon
osov
Mos
cow
Sta
te U
nive
rsity
on
13/0
2/20
14 1
2:39
:43.
View Article Online
396 HEYCOCK AND NEVILLE : THE FREEZING POINTS OF ALLOYS
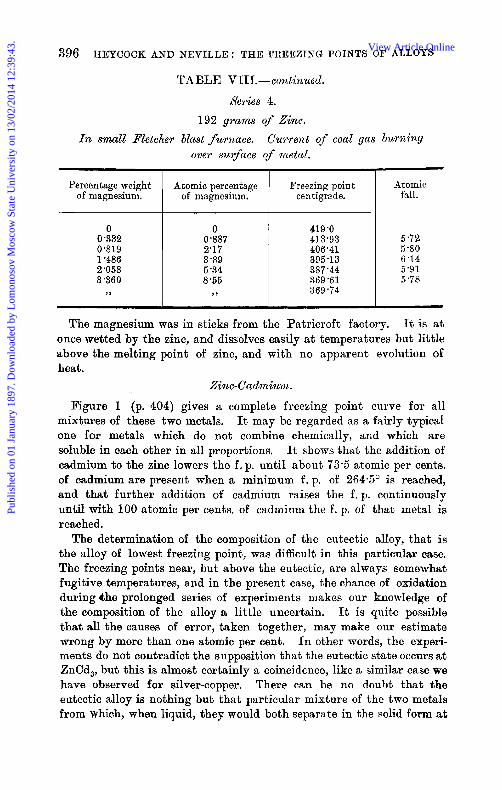
TABLE VII1,-continued.
Xeries 4. 192 gr-arns of Zinc.
over surface of metal. In small PZetchr blast furnace. Curreiit of coal gas burning
Percentage weight of magnesium.
0 0-332 0'819 1 *486 2,058 3.360
) ¶
Atomic percentage of magnesium.
0 0.887 2.17 3 -89 5 -34 8-55
> Y
Freezing point centigrade.
419.0 413.93 406'41 395.13 387'44 369'61 369.74
Atomic fall.
5 *72 5'80 6 -14 5'91 5-78
The magnesium was in sticks from the Patricroft factory. It is a t once wetted by the zinc, and dissolves easily at temperatures but little above the melting point of zinc, and with no apparent evolution of heat.
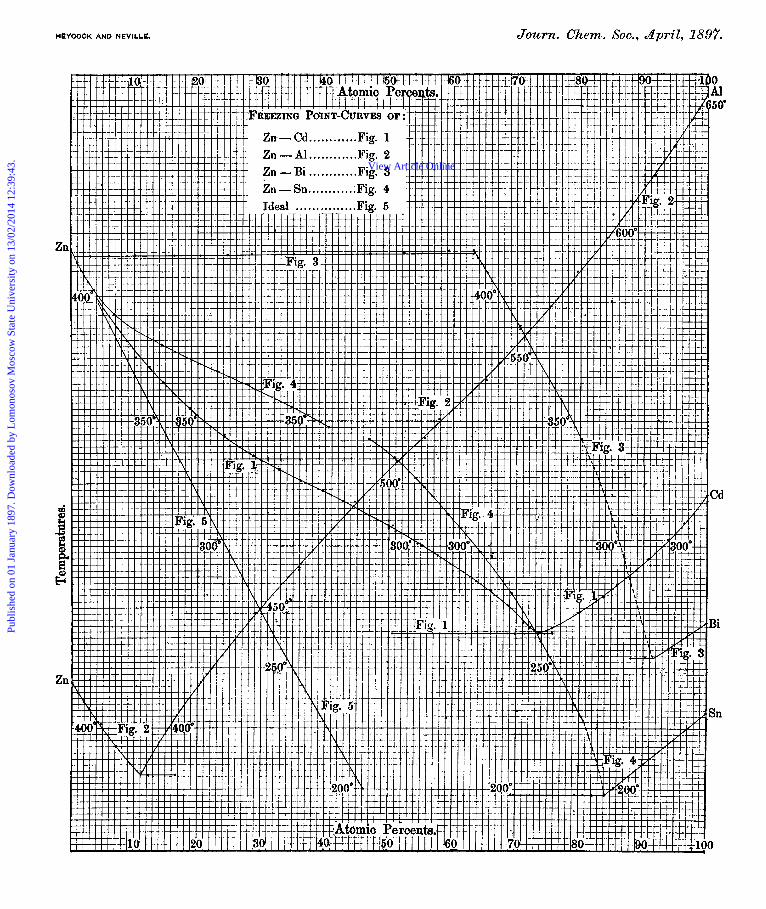
Zinc-Cadmium.
Figure 1 (p. 404) gives a complete freezing point curve for all mixtures of these two metals. It may be regarded as a fairly typical one for metals which do not combine chemically, and which are soluble in each other in all proportions. It shows that the addition of cadmium to the zinc lowers the f . p. until about 73.5 atomic per cents. of cadmium are present when a minimum f . p. of 264.5" is reached, and that further addition of cadmium raises the f. p. continuously until with 100 atomic per cents, of cadmium the f. p. of that metal is reached.
The determination of the composition of the eutectic alloy, that is the alloy of lowest freezing point, was difficult in this particular case. The freezing points near, but above the eutectic, are always somewhat fugitive temperatures, and in the present case, the chance of oxidation during t h e prolonged series of experiments makes our knowledge of the composition of the alloy a little uncertain. It is quite possible tha t all the causes of error, taken together, may make our estimate wrong by more than one atomic per cent. I n other words, the experi- ments do not contradict the supposition that the eutectic state occurs at ZnCd,, but this is almost certainly a coincidence, like a similar case we have observed for silver-copper. There can be no doubt that the eutectic alloy is nothing but that particular mixture of the two metals from which, when liquid, they would both separate in the solid form at
Publ
ishe
d on
01
Janu
ary
1897
. Dow
nloa
ded
by L
omon
osov
Mos
cow
Sta
te U
nive
rsity
on
13/0
2/20
14 1
2:39
:43.
View Article Online

CONTAINING ZINC AND ANOTHER METAL. 307
the same temperature; there is, therefore, no reascn for expecting it to be a chemical compound. In fact, although from the imperfection of our experimants we could not trace the curve close to the eutectic state, and have, therefore, drawn the figure as if the two branches passed into each other here with a continuous curvature, it is almost certain that, with perfect experiments, this eutectic point, like others, would be found to be an angle in which two entirely independent branches of the curve cut each other. The branch which starts from the f.p. of pure zinc, may be regarded as the f. p. curve of zinc, holding cadmium in solution, while the other branch is the f. p. curve of cadmium, holding zinc in solution. In the upper part of each branch, there is no doubt that pure zinc or pure cadmium respectively freeze out at the f. p,, and this may, perhaps, be the case throughout the whole of each branch, but the fact has not been verified by experi- ment. W e have not been able to find freezing points on either branch below the eutectic point; the curves, in fact, seem to end at their intersection, but if i t were possible to produce a state of superfusion in an alloy containing a little more zinc than the eutectic, we might, by dropping in a nucleus of cadmium, obtain a point on the cadmium branch below the eutectic. W e believe tha t some experimenters, using other binary mixtures, have thus traced the two branches a little way below the eutectic point.*
The f. p. of the eutectic alloy is more certainly determinable than its composition, for it can be found as a second freezing point of alloys of various compositions. For example, if we take an alloy containing '50 atomic per cents. of zinc, and therefore more zinc than the eutectic, melt it completely, and allow it to cool, we shall, a t 30S0, find a f. p. at which zinc, or, a t all events, something containing more zinc than the liquid, begins to separate as a solid. This process will go on as the alloy cools, until, by the continual separation of solid matter, the still liquid portion has reached the composition of the eutectic alloy. The temperature will now be 264.5', and will remain constant until every particle of the alloy has solidified, for the liquid is now saturated both with zinc and cadmium, and these metals will freeze out in the same proportions as those in which they are present in the liquid. If we start from an alloy on the cadmium side, a similar pro- cess will take place. Our figure shows the horizontal line of eutectic freezing points obtained in this manner.
The indications of chemical combination between the zinc and the cadmium are slight, if, indeed, such indications exist. But at Cd,Zn, there is a perceptible shoulder t o the curve, that might be regarded as a much degraded intermediate summit. This may be interpreted as indicating the existence of a compound CdZn, which, when melted, is
* Dahms, A m . Phzts. Chenz., 1894, 54, 486.
Publ
ishe
d on
01
Janu
ary
1897
. Dow
nloa
ded
by L
omon
osov
Mos
cow
Sta
te U
nive
rsity
on
13/0
2/20
14 1
2:39
:43.
View Article Online

398 HEYCOCK AND NEVILLE : THE FREEZING POINTS OF ALLOYS
very largely dissociated into its constituent metals. However, when we come t o the consideration of the zinc-tin and zinc-bismuth curves we shall see that another explanation of this feature is possible.
If the compound CdZn exists, then when alloys with more than 50 and less than 74 atomic per cents. of cadmium begin to solidify, we should expect this compound t o separate as a solid. If it were possible to collect the first precipitate free from mother liquid, we might settle the question, but the practical impossibility of doing this has caused 11s to abandon such methods OF attacking the problem. A proof, to our minds almost conclusive, against the view that a solid compound of the formula CdZn exists, lies in the fact that the temperature, after freezing had commenced at 50 atomic per cents. of cadmium, was not particularly steady, so that the alloy cannot have solidified homogene- ously. I n fact, at 50.7 atomic per cents. of cadmium, the eutectic temperature of 264.5" was well marked. This could not have been the case if a compound CdZn had been forming, for, in that case, there would have been little or no liquid left a t the eutectic temperature.
Zinc-A Zuminium.
Figure 2 (p. 404) gives a complete freezing point curve for these two metals. It is plotted on the same scale as figures 1, 3, 4 and 5 , but to economise space the f. p. of zinc and therefore the whole curve is shifted to a lower point on the page. The curve is essentially similar to that of zinc-cadmium. The eutectic alloy has a melting point of 380.5' and contains 11 atomic per cents. of aluminium.
We do not think that the curve shows an indication of chemical com- binations in any propwtion. The very slight tendency to an inflexion near 40 atomic per cents. of zinc is very probably due to the fact that near here the two series of experiments starting from opposite ends of the curve meet. The losses of metal from oxidation might be expected t o produce a fictitious raising of the curve which starts from the zinc elid and to lower that starting from the aluminium end, in the exact way shown on the curve.
Alder Wright * says tha t some alloys of these t w o metals separate into two liquid layers on standing for some time, but the form of our curve makes us doubt the accuracy of this statement. If it were so, the curve would resemble the zinc-bismuth curve in form.
The zinc-cadmium and zinc-aluminium alloys were amongst the earliest tha t we examined by means of platinum resistance pyrometers, and the experimental error is perhaps larger than in the case of the other experiments described in the present paper.
* PYOC. Roy. xoc., 45.
Publ
ishe
d on
01
Janu
ary
1897
. Dow
nloa
ded
by L
omon
osov
Mos
cow
Sta
te U
nive
rsity
on
13/0
2/20
14 1
2:39
:43.
View Article Online

CONTAINING ZINC AND AKOTHER METAL. so9
Zinc -Bismuth.
The zinc-bismuth curve, Figures 3 and 6 (p. 404), affords a typical example of the process of solidification for an alloy of two metals which are only partially miscible with each other. The curve shows that when bismuth is added to zinc the f. p. of the zinc is a t first lowered by an amount which is nearly proportional to the weight of bismuth present, until 0.65 atomic per cents. bismuth have been added. A further addition of bismuth produces absolutely no effect on the f. p. until as much as 6 3 . 2 atomic per cents., that is, 84.5 per cent. by weight, have been added. A still further addition of bismuth produces a fall in the f. p. almost as rapid as that caused at first, and at the same time the freezing points, from being extremely steady stationary t emperatures lasting for a long time without change, become very fugitive. After 80 atomic per cents. of bismuth, we could no longer detect these freezing points, but the eutectic f. p., again a very steady temperature, began t o show itself. W e have drawn, as a dotted line, a hypothetical continuation of the f. p. curve to the point where i t meets the other branch. W e are aided in determining the exact point of intersection by the fact that it must lie on the horizontal line of eutectic freezing points which are so easily determined. The curve shows that the intersection is close t o 92 atomic per cents. of bismuth.
Alder Wright * found that when alloys of zinc and bismuth were allowed t o remain for a considerable time at a constant temperature of 650”, they separated into two layers containing respectively 2.3 and 85.3 per cent. of bismuth by weight.
W e have now to account for the long upper flat on the curve, reach- ing from 0.65 to 63 atpmic per cents. of bismuth. This flat records the fact that between these limits the freezing point is quite inde- pendent of the composition of the alloy. But there is another peculiarity of this region. It is that each freezing point is a well- marked steady temperature remaining quite unchanged until a large amount of solid has been formed. I n some cases, however, we watched the thermometer until the temperature of the mass began to fall again, and this took place before the alloy set to a solid mass. I n this latter feature only does the process of solidification differ from that of a pure metal.
We have already, in a paper about to appear in the Tmnsactions of the Royal Society, discussed a similar phenomenon.? We shall, theref ore, here treat the point very briefly. The existence of the flat, and also the extremely steady temperature of each freezing point on it, are
+ See also Neville, Scienec Progress, iv., p. 4. * Proe. Boy. soc., 50, 388.
Publ
ishe
d on
01
Janu
ary
1897
. Dow
nloa
ded
by L
omon
osov
Mos
cow
Sta
te U
nive
rsity
on
13/0
2/20
14 1
2:39
:43.
View Article Online
400 HEYCOCK AND NEVILLE : THE FREEZING POINTS OF ALLOYS
due to the alloy in this region consisting of a pair of conjugabe liquids -zinc saturated with bismuth and bismuth saturated with zinc. The composition of these conjugates is given by the atomic percentages at the ends of the flat. Each of these liquids remains unchanged in composition throughout the flat, but, as the total percentage of bismuth increases, the alloy richest in bismuth grows at the expense of its conjugate. Moreover, both conjugates have the same freezing point and therefore, as the freezing proceeds, the residual liquid will still consist of the same two alloys. It will consequently not fall in tem- perature until one conjugate has wholly disappeared. When the con- jugate richest in zinc has gone, either through the separation of solid zinc or the addition t o the mixture of bismuth, we have a state of affairs represented by the second sloping line. Here, most probably, solid zinc is separating out of a solution of zinc in bismuth, and from the slope of the line it would appear that the latent heat of solution of zinc in such a mixture is almost the same as the latent heat of fusion of pure zinc. One of us has already drawn attention to the fact,* not then verified, t ha t if such a pair of conjugate alloys be raised to a sufficiently high temperature it must become a uniform- liquid. I n fact, starting from the two ends of our upper flat, a dome-shaped curve could be drawn giving the critical temperature of complete miscibility of every alloy of zinc and bismuth. Whether there would he a well- marked thermal change a t the moment when a homogeneous alloy began, through cooling, to separate into conjugates is doubtful : we have not hitherto been able to detect the phenomenon by means of our thermometers. Alder Wright's values for the composition of the two conjugates a t 650' give two points on the critical curve, and Spring and Romnnoff f have lately found tha t for zinc-bismuth the summit of the critical curve is near 850', whilst for the similar case of zinc-lead it is near 950'.
Our curve seems to show tha t the change from the homogeneous liquid to the pair of conjugates and vice ve?*scc is a very sharp one at the freezing point ; hence the two sloping parts of the curve meet the flat in angular points. This is not the case for all alloys which separate into conjugates.
It ought to be possible to continue the flat to tbe left beyond the angle at 0.65 atomic per cents. of bismuth, second or eutectic freezing points being found for alloys with less than this proportion of bismuth corresponding with the moment when the still liquid portion of each alloy has, by the separation of solid zinc, reached the state .of being saturated with bismuth. Unfortunately, we omitted to look for such points dux ing our experiments.
* ,Science Progress (Zoc. cit. ). t Zeit. anorg. Chenb., 1896, 13, 29.
Publ
ishe
d on
01
Janu
ary
1897
. Dow
nloa
ded
by L
omon
osov
Mos
cow
Sta
te U
nive
rsity
on
13/0
2/20
14 1
2:39
:43.
View Article Online

CONTAINING ZINC AND ANOTHER METAL. 401
Zinc- Tin. I n Figure 4 (p, 404), me give the f . p. curve of these two metals plotted
on the same scale as the zinc-bismuth, and lying nearly between the same limits of temperature. There is here no angle except tha t which always occurs where the two branches of the curve meet a t the lower eutectic point. The changes in curvature are all gradual, as we should expect in the case of two such metals as zinc and tin, whose alloys do not, under any circumstances, separate into conjugate liquids. I n fact, the zinc-tin resembles the zinc-cadmium curve, but the first ten atomic per cents. of t in produce a more rapid curvature than is the case with cadmium ; and a shoulder a t 50 atoms, which is barely perceptible in the cadmium curve, is well marked in tha t of tin. The shoulder is some- what exaggerated in the figure, owing to the fact that the two series of experiments which start from opposite ends of the curve, approach each other here, and through therinometric errors, or loss of metal by oxidation, do not quite meet. W e cannot however see, in any feature of the curve, an indication of the existence of chemical compounds such as the SnZn, that Alder Wright believed to exist.
Considered from the point of view of the physical theory of solu- tion, it would appear that, as the solution becomes more concentrated, the atoms of tin tend to form larger aggregates to a greater extent than do those of cadmium. I n fact, zinc-tin approximates more to the condition of zinc-bismuth than does the cadmium alloy. W e are per- haps too much in the habit of regarding as a perfect solution any liquid mixture which does not separate into conjugates. On the con- trary, there is probably an infinite series of gradations between that perfect state of solution in which the dissolved body, whatever may be its relation to the solvent, is divided into single atoms or molecules, and that in which it is on the point of separating in drops from the solvent liquid. W e may expect to see these degrees of dissolution reproduced in the freezing point cizrves as well as in other physical properties.
I n connection with this subject, it is not without interest to com- pare the preceding curves with Figure 5, which is the ideal f. p. curve for zinc containing another metal in solution. This curve is calculated from Le Chatelier’s equation,
2 log, x=h (; - 8 ) 1
where x is the concentration of zinc (the atomic percentage divided by loo), X is the latent heat of fusion of an atomic weight of zinc, and 8, and 8 are the freezing points, reckoned from absolute zero, of pure zinc and of the alloy respectively. The equation assumes tha t the molecular
Publ
ishe
d on
01
Janu
ary
1897
. Dow
nloa
ded
by L
omon
osov
Mos
cow
Sta
te U
nive
rsity
on
13/0
2/20
14 1
2:39
:43.
View Article Online
402 HEYCOCK AND NEVILLE : THE FREEZING POINTS OF ALLOYS
condition of both metals remains the same throughout as it was in the dilute solution, and tha t the heat of solution of the zinc in the alloy a t the lower temperature remains the same as the heat of fusion of the pure zinc at 419". The rapid divergence of the real curves from Figiire 5 shows how far these assumptions are from being true.
ThaZlium, Lead, Antimony, Jfc~gnesium, and X c k d in, Ziizc.
W e have (No. 2) carried our experiments on the addition of thallium o r lead to zinc very far, for Figures 8 and 9 and Tables VII and V show that these two curves, i f completed, would closely resemble tha t of zinc-bismuth. In all three cases, the addition of the second metal soon causes the alloy to separate into two conjugates, and we have the phenomena of the long upper flat repeated. So far as our experiments enable us to decide, we see from Figure 9 tha t zinc is saturated with thallium a t the freezing point, when 0.45 atomic per cents. of the lattey metal are present, and tha t the f. p. of the zinc is thereby lowered by 2.3'.
Similarly, Figure 8 shows tha t the zinc-lead alloy, at its freezing point, is saturated with lead when 0.26 atomic per cents. of lead are present, the temperature on the flat being 1 . 6 O below the f. p. of pure zinc.
The zinc-antimony curve of Figure 7, although similar in appearance to the two preceding, records a different phenomenon, Here, the angle at 412.6" and 1.25 atomic per cents. of antimony gives the lower eutectic f. p. and the composition of the eutectic alloy, and, as in the case of zinc-aluminium, there must be another branch starting from the eutectic angle and running up towards the f. p. of pure antimony. This curve would probably be worth completing.
I n drawing the antimony curve, but little weight is given to the second reading a t 0.365 atomic per cents,, as the atomic fall deduced from i t is obviously inconsistent with the others. Similarly, the second and third readings at 0.799 atomic per cents., taken after a night's interval, and after re-melting and heating the alloy to a red heat, have not so much value attached to them as the first.
Zinc- Magnesium.
This curve was not traced to saturation ; in fact, the part examined is nearly a straight line. A peculiarity of this curve lies in its steep- ness. From the beginning to the last experiment, the atomic falls caused by magnesium are greater than those due to any other metaJ. This is more remarkable, as the magnesium might be expected to oxidise more readily than the other metals, and losses from this cause would make the observed depressions too smdl.
Publ
ishe
d on
01
Janu
ary
1897
. Dow
nloa
ded
by L
omon
osov
Mos
cow
Sta
te U
nive
rsity
on
13/0
2/20
14 1
2:39
:43.
View Article Online

CONTAINING ZINC AND ANOTHER XETAL. 403
Zinc- Nicke I . A very small addition of nickel to zinc lowers t'he f. p., but the
limit is soon reached, and further additions of nickel produce no effect. The depression was too small to admit of trustworthy measurement.
Dilute Solutions and the Heut o f Pusion of Zinc. In Figures 6 to 12 (p. 404), the dilute solutions of the metals, whose
alloys with zinc we have discussed above, are given on a larger scale than the complete curves This plan enables us, as in the case of antimony, to reject unsatisfactory observations and to read off the mean atomic fall.
I f we wish to deduce from our results the latent heat of fusion of zinc, we are warned, by the rapid way in which the curves of Figures 1 and 4 rise above Figure 5, that i t is useless to consider solutions containing more than one or two atomic per cents. of dissolved metal. But dilute solutions present special difficulties, We have first the difficulty that the temperature differences measured are small com- pared with the probable error of experiment. This shows itself in the irregularity of the atomic falls for very dilute solutions; but when the conditions are favourable, as in the bismuth, the lead and the last of the tin series, we think the temperature differences of the early parts of each series, found probably within an hour of each other, may be trusted to within a very few hundredths of a degree.
A more serious difficulty is the tendency for the observed atomic falls in very dilute solutions to be abnormally large. This peculiarity is evident in the tin experiments, Table IVA (p. 392). Series 3 of this table was carried out much later than the others t o verify the fact. We have here to deal with a phenomenon that has been one of the main causes of error in modern cryoscopic work, and which was first dis- cussed in a systematic manner by Nernst and Abegg.* As we do not in our work surround the alloy by a bath of constant temperature, rz '' convergence temperature " does not, strictly speaking, exist, but since the furnace and the other bodies which are in thermal communication with the alloy are at a lower temperature than it at the moment of reading the f. p., we may regard the quantity t' - to in their formula T
fc t' = F - -- (t' - to) " K
as necessarily positive. It follows that t', t,he observed f . p., is lower than To, the true f. p. or equilibrium temperature. This applies to pure zinc as well as to the alloys, but Nernst and Abegg found that liT for pure water was much greater than for a solution, while k was probably the same for both. For similar reasonp, Rfo r a pure metal would probably
* Zeit. phgsik. (?hem., 1894, 15, 681. + Where to is the convergence temperature, and R and k are constants depending on the nature of the substance.
Publ
ishe
d on
01
Janu
ary
1897
. Dow
nloa
ded
by L
omon
osov
Mos
cow
Sta
te U
nive
rsity
on
13/0
2/20
14 1
2:39
:43.
View Article Online

406 HEYCOCK AND NEVILLE : THE FREEZING POINTS OF ALLOYS
Atomic per cents.
be greater than for an alloy. I n other words, our observed depressions must be greater than the true ones. The resulting error appears to affect the atomic falls of dilute solutions most seriously. It is clear, therefore, that we cannot hope to obtain a very accurate value of the latent heat from the experiments we have hitherto made. But it would not be impossibl2, by modifying our arrangements, to find K and k, and so largely increase the accuracy of the results.
The question now arises how to deduce the most probable value of the atomic fall from the numerous observed values. If me take the arithmetical mean of the atomic falls given in the tables, me attach undue importance t o the experiments on very dilute solutions where the experimental error is large. We think it a good plan to divide the arithmetical mean of the depressions, taken from column 3 of the tables, by the arithmetical mean of the atomic percentages taken from column 2. We thus give t o each experiment a weight in the result proportional to the temperature interval measured in it. We must confine ourselves to those early experiments for which the f. p. curve is a straight line, Thus, for bismuth, me have, from Table IIIA (p. 390), Series 1 and 2, the following.
Depressions o f f . 1'.
0.139 0'262 0.386 0.063 0.187
0.70" 1'27 1% 0 *34 1'09
This gives a mean depression of 1.052" for a mean concentration of
Applying this method to each of t.he other metals, we get the 0.2075 atomic per cents., or an atomic fall of 5.07.
following table.
Metal. Extreme
atomic per- centage.
Mean atomic percentage.
Bismuth ............ ,, from curve
Lead .................. Thallium ............ Tin .................. Magne siuni ......... Cadmium ............ Aluminium .........
Antimony * ......... 0.386 0.799 0.500 0'200 0 '393 1.187 0.975 1'464 0.99
0.2075 0.4377 0.500 0'150 0 9 5 9 5 0.655 0.655 0.732 0 '99
Mean depres- sion.
1.052" 2'247 2 '60 0'78 I .285 3.497 3-572 3.377 4-10
Mean atomic fall.
5-07 5-13
5-20 4'95 5'34 5.45 4'61
(4'14)
(5-20)
* Here we have taken ths mem reading a t 0-365, and also the mean reading a t 0.799, otherwise too much weight would have been given to these concentrations.
Publ
ishe
d on
01
Janu
ary
1897
. Dow
nloa
ded
by L
omon
osov
Mos
cow
Sta
te U
nive
rsity
on
13/0
2/20
14 1
2:39
:43.
View Article Online
HEYCOCK AND NEVILLE. Journ. Chem. Soc., April, 1897.
Publ
ishe
d on
01
Janu
ary
1897
. Dow
nloa
ded
by L
omon
osov
Mos
cow
Sta
te U
nive
rsity
on
13/0
2/20
14 1
2:39
:43.
View Article Online

HEYCOCK AND NEVILLE Journ. Chem. Soc., April, 1897.
Atomic Peroents.
ZINC AS SOLVENT.
The numbers immediately belo he line of each curve give the F. P en tigrade Temperature.
-
Atomic Percents.
Publ
ishe
d on
01
Janu
ary
1897
. Dow
nloa
ded
by L
omon
osov
Mos
cow
Sta
te U
nive
rsity
on
13/0
2/20
14 1
2:39
:43.
View Article Online
CONTAINING ZINC AND ANOTHER METAL. 405
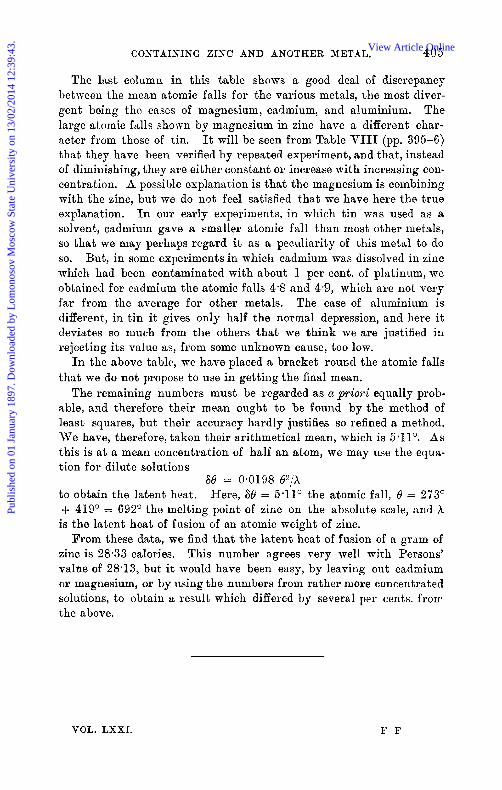
The last column in this table shows a good deal of discrepancy between the mean atomic falls for the various metals, the most diver- gent being the cases of magnesium, cadmium, and aluminium. The large atomic falls shown by magnesium in zinc have a different char- acter from those of tin. It will be seen from Table VIIT (pp. 395-6) that they have been verified by repeated experiment, and that, instead of diminishing, they are either constant or increase with increasing con- centration. A possible explanation is that the magnesium is combining with t%e zinc, but we do not feel satisfied that we have here the true explanation. I n our early experiments, in which t in was used as a solvent, cadmium gave a smaller atomic fall than most other metals, so tha t we may perhaps regard it as a peculiarity of this metal to do so. But, in some experiments in which cadmium was dissolved in zinc which had been contaminated with about 1 per cent. of platinum, we obtained for cadmium the atomic falls 4.8 and 4.9, which are not very far from the average for other metals. The case of aluminium is different, in t in it gives only half the normal depression, and here it deviates so much from the others tha t we think we are justified in rejecting i ts value as, from some unknown cause, too low,
I n the above table, we have placed a bracket round the atomic falls that we do not propose to use in getting the final mean.
The remaining numbers must be regarded as CL priori equally prob- able, aQd therefore their mean ought to be found by the method of least squares, but their accuracy hardly justifies so refined a method. We have, therefore, taken their arithmetical mean, which is 5.11". As this is a t a mean concentration of half an atom, we may use the equa- tion for dilute solutions
to obtain the latent heat. Here, 66 = 5.11' the atomic fall, 8 = 273' + 419" = 692' the melting point of zinc on the absolute scale, and X is the latent heat of fusion of an atomic weight of zinc.
From these data, we find tha t the latent heat of fusion of a gram of zinc is 28.33 calories. This number agrees very well 1vit.h Persons' valae of 28.13, but it would have been easy, by leaving out cadmium or magnesium, or by using the numbers from rather more concentrated solutions, to obtain a result which differed by several per cents. frorr the above,
se = 0.0198 ty/x
VOL. LXXI. E ' F
Publ
ishe
d on
01
Janu
ary
1897
. Dow
nloa
ded
by L
omon
osov
Mos
cow
Sta
te U
nive
rsity
on
13/0
2/20
14 1
2:39
:43.
View Article Online

406 HEPCOCK AKD NEVILLE : THE FREEZING POINTS OF ALLOYS
SECTION 11.
Hetals which q*aise the Bkeexing Point of Z i n c .
-We have found that silver, gold, copper, and perhaps platinum, in however small a quantity they are added to zinc, at once raise the f . p. and apparently cause the whole mass of metal to solidify above the f . p. of pure zinc.
I n the case of gold, copper, and platinum, we have only studied dilute solutions, but all alloys of silver and zinc have been examined. W e sliall, therefore, begin by discussing the experiments with zinc-silver. The results are given in Table IX, and in Figures 13, 14, and 15
I n the first four series, in which the temperature rarely rose so high as 600", me determined the composition of each alloy by calcula- tion from the weights of metal which had been placed in the crucible, but this method began t o be untrustworthy in series 3 and 4, on account of the oxidation of the zinc. In series 9, also, which, chronologically, was an early series, the composition mas deduced from the weights added, and it is a little curious that when once the zinc has been stirred into the molten silver, there is, in dilute solutions of zinc in silrer, very little further oxidation. But in the middle part of the curve, the burning away of the zinc was continuous, and it became quite clear that the composition of the alioy must be determined by malysis ; we therefore, a t first, after every few readings of the f. p., 2nd finally just before each reading, extracted samples of the alloy for analysis. This was done by means of pipettes made from somewhat thick-walled Jena glass tubes, One end of the tube was thickened rind drawn out to an almost capillary opening. The lower part of the pipette was heated to a faint-red heat, and dipped in the alloy a t a moment when the latter was 20 or 30 degrees above its f. p. The necessary amount of alloy was then sucked up into the pipette and withdrawn. The glass became very soft at the higher teniperatures i f left long in the alloy, but by carrying out the operation rapidly this iiiethod of extraction mas possible even a t the melting point of silver. The samples of alloy were in the shape of thin rods of a very con- venient form for examination.
A portion of each sample was weighed, dissolved in nitric acid, and its content of silver estimated by ammonium thiocyanate solution which had been carefully standardised on the same silrer as that used in the experiments. The graduated instruments employed had been tested
!p. 422).
Publ
ishe
d on
01
Janu
ary
1897
. Dow
nloa
ded
by L
omon
osov
Mos
cow
Sta
te U
nive
rsity
on
13/0
2/20
14 1
2:39
:43.
View Article Online

CONTAINIXG ZINC AXD ANOTHER METAL. 407
0 4 'TS 9 . l5
> >
by the Berlin physikalishe Anstalt, and t,he control analyses agreed, as a rule, to within very nearly 1 in 1000. The percentage of zinc was obtained by subtracting that of silver from 100. It is obvious that this method ceases to be satisfactory when the percentage of zinc is a small one ; hence the first result of Series 11 (p. 412) is not more trustworthy than that of Series 9 (p. 410).
0 419'7 2 '06 430.4 5 . i 6 497'6"
1 9 429.S
TABLE IXA.
SILVER ADDED TO ZINC.
Xeries 1. 300 gmnas of Zim.
Percentage of silver present.
Atomic percentage of silver.
0 0'164 0.328 1-14 1 ' 9 4 3.50
0 0 '1 0 '2 0.7 1'19 2'15
Freezing point centigrade.
418'8 419.23 419.64 421 '9" 424.35 42970
The silver used in this series was prepared by Stas' method. * A t this stage, the alloy was heated more than 100" above the freezing point of
eiiic, iii order t o bring the silver into solntion. At the recorded temperature, n precipitate began to form, and at the elid of 5 minutes, the teiiiperature haviiig fallen less than a degree, almost the whole mass had beeonie solid from the bottom upwards.
I n plotting this series, we have added 0.S' to all the freezing points to iiittke the freezing point of zinc the same as in Series 2 and 3.
Publ
ishe
d on
01
Janu
ary
1897
. Dow
nloa
ded
by L
omon
osov
Mos
cow
Sta
te U
nive
rsity
on
13/0
2/20
14 1
2:39
:43.
View Article Online

408 HEYCOCK AND NEVILLE : THE FREEZING POISTS O F ALLOYS
Percentage of silver present.
Atomic percentnge of silver.
Freezing point centigrade.
0 4'11
7 .b's 8 *'5'0
0 2.53
4 *;2
5*;3
419-6 441*On 430'4-1- 478-7 430'41 495.2 3 430-0 538.3 ( 1 429.1 TT
I
* Here the rate of cooling became twice as slow. -k Here the rate of cooling became three times as slow, and a precipitate began to
form. After a fall of two or three degrees below this point, the alloy was a solid mass. The period of constant temperature at the freezing point is not so prolonged as in the case of eutectic poiqits.
$ The alloy becomes a thick paste before this point is reached, but a t this point the rate of cooling becomes three or four times as slow as immediately before, to quicken again after the freezing point of zinc is reached.
5 The mass soon gets pasty after this point. 11 Here the rate of cooling became for a few degrees twice as slow as before, but i t
gradually became quicker, and attained its previous rate before the lower point was reached.
TI Here the halt in the cooling, though well marked, was more fugitive than with solutions containing less silver.
Towards the end of this series, we began to notice some oxidation Qf
the zinc.
Xeries 4. 120 grums of Zinc.
19-82 24.84
13'04 16.71
571 -3" 593.9
* This is a well-marked point, the rate of cooling becoming nearly three times as After the freezing point, stirring soon becomes impossible.
All the silver seems to dissolve below 600°, and at this temperature slow as before the point.
carbon appears to reduce the zinc oxide.
Sepies 5. #due?- added to Zinc.
This series was commenced by melting together 120 grams of zinc and 40 grams of silver. After taking the freezing point, more silver was added, the total weight of silver present being recorded in column 1.
At the end of the series, the percentage of silver in the alloy was
Publ
ishe
d on
01
Janu
ary
1897
. Dow
nloa
ded
by L
omon
osov
Mos
cow
Sta
te U
nive
rsity
on
13/0
2/20
14 1
2:39
:43.
View Article Online
CONTAINlNG ZINC AND ANOTHER METAL. 409
3 l 2 1
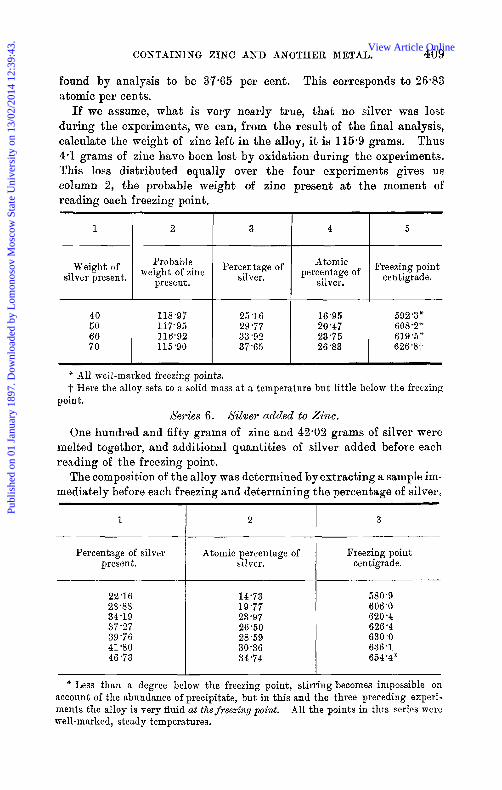
found by analysis to be 37.65 per cent. This corresponds to 26.83 atomic per cents.
If we assume, what is very nearly true, that no silver was lost during the experiments, we can, from the result of the final analysis, calculate the weight of zinc left in the alloy, it is 115.9 grams. Thus 4.1 grams of zinc have been lost by oxidation during the experiments. This loss distributed equally over the four experiments gives us column 2, the probable weight of zinc present at the moment of reading each freezing point.
4 5
Weight of silver present.
Percentage of , e ~ ~ ~ ~ ~ of Freezing point centigrade. silver.
weight of silver. present.
, 40 50 60 70
118.97 117.95 116'92 115'90
25.16 16.95 592*3* 29.77 20.47 6 o a v 33 '92 23-75 619.5" 37-65 26 *83 626.Sj.
* A11 well-marked freezing points. t Here the alloy sets to a solid mass a t a temperature but little below the freezing
point. Seyies 6. Silver udded to Zinc.
One hundred and fifty grams of zinc and 42.02 grams of silver were melted together, and additional quantities of silver added before each reading of the freezing point.
The composition of the alloy mas determined by extracting a sample im- mediately before each freezing and determining the percentage of silver,
I I
1 2 3
Percentage of silver present.
Atomic percentage of silver.
Freezing point centigrade.
22'16 25.88 34'19 37'27 39'76 41 '80 46*73
14.73 19.77 23'97 26.50 28.59 30.36 34-74
580.9 606.0 620 -4 626'4 630.0 636-1 654*4*
I I
* Less than a degree below the freezing point, stirring becomes impossible on account of the abundance of precipitate, but in this and the three preceding experi- ments the alloy is very fluid at the freezing point. All the points in this series were well-marked, steady temperatures.
Publ
ishe
d on
01
Janu
ary
1897
. Dow
nloa
ded
by L
omon
osov
Mos
cow
Sta
te U
nive
rsity
on
13/0
2/20
14 1
2:39
:43.
View Article Online
410 HEYCOCK AND NEVILLE : THE FREEZING POISTS O F ALLOYS
1 2 3
Percentage of silver presen t.
Atomic percentage of silver.
Freezing point centigrade.
45'15 43.72 42'17 40'69
33'31 32.03 30.67 39-39
649 *5 644.5 638'1 6 3 1 2
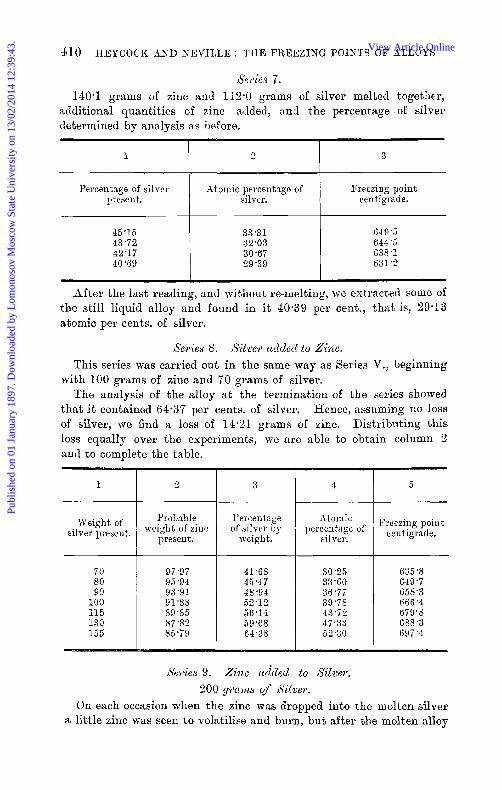
After the last reading, and without re-melting, w e extracted some of the still liquid alloy and found in i t 40.39 per cent,, tha t is, 29.13 atomic per cents. of silver.
Se&s 8. This series was carried out in the same way as Series V., beginning
with 100 grams of zinc and 70 grams of silver. The analysis of the alloy at the termination of the series showed
tha t it contained 64.37 per cents. of silver, Hence, assuming no loss of silver, me find a loss of 14.21 grams of zinc. Distributing this loss equally over the experiments, we are able to obtain column 3 and to complete the table,
SiZz'ei* nclclerl to Zinc.
1
Weight of silver present.
?O 80 90
100 115 130 155
4
Probable weight of zinc
present.
97.97 95'94 93 '91 91'88 89'85 87'82 85'79
3
Percentage of silver by
weight.
41.68 45.47 48 '94 52.12 56.14 59.68 64-38
4
Atomic percentage of
silver.
30.25 33.60 36-77 39.78 43.72 47'33 52.30
5
Freezing poia t centigrade.
635.8 649.7 6 5 8 3 666'4 679.8 688.3 697.4
Ses-ies 9. 500 g m m of Siiz;ei*.
On each occasion when the zinc was dropped into the molten silver a little zinc was seen t o volatilise and burn, but after the molten alloy
Publ
ishe
d on
01
Janu
ary
1897
. Dow
nloa
ded
by L
omon
osov
Mos
cow
Sta
te U
nive
rsity
on
13/0
2/20
14 1
2:39
:43.
View Article Online

CONTAINING ZINC AKD ANOTHER JIETAL. 417.
had been stirred, no further burning of zinc was noticed while the solution was dilute in zinc, W e thought tha t there was a more rapid and irregular loss of zinc during the latter part of the series. From thig cause, or fo i l some other reason, the freezing points of this series deduced from the weights of metal used do not lie on a smooth curve. This might be due to a real singularity in the curve, but as the first five points of this series agree very well with Series 10, whilst the later points do not, we are disposed to think that after 21.9 atomic p w cents. of zinc there is an experimental error in Series 9, probably due to irregular and more rapid burning of zinc. VVe, therefore, only use in clrawing the curve the first five points of Series 9, and the last point which, being based on an analysis, is trustworthy. This analysis might be used to correct the weight of zinc present a t tho previous readings, as was done in Series 5 and 8, but owing probably to the irregular rate a t which the zinc was lost, this method of correction does not improve matters.
I n column 1 we give the nominal weights of zinc in the crucible, assuming no loss. These are, of course, all greater than the true weights, and therefore a curve plotted from them must lie above t'he true curve. The t rue weight of zinc present a t the last reacting was 120.35, and it is from this number that the last percentage of zinc is calculated.
Total weight of zinc present.
0 6 -13
11.22 22'88 34.05 50.202 57.72 1 65-62? 78 *52 '?
92.672 107.87 Z 132*07?
Percentage weight of zinc.
0 2.97 5-31
10.27 14.55 23.06 22.40 24.70 25'19 31.66 35'04 37-57::
Atomic percentage of zinc.
0 4.81
15'86 21.90 29% 32 '2 35 '1 39 '3 43.3 47'06 49.79:
a 4 6
Preezing point centigrxcic.
958'9 926.9 900.7 s49 '1 508.6 7 6 3 -9 7 8 0 *9 734'5 711.1 z0673-k 103.0 695'7:
* A soft precipitate was noticed some little time before the freezing point mas
.t. il very steady temperature. $ The composition determined by analysis.
read, and this point became here a steadier temperature thau with less zinc.
Swies 10. Zinc nddecl to X i l v e ~ . This series contains a number of points deteiw~iizetl by analysis and
marked A in the fourth column of the table, and also a nnmber of points for which the percentage composition is cowectetl by the following
Publ
ishe
d on
01
Janu
ary
1897
. Dow
nloa
ded
by L
omon
osov
Mos
cow
Sta
te U
nive
rsity
on
13/0
2/20
14 1
2:39
:43.
View Article Online

412 HEYCOCK AND NEVILLE : TEIE FREEZING POINTS OF ALLOYS
analysis as in Series 5 and 7. Each sample taken out of the crucible for analysis was weighed, and hence, assuming that there mas no accidental loss of silver, we mere able to form column 1 of the table, the weight of silver present at each reading of a freezing point.
Column 2 gives the weight of zinc added to or taken from the crucible immediately before each reading.
Column 3 gives the weight of zinc present, deduced from analysis 01- corrected by analysis.
Column 4 gives the percentage by weight of zinc, and column 5 the atomic percentage.
Column 6 gives the freezing point.
1.
Weight of silver present.
2.
XTeigh t of zinc added before each :xperimen t.
0 + 48-51 + 9-45 - 3‘46 + 7’57 + 8’60 + 6‘75 + 10% .- 8‘32 + 10’94 + 14-72 + 15.72
+ 23.65 + 20’15
+ 23.65
+ 31.10
- 13.05
- 12.61
- 40.05
~
3.
Weight o C zinc present zorrected by
analysis.
0 47.51 55.93 52-52 58’53 65-57 70.76 80.06 71-74 80 5 4 93.12
106’7 93’65
115’41 133.67 121.06 142‘82 102.77 132.43
~~
4.
Percentage of zinc by weight.
0 19-20 2 1 . 8 7 ~
23’*+9 25’91 27‘40 29.9211
32’*i1 35-66 3 8 . 8 4 ~
43’bO 47 ‘55 ti
51%9 A
57:;5a
Atomic percentage
of zinc.
0 28’14 31-57
36.56 38.35 41.31
33’47
44:i4 47’74 51-15
56’.b3 59’90
6 3 ’ h
69’-i2
Seyies 11. Zinc added to 200 grams of Silver.
6.
Freezing point
centigrade.
959.2 764.0 742.0 745.1 728-1 711.6 707.6 705.1 705.8 702’2 697-5 691-2 692 ‘8 679.S 667-5 669.3 657.2
636.5 658‘.0
I n the Fletcher blast furnace with coal-gas burning over the surface of the metal.
The composition of the alloy was determined immediately before each reading by extracting a few grams with a Jena glass pipette, and estimating the silver with ammonium thiocyanate.
Publ
ishe
d on
01
Janu
ary
1897
. Dow
nloa
ded
by L
omon
osov
Mos
cow
Sta
te U
nive
rsity
on
13/0
2/20
14 1
2:39
:43.
View Article Online
CONTAINING ZINC AND ANOTHER METAL. 413
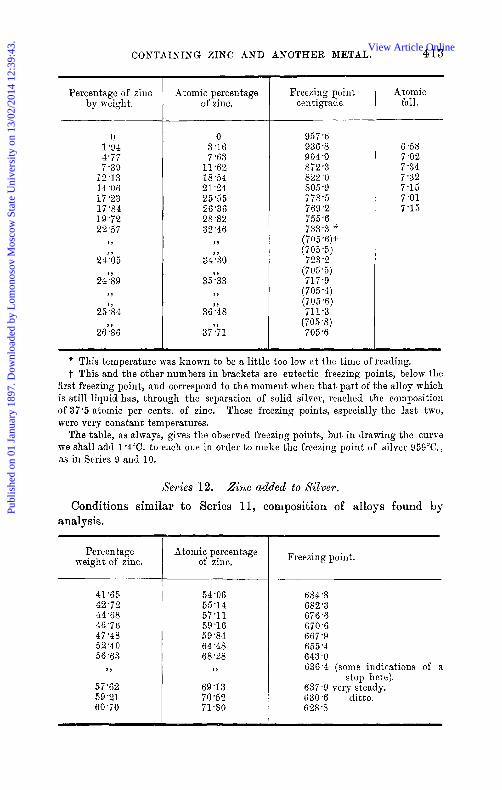
Percentage of zinc by weight.
0 1 '9-1 4.77 7.39
12.13 14-06 1 7 *23 17'86 19.72 22.57
1 ,
24YE
24'?39 ,,
Atomic percentage of zinc.
0 3-16 7'63
11.62 18-54 21 '24 25-55 26-36 28.82 32.46
9 9
Freezing point centigrade.
957'6 936.8 904.0 872.3 822 +O 805.9 778.5 z69.2 455'6 733'3 *
(705'6)T (705.5) 723.2
(705.5) 717.9
(705 '4) (705 '6) 711'3
(705.8) 705 '6
Atomic fall.
6.58 7.02 7 '34 7 *32 7.15 7 *01 7-15
* This temperature was known to be a little too low at the time of reading. -t. This and the other numbers in brackets are eutectic freezing points, below the
first freezing point, and correspond to the moment when that part of the alloy which is still liquid has, through the separation of solid silver, reached the compositioii of 37'5 atomic per cents. of zinc. These freezing points, especially the last tTo , were very cons tan t temperatures.
The table, as always, gives the observed freezing points, but in drawing the curve we shall add 1.4"C. t o each one in order to make the freezing point of silver 959"C., as in Series 9 and 10.
Xeyies 12. Zinc added to Silver. Conditions similar t o Series 11, composition of alloys found by
analysis.
Percentage weight of zinc.
41 '65 42.72 44'68 46 '76 47-48 52.40 56.63
57-68 59'21 60'70
Y ,
Atoinic percentage of zinc.
54.06 55.14 57 '1 1 59 '16 69'84 64.45 68.28
69'13 70.52 71.80
9 ,
684'8 682.3 676.6 670.6 667'9 655'4 643.0 636'4 (some indications of R
637.9 very steady. d30.6 ditto. 628'8
stop here).
Publ
ishe
d on
01
Janu
ary
1897
. Dow
nloa
ded
by L
omon
osov
Mos
cow
Sta
te U
nive
rsity
on
13/0
2/20
14 1
2:39
:43.
View Article Online
414 HEYCOCK AND NEVILLE : THE FREEZING POINTS OF ALLOYS
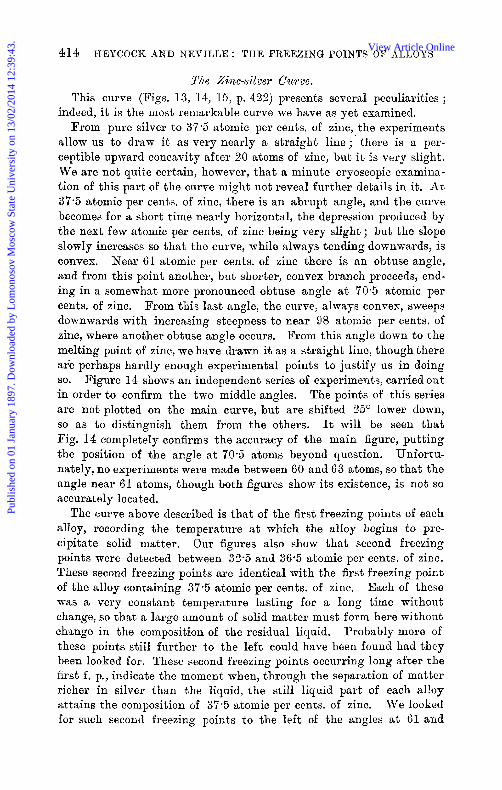
The Ziiws2ce.r. Czwve . This curve (Figs. 13, 14, 15, p. 422) presents several peculiarities ;
indeed, it is the most remarkable curve we have as yet examined. From pure silver to 37.5 atomic per cents. of zinc, the experiments
allow us to dram it as very nearly a straight line ; there is a per- ceptible upward concavity after 20 atoms of zinc, but it is very slight,. We are not quite certain, however, that a minute cryoscopic examina- tion of this part of the curve might not reveal further details in it. At 37.5 atomic per cents. of zinc, there is an abrupt angle, and the curve becomes for a short time nearly horizontal, the depression produced by the next few atomic per cents. of zinc being very slight; but the slope slowly increases so that the curve, while always tending downwards, is convex. Near 61 atomic per cents. of zinc there is an obtuse angle, and from this point another, but shorter, convex branch proceeds, end- ing in a somewhat more pronounced obtuse angle a t 70.5 atomic per cents. of zinc. From this last angle, the curve, always convex, sweeps downwards with increasing steepness to near 98 atomic per cents. of zinc, where mother obtuse angle occurs. From this angle down to the melting point of zinc, we have drawn it as a straight Iine, though there a te perhaps hardly enough experimental points to justify us in doing so. Figure 14 shows an independent series of experiments, carried out in order to confirm the two middle angles. The points of this series are not plotted on the main curve, but are shifted 25' lower down, SO as to distinguish them from the others. It will be seen that Fig. 14 completely confirms the accuracy of the main figure, putting the position of the angle a t 70.5 atoms beyond question. Unfortu- nately, no experiments were made between 60 and 63 atoms, so that the angle near 61 atoms, though both figures show its existence, is not so accurately located.
The curve above described is that of the first freezing points of each alloy, recording the temperature a t which the alloy begins to pre- cipitate solid matter. Our figures also show that second freezing points mere detected between 32-5 and 36.5 atomic per cents. of zinc. These second freezing points are identical with the first freezing point of the alloy containing 37.5 atomic per cents. of zinc. Each of these was a very constant temperature lasting for a long time without change, so that a large amount of solid matter must form here without change in the composition of the residual liquid. Probably more of these points still further to the left could have been found had they been looked for. These second freezing points occurring long after the first f. p., indicate the moment when, through the separation of matter richer in silver than the liquid, the still liquid part of each alloy attains the coniposition of 37.5 atomic per cents. of zinc. We looked for such second freezing points to the left of the angles a t 61 and
Publ
ishe
d on
01
Janu
ary
1897
. Dow
nloa
ded
by L
omon
osov
Mos
cow
Sta
te U
nive
rsity
on
13/0
2/20
14 1
2:39
:43.
View Article Online

COXT~~INI8"G ZINC AKD ANOTHER METAL. 415
70.5 atomic per cents. of zin2, but, with one doubtful exception, ~ v e failed to find any.
From 90 to 98 atomic per cents. of zinc, a mell-marked horizontal row of second freezing points is seen. A good deal of solid matter separates before the temperature falls t o the level of these second freezing points, but they are well-marked, very stationary tempera- tures, becoming steadier and steadier with each addition of zinc. They are hardly so steady as a eutectic point, but a degree or two below them the alloy sets t o a solid mass.
The first f . p. differs a good deal in character at different parts of the curve. That of pure silver is a very constant temperature, but when a few per cents. of zinc have been added, it is much more fugitive. At about 32 atomic per cents. of zinc, we noticed tha t the period of constant temperature at the f . p. became longer. On the almost horizontal portions of the curve which occur immediately to the right of each of the first three angles, there is a prolonged halt in the cooling at the f . p. For example, a t 65.3 atoms of zinc the alloy appeared to solidify a t a constant temperatnre, and at 73.2 atoms it mas noticed tha t the alloy set t o a hard mass a t or very near the f. p. At 70.5 atoms of zinc, the f. p. was very steady, and a t 40 atoms the period of constant temperature a t the f. p. was prolonged. It is clear that, wherever we see the curve to be nearly horizontal, we can predict tha t the freezing point will be marked by a very steady temperature, for much solid matter must form before the composition of the liquid can alter sufficiently to change the f. p. perceptibly. The converse is not, however, true, for between 98 and 100 atoms of zinc the freezing point curve is a line sloping rapidly downwards, whilst each freezing point is an absolutely constant temperature at which the whole alloy solidi- fies. W e noticed it peculiarity similar t o this in the freezing points of cadmium containing tt little silver. From 80 to 98 atoms of zinc, the upper freezing point is very fugitive, and it is clear th3t very little soiid matter is formed a t the f. p.
Description of the SiZp;ei*-xirzc Alloys. The samples of alloy extracted for analysis were broken by repeated
bending, or, when necessary, by hammering. W e thus obtained a rough estimate of the degree of toughness or brittleness of the speci- men, and were able to examine the fractured surface with a lens, There was also sometimes a free surface where the alloy had solidified in contact with the air. It is known that the information that can be gained from such an examination is very complicated and much affected by the rates at which the metal has cooled, but a few features struck US as worth recording.
From pure silver to 34.3 atomic per cents. of zinc, the alloy is fairly
Publ
ishe
d on
01
Janu
ary
1897
. Dow
nloa
ded
by L
omon
osov
Mos
cow
Sta
te U
nive
rsity
on
13/0
2/20
14 1
2:39
:43.
View Article Online
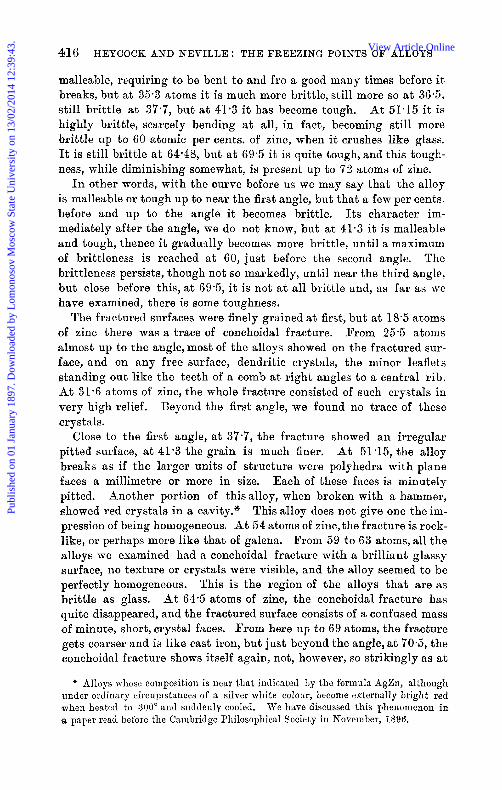
416 HEPCOCK AND NEVILLE : THE FREEZING POINTS OF ALLOYS
malleable, requiring to be bent to and fro a good many times before it, breaks, but at 35.3 atoms it is much more brittle, still more so at 36.5, still brittle at 37.7, but at 41.3 it has become tough. At 51.15 it is highly brittle, scarcely bending at all, in fact, becoming still more brittle up t o 60 atomic per cents. of zinc, when it crushes like glass. It is still brittle at 64.18, but a t 69.5 it is quite tough, and this tough- ness, while diminishing somewhat, is present up to 72 atoms of zinc.
I n other words, with the curve before us we may say that the alloy is malleable or tough up to near the first angle, but that a, few per cents. before and up to the angle it becomes brittle. Its character im- mediately after the angle, we do not know, but at 41.3 it is malleable and tough, thence it gradually becomes more brittle, until a maximum of brittleness is reached at 60, just before the second angle. The brittleness persists, though not so markedIy, until near the third angle, but close before this, at 69.5, it is not at all brittle and, as far as we have examined, there is some toughness.
The fractured surfaces were finely grained a t first, but a t 18.5 atoms of zinc there was a trace of conchoidal fracture. From 25.5 atoms almost up to the angle, most of the alloys showed on t'he fractured sur- face, and on any free surface, dendritic crystals, the minor leaflets standing out like the teeth of a comb a t right angles to a central rib. At 31.6 atoms of zinc, the whole fracture consisted of such crystals in very high relief. Beyond the first angle, we found no trace of these crys t als.
Close t o the first angle, at 37.7, the fracture showed an irregular pitted surface, at 41.3 the grain is much finer. At 51.15, the alloy breaks as if the larger units of structure were polyhedra with plane faces a millimetre or more in size. Each of these faces is minutely pitted. Another portion of thisalloy, when broken with a hammer, showed red crystals in a cavity." This alloy does not give one the im- pression of being homogeneous. At 54 atoms of zinc,the fracture is rock- like, or perhaps more like that of galena, From 59 to 63 atoms, all the alloys me examined had a conchoidal fracture with a brilliant glassy surface, no texture or crystals were visible, and the alloy seemed to be perfectly homogeneous. This is the region of the alloys that are as brittle as glass. At 64.5 atoms of zinc, the conchoidal fracture has quite disappeared, and the fractured surface consists of a confused mass of minute, short, crystal faces. From here up to 69 atoms, the fracture gets coarser and is like cast iron, but just beyond the angle, at 70.5, the conchoidal fracture shows itself again, not, however, so strikingly as at
* Alloys whose composition is near t ha t indicated by the formula AgZn, although under ordinary c i r cup tances of a silver white colorrr, become externally bright red when heated to 300" and suddenly cooled. We have discussed this phenomenon in a paper read before the Cambridge Pliilosophical Society in November, 1896.
Publ
ishe
d on
01
Janu
ary
1897
. Dow
nloa
ded
by L
omon
osov
Mos
cow
Sta
te U
nive
rsity
on
13/0
2/20
14 1
2:39
:43.
View Article Online
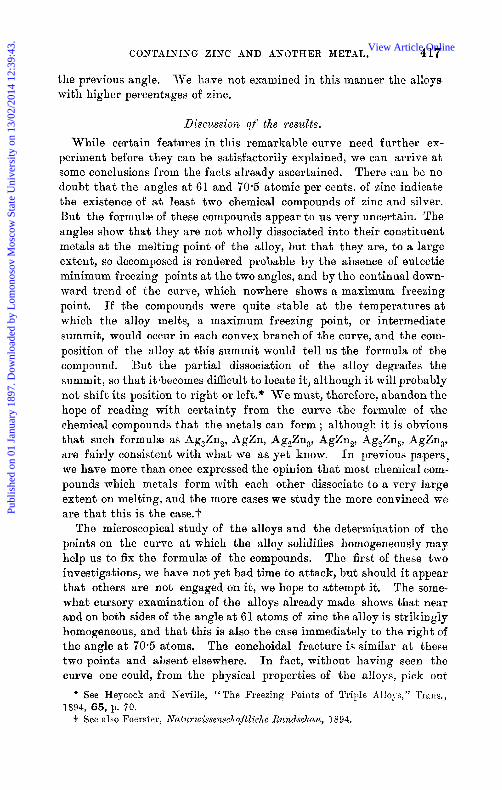
CONTAINING ZINC AND ANOTHER METAL. 417
the previous angle. with higher percentages of zinc.
W e have not examined in this manner the alloys
Discussion of the i*esuZts.
While certain features in this remarkable curve need further ex- periment before they can be satisfactorily explained, we can arrive at some conclusions from the facts already ascertained. There can be no doubt tha t the angles a t 61 and 70.5 atomic per cents. of zinc indicate the existence of a t least two chemical compounds of zinc and silver. But the formulae of these compounds appear to us very uncertain. The angles show tha t they are not wholly dissociated into their constituent metals at the melting point of the alloy, but that they are, to a large extent, so decomposed is rendered probable by the absence of eutectic minimum freezing points at the two angles, and by the continual down- ward trend of the curve, which nowhere shows a maximum freezing point. If the compounds were quite stable a t the temperatures at which the alloy melts, a maximum freezing point, or intermediate summit, would occur in each convex branchof the curve, and the com- position of the alloy a t this summit mould tell us the formula of the compound. But the partial dissociation of the alloy degrades the summit, so tha t itsbecomes difficult to locate it, although it mill probably not shift its position to right or left.” W e must, therefore, abandon the hope of reading with certainty from the curve the forivulae of the chemical compounds tha t the metals can form; although it is obvious that such formulae as Ag,Zn,, AgZn, Ag,Zn3, AgZn,, Ag,Zn,, AgZn,, are fairly consistent with what we as yet know. I n previous papers, we have more than once expressed the opinion that most chemical com- pounds which metals form with each other dissociate to a very large extent on melting, and the more cases we study the more convinced we are tha t this is the case.?
The microscopical study of the alloys and the determination of the points on the curve a t which the alloy solidifies homogeneously may help us to fix the formulae of the compounds. The first of these two investigations, we have not yet had time to attack, but should it appear that others are not engaged on it, we hope to attempt it. The some- what cursory examination of the alloys already made shows that near and on both sides of the angle a t 61 atoms of zinc the alloy is strikingly homogeneous, and that this is also the case immediately to the right of the angle a t 70.5 atoms. The conchoidal fracture is similar at these two points and absent elsewhere. I n fact, without having seen the curve one could, from the physical properties of the alloys, pick out
* See Heycock and Keville, “The Freezing Points of TriiJe Alloys,” Trans., 1894, 65, p. 70. + See also Foerster, ,~rutzirwissenschuftliche Rzcndsschnzc, 3 894.
Publ
ishe
d on
01
Janu
ary
1897
. Dow
nloa
ded
by L
omon
osov
Mos
cow
Sta
te U
nive
rsity
on
13/0
2/20
14 1
2:39
:43.
View Article Online

418 HEYCOCIC AND KEVILLE : THE FREEZIKG POINTS OF ALLOYS
these two points as similar and specially remarkable. The period of constant temperature a t the freezing point is also very prolonged here, But all these features can be explained in a t least two ways,-either the angles are eutectic points, in which case the alloy solidifying, though not a chemical compound, is necessarily very homogeneous, or else, in opposition to the simpler theory of the freezing point curve, they cor- respond to chemical compounds. Assuming dissociation, the occurrence of an angle at the formula of a compound that really exists in the solid state does not contradict the theory.
The fact that an alloy appears to solidify at a constant temperature may be due to one of several causes.
1. The liquid alloy may consist of two conjugate liquids, as in the case of zinc-bismuth. We are not at all sure that the first angle at 37.5, together with the flat to the right of it, may not be due to this cause.
2. The alloy may be an ordinary eutectic alloy, or, to speak more generally, the solid forming may consist of two conjugate solids. These two cases may be brought under one heading, but with this difference, that in case (1) the eutectic alloy occurs above the melting point of the more fusible metal, while in case (2) it occurs a t or below this melting point.
3. The solid forming may be a definite compoundof the same coru- position as the liquid from which it is separating. This may ba the explanation of the steady temperatures at 61 and 70.5 atoms of zinc. We should expect this to ha,ppen a t a summit corresponding to a stable compound, but we have not yet found such a case; gold-aluminium and some other aluminium alloys would very probably afEord instances of this. 4. The two substances present in the liquid alloy may be solidifying
isoinorphously in the same proportion as that in which they are present in the liquid. It has occurred to us that the short line, from 100 to 98 atomic per cents. o€ zinc, which, if produced, passes nearly through the f. p. of pure silver, may indicate that, in this region, the zinc and silver are separating isomorphously. But this point, like the similar cases of zinc-gold and zinc-copper, is one that needs further investiga- tion. I t may be that the isomorphism is not between zinc and silver, but between zinc and a compound of silver and zinc. I n the very similar case of dilute solutions of silver in cadmium, we found that the solid separating at first contained more silver than the mother liquid. This rather points to the probability that the substance separating between 100 and 98 atoms of zinc is a solid solution, in which case, as Van’t HOE has pointed out, the straight line of freezing points would prove that Henry’s law holds good between the concentrations in the solid and the liquid phases.
Publ
ishe
d on
01
Janu
ary
1897
. Dow
nloa
ded
by L
omon
osov
Mos
cow
Sta
te U
nive
rsity
on
13/0
2/20
14 1
2:39
:43.
View Article Online
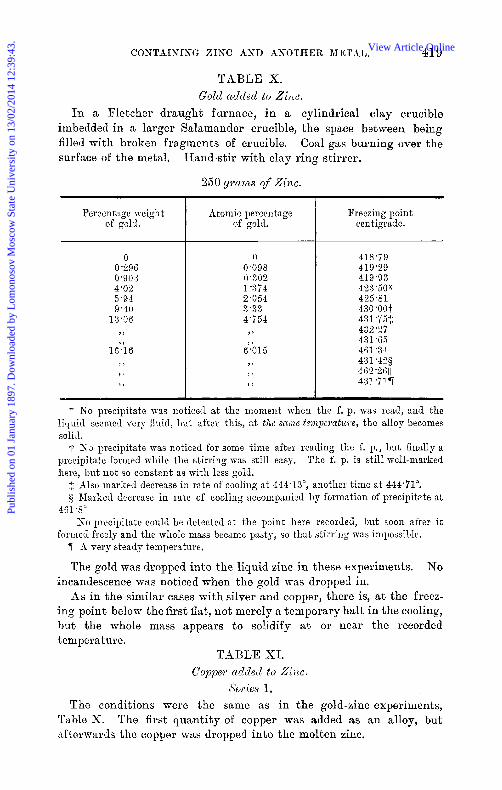
CONTAINIKG ZINC AND ANOTHER METAL. 419
TABLE X. Gold added to Zim.
In a Fletcher draught furnace, in a cylindrical clay crucible imbedded in a larger Salamander crucible, the space between being filled with broken fragments of crucible. Coal gas burning over the surEace of the metal. Hand-stir with clay ring stirrer.
250 gmms of Zinc.
Percentage weight of gola.
0 0.296 0.903 4.08 5 '94 9.40
13.G6
1 s'.'16
9 ,
Atomic percentage of gold.
0 0.09s 0.302 1.374 2.054 3'33 4'754
7 7
s'.'olS
Freezing point centigrade.
418*i9 419.29 419'03 423'50* 425.81 4 3 0 ' 0 0 ~ 431.75: 432.27 431'65 461'34 431.42g 46 2 '26 I 4 3 1 7 1 7
* KO precipitate was noticed a t the moment d i e n the f. p. was read, and the lioL!nid seemed very fluid, bnt after this, a t the ~ccnie ten~perntzwe, the alloy becomes solid.
-t. Ka precipitate was noticed for some time after reading the f. p., hut filially a precipitate formed while the stirring was still easy. The f. p. is still well-marl;ed here, but not 60 constant as with less gold.
$ Also niarked decrease in rate of cooling a t 444.13", another time a t 444.71". $ Marked decrease i n rate of cooling aceonipanied by forniation of precipitate a t
KO precipitate could be detected at the point here recorded, but soon after it 461.8"
foxned freely and the whole mass became pasty, so that stirring was impossible. "T; A very steady temperature,
The gold was dropped into the liquid zinc in these experiments. KO incandescence mas noticed when the gold was dropped in.
-4s in the similar cases withsilver and copper, there is, at the freez- ing point below the first flat, not merely a temporary halt in the cooling, but the whole mass appears to solidify a t or near the recorded temperature.
TABLE XI. Coppel. nddetl t o Em.
h'wies 1. The conditions were the same as in the gold-zinc experiments,
The first quantity of copper was added as an alloy, but Table X. nftermards the copper was dropped into the molten zinc.
Publ
ishe
d on
01
Janu
ary
1897
. Dow
nloa
ded
by L
omon
osov
Mos
cow
Sta
te U
nive
rsity
on
13/0
2/20
14 1
2:39
:43.
View Article Online

420 HEYCOCK AKD NEVILLE : THE FREEZING POINTS OF ALLOYS
0 5,846
3 ,
11 *'65
15 'f0
Percentage weight of copper.
418'93 423 '58 * 423'55 524'88 422'4 ? 695'8 :: 667.2 9
I I I
Atomic percentage of copper.
Freezing point centigrade.
0-134 0,364 1 '042 3'11 6 * 7 G
0 0-139 0-377 1.08 3'22 6-98
418'82 419.17" 419.77 421'70 423.81t 423.96::
* This f. p. is a stationary temperature for several minutes. + A considerable amount of precipitate forms even above the f. p. $ With this concentration, we thought there was a decrease in the rate of cooling
at 561*6", and much precipitate had formed in the crucible a t 541 -8".
Xeyies 2. Fus*nuce A .
The alloys mere made by melting together, in a sealed vacuous tube of Jena glass, weighed quantities of copper with a considerable excess of zinc. When the alloy thus formed had been well melted and shaken, it mas allowed to cool, the tube opened, and the alloy added t o the remainder of the zinc in the crucible.
0 0.402 1 -838 2.590
41633
0 0.416 1 *goo 2.678
3 ,
4'167
418.93 419.77 422'79 423.60" 435'36 423.5 423.61.
* Very steady temperature. -t. Although this is a well-marked f. p., the alloy was pasty before the temperature
fell to this point. No higher point could be detected.
Xeries 3. 250 gmms of Zinc.
Dyopped the copper into the zinc. I I
~ ~~~~~~~~
* At this point there was so much heavy precipitate already formed that stirring
t Lower point not so well marked.
5 The point on the lower flat can no longer be detected.
was impossible.
A well marked f. p., triistworthy.
Publ
ishe
d on
01
Janu
ary
1897
. Dow
nloa
ded
by L
omon
osov
Mos
cow
Sta
te U
nive
rsity
on
13/0
2/20
14 1
2:39
:43.
View Article Online
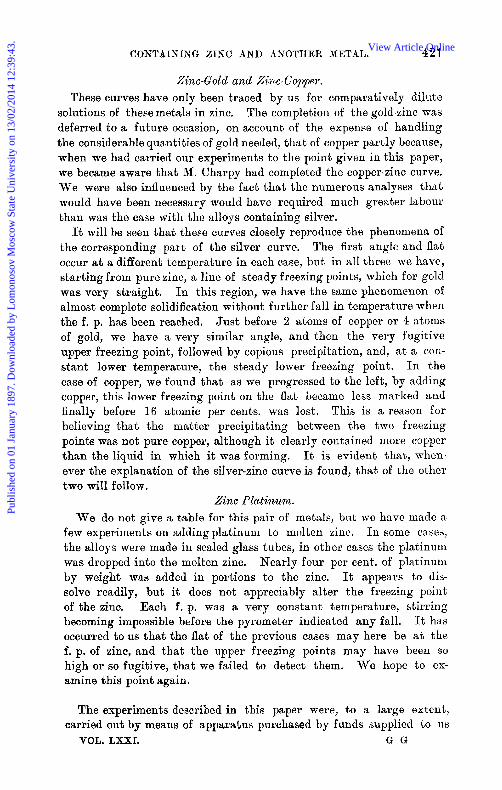
CONTAINING ZINC AND ANOTHER METAL. 421
Zinc-Gold and Zinc-Copper. These curves have only been traced by us for comparatively dilute
solutions of these metals in zinc. The completion of the gold-zinc mas deferred to a future occasion, on account of the expense of handling the considerable quantities of gold needed, tha t of copper partly because, when me had carried our experiments to the point given in this paper, we became aware that M. Charpy had completed the copper-zinc curve. We were also influenced by the fact tha t the numerous analyses tha t would have been necessary would have required much greater labour than was the case with the alloys containing silver.
It will be seen that these curves closely reproduce the phenomena of the corresponding part of the silver curve. The first angle and flat occur at a different temperature in each case, but in all three we have, starting from pure zinc, a line of steady freezing points, which for gold was very straight. In this region, we have the Bame phenomenon of almost complete solidification without further fall in temperature when the f. p. has been reached, Jus t before 2 atoms of copper or 4 atoms of gold, we have a very similar angle, and then the very fugitive upper freezing point, followed by copious precipitation, and, a t a con- stant lower temperature, the steady lower freezing point. I n the case of copper, we found tha t as we progressed to the left, by adding copper, this lower freezing point on the flat became less marked and finally before 16 atomic per cents. was lost. This is a reason f o r believing that the matter precipitating between the two freezing points was not pure copper, although it clearly contained more copper than the liquid in which it was forming. It is evident that, when- ever the explanation of the silver-zinc curve is found, that of the other two will follow.
Zinc- Pkatinum. W e do not give a table for this pair of metals, but we have made R
few experiments on addingplatinum to molten zinc. I n some cases, the alloys were made in sealed glass tubes, in other cases the platinum was dropped into the molten zinc. Nearly four per cent. of platinum by weight was added in portions to the zinc. It appears to dis- solve readily, but it does not appreciably alter the freezing point of the zinc. Each f. p. was a very constant temperature, stirring becoming impossible before the pyrometer indicated any fall. It has occurred to us that the flat of the previous cases may here be at the f. p. of zinc, and tha t the upper freezing points may have been so high or so fugitive, that we failed to detect them. We hope t o ex- amine this point again.
The experiments described in this paper were, to a large extent, carried out by means of apparatus purchased by funds supplied to us
VOL. LXXI. G G
Publ
ishe
d on
01
Janu
ary
1897
. Dow
nloa
ded
by L
omon
osov
Mos
cow
Sta
te U
nive
rsity
on
13/0
2/20
14 1
2:39
:43.
View Article Online

422 FRANCIS : THE DI-NITROSAMINES OF ETHYLENEANILINE,
by the Grant Committee of the Royal Society. W e wish, also, t o thank Miss Dorothy Marshall, B.Sc., for the efficient aid we received from her in many of the experiments.
Publ
ishe
d on
01
Janu
ary
1897
. Dow
nloa
ded
by L
omon
osov
Mos
cow
Sta
te U
nive
rsity
on
13/0
2/20
14 1
2:39
:43.
View Article Online
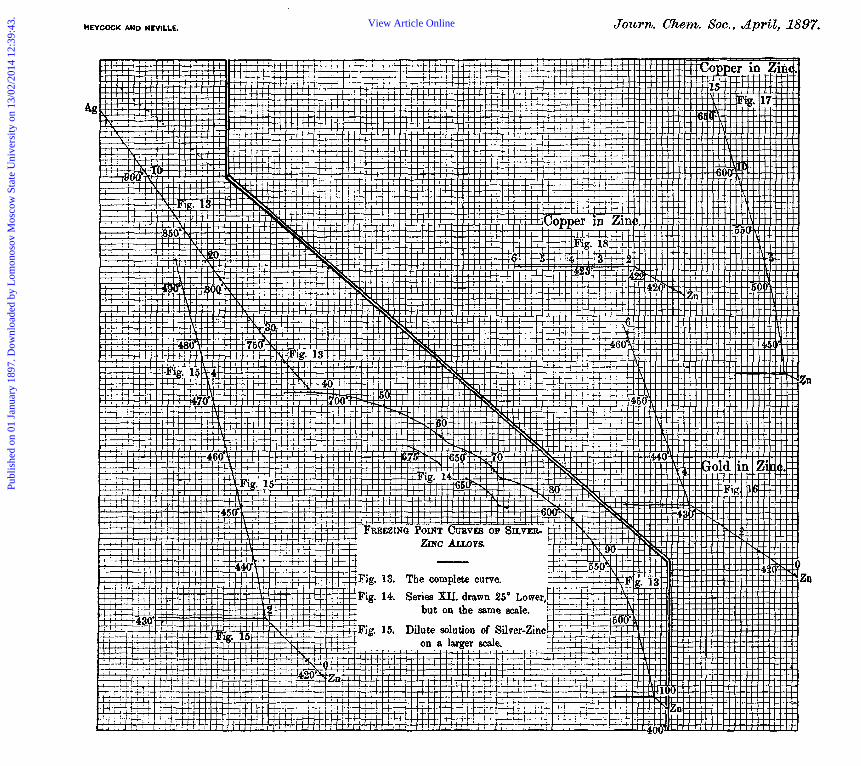
HEYCOOK AND NEVILLE. Jozcrn. Chem. SOC., April, 1897.
A
ZINC A u o ~ s . - Fig. 13. The complete curve, Fig. 14. Series XII. drawn 25" Lower,
but on the same scale.
Publ
ishe
d on
01
Janu
ary
1897
. Dow
nloa
ded
by L
omon
osov
Mos
cow
Sta
te U
nive
rsity
on
13/0
2/20
14 1
2:39
:43.
View Article Online