y ie5003 term paper
TRANSCRIPT

8/7/2019 Y IE5003 Term Paper
http://slidepdf.com/reader/full/y-ie5003-term-paper 1/51
1
Economic feasibility study on Three
Business Proposals
IE 5003 Cost Analysis and Engineering Economy
Term Paper – Semester-2 (2010-11)
Submitted by,
Madheswaran Perumalsamy Govindharaj (A0077651Y)
Master of Science (Industrial & Systems Engineering)
Faculty of Engineering,
Department of Industrial & Systems Engineering,
National University of Singapore.

8/7/2019 Y IE5003 Term Paper
http://slidepdf.com/reader/full/y-ie5003-term-paper 2/51
2
Contents
S.No Description Page
Number
1 Executive Summary 22 Problem Description 6
3 Cash Flow Models 8
Before Tax Cash Flow Analysis 9
5 Base Case Solution 10
Depreciation Calculations 11
After Tax Cash Flow Analysis 12
After Tax Cash Flow Analysis-Summary 14
6 Sensitivity Analysis
FMCG Distribution Project 15
Fast Food Outlet Project 19
Cold Storage Project 25
7 Probabilistic Risk Analysis
FMCG Distribution Project 30
Fast Food Outlet Project 34
Cold Storage Project 36Results for Probabilistic Risk Analysis 39
8 What if Analysis 40
9 Recommendations & Conclusion 50

8/7/2019 Y IE5003 Term Paper
http://slidepdf.com/reader/full/y-ie5003-term-paper 3/51
3
Executive Summary
Mr. X has significance experience in Quality assurance and Marketing of Food and Beverages products. He
wants to start his own business in this field. Now, he got chance to take up any of the following businesses.
1. FMCG products distributorship (dry FMCG Products)2. Fast Food outlet (with his own brand)
3. Cold storage (For Fruits and Vegetables)
Through his contacts he has collected some information and data of these business and he need to pick a
economically viable project based on his data.
Economic feasibility of three Projects are analyzed using cost analysis techniques, based on the data Mr. X has
provided in order to help him.
After Tax MARR = 12.4%
Before Tax MARR=15%
Study Period = 15 Years
Before Tax Cash Flow Analysis
Result: Fast Food Project looks lucrative among three.
After Tax Cash Flow Analysis
Result: Cold Storage Project seems to be more profitable among three (and FMCG distributorship Project
also almost equal to Cold Storage project and hence risk profile of these businesses are analyzed.)
BTCF ANALYSIS RESULTS
FMCG product distributorship Fast food Franchise Cold Storage
Present Worth (PW) 331,696.50$ 344,848.60$ 338,937.90$
Future Worth (FW) 2,701,808.50$ 2,807,332.00$ 2,760,892.50$
Annual Worth (AW) 56,720.10$ 58,969.11$ 57,958.38$
Capital Recovery (CR) 933,577.50$ 394,776.00$ 977,620.50$
Annual Profit 990,400.00$ 453,800.00$ 1,035,700.00$
IRR % 16.023% 17.611% 16.041%
ERR % 15.419% 16.012% 15.417%
ATCF ANALYSIS RESULTS
FMCG product distributorship Fast food Franchise Cold Storage
Present Worth (PW) 426,872.07$ 377,759.21$ 468,433.10$
IRR % 13.590% 14.990% 13.710%

8/7/2019 Y IE5003 Term Paper
http://slidepdf.com/reader/full/y-ie5003-term-paper 4/51
4
Probabilistic Analysis for Risk: (Using Monte Carlo simulation in Excel)
Observation: All three Projects involve high risk factors in it.
Sensitivity Analysis:
Sensitivity analysis exercise is done to find the significant factors that affect the Worth.
Probabilistic Analysis Results
Parameters Values Remarks
Mean (280,193.00)$
Std Deviation 2,460,749.00$
Prob (PW =< 0) ~ 55.000%
Parameters Values Remarks
Mean (111,672.00)$
Std Deviation 1,686,809.00$
Prob (PW =< 0) ~ 45.000%
Parameters Values Remarks
Mean (212,512.00)$
Std Deviation 5,102,515.00$
Prob (PW =< 0) ~ 45.000%
High Risk Project with negetive
mean
High Risk Project with negetive
mean
High Risk Project with negetive
mean
FMCG distributorship
Fast Food Franchise Outlet
Cold Storage
Detarministic Analysis - Sensitivity
Factors Swing^2 (PW) Swing^2 (IRR)
Profit 49.800% 51.900%
Sales 29.100% 29.500%
Factors Swing^2 (PW) Swing^2 (IRR)
Wastage 55.900% 51.800%
Profit 31.400% 33.100%
Sales 8.000% 9.600%
Factors Swing^2 (PW) Swing^2 (IRR)
Profit 86.200% 87.100%
Sales 8.800% 7.900%
Wastage 3.300% 3.000%
Cold Storage
FMCG product distributorship
Fast Food Franchise Outlet

8/7/2019 Y IE5003 Term Paper
http://slidepdf.com/reader/full/y-ie5003-term-paper 5/51
5
FMCG business has Profit & Sales volume as significant factors
Fast Food & Cold Storage business have Wastage, Profit & Sales volume as significant factors.
What If Analysis:
Mr. X wants to minimize the risk by controlling the quality in 6 sigma level and with high class marketing
techniques, he wants to maintain the higher profit margins. Since he has considerable experience in Quality
assurance & Marketing of Food and Beverages, he believes that he could be able to control the quality and can
market the product much efficiently with no additional costs.
* As FMCG product pricing and Marketing are controlled by FMCG companies themselves, distributor has no
role in regulating them, hence considered only Fast Food & Cold Storage.
Break-Even Values of Sensitive Factors
Factors Break Even Point
Profit 17.000%
Sales 7,680,000.00$
Factors Break Even Point
Wastage 18.000%
Profit 51.000%
Sales 1,770,000.00$
Factors Break Even Point
Profit 40.000%
Sales 4,100,000.00$
Wastage 11.000%
FMCG product distributorship
Fast Food Franchise Outlet
Cold Storage
Profit Margin limit Low 50.000%
Mean 65.000%
High 100.000%
Wastage control limit Low 5.000%
Mean 7.500%
High 10.000%
What If condition (strictly
controlled by 6 sigma level
quality control and high class
marketing strategy in Fast food
& Cold storage business)

8/7/2019 Y IE5003 Term Paper
http://slidepdf.com/reader/full/y-ie5003-term-paper 6/51
6
Result: Cold Storage Project is become profitable and low risk
What If condition Results
Parameters Values Remarks
Mean 5,027,304.00$
Std Deviation 2,728,403.00$
Prob (PW =< 0) ~ 2.000%
Parameters Values Remarks
Mean 44,844.00$
Std Deviation 1,153,969.00$
Prob (PW =< 0) ~ 40.000%
Fast Food Franchise Outlet
Low Risk Project with large
mean
High Risk Project with low mean
Cold Storage

8/7/2019 Y IE5003 Term Paper
http://slidepdf.com/reader/full/y-ie5003-term-paper 7/51
7
Problem Description
Mr. X has significance experience in Quality assurance and Marketing of Food and Beverages products. He
wants to start his own business in this field. Now, he got chance to take up any of the following businesses.
1. FMCG products distributorship (dry FMCG Products)2. Fast Food outlet (with his own brand)
3. Cold storage (For Fruits and Vegetables)
Through his contacts he has collected some information and data of these business and he need to pick a
economically viable project based on his data.
Economic feasibility of three Projects are analyzed using cost analysis techniques, based on the data Mr. X has
provided in order to help him. Below are the data provided by him on investments, expected Sales and
overhead expenses.
After Tax MARR = 12.4%
Before Tax MARR=15%
Study Period = 15 Years
Initial Investments Cost/Unit Unit Requirement Total Cost Market Value @ End 15 yr
Land 300.00$ Square feet 10000 3,000,000.00$ 3,000,000.0$
Shed constructed area 300.00$ Square feet 8000 2,400,000.00$ 600,000.0$
Racking 100.00$ Square feet 4200 420,000.00$ 105,000.0$
Furnitures & Interior 50.00$ Square feet 100 5,000.00$ -$
Handling Equipments 2,500.00$ Units 3 7,500.00$ -$
Transportation vehicles (delivery vans) 40,000.00$ Units 2 80,000.00$ 8,000.0$
IT infrastructure 3,000.00$ Units 1 3,000.00$ -$
5,915,500.00$ 3,713,000.0$
Expenses Expected Expenses (Per Month) Expenses (Per year)
Labor(Wages including bonus) 2,000.00$ Persons 10 20,000.00$ 260,000.0$
Electricity 1,500.00$ - - 1,500.00$ 18,000.0$
Fuel 2,000.00$ - - 2,000.00$ 24,000.0$
Phone bills 250.00$ - - 250.00$ 3,000.0$
Stationaries 50.00$ - - 50.00$ 600.0$
Purchases 600,000.00$ - - 600,000.00$ 7,200,000.0$
7,505,600.0$
Revenues Expected
Sales 708,000.00$ - - 708,000.00$ 8,496,000.0$
8,496,000.0$
Market Value of business @ end of life 3,713,000.00$ - - 3,713,000.00$ 3,713,000.0$
3,713,000.0$
Study Period years 15 Years
FMCG product distributorship

8/7/2019 Y IE5003 Term Paper
http://slidepdf.com/reader/full/y-ie5003-term-paper 8/51
8
Initial Investments Cost/Unit Unit Requirement Total Cost Market Value @ End of Lif
Land 300.00$ Square feet 4000 1,200,000.00$ 1,200,000.0$
Shed constructed area 330.00$ Square feet 2500 825,000.00$ -$
Kitchen Equipments 100,000.00$ Sets 1 100,000.00$ -$
Furnitures & Interior 150.00$ Square feet 1800 270,000.00$ -$
Franchise fees (Licence) 8,000.00$ Units 1 8,000.00$ -$
Transportation vehicles (motor cycles) 10,000.00$ Units 5 50,000.00$ -$
IT infrastructure 3,000.00$ Units 1 3,000.00$ -$
2,456,000.00$ 1,200,000.0$
Expenses Expected Cost/Month Unit Requirement Expenses (Per Month) Expenses (Per year)
Labor(Wages including bonus) 2,000.00$ Persons 8 16,000.00$ 208,000.0$
Electricity 2,000.00$ - - 2,000.00$ 24,000.0$
Fuel 2,000.00$ - - 2,000.00$ 24,000.0$
Phone bills 800.00$ - - 800.00$ 9,600.0$
Stationaries 50.00$ - - 50.00$ 600.0$
Purchases 125,000.00$ - - 125,000.00$ 1,500,000.0$
1,766,200.0$
Revenues Expected
Sales 185,000.00$ - - 185,000.00$ 2,220,000.0$
2,220,000.0$
Market Value of business @ end of life 1,200,000.00$ - - 1,200,000.00$ 1,200,000.0$
1,200,000.0$
Study Period years 15 Years
Fast Food Franchise operations
Initial Investments Cost/Unit Unit Requirement Total Cost Market Value @ End of Life
Land 300.00$ Square feet 10000 3,000,000.00$ 3,000,000.00$
Shed constructed area 300.00$ Square feet 6000 1,800,000.00$ -$Cooling Equipments 300.00$ Square feet 4000 1,200,000.00$ -$
Generator 20,000.00$ Units 1 20,000.00$ -$
Furnitures 50.00$ Square feet 50 2,500.00$ -$
Handling Equipments 10,000.00$ Units 2 20,000.00$ -$
Transportation vehicles (Containers) 20,000.00$ Units 2 40,000.00$ -$
IT infrastructure 3,000.00$ Units 1 3,000.00$ -$
6,085,500.00$ 3,000,000.00$
Expenses Expected Expenses (Per Month) Expenses (Per year)
Labor(Wages including bonus) 2,500.00$ Persons 5 12,500.00$ 162,500.00$
Electricity 3,000.00$ - - 3,000.00$ 36,000.00$
Fuel 2,000.00$ - - 2,000.00$ 24,000.00$
Phone bills 100.00$ - - 100.00$ 1,200.00$Stationaries 50.00$ - - 50.00$ 600.00$
Purchases 400,000.00$ - - 400,000.00$ 4,800,000.00$
5,024,300.00$
Revenues Expected
Sales 505,000.00$ - - 505,000.00$ 6,060,000.00$
6,060,000.00$
Market Value of business @ end of l ife 3,000,000.00$ - - 3,000,000.00$ 3,000,000.00$
3,000,000.00$
Study Period years 15 Years
Cold Storage

8/7/2019 Y IE5003 Term Paper
http://slidepdf.com/reader/full/y-ie5003-term-paper 9/51
9
Cash Flow Models Development
• FMCG products distributorship (dry FMCG Products)
• Fast Food outlet (with his own brand)
Annual Cash Flow = $990,400 from EoY 1 to 15
MV(15) = $3,713,000
Initial Investment = $5,915,500
MV(15) = $1,200,000
Annual Cash Flow = $453,800 from EoY 1 to 15
Initial Investment = $2,456,000

8/7/2019 Y IE5003 Term Paper
http://slidepdf.com/reader/full/y-ie5003-term-paper 10/51
10
• Cold storage (For Fruits and Vegetables)
First, let us calculate the Present, Future and Annual Worth using Before tax MARR = 15 %
Before Tax Cash Flow Analysis
Finding PW/AW/FW values
Initial Investment 5,915,500.00$ Initial Investment 2,456,000.00$ Initial Investment 6,085,500.00$
Annual Expenses 7,505,600.00$ Annual Expenses 1,766,200.00$ Annual Expenses 5,024,300.00$
Revenue 8,496,000.00$ Revenue 2,220,000.00$ Revenue 6,060,000.00$
Market value @ end 3,713,000.00$ Ma rket va lue @ end 1,200,000.00$ Ma rket va lue @ end 3,000,000.00$
Study Period 15 Study Period 15 Study Period 15
Before Tax MARR % 15% Before Tax MARR % 15% Before Tax MARR % 15%
Present Worth (PW) 331,696.50$ Present Worth (PW) 344,848.60$ Present Worth (PW) 338,937.90$
Future Worth (FW) 2,701,808.50$ Future Worth (FW) 2,807,332.00$ Future Worth (FW) 2,760,892.50$
Annual Worth (AW) 56,720.10$ Annual Worth (AW) 58,969.11$ Annual Worth (AW) 57,958.38$
Capital Recovery (CR) 933,577.50$ Ca pita l Recovery (CR) 394,776.00$ Ca pita l Re covery (CR) 977,620.50$Annual Profit 990,400.00$ Annual Profit 453,800.00$ Annual Profit 1,035,700.00$
FMCG product distributorship Fast food Franchise Cold Storage
MV(15) = $3,000,000
Annual Cash Flow = $1,035,700 from EoY 1 to 15
Initial Investment = $6,085,500

8/7/2019 Y IE5003 Term Paper
http://slidepdf.com/reader/full/y-ie5003-term-paper 11/51
11
Base Case Solution
Since After Tax Cash flow only will give clear idea, we have to do ATCF Analysis including the Capital
allowances. First we calculate the depreciation values for all investments in all three projects as per 6th
schedule guidelines.
Finding IRR (Using goal seek)
Study Period 15 Study Period 15 Study Period 1
Interest rate i% 16.023% Interest rate i% 17.611% Interest rate i% 16.041%
Initial Investment 5,915,500.00$ Initial Investment 2,456,000.00$ Initial Investment 6,085,500.00$
Revenue 8,496,000.00$ Revenue 2,220,000.00$ Revenue 6,060,000.00$
Annual Expenses 7,505,600.00$ Annual Expenses 1,766,200.00$ Annual Expenses 5,024,300.00$Market value @ end 3,713,000.00$ Ma rket va lue @ end 1,200,000.00$ Ma rket va lue @ end 3,000,000.00$
Before Tax MARR % 15% Before Tax MARR % 15% Before Tax MARR % 15%
(P/F,i%,15) 0.107605214 (P/F,i%,15) 0.087759174 (P/F,i%,15) 0.107356
(P/A,i%,15) 5.569428354 (P/A,i%,15) 5.180010999 (P/A,i%,15) 5.56476769
PW (i%) 0.00$ PW (i%) 0.00$ PW (i%) 0.00$
IRR % 16.023% IRR % 17.611% IRR % 16.041%
FMCG product distributorship Fast food Franchise Cold Storage
Finding ERR
Study Period 15 Study Period 15 Study Period 1
Before Tax MARR % 15% Before Tax MARR % 15% Before Tax MARR % 15%
Initial Investment 5,915,500.00$ Initial Investment 2,456,000.00$ Initial Investment 6,085,500.00$
Revenue 8,496,000.00$ Revenue 2,220,000.00$ Revenue 6,060,000.00$
Annual Expenses 7,505,600.00$ Annual Expenses 1,766,200.00$ Annual Expenses 5,024,300.00$
Market value @ end 3,713,000.00$ Ma rket va lue @ end 1,200,000.00$ Ma rket va lue @ end 3,000,000.00$
(F/A,15 %,15) 47.58 (F/A,15 %,15) 47.58 (F/A,15 %,15) 47.5
PW of Cash outflows 5,915,500.00$ PW of Cash outflows 2,456,000.00$ PW of Cash outflows 6,085,500.00$
FW of Cash Inflows 50,836,232.00$ FW of Ca sh Infl ows 22,791,804.00$ FW of Ca sh Inflows 52,278,606.00$
ERR % 15.419% ERR % 16.012% ERR % 15.417%
FMCG product distributorship Fast food Franchise Cold Storage
Summary
Present Worth (PW) 331,696.50$
Future Worth (FW) 2,701,808.50$
Annual Worth (AW) 56,720.10$
Capital Recovery (CR) 933,577.50$
Annual Profit 990,400.00$
IRR % 16.023%
ERR % 15.419%
16.041%
15.417%
Reject Select Reject
17.611%
16.012%
338,937.90$
2,760,892.50$
57,958.38$
977,620.50$
1,035,700.00$
FMCG product distributorship Fast food Franchise Cold Storage
344,848.60$
2,807,332.00$
58,969.11$
394,776.00$
453,800.00$

8/7/2019 Y IE5003 Term Paper
http://slidepdf.com/reader/full/y-ie5003-term-paper 12/51

8/7/2019 Y IE5003 Term Paper
http://slidepdf.com/reader/full/y-ie5003-term-paper 13/51
13
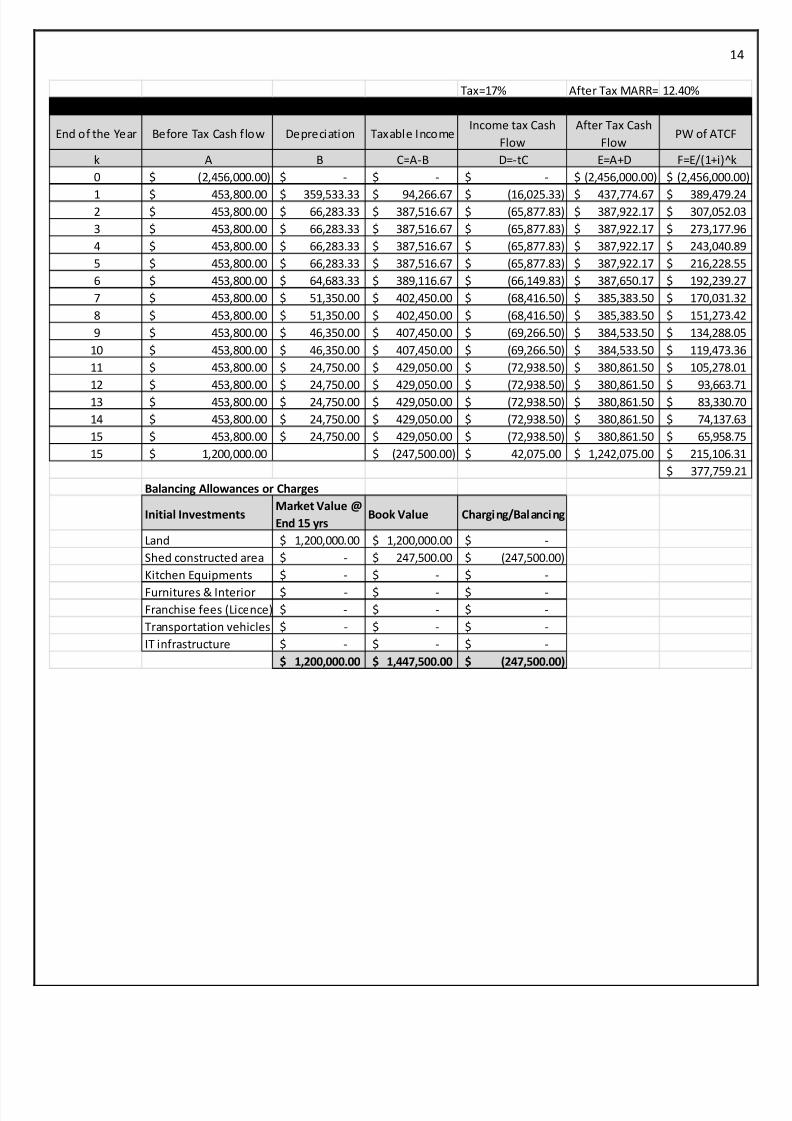
Now, After tax cash flow analysis is carried out including the Capital allowances for tax benefits.
Tax=17% After Tax MARR= 12.40%
End of the Year Before Tax Cash flow Depreciation Taxable IncomeIncome tax Cash
Flow
After Tax Cash
FlowPW of ATCF
k A B C=A-B D=-tC E=A+D F=E/(1+i)^k0 (5,915,500.00)$ -$ -$ -$ (5,915,500.00)$ (5,915,500.0$
1 990,400.00$ 823,166.67$ 167,233.33$ (28,429.67)$ 961,970.33$ 855,845.4$
2 990,400.00$ 96,666.67$ 893,733.33$ (151,934.67)$ 838,465.33$ 663,670.4$
3 990,400.00$ 96,666.67$ 893,733.33$ (151,934.67)$ 838,465.33$ 590,454.1$
4 990,400.00$ 96,666.67$ 893,733.33$ (151,934.67)$ 838,465.33$ 525,315.0$
5 990,400.00$ 96,666.67$ 893,733.33$ (151,934.67)$ 838,465.33$ 467,362.1$
6 990,400.00$ 96,666.67$ 893,733.33$ (151,934.67)$ 838,465.33$ 415,802.6$
7 990,400.00$ 85,000.00$ 905,400.00$ (153,918.00)$ 836,482.00$ 369,056.1$
8 990,400.00$ 85,000.00$ 905,400.00$ (153,918.00)$ 836,482.00$ 328,341.7$
9 990,400.00$ 85,000.00$ 905,400.00$ (153,918.00)$ 836,482.00$ 292,119.0$
10 990,400.00$ 85,000.00$ 905,400.00$ (153,918.00)$ 836,482.00$ 259,892.3$11 990,400.00$ 84,600.00$ 905,800.00$ (153,986.00)$ 836,414.00$ 231,202.1$
12 990,400.00$ 84,600.00$ 905,800.00$ (153,986.00)$ 836,414.00$ 205,695.8$
13 990,400.00$ 84,600.00$ 905,800.00$ (153,986.00)$ 836,414.00$ 183,003.4$
14 990,400.00$ 84,600.00$ 905,800.00$ (153,986.00)$ 836,414.00$ 162,814.4$
15 990,400.00$ 84,600.00$ 905,800.00$ (153,986.00)$ 836,414.00$ 144,852.7$
15 3,713,000.00$ -$ (133,000.00)$ 22,610.00$ 3,735,610.00$ 646,944.2$
426,872.0$
Balancing Allowances or Charges
Initial InvestmentsMarket Value @
End 15 yrsBook Value Charging/Balancing
Land 3,000,000.00$ 3,000,000.00$ -$
Shed constructed area 600,000.00$ 720,000.00$ (120,000.00)$
Racking 105,000.00$ 126,000.00$ (21,000.00)$
Furnitures & Interior -$ -$ -$
Handling Equipments -$ -$ -$
Transportation vehicles 8,000.00$ -$ 8,000.00$
IT infrastructure -$ -$ -$
3,713,000.00$ 3,846,000.00$ (133,000.00)$
FMCG product distributorship
8/7/2019 Y IE5003 Term Paper
http://slidepdf.com/reader/full/y-ie5003-term-paper 14/51
14
Tax=17% After Tax MARR= 12.40%
End of the Year Before Tax Cash flow Depreciation Taxable IncomeIncome tax Cash
Flow
After Tax Cash
FlowPW of ATCF
k A B C=A-B D=-tC E=A+D F=E/(1+i)^k
0 (2,456,000.00)$ -$ -$ -$ (2,456,000.00)$ (2,456,000.0$
1 453,800.00$ 359,533.33$ 94,266.67$ (16,025.33)$ 437,774.67$ 389,479.2$2 453,800.00$ 66,283.33$ 387,516.67$ (65,877.83)$ 387,922.17$ 307,052.0$
3 453,800.00$ 66,283.33$ 387,516.67$ (65,877.83)$ 387,922.17$ 273,177.9$
4 453,800.00$ 66,283.33$ 387,516.67$ (65,877.83)$ 387,922.17$ 243,040.8$
5 453,800.00$ 66,283.33$ 387,516.67$ (65,877.83)$ 387,922.17$ 216,228.5$
6 453,800.00$ 64,683.33$ 389,116.67$ (66,149.83)$ 387,650.17$ 192,239.2$
7 453,800.00$ 51,350.00$ 402,450.00$ (68,416.50)$ 385,383.50$ 170,031.3$
8 453,800.00$ 51,350.00$ 402,450.00$ (68,416.50)$ 385,383.50$ 151,273.4$
9 453,800.00$ 46,350.00$ 407,450.00$ (69,266.50)$ 384,533.50$ 134,288.0$
10 453,800.00$ 46,350.00$ 407,450.00$ (69,266.50)$ 384,533.50$ 119,473.3$
11 453,800.00$ 24,750.00$ 429,050.00$ (72,938.50)$ 380,861.50$ 105,278.0$
12 453,800.00$ 24,750.00$ 429,050.00$ (72,938.50)$ 380,861.50$ 93,663.7$
13 453,800.00$ 24,750.00$ 429,050.00$ (72,938.50)$ 380,861.50$ 83,330.7$
14 453,800.00$ 24,750.00$ 429,050.00$ (72,938.50)$ 380,861.50$ 74,137.6$
15 453,800.00$ 24,750.00$ 429,050.00$ (72,938.50)$ 380,861.50$ 65,958.7$
15 1,200,000.00$ (247,500.00)$ 42,075.00$ 1,242,075.00$ 215,106.3$
377,759.2$
Balancing Allowances or Charges
Initial InvestmentsMarket Value @
End 15 yrsBook Value Charging/Balancing
Land 1,200,000.00$ 1,200,000.00$ -$
Shed constructed area -$ 247,500.00$ (247,500.00)$
Kitchen Equipments -$ -$ -$
Furnitures & Interior -$ -$ -$Franchise fees (Licence) -$ -$ -$
Transportation vehicles -$ -$ -$
IT infrastructure -$ -$ -$
1,200,000.00$ 1,447,500.00$ (247,500.00)$
Fast Food Franchise operations

8/7/2019 Y IE5003 Term Paper
http://slidepdf.com/reader/full/y-ie5003-term-paper 15/51
15
After Tax Cash Flow analysis shows Cold Storage with more Present worth. But As FMCG and Cold Storage
projects have closer PW value; further sensitivity analysis and Risk profile analysis are required before
finalizing the project.
Tax=17% After Tax MARR= 12.40%
End of the Year Before Tax Cash flow Depreciation Taxable IncomeIncome tax Cash
Flow
After Tax Cash
FlowPW of ATCF
k A B C=A-B D=-tC E=A+D F=E/(1+i)^k
0 (6,085,500.00)$ -$ -$ -$ (6,085,500.00)$ (6,085,500.00$
1 1,035,700.00$ 945,566.67$ 90,133.33$ (15,322.67)$ 1,020,377.33$ 907,809.0$2 1,035,700.00$ 220,066.67$ 815,633.33$ (138,657.67)$ 897,042.33$ 710,035.9$
3 1,035,700.00$ 220,066.67$ 815,633.33$ (138,657.67)$ 897,042.33$ 631,704.5$
4 1,035,700.00$ 220,066.67$ 815,633.33$ (138,657.67)$ 897,042.33$ 562,014.7$
5 1,035,700.00$ 220,066.67$ 815,633.33$ (138,657.67)$ 897,042.33$ 500,013.1$
6 1,035,700.00$ 220,066.67$ 815,633.33$ (138,657.67)$ 897,042.33$ 444,851.5$
7 1,035,700.00$ 57,400.00$ 978,300.00$ (166,311.00)$ 869,389.00$ 383,574.7$
8 1,035,700.00$ 57,400.00$ 978,300.00$ (166,311.00)$ 869,389.00$ 341,258.64$
9 1,035,700.00$ 57,400.00$ 978,300.00$ (166,311.00)$ 869,389.00$ 303,610.8$
10 1,035,700.00$ 57,400.00$ 978,300.00$ (166,311.00)$ 869,389.00$ 270,116.4$
11 1,035,700.00$ 54,000.00$ 981,700.00$ (166,889.00)$ 868,811.00$ 240,157.3$
12 1,035,700.00$ 54,000.00$ 981,700.00$ (166,889.00)$ 868,811.00$ 213,663.1$
13 1,035,700.00$ 54,000.00$ 981,700.00$ (166,889.00)$ 868,811.00$ 190,091.7$
14 1,035,700.00$ 54,000.00$ 981,700.00$ (166,889.00)$ 868,811.00$ 169,120.7$
15 1,035,700.00$ 54,000.00$ 981,700.00$ (166,889.00)$ 868,811.00$ 150,463.3$
15 3,000,000.00$ (540,000.00)$ 91,800.00$ 3,091,800.00$ 535,447.2$
468,433.1$
Balancing Allowances or Charges
Initial InvestmentsMarket Value @
End 15 yrsBook Value Charging/Balancing
Land 3,000,000.00$ 3,000,000.00$ -$
Shed constructed area -$ 540,000.00$ (540,000.00)$
Cooling Equipments -$ -$ -$
Generator -$ -$ -$Furnitures -$ -$ -$
Handling Equipments -$ -$ -$
Transportation vehicles -$ -$ -$
IT infrastructure -$ -$ -$
3,000,000.00$ 3,540,000.00$ (540,000.00)$
Cold Storage
Summary (ATCF Analysis)
FMCG DistributionFast Food
FranchiseCold Storage
After Tax PW 426,872.07$ 377,759.21$ 468,433.10$
After Tax IRR % 13.59% 14.99% 13.71%

8/7/2019 Y IE5003 Term Paper
http://slidepdf.com/reader/full/y-ie5003-term-paper 16/51
16
Sensitivity Analysis
FMCG Distributorship Project
$(3,500,000.00)
$(3,000,000.00)
$(2,500,000.00)
$(2,000,000.00)
$(1,500,000.00)
$(1,000,000.00)
$(500,000.00)
$-
$500,000.00
$1,000,000.00
$1,500,000.00
$2,000,000.00
$2,500,000.00
$3,000,000.00
$3,500,000.00
$4,000,000.00
$4,500,000.00
$5,000,000.00
A f e r - T a x P W
Input Value as % of Base Case
Spider diagram for FMCG Distributorship (for After Tax PW)
Profit
Sales
Initial Investments
Labor(Wages incl bonus)
Salvage Value
Fuel
Electricity
Phone bills
Stationaries
Purchase
10%
$6,796,800.00
$8,873,250.00
$390,000.00
$2,970,400.00
$36,000.00
$27,000.00
$4,500.00
$900.00
$5,760,000.00
30%
$12,744,000.00
$4,732,400.00
$208,000.00
$5,569,500.00
$19,200.00
$14,400.00
$2,400.00
$480.00
$10,800,000.00
Profit
Sales
Initial Investments
Labor(Wages incl bonus)
Salvage Value
Fuel
Electricity
Phone bills
Stationaries
Purchase
Afer-Tax PW
Tornado diagram for FMCG Distributorship (for After Tax PW)

8/7/2019 Y IE5003 Term Paper
http://slidepdf.com/reader/full/y-ie5003-term-paper 17/51
17
Afer-Tax PW
Corresponding Input Value Output Value Percen
Input Variable Low Output Base Case High Output Low Base High Swing Swing^
Profit 10% 18% 30% (2,471,109.29)$ 426,872.07$ 4,105,079.18$ 6,576,188.47$ 49.8%
Sales 6,796,800.00$ 8,496,000.00$ 12,744,000.00$ (1,007,628.70)$ 426,872.07$ 4,013,124.01$ 5,020,752.71$ 29.1%
Ini ti al Investments 8,873,250.00$ 5,915,500.00$ $4,732,400.00 (2,530,877.93)$ 426,872.07$ $1,609,972.07 4,140,850.00$ 19.8%
Labor(Wages inc l bonus) 390,000.00$ 260,000.00$ $208,000.00 (292,592.05)$ 426,872.07$ $714,657.72 1,007,249.77$ 1.2%
Salvage Value 2,970,400.00$ 3,713,000.00$ 5,569,500.00$ 320,129.33$ 426,872.07$ 693,728.94$ 373,599.61$ 0.2%
Fuel 36,000.00$ 24,000.00$ $19,200.00 360,460.00$ 426,872.07$ $453,436.90 92,976.90$ 0.0%
Electricity 27,000.00$ 18,000.00$ $14,400.00 377,063.02$ 426,872.07$ $446,795.70 69,732.68$ 0.0%
Phone bi lls 4,500.00$ 3,000.00$ $2,400.00 418,570.56$ 426,872.07$ $430,192.68 11,622.12$ 0.0%
Stationaries 900.00$ 600.00$ $480.00 425,211.77$ 426,872.07$ $427,536.19 2,324.42$ 0.0%
Purchase 5,760,000.00$ 7,200,000.00$ 10,800,000.00$ 426,872.07$ 426,872.07$ 426,872.07$ -$ 0.0%
2.00%
4.00%
6.00%
8.00%
10.00%
12.00%
14.00%
16.00%
18.00%
20.00%
22.00%
24.00%
26.00%
A f t e r - T a x I R R
Input Value as % of Base Case
Spider diagram for FMCG Distributorship (for IRR)
Profit
Sales
Initial Investments
Labor(Wages incl bonus)
Salvage Value
Fuel
Electricity
Phone bills
Stationaries
Purchase

8/7/2019 Y IE5003 Term Paper
http://slidepdf.com/reader/full/y-ie5003-term-paper 18/51
18
Analysis result shows that Profit, Sales and Initial investments are significant factors affecting PW of this
project. Let us see the sensitivity and Break-even of these factors in this project.
10%
$6,796,800.00
$8,873,250.00
$390,000.00
$2,970,400.00
$36,000.00
$27,000.00
$4,500.00
$900.00
$5,760,000.00
30%
$12,744,000.00
$4,732,400.00
$208,000.00
$5,569,500.00
$19,200.00
$14,400.00
$2,400.00
$480.00
$10,800,000.00
2.00% 4.00% 6.00% 8.00% 10.00% 12.00% 14.00% 16.00% 18.00% 20.00% 22.00% 24.00% 26.00%
Profit
Sales
Initial Investments
Labor(Wages incl bonus)
Salvage Value
Fuel
Electricity
Phone bills
Stationaries
Purchase
After-Tax IRR
Tornado diagram for FMCG Distributorship (for IRR)
After-Tax IRRCorresponding Input Value Output Value Percen
Input Variable Low Output Base Case High Output Low Base High Swing Swing^
Profit 10% 18% 30% 5.34% 13.59% 23.53% 18.18% 51.9%
Sales 6,796,800.00$ 8,496,000.00$ 12,744,000.00$ 9.57% 13.59% 23.28% 13.71% 29.5%
Initial Investments 8,873,250.00$ 5,915,500.00$ $4,732,400.00 7.34% 13.59% 17.78% 10.44% 17.1%
Labor(Wages incl bonus) 390,000.00$ 260,000.00$ $208,000.00 11.58% 13.59% 14.38% 2.80% 1.2%
Salvage Value 2,970,400.00$ 3,713,000.00$ 5,569,500.00$ 13.31% 13.59% 14.22% 0.91% 0.1%
Fuel 36,000.00$ 24,000.00$ $19,200.00 13.40% 13.59% 13.66% 0.26% 0.0%
Electricity 27,000.00$ 18,000.00$ $14,400.00 13.45% 13.59% 13.64% 0.19% 0.0%
Phone bil ls 4,500.00$ 3,000.00$ $2,400.00 13.56% 13.59% 13.59% 0.03% 0.0%Stationaries 900.00$ 600.00$ $480.00 13.58% 13.59% 13.59% 0.01% 0.0%
Purchase 5,760,000.00$ 7,200,000.00$ 10,800,000.00$ 13.59% 13.59% 13.59% 0.00% 0.0%

8/7/2019 Y IE5003 Term Paper
http://slidepdf.com/reader/full/y-ie5003-term-paper 19/51
19
$(4,000,000.00)
$1,000,000.00
$6,000,000.00
$11,000,000.00
$16,000,000.00
10% 20% 30% 40% 50% 60% 70% 80% 90% 100%
A f e r - T a x P W
Profit
FMCG Distributorship Profit Vs After Tax PW
$(2,500,000.00)
$(2,000,000.00)
$(1,500,000.00)
$(1,000,000.00)
$(500,000.00)
$-
$500,000.00
$1,000,000.00
$1,500,000.00
A f e r - T a x P W
Sales
FMCG Distributorship Sales Vs After Tax PW
8/7/2019 Y IE5003 Term Paper
http://slidepdf.com/reader/full/y-ie5003-term-paper 20/51
20
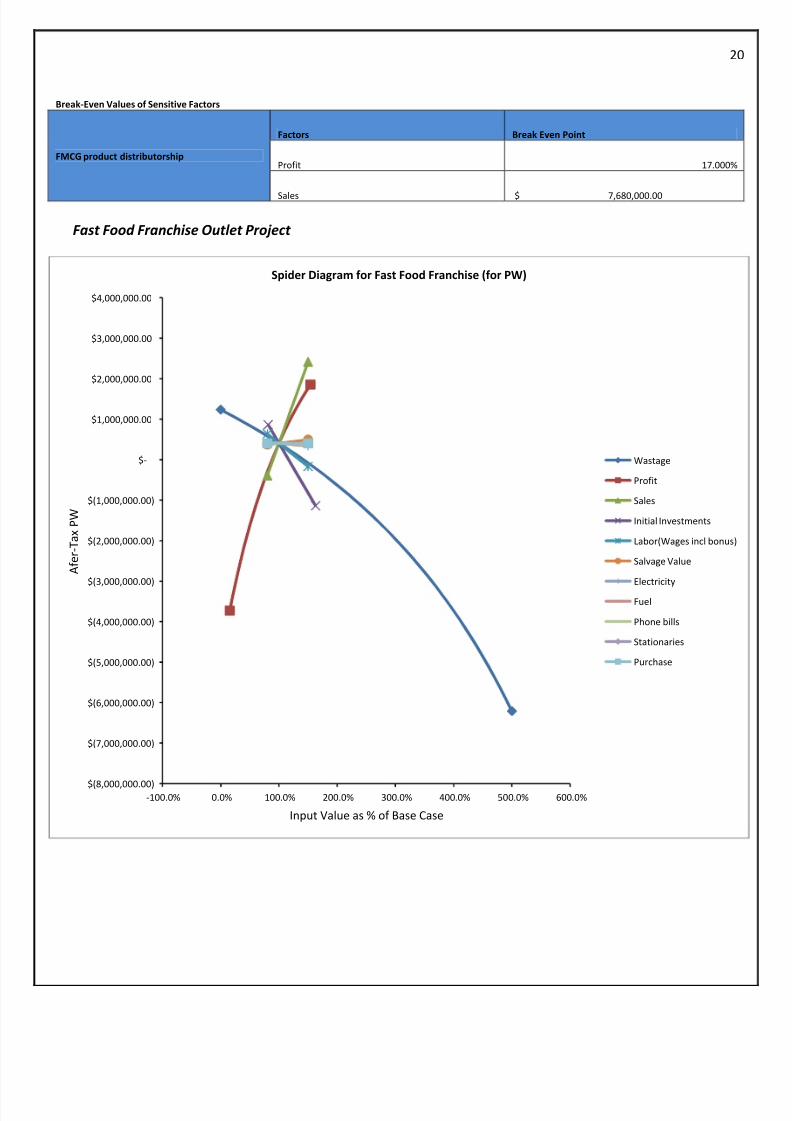
Break-Even Values of Sensitive Factors
FMCG product distributorship
Factors Break Even Point
Profit 17.000%
Sales $ 7,680,000.00
Fast Food Franchise Outlet Project
$(8,000,000.00)
$(7,000,000.00)
$(6,000,000.00)
$(5,000,000.00)
$(4,000,000.00)
$(3,000,000.00)
$(2,000,000.00)
$(1,000,000.00)
$-
$1,000,000.00
$2,000,000.00
$3,000,000.00
$4,000,000.00
-100.0% 0.0% 100.0% 200.0% 300.0% 400.0% 500.0% 600.0%
A f e r - T a x P W
Input Value as % of Base Case
Spider Diagram for Fast Food Franchise (for PW)
Wastage
Profit
Sales
Initial Investments
Labor(Wages incl bonus)
Salvage Value
Electricity
Fuel
Phone bills
Stationaries
Purchase

8/7/2019 Y IE5003 Term Paper
http://slidepdf.com/reader/full/y-ie5003-term-paper 21/51
21
50%
10%
$1,776,000.00
$4,000,000.00
$312,000.00
$960,000.00
$36,000.00
$36,000.00
$14,400.00
$900.00
$1,200,000.00
0%
100%
$3,330,000.00
$2,000,000.00
$166,400.00
$1,800,000.00
$19,200.00
$19,200.00
$7,680.00
$480.00
$2,250,000.00
Wastage
Profit
Sales
Initial Investments
Labor(Wages incl bonus)
Salvage Value
Electricity
Fuel
Phone bills
Stationaries
Purchase
Afer-Tax PW
Tornado Diagram for Fast Food Franchise (for After Tax PW)
Afer-Tax PW
Corresponding Input Value Output Value Perce
Input Variable Low Output Base Case High Output Low Base High Swing Swing
Wastage 50% 10% 0% (6,213,135.90)$ 405,710.42$ $1,233,066.21 7,446,202.11$ 55.9
Profit 10% 65% 100% (3,731,068.53)$ 405,710.42$ 1,853,583.05$ 5,584,651.58$ 31.4
Sales 1,776,000.00$ 2,220,000.00$ 3,330,000.00$ (396,824.70)$ 405,710.42$ 2,412,048.21$ 2,808,872.91$ 8.0
Ini tial Inves tments 4,000,000.00$ 2,456,000.00$ $2,000,000.00 (1,138,289.58)$ 405,710.42$ $861,710.42 2,000,000.00$ 4.0
Labor(Wages incl bonus) 312,000.00$ 208,000.00$ $166,400.00 (169,860.88)$ 405,710.42$ $635,938.94 805,799.82$ 0.7
Salvage Value 960,000.00$ 1,200,000.00$ 1,800,000.00$ 371,212.36$ 405,710.42$ 491,955.57$ 120,743.21$ 0.0
Electricity 36,000.00$ 24,000.00$ $19,200.00 339,298.35$ 405,710.42$ $432,275.25 92,976.90$ 0.0
Fuel 36,000.00$ 24,000.00$ $19,200.00 339,298.35$ 405,710.42$ $432,275.25 92,976.90$ 0.0
Phone bil ls 14,400.00$ 9,600.00$ $7,680.00 379,145.59$ 405,710.42$ $416,336.35 37,190.76$ 0.0
Stationaries 900.00$ 600.00$ $480.00 404,050.12$ 405,710.42$ $406,374.54 2,324.42$ 0.0
Purchase 1,200,000.00$ 1,500,000.00$ 2,250,000.00$ 405,710.42$ 405,710.42$ 405,710.42$ -$ 0.0

8/7/2019 Y IE5003 Term Paper
http://slidepdf.com/reader/full/y-ie5003-term-paper 22/51
22
-25.00%
-20.00%
-15.00%
-10.00%
-5.00%
0.00%
5.00%
10.00%
15.00%
20.00%
25.00%
30.00%
35.00%
-100.0% 0.0% 100.0% 200.0% 300.0% 400.0% 500.0% 600.0%
A f t e r - T a x I R R
Input Value as % of Base Case
Spider Diagram for Fast Food Franchise (for IRR)
Wastage
Profit
Sales
Initial Investments
Labor(Wages incl bonus)
Salvage Value
Electricity
Fuel
Phone bills
Stationaries
Purchase

8/7/2019 Y IE5003 Term Paper
http://slidepdf.com/reader/full/y-ie5003-term-paper 23/51
23
After-Tax IRR
Corresponding Input Value Output Value Percen
Input Variable Low Output Base Case High Output Low Base High Swing Swing^
Wastage 50% 10% 0% -16.39% 17.06% 21.91% 38.30% 51.8%
Profit 10% 65% 100% -4.99% 17.06% 25.60% 30.59% 33.1%
Sales 1,776,000.00$ 2,220,000.00$ 3,330,000.00$ 12.47% 17.06% 28.96% 16.48% 9.6%
Initial Investments 4,000,000.00$ 2,456,000.00$ $2,000,000.00 9.58% 17.06% 21.03% 11.45% 4.6%
Labor(Wages inc l bonus) 312,000.00$ 208,000.00$ $166,400.00 13.76% 17.06% 18.40% 4.64% 0.8%
Salvage Value 3,240,000.00$ 4,050,000.00$ 6,075,000.00$ 16.58% 17.06% 18.12% 1.54% 0.1%
Electricity 36,000.00$ 24,000.00$ $19,200.00 16.68% 17.06% 17.22% 0.54% 0.0%
Fuel 36,000.00$ 24,000.00$ $19,200.00 16.68% 17.06% 17.22% 0.54% 0.0%
Phone bills 14,400.00$ 9,600.00$ $7,680.00 16.91% 17.06% 17.12% 0.22% 0.0%
Stationaries 900.00$ 600.00$ $480.00 17.05% 17.06% 17.07% 0.01% 0.0%
Purchase 1,200,000.00$ 1,500,000.00$ 2,250,000.00$ 17.06% 17.06% 17.06% 0.00% 0.0%

8/7/2019 Y IE5003 Term Paper
http://slidepdf.com/reader/full/y-ie5003-term-paper 24/51
24
Analysis result shows that Wastage, Profit and Sales are significant factors affecting PW of this project. Let us
see the sensitivity and Break-even of these factors in this project.
$(140,000,000.00)
$(120,000,000.00)
$(100,000,000.00)
$(80,000,000.00)
$(60,000,000.00)
$(40,000,000.00)
$(20,000,000.00)
$-
$20,000,000.00
0% 10% 20% 30% 40% 50% 60% 70% 80% 90% 100%
A f e r - T a x P W
Wastage
Fast Food Franchise Wastage Vs After Tax PW
$(4,000,000.00)
$(3,000,000.00)
$(2,000,000.00)
$(1,000,000.00)
$-
$1,000,000.00
$2,000,000.00
$3,000,000.00
10% 20% 30% 40% 50% 60% 70% 80% 90% 100%
A f e r - T a x P W
Profit
Fast Food Franchise Profit Vs After Tax PW

8/7/2019 Y IE5003 Term Paper
http://slidepdf.com/reader/full/y-ie5003-term-paper 25/51
25
$(2,000,000.00)
$(1,000,000.00)
$-
$1,000,000.00
$2,000,000.00
$3,000,000.00
$4,000,000.00
$5,000,000.00
$1,000,000.00 $1,500,000.00 $2,000,000.00 $2,500,000.00 $3,000,000.00 $3,500,000.00 $4,000,000.00
A f e r - T a x P W
Sales
Fast Food Franchise Sales Vs After Tax PW
Break-Even Values of Sensitive Factors
Factors Break Even Point
Wastage 18.000%
Profit 51.000%
Sales 1,770,000.00$
Fast Food Franchise Outlet

8/7/2019 Y IE5003 Term Paper
http://slidepdf.com/reader/full/y-ie5003-term-paper 26/51
26
Cold Storage Project
$(8,000,000.00)
$(7,000,000.00)
$(6,000,000.00)
$(5,000,000.00)$(4,000,000.00)
$(3,000,000.00)
$(2,000,000.00)
$(1,000,000.00)
$-
$1,000,000.00
$2,000,000.00
$3,000,000.00
$4,000,000.00
$5,000,000.00
$6,000,000.00
$7,000,000.00$8,000,000.00
$9,000,000.00
$10,000,000.00
A f e r - T a x P W
Input Value as % of Base Case
Spider Diagram for Cold Storage (for After Tax PW)
Profit
Sales
Wastage
Initial Investments
Labor(Wages incl bonus)
Salvage Value
Electricity
Fuel
Phone bills
Stationaries
Purchase
10%
$4,848,000.00
15%
$7,000,000.00
$243,750.00
$2,400,000.00
$54,000.00
$36,000.00
$1,800.00
$900.00
$3,840,000.00
100%
$9,090,000.00
5%
$5,000,000.00
$130,000.00
$4,500,000.00
$28,800.00
$19,200.00
$960.00
$480.00
$7,200,000.00
Profit
Sales
Wastage
Initial Investments
Labor(Wages incl bonus)
Salvage Value
Electricity
Fuel
Phone bills
Stationaries
Purchase
Afer-Tax PW
Tornado Diagram for Cold Storage (for After tax PW)

8/7/2019 Y IE5003 Term Paper
http://slidepdf.com/reader/full/y-ie5003-term-paper 27/51
27
Afer-Tax PW
Corresponding Input Value Output Value Percen
Input Variable Low Output Base Case High Output Low Base High Swing Swing^
Profit 10% 40% 100% (6,843,603.20)$ 468,433.10$ 8,400,986.25$ 15,244,589.45$ 86.2%
Sales 4,848,000.00$ 6,060,000.00$ 9,090,000.00$ (926,220.43)$ 468,433.10$ 3,955,066.93$ 4,881,287.36$ 8.8%
Wastage 15% 10% 5% (1,094,203.91)$ 468,433.10$ $1,866,582.00 2,960,785.91$ 3.3%
Ini tial Investments 7,000,000.00$ 6,085,500.00$ $5,000,000.00 (446,066.90)$ 468,433.10$ $1,553,933.10 2,000,000.00$ 1.5%
Labor(Wages inc l bonus) 243,750.00$ 162,500.00$ $130,000.00 18,768.03$ 468,433.10$ $648,299.13 629,531.10$ 0.1%Salvage Value 2,400,000.00$ 3,000,000.00$ 4,500,000.00$ 382,187.95$ 468,433.10$ 684,045.97$ 301,858.02$ 0.0%
Electricity 54,000.00$ 36,000.00$ $28,800.00 368,814.99$ 468,433.10$ $508,280.35 139,465.36$ 0.0%
Fuel 36,000.00$ 24,000.00$ $19,200.00 402,021.03$ 468,433.10$ $494,997.93 92,976.90$ 0.0%
Phone bil ls 1,800.00$ 1,200.00$ $960.00 465,112.50$ 468,433.10$ $469,761.34 4,648.84$ 0.0%
Stationaries 900.00$ 600.00$ $480.00 466,772.80$ 468,433.10$ $469,097.22 2,324.42$ 0.0%
Purchase 3,840,000.00$ 4,800,000.00$ 7,200,000.00$ 468,433.10$ 468,433.10$ 468,433.10$ -$ 0.0%
-15.00%
-10.00%
-5.00%
0.00%
5.00%
10.00%
15.00%
20.00%
25.00%
30.00%
35.00%
40.00%
A f t e r - T a
x I R R
Input Value as % of Base Case
Spider Diagram for Cold Storage (for IRR)
Profit
Sales
Wastage
Initial Investments
Labor(Wages incl bonus)
Salvage Value
Electricity
Fuel
Phone bills
Stationaries
Purchase

8/7/2019 Y IE5003 Term Paper
http://slidepdf.com/reader/full/y-ie5003-term-paper 28/51
28
Analysis result shows that Profit, Sales and Wastage are significant factors affecting PW of this project. Let us
see the sensitivity and Break-even of these factors in this project.
10%
$4,848,000.00
15%
$7,000,000.00
$243,750.00
$2,400,000.00
$54,000.00
$36,000.00
$1,800.00
$900.00
$3,840,000.00
100%
$9,090,000.00
5%
$5,000,000.00
$130,000.00
$4,500,000.00
$28,800.00
$19,200.00
$960.00
$480.00
$7,200,000.00
-15.00% -10.00% -5.00% 0.00% 5.00% 10.00% 15.00% 20.00% 25.00% 30.00% 35.00% 40.00%
Profit
Sales
Wastage
Initial Investments
Labor(Wages incl bonus)
Salvage Value
Electricity
Fuel
Phone bills
Stationaries
Purchase
After-Tax IRR
Tornado Diagram for Cold Storage (for IRR)
After-Tax IRR
Corresponding Input Value Output Value Percent
Input Variable Low Output Base Case High Output Low Base High Swing Swing^2
Profit 10% 40% 100% -9.64% 13.71% 34.54% 44.18% 87.1%
Sales 4,848,000.00$ 6,060,000.00$ 9,090,000.00$ 9.77% 13.71% 23.09% 13.32% 7.9%
Wastage 15% 10% 5% 9.28% 13.71% 17.53% 8.25% 3.0%
Initial Investments 7,000,000.00$ 6,085,500.00$ $5,000,000.00 11.29% 13.71% 17.51% 6.22% 1.7%
Labor(Wages incl bonus) 243,750.00$ 162,500.00$ $130,000.00 12.45% 13.71% 14.21% 1.75% 0.1%
Salvage Value 2,400,000.00$ 3,000,000.00$ 4,500,000.00$ 13.49% 13.71% 14.22% 0.73% 0.0%
Electricity 54,000.00$ 36,000.00$ $28,800.00 13.43% 13.71% 13.82% 0.39% 0.0%
Fuel 36,000.00$ 24,000.00$ $19,200.00 13.52% 13.71% 13.78% 0.26% 0.0%
Phone bil ls 1,800.00$ 1,200.00$ $960.00 13.70% 13.71% 13.71% 0.01% 0.0%
Stationaries 900.00$ 600.00$ $480.00 13.70% 13.71% 13.71% 0.01% 0.0%
Purchase 3,840,000.00$ 4,800,000.00$ 7,200,000.00$ 13.71% 13.71% 13.71% 0.00% 0.0%

8/7/2019 Y IE5003 Term Paper
http://slidepdf.com/reader/full/y-ie5003-term-paper 29/51
29
$(10,000,000.00)
$(8,000,000.00)
$(6,000,000.00)
$(4,000,000.00)
$(2,000,000.00)
$-
$2,000,000.00
$4,000,000.00
$6,000,000.00
$8,000,000.00
$10,000,000.00
0% 10% 20% 30% 40% 50% 60% 70% 80% 90% 100%
A f e r - T a x P W
Profit
Cold Storage Profit Vs After Tax PW
$(4,000,000.00)
$(2,000,000.00)
$-
$2,000,000.00
$4,000,000.00
$6,000,000.00
$8,000,000.00
A f e r - T a x P W
Sales
Cold Storage Sales Vs After Tax PW

8/7/2019 Y IE5003 Term Paper
http://slidepdf.com/reader/full/y-ie5003-term-paper 30/51
30
$(5,000,000.00)
$(4,000,000.00)
$(3,000,000.00)
$(2,000,000.00)
$(1,000,000.00)
$-
$1,000,000.00
$2,000,000.00
4% 9% 14% 19% 24%
A f e r - T a x P W
Wastage
Cold Storage Wastage Vs After Tax PW
Break-Even Values of Sensitive Factors
Factors Break Even Point
Profit 40.000%
Sales 4,100,000.00$
Wastage 11.000%
Cold Storage

8/7/2019 Y IE5003 Term Paper
http://slidepdf.com/reader/full/y-ie5003-term-paper 31/51
31
Probabilistic Risk Analysis
Based on the data collected, below are the distributions of each factor with parameters given. Also Risk profile
of each project is generated by using Monte Carlo Simulations.
FMCG Distributorship Project
Uncertain Variables Distribution Parameters
Initial Investments Uniform 4732400 8873250
Labor(Wages incl
bonus) Normal 260000 45500
Electricity Normal 18000 3150
Fuel Normal 24000 4200
Phone bills Normal 3000 525
Stationaries Normal 600 105
Purchase Normal 7200000 1260000
Profit Normal 18% 5%Sales Normal 8496000 1486800
Salvage Value Normal 5569500 649775
0
500
1000
1500
2000
2500
3000
Afer-Tax PW
F r e q u e n c y
FMCG Distributorship - Histogram
Mean (280,193.60)$
St. Dev. 2,460,749.14$
Mean St. Error 13,756.01$
Minimum (8,699,999.69)$
First Quartile (1,995,678.79)$
Median (338,968.36)$
Third Quartile 1,349,048.97$
Maximum 11,844,908.50$
Skewness 0.1555

8/7/2019 Y IE5003 Term Paper
http://slidepdf.com/reader/full/y-ie5003-term-paper 32/51
32
0.0
0.1
0.2
0.3
0.4
0.5
0.6
0.7
0.8
0.9
1.0
C u m u l a t i v e P r o b a b i l i t y
Afer-Tax PW
FMCG Distributorship- Cumulative Chart
Percent Percentile
0% (8,699,999.69)$
5% (4,192,195.79)$
10% (3,384,774.10)$
15% (2,834,662.78)$
20% (2,371,883.20)$
25% (1,995,678.79)$30% (1,631,918.10)$
35% (1,283,745.60)$
40% (961,602.57)$
45% (643,803.82)$
50% (338,968.36)$
55% (26,553.71)$
60% 300,127.25$
65% 621,637.79$
70% 965,943.74$
75% 1,349,048.97$80% 1,764,892.48$
85% 2,270,135.43$
90% 2,893,681.50$
95% 3,875,461.31$
100% 11,844,908.50$

8/7/2019 Y IE5003 Term Paper
http://slidepdf.com/reader/full/y-ie5003-term-paper 33/51
33
-10.00% -5.00% 0.00% 5.00% 10.00% 15.00% 20.00% 25.00% 30.00% 35.00% 40.00% 45.00%
0
1000
2000
3000
4000
5000
6000
After-Tax IRR
F r e q u e n c y
FMCG Distributorship - Histogram
Mean 12.18%
St. Dev. 5.98%
Mean St. Error 0.03%
Minimum -7.06%
First Quarti le 8.00%
Median 11.65%
Third Quartile 15.84%
Maximum 42.71%
Skewness 0.5065

8/7/2019 Y IE5003 Term Paper
http://slidepdf.com/reader/full/y-ie5003-term-paper 34/51
34
0.0
0.1
0.2
0.3
0.4
0.5
0.6
0.7
0.8
0.9
1.0
-10.00% -5.00% 0.00% 5.00% 10.00% 15.00% 20.00% 25.00% 30.00% 35.00% 40.00% 45.00%
C u m u l a t i v e P r o b a b i l i t y
After-Tax IRR
FMCG Distributorship Cumulative Chart
Percent Percentile
0% -7.06%
5% 3.26%
10% 5.00%
15% 6.18%
20% 7.16%
25% 8.00%
30% 8.77%
35% 9.51%
40% 10.24%
45% 10.93%
50% 11.65%
55% 12.40%
60% 13.17%
65% 13.99%
70% 14.87%
75% 15.84%
80% 16.92%
85% 18.27%
90% 20.05%
95% 22.74%
100% 42.71%

8/7/2019 Y IE5003 Term Paper
http://slidepdf.com/reader/full/y-ie5003-term-paper 35/51
35
Fast Food Franchise outlet Project
Uncertain Variables Distribution
Initial Investments Uniform 2,000,000.00$ 4,000,000.00$
Labor(Wages incl bonus) Normal 208,000.00$ 36,400.00$
Electricity Normal 24,000.00$ 4,200.00$Fuel Normal 24,000.00$ 4,200.00$
Phone bills Normal 9,600.00$ 1,680.00$
Stationaries Normal 600.00$ 105.00$
Purchase Normal 1,500,000.00$ 262,500.00$
Profit Normal 64% 23%
Wastage Normal 10% 13%
Sales Normal 2,220,000.00$ 388,500.00$
Salvage Value Normal 1,200,000.00$ 210,000.00$
Parameters
0
1000
2000
3000
4000
5000
6000
7000
Afer-Tax PW
F r e q u e n c y
Fast Food - Histogram
Mean (111,672.21)$
St. Dev. 1,686,809.27$
Mean St. Error 10,668.32$
Minimum (13,782,045.41)$
First Quarti le (1,080,892.94)$
Median 15,523.10$
Third Quarti le 1,023,029.27$
Maximum 5,780,026.86$
Skewness -0.6730

8/7/2019 Y IE5003 Term Paper
http://slidepdf.com/reader/full/y-ie5003-term-paper 36/51
36
0.0
0.1
0.2
0.3
0.4
0.5
0.6
0.7
0.8
0.9
1.0
C u m u l a t i v e P r o b a b i l i t y
Afer-Tax PW
Fast Food - Cumulative Chart
Percent Percentile
0% (13,782,045.41)$
5% (3,046,754.84)$
10% (2,223,809.82)$
15% (1,739,120.80)$
20% (1,370,742.22)$
25% (1,080,892.94)$
30% (819,991.26)$
35% (588,814.06)$40% (371,919.01)$
45% (170,270.05)$
50% 15,523.10$
55% 206,414.53$
60% 409,630.92$
65% 607,667.74$
70% 806,199.30$
75% 1,023,029.27$
80% 1,268,357.07$
85% 1,533,888.44$90% 1,865,790.09$
95% 2,363,932.50$
100% 5,780,026.86$

8/7/2019 Y IE5003 Term Paper
http://slidepdf.com/reader/full/y-ie5003-term-paper 37/51
37
Cold Storage Project
Uncertain Var iables Distribution
Initial Investments Uniform 5,000,000.00$ 7,000,000.00$
Labor(Wages incl bonus) Normal 162,500.00$ 28,437.50$
Electricity Normal 36,000.00$ 6,300.00$Fuel Normal 24,000.00$ 4,200.00$
Phone bills Normal 1,200.00$ 210.00$
Stationaries Normal 600.00$ 105.00$
Purchase Normal 4,800,000.00$ 840,000.00$
Profit Normal 40% 23%
Wastage Normal 10% 3%
Sales Normal 6,060,000.00$ 1,060,500.00$
Salvage Value Normal 3,000,000.00$ 525,000.00$
Parameters
0
2000
4000
6000
8000
10000
12000
14000
Afer-Tax PW
F r e q u e n c y
Cold Storage - Histogram
Mean (212,512.83)$
St. Dev. 5,102,515.50$
Mean St. Error 28,523.93$
Minimum (51,512,295.20)$
First Quarti le (2,945,961.22)$Median 281,427.87$
Third Quarti le 3,161,496.71$
Maximum 16,987,256.00$
Skewness -0.9760

8/7/2019 Y IE5003 Term Paper
http://slidepdf.com/reader/full/y-ie5003-term-paper 38/51
38
0.0
0.1
0.2
0.3
0.4
0.5
0.6
0.7
0.8
0.9
1.0
C u m u l a t i v e P r o b a b i l i t y
Afer-Tax PW
Cold Storage - Cumulative Chart
Percent Percentile
0% (51,512,295.20)$
5% (9,127,625.45)$
10% (6,439,789.63)$
15% (4,936,809.23)$
20% (3,844,411.76)$
25% (2,945,961.22)$
30% (2,217,771.96)$
35% (1,509,964.52)$
40% (891,826.18)$
45% (272,137.78)$
50% 281,427.87$
55% 845,094.80$
60% 1,403,031.08$
65% 1,981,454.67$
70% 2,566,148.14$
75% 3,161,496.71$
80% 3,834,441.56$
85% 4,616,270.00$
90% 5,575,477.43$95% 6,998,267.94$
100% 16,987,256.00$

8/7/2019 Y IE5003 Term Paper
http://slidepdf.com/reader/full/y-ie5003-term-paper 39/51
39
0.00% 10.00% 20.00% 30.00% 40.00% 50.00% 60.00% 70.00%
0
1000
2000
3000
4000
5000
6000
7000
After-Tax IRR
F r e q u e n c y
Cold Storage- Histogram
Mean 29.00%
St. Dev. 7.77%
Mean St. Error 0.05%
Minimum 5.85%
First Quartile 23.41%
Median 28.35%
Third Quartile 33.99%
Maximum 66.38%
Skewness 0.4216
0.0
0.1
0.2
0.3
0.4
0.5
0.6
0.7
0.8
0.9
1.0
0.00% 10.00% 20.00% 30.00% 40.00% 50.00% 60.00% 70.00%
C u m u l a t i v e P r o b a b i l i t y
After-Tax IRR
Cold Storage - Cumulative Chart

8/7/2019 Y IE5003 Term Paper
http://slidepdf.com/reader/full/y-ie5003-term-paper 40/51
40
Results for Probabilistic Analysis
Observation: All three Projects involve high risk factors in it.
Percent Percentile
0% 5.85%
5% 17.29%
10% 19.39%
15% 20.92%
20% 22.25%
25% 23.41%
30% 24.46%
35% 25.44%
40% 26.45%
45% 27.36%
50% 28.35%
55% 29.40%
60% 30.42%
65% 31.52%
70% 32.70%
75% 33.99%
80% 35.47%
85% 37.23%
90% 39.40%
95% 42.80%
100% 66.38%
Probabilistic Analysis Results
Parameters Values Remarks
Mean (280,193.00)$
Std Deviation 2,460,749.00$
Prob (PW =< 0) ~ 55.000%
Parameters Values Remarks
Mean (111,672.00)$
Std Deviation 1,686,809.00$
Prob (PW =< 0) ~ 45.000%
Parameters Values Remarks
Mean (212,512.00)$
Std Deviation 5,102,515.00$
Prob (PW =< 0) ~ 45.000%
High Risk Project with negetive
mean
High Risk Project with negetive
mean
High Risk Project with negetive
mean
FMCG distributorship
Fast Food Franchise Outlet
Cold Storage

8/7/2019 Y IE5003 Term Paper
http://slidepdf.com/reader/full/y-ie5003-term-paper 41/51
41
What-If Analysis
Mr. X wants to minimize the risk by controlling the quality in 6 sigma level and with high class marketing
techniques, he wants to maintain the higher profit margins. Since he has considerable experience in Quality
assurance & Marketing of Food and Beverages, he believes that he could be able to control the quality and can
market the product much efficiently with no additional costs.
* As FMCG product pricing and Marketing are controlled by FMCG companies themselves, distributor has no
role in regulating them, hence considered only Fast Food & Cold Storage.
Cold Storage Project – Under What if Conditions
1.00%
2.00%
3.00%
4.00%
5.00%
6.00%
7.00%
8.00%
9.00%
10.00%
11.00%
12.00%
A f t e r - T a x I R R
Input Value as % of Base Case
Cold Storage - Spider Diagram under What if Condiation
Sales
Profit
Initial Investments
Labor(Wages incl bonus)
Salvage Value
Wastage
Electricity
Fuel
Phone bills
Stationaries
Purchase

8/7/2019 Y IE5003 Term Paper
http://slidepdf.com/reader/full/y-ie5003-term-paper 42/51
42
$1,600,000.00
50%
$7,000,000.00
$243,750.00
$2,400,000.00
10%
$54,000.00
$36,000.00
$1,800.00
$900.00
$3,840,000.00
$3,000,000.00
100%
$5,000,000.00
$130,000.00
$4,500,000.00
5%
$28,800.00
$19,200.00
$960.00
$480.00
$7,200,000.00
1.00% 2.00% 3.00% 4.00% 5.00% 6.00% 7.00% 8.00% 9.00% 10.00% 11.00% 12.00%
Sales
Profit
Initial Investments
Labor(Wages incl bonus)
Salvage Value
Wastage
Electricity
Fuel
Phone bills
Stationaries
Purchase
After-Tax IRR
Cold Storage - Tornado Diagram under What if Condiation
After-Tax IRR
Corresponding Input Value Output Value Percent
Input Variable Low Output Base Case High Output Low Base High Swing Swing^2
Sales $1,600,000.00 $2,000,000.00 $3,000,000.00 2.17% 4.54% 10.19% 8.02% 51.6%
Profit 50% 65% 100% 2.29% 4.54% 8.34% 6.05% 29.3%
Initial Investments 7,000,000.00$ 6,085,500.00$ $5,000,000.00 2.97% 4.54% 6.93% 3.96% 12.6%
Labor(Wages inc l bonus) 243,750.00$ 162,500.00$ $130,000.00 3.15% 4.54% 5.09% 1.94% 3.0%
Salvage Value 2,400,000.00$ 3,000,000.00$ 4,500,000.00$ 4.04% 4.54% 5.66% 1.62% 2.1%
Wastage 10% 8% 5% 3.93% 4.54% 5.13% 1.20% 1.2%
Electricity 54,000.00$ 36,000.00$ $28,800.00 4.24% 4.54% 4.67% 0.43% 0.1%
Fuel 36,000.00$ 24,000.00$ $19,200.00 4.34% 4.54% 4.63% 0.28% 0.1%
Phone bills 1,800.00$ 1,200.00$ $960.00 4.53% 4.54% 4.55% 0.01% 0.0%
Stationaries 900.00$ 600.00$ $480.00 4.54% 4.54% 4.55% 0.01% 0.0%
Purchase 3,840,000.00$ 4,800,000.00$ 7,200,000.00$ 4.54% 4.54% 4.54% 0.00% 0.0%

8/7/2019 Y IE5003 Term Paper
http://slidepdf.com/reader/full/y-ie5003-term-paper 43/51
43
-10.00% 0.00% 10.00% 20.00% 30.00% 40.00% 50.00% 60.00%0
1000
2000
3000
4000
5000
6000
7000
8000
9000
After-Tax IRR
F r e q u e n c y
Cold Storage - Histogram Under What if Condition
0.0
0.1
0.2
0.3
0.4
0.5
0.6
0.7
0.8
0.9
1.0
-10.00% 0.00% 10.00% 20.00% 30.00% 40.00% 50.00% 60.00%
C u m u l a t i v e P r o b a b i l i t y
After-Tax IRR
Cold Storage - Cumulative Chart under What if Condition
8/7/2019 Y IE5003 Term Paper
http://slidepdf.com/reader/full/y-ie5003-term-paper 44/51
44
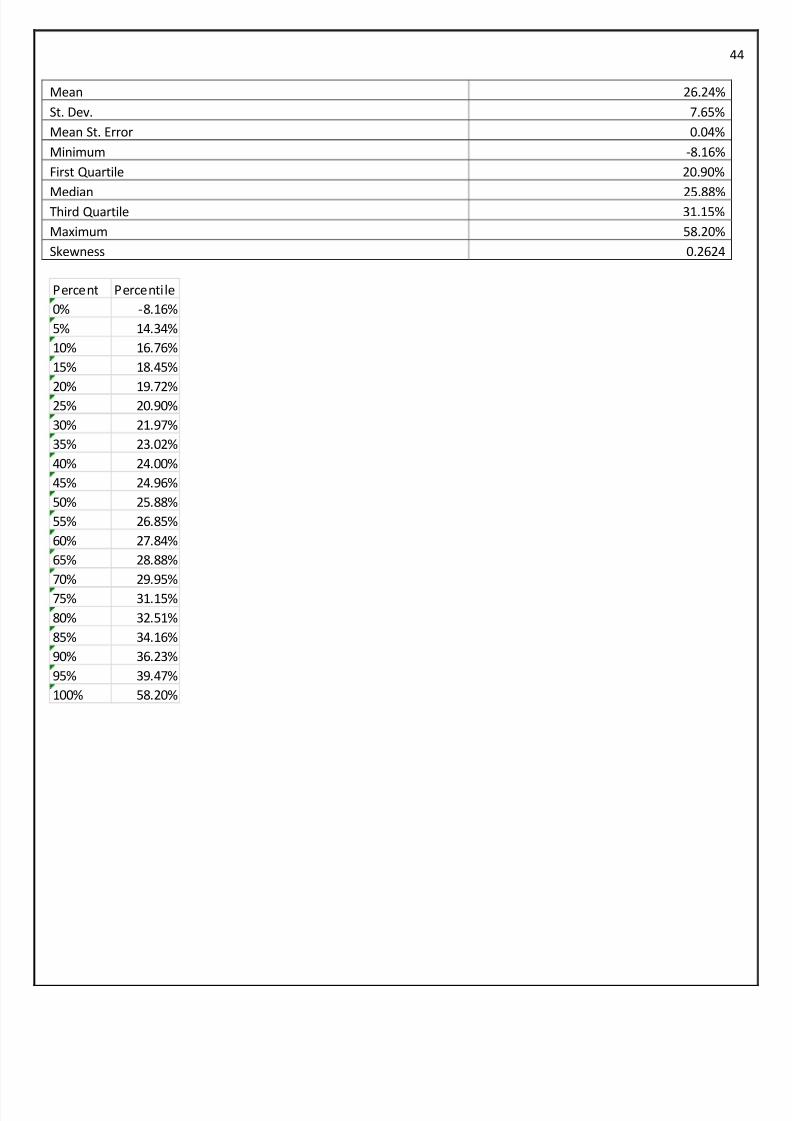
Mean 26.24%
St. Dev. 7.65%
Mean St. Error 0.04%
Minimum -8.16%
First Quartile 20.90%
Median 25.88%Third Quartile 31.15%
Maximum 58.20%
Skewness 0.2624
Percent Percentile
0% -8.16%
5% 14.34%
10% 16.76%
15% 18.45%
20% 19.72%25% 20.90%
30% 21.97%
35% 23.02%
40% 24.00%
45% 24.96%
50% 25.88%
55% 26.85%
60% 27.84%
65% 28.88%
70% 29.95%
75% 31.15%
80% 32.51%
85% 34.16%
90% 36.23%
95% 39.47%
100% 58.20%

8/7/2019 Y IE5003 Term Paper
http://slidepdf.com/reader/full/y-ie5003-term-paper 45/51
45
Fast Food Franchise Project- Under What if Condition
$(1,500,000.00)
$(1,000,000.00)
$(500,000.00)
$-
$500,000.00
$1,000,000.00
$1,500,000.00
$2,000,000.00
$2,500,000.00
$3,000,000.00
$3,500,000.00
$4,000,000.00
A f e r - T a x P W
Input Value as % of Base Case
Fast Food - Spider Diagram-Under What if Condition
Sales
Profit
Initial Investments
Labor(Wages incl bonus)
Wastage
Salvage Value
Electricity
Fuel
Phone bills
Stationaries
Purchase
$1,776,000.00
50.00%
$4,000,000.00
$312,000.00
10.00%
$3,240,000.00
$36,000.00
$36,000.00
$14,400.00
$900.00
$1,200,000.00
$3,330,000.00
100.00%
$2,000,000.00
$166,400.00
5.00%
$6,075,000.00
$19,200.00
$19,200.00
$7,680.00
$480.00
$2,250,000.00
Sales
Profit
Initial Investments
Labor(Wages incl bonus)
Wastage
Salvage Value
Electricity
Fuel
Phone bills
Stationaries
Purchase
Afer-Tax PW
Fast Food - Tornado Diagram-Under What if Condition

8/7/2019 Y IE5003 Term Paper
http://slidepdf.com/reader/full/y-ie5003-term-paper 46/51
46
Afer-Tax PW
Corresponding Input Value Output Value Percen
Input Variable Low Output Base Case High Output Low Base High Swing Swing^
Sales $1,776,000.00 $2,220,000.00 $3,330,000.00 191,727.50$ 1,038,984.55$ 3,157,127.17$ 2,965,399.67$ 47.0%
Profit 50.00% 65.00% 100.00% 233,989.73$ 1,038,984.55$ 2,447,725.49$ 2,213,735.76$ 26.2%
Ini tial Investments 4,000,000.00$ 2,456,000.00$ $2,000,000.00 (505,015.45)$ 1,038,984.55$ $1,494,984.55 2,000,000.00$ 21.4%
Labor(Wages inc l bonus) 312,000.00$ 208,000.00$ $166,400.00 463,413.25$ 1,038,984.55$ $1,269,213.07 805,799.82$ 3.5%
Wastage 10.00% 7.50% 5.00% 815,374.87$ 1,038,984.55$ $1,250,825.29 435,450.42$ 1.0%Salvage Value 3,240,000.00$ 4,050,000.00$ 6,075,000.00$ 922,553.60$ 1,038,984.55$ 1,330,061.92$ 407,508.32$ 0.9%
Electricity 36,000.00$ 24,000.00$ $19,200.00 972,572.47$ 1,038,984.55$ $1,065,549.38 92,976.91$ 0.0%
Fuel 36,000.00$ 24,000.00$ $19,200.00 972,572.47$ 1,038,984.55$ $1,065,549.38 92,976.91$ 0.0%
Phone bil ls 14,400.00$ 9,600.00$ $7,680.00 1,012,419.72$ 1,038,984.55$ $1,049,610.48 37,190.76$ 0.0%
Stationaries 900.00$ 600.00$ $480.00 1,037,324.25$ 1,038,984.55$ $1,039,648.67 2,324.42$ 0.0%
Purchase 1,200,000.00$ 1,500,000.00$ 2,250,000.00$ 1,038,984.55$ 1,038,984.55$ 1,038,984.55$ -$ 0.0%
0
1000
2000
3000
4000
5000
6000
Afer-Tax PW
F r e q u e n c y
Fast Food - Histogram Under What if Condition
Mean 44,844.34$
St. Dev. 1,153,969.99$
Mean St. Error 6,450.89$
Minimum (3,943,844.47)$First Quartile (751,472.84)$
Median 26,303.12$
Third Quartile 815,111.88$
Maximum 5,183,214.68$
Skewness 0.1009

8/7/2019 Y IE5003 Term Paper
http://slidepdf.com/reader/full/y-ie5003-term-paper 47/51
47
0.0
0.1
0.2
0.3
0.4
0.5
0.6
0.7
0.8
0.9
1.0
C u m u l a t i v e P r o b a b i l i t
y
Afer-Tax PW
Fast Food - Cumulative Chart Under What if Condition
Percent Percentile
0% (3,943,844.47)$
5% (1,829,865.49)$
10% (1,434,424.82)$
15% (1,159,503.34)$
20% (939,897.82)$
25% (751,472.84)$
30% (578,909.63)$
35% (418,207.35)$
40% (267,822.12)$
45% (116,482.09)$
50% 26,303.12$
55% 173,067.70$
60% 322,052.64$
65% 480,969.01$
70% 647,760.74$
75% 815,111.88$
80% 1,015,626.66$
85% 1,245,762.89$
90% 1,534,579.88$
95% 1,974,531.39$
100% 5,183,214.68$

8/7/2019 Y IE5003 Term Paper
http://slidepdf.com/reader/full/y-ie5003-term-paper 48/51
48
-15.00% -10.00% -5.00% 0.00% 5.00% 10.00% 15.00% 20.00% 25.00% 30.00% 35.00% 40.00% 45.00% 50.00%
0
500
1000
1500
2000
2500
3000
3500
4000
4500
5000
After-Tax IRR
F r e q u e n c y
Fast Food - Histogram under What if Condition
Mean 13.03%
St. Dev. 7.10%
Mean St. Error 0.04%
Minimum -14.49%
First Quartile 8.08%
Median 12.48%Third Quartile 17.40%
Maximum 49.35%
Skewness 0.4140

8/7/2019 Y IE5003 Term Paper
http://slidepdf.com/reader/full/y-ie5003-term-paper 49/51
49
0.0
0.1
0.2
0.3
0.4
0.5
0.6
0.7
0.8
0.9
1.0
-15.00% -10.00% -5.00% 0.00% 5.00% 10.00% 15.00% 20.00% 25.00% 30.00% 35.00% 40.00% 45.00% 50.00%
C u m u l a t i v e P r o b a b i l i t y
After-Tax IRR
Fast Food - Cumulative Chart
under What if Condition
Percent Percentile
0% -14.49%
5% 2.29%
10% 4.43%
15% 5.90%
20% 7.04%
25% 8.08%
30% 9.06%
35% 9.93%
40% 10.79%
45% 11.62%
50% 12.48%
55% 13.35%
60% 14.26%
65% 15.23%
70% 16.27%
75% 17.40%
80% 18.78%
85% 20.34%
90% 22.39%
95% 25.57%
100% 49.35%

8/7/2019 Y IE5003 Term Paper
http://slidepdf.com/reader/full/y-ie5003-term-paper 50/51
50
Results of What If Analysis:
Result: Cold Storage Project is become profitable and low risk
What If condition Results
Parameters Values Remarks
Mean 5,027,304.00$
Std Deviation 2,728,403.00$
Prob (PW =< 0) ~ 2.000%
Parameters Values Remarks
Mean 44,844.00$
Std Deviation 1,153,969.00$
Prob (PW =< 0) ~ 40.000%
Fast Food Franchise Outlet
Low Risk Project with large
mean
High Risk Project with low mea
Cold Storage

8/7/2019 Y IE5003 Term Paper
http://slidepdf.com/reader/full/y-ie5003-term-paper 51/51
51
Recommendations & Conclusion
Cold Storage Project seems to be more profitable among three but with risk involved. If Mr X is Riskseeking personality, he can opt for Cold Storage Project as is, provided he could be able to achieve
the break-even atleast to avoid loss of capital.
If Mr. X could be able control the Quality at 6-Sigma level and could Market the product better way,
Cold Storage product is the one with Less Risk and High PW value. Hence ha can opt for Cold Storage
Project under this condition.
***End of the Report***