y m ou n c a r bo n t o a i r n e m w a r o...
TRANSCRIPT

RO
CKY MOUNTAIN
INSTIT UTE
WAR R O O M
CARBON

Amory B. LovinsCofounder and Chief Scientist
© 2015 Rocky Mountain Institute
Stanford 2015 Climate and Energy Project Research SymposiumStanford University, 13 October 2015
Oil and Electricity’sDisruptive
Futures
RO
CKY MOUNTAIN
INSTIT UTE
WAR R O O M
CARBON

The rise and fall of the U.S. whaling industry

Lamp retrofits from whale oil to coal oil gain market traction
Drake strikes oilin Pennsylvania
The rise and fall of the U.S. whaling industry
, become commonconsumption of whale oil + sperm oil in American
market (1,000 US gallons)
0
2000
4000
6000
8000
1805 1815 1825 1835 1845 1855 1865 1875 1885 1895
year
0.5
1.0
1.5
2.0annual-average real price of whale oil + sperm oil
(2000 $/US gallon)

50
100
150
Lum
inou
s ef
ficac
y (lm
/W)
Incandescent lamp1879
200
250
300
1900 1950 20000
Years
1996
LED and PV
50
100
150
Lu
min
ous e
ffic
acy (
lm/W
)
Fluorescent lamp
Incandescent lamp
Halogen lamp
Sodium-vapor lamp
1965
1938
1959
1879
200
250
300
1900 1950 20000
Years
1996
50
100
150
Lu
min
ous e
ffic
acy (
lm/W
)
Fluorescent lamp
Incandescent lamp
Halogen lamp
Sodium-vapor lamp
White LED
1965
1938
1959
1879
200
250
300
1900 1950 20000
Years
1996
Sources: L: courtesy of Dr. Yukio Narukawa (Nichia Corp., Tokushima, Japan) from J. Physics. D: Appl. Phys. 43(2010) 354002, doi:10.1088/0022-3727/43/35/354002, updated by RMI with CREE lm/W data, 2015, www.cree.com/News-and-Events/Cree-News/Press-Releases/2014/March/300LPW-LED-barrier;. R: RMI analysis, at average 2013 USEIA fossil-fueled generation efficiencies and each year’s real fuel costs (no O&M); utility-scale PV: LBNL, Utility-Scale Solar 2013 (Sep 2014), Fig. 18; onshore wind: USDOE, 2013 Wind Technologies Market Report (Aug 2014), “Windbelt” (Interior zone) windfarms’ average PPA; German feed-in tariff (falls with cost to yield ~6%/y real return): Fraunhofer ISE, Cost Perspective, Grid and Market Integration of Renewable Energies, p 6 (Jan 2014); all sources net of subsidies; graph inspired by 2014 “Terrordome” slide, Michael Parker, Bernstein Alliance
0
100
200
300
400
500
600
700
800
1990
1994
1998
2002
2006
2010
2014
Coal-fired steam turbine, fuel cost onlyOil-fired condensing, fuel cost onlyNatural gas CCGT, fuel cost onlyUtility-scale solar PV, total costOnshore windpower, total costGerman PV residential feed-in tariff
Real
bus
bar p
rice
or fu
el c
ost,
2011
US$
/MW
h
(Seattle-like climate)

What if the biggest threats weren’t on the radar?

0
50
100
150
200
250
1965 1970 1975 1980 1985 1990 1995 2000 2005 2010 2015
Intensity decrease has had 31× the impact of renewable growthU
.S. p
rimar
y en
ergy
use
(qua
drilli
on B
TU/y
)
primary energy use if at 1975 efficiency and structure
actual primary energy use
total renewable energy use
1975–2014 savings from intensity reduction:
2,089 qBTU
1975–2014 growth in total renewable output:
67 qBTU
primary energy use, 1965–1975
energy saved by reduced intensity

Who’s the competition?
Rex TillersonChairman and CEO, ExxonMobil
Ali bin Ibrahim al-NaimiSaudi oil minister
Pål KibsgårdCEO, Schlumberger Ltd.

Who’s the competition?
Elon Musk, Tesla, SolarCity, SpaceX
Robin Chase, Zipcar, GoLoco, Buzzcar
Peter Calthorpe, architect
Ferdinand Piëch, Volkswagen (ret.)
Lee Eng Lock, efficiency engineer
Anna Jaffe, Mobi
Michael Brylawski,VisionFleet
Sebastian Thrun, Google’s self-driving car
188.5610 from https://www.thehenryford.org/exhibits/pic/2004/July.asp
“I can’t wait to see what
happens when our industries merge.”

If a problem can’t be solved, enlarge it.
—attributed to Dwight Eisenhower

Volume Production of Electrified Carbon-Fiber Cars
VW XL1 2-seat plug-in hybrid2014 low-volume production
235 mpge, 1,759 lb0.9 L/100 km, 798 kg
BMW i3 4-seat battery-electric hatchback2013– midvolume production, $41–45k
124 mpg, 185+-mile range-extender option1.9 L/100 km, 300+-km range-extender option
Hypercar Revolution 5-seat hybrid SUV2000 virtual design (RMI with two Tier Ones)
67 mpg (gasoline) or 114 mpge (H2), 1,887 lb (–53%)3.6 L/100 km (gasoline) or 2.1 (H2), 857 kg (–53%)
Toyota 1/X 4-seat plug-in hybrid2007 concept car
131 mpge, 926 lb (–70%)1.8 L/100 km, 420 kg (–70%)
!

Batteries’ Costs Continue to Plummet
$0
$200
$400
$600
$800
$1,000
$1,200
$1,400
$1,600
2010 2012 2014 2016 2018 2020 2022 2024 2026 2028 2030 2032 2034 2036 2038 2040 2042 2044 2046 2048 2050
$/kW
h
US Energy InformationAdministration
Average expert projectionNavigant, Bloomberg New Energy Finance
GTM research
Tesla announcement
2012

!!
Tripled-Efficiency Trucks and Planes

Enabled by IT, multiple transportation methods provide a seamless, cheaper, more pleasant user experience

Autonomous vehicles: from PIGS to SEALs

From PIGS to SEALS

Transportation problems in China

From disorganized chaos to smooth travel experience

From superblock to walking distance
Graphics courtesy of Peter Calthorpe

0
5
10
15
20
25
2010 2015 2020 2025 2030 2035 2040 2045 2050
Mbb
l/d
despite 90% more automobility, 118% more trucking, 61% more flyingTransportation Without Oil
Oil Biofuels Electricity Hydrogen More-Productive Use Efficiency EIA Savings
Source: A.B. Lovins & RMI, Reinventing Fire (2011), Chelsea Green (White River Junction VT), www.rmi.org/reinventingfire.

“We must leave oilbefore it leaves us.”Fatih BirolChief EconomistInternational Energy Agency 2008
Executive Director

U.S. natural gas prices, 1985–2015: official forecasts vs. reality
0
2
4
6
8
10
1985 1990 1995 2000 2005 2010 2015 2020 2025 2030 2035 2040
Hen
ry H
ub p
rice
(201
1 $/
MC
F)
Year
85
86 87
89
90
91
92
9495
9697
98
00
02
03
04
05
07
08
0910
11
12
93
1314
01
99

Inde
x of
U.S
. Prim
ary
Ener
gy
Per D
olla
r of R
eal G
DP
Heresy HappensU.S. energy intensity
0
0.25
0.5
0.75
1
1.25
1975 1990 2005 2020 2035 2050
Government and Industry Forecasts, 1975
Reinventing Fire, 2011
Lovins, Foreign Affairs, Fall 1976
Actual

Lovins House, Old Snowmass, Colorado (1983)

U.S. buildings: 3–4× energy productivity worth 4× its cost(site energy intensities in kWh/m2-y; U.S. office median ~293)
284➝85 (–70%)2013 retrofit
~277➝173 (–38%)2010 retrofit
...➝108 (–63%) 2010–11 new
...➝≤50 (–83% to –85%)2015 new

80% energy savings in Hyderabad office, lower capex
Infosys DSB1 (2009): world’s largest side-by-side HVAC experimentRadiant side (11,152 m2): 66 kWh/m2-y (–80%), capex –9%
Courtesy of Peter Rumsey PE FASHRAE (Senior Advisor, RMI) and Rohan Parikh (Infosys, Bangalore)

Radical Efficiencymotors, pumps, and pipes

Saving Electricitymotors, pumps, and pipes
Less CapitalInvestmentsmaller equipment

Power Plant Power Grid Motor/Drivetrain Pump/Throttle Pipe-70% -9% -12% -55% -20%
100Energy units
5 %Delivered flow

Power Plant Power Grid Motor/Drivetrain Pump/Throttle Pipe-70% -9% -12% -55% -20%
Energy units
5 %Delivered flow
50

radically efficient industrial redesign


Netherlands: community connection

Utility revenues
Efficiency Distributed renewables
Storage (including EVs)
Flexible demand
New financial and business models
Regulatory shifts
Customer preferences
Integrative design
$

Utility revenues
Efficiency
Integrative design
$

Australia national electricity marketActual vs. forecast operational electricity demand
160
180
200
220
240
260
2004 2006 2008 2010 2012 2014 2016 2018 2020 2022 20240.8
1
1.2
1.4
1.6
1.8
Annu
al e
lect
ricity
use
(TW
h)
real
GDP
(201
1 Au
stra
lian
Dolla
rs)
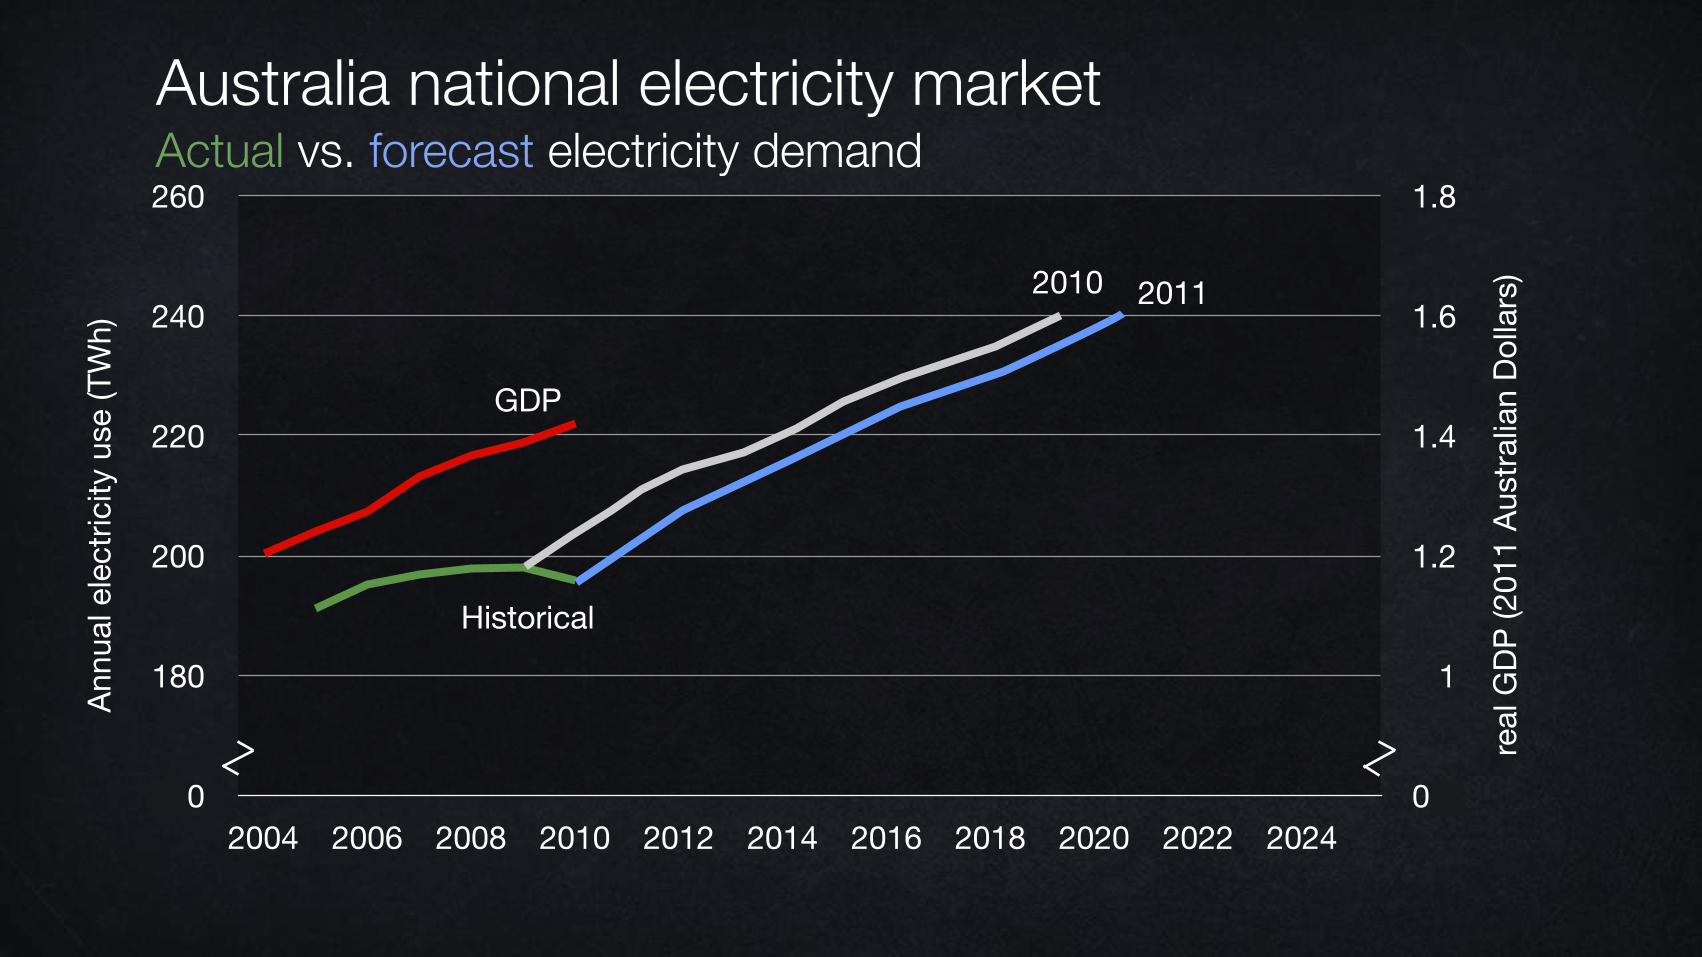
GDP
Historical
Source: M. Liebreich, keynote, Bloomberg New Energy Finance summit, April 2015; 2014–15

Actual vs. forecast electricity demand
160
180
200
220
240
260
2004 2006 2008 2010 2012 2014 2016 2018 2020 2022 20240.8
1
1.2
1.4
1.6
1.8
Annu
al e
lect
ricity
use
(TW
h)
real
GDP
(201
1 Au
stra
lian
Dolla
rs)
GDP
Historical
2010
Australia national electricity market

160
180
200
220
240
260
2004 2006 2008 2010 2012 2014 2016 2018 2020 2022 20240.8
1
1.2
1.4
1.6
1.8
Annu
al e
lect
ricity
use
(TW
h)
real
GDP
(201
1 Au
stra
lian
Dolla
rs)
GDP
Historical
2010
Australia national electricity marketActual vs. forecast electricity demand
160
180
200
220
240
260
2004 2006 2008 2010 2012 2014 2016 2018 2020 2022 20240.8
1
1.2
1.4
1.6
1.8
Annu
al e
lect
ricity
use
(TW
h)
real
GDP
(201
1 Au
stra
lian
Dolla
rs)
GDP
Historical
2010 2011
Australia national electricity marketActual vs. forecast electricity demand

160
180
200
220
240
260
2004 2006 2008 2010 2012 2014 2016 2018 2020 2022 20240.8
1
1.2
1.4
1.6
1.8
Annu
al e
lect
ricity
use
(TW
h)
real
GDP
(201
1 Au
stra
lian
Dolla
rs)
GDP
Historical
2010 2011
Australia national electricity marketActual vs. forecast electricity demand

160
180
200
220
240
260
2004 2006 2008 2010 2012 2014 2016 2018 2020 2022 20240.8
1
1.2
1.4
1.6
1.8
Annu
al e
lect
ricity
use
(TW
h)
real
GDP
(201
1 Au
stra
lian
Dolla
rs)
GDP
Historical
2012
2010 2011
Australia national electricity marketActual vs. forecast electricity demand

160
180
200
220
240
260
2004 2006 2008 2010 2012 2014 2016 2018 2020 2022 20240.8
1
1.2
1.4
1.6
1.8
Annu
al e
lect
ricity
use
(TW
h)
real
GDP
(201
1 Au
stra
lian
Dolla
rs)
GDP
Historical
2012
2010 2011
Australia national electricity marketActual vs. forecast electricity demand
160
180
200
220
240
260
2004 2006 2008 2010 2012 2014 2016 2018 2020 2022 20240.8
1
1.2
1.4
1.6
1.8
Annu
al e
lect
ricity
use
(TW
h)
real
GDP
(201
1 Au
stra
lian
Dolla
rs)
GDP
Historical
2012
2013
2010 2011
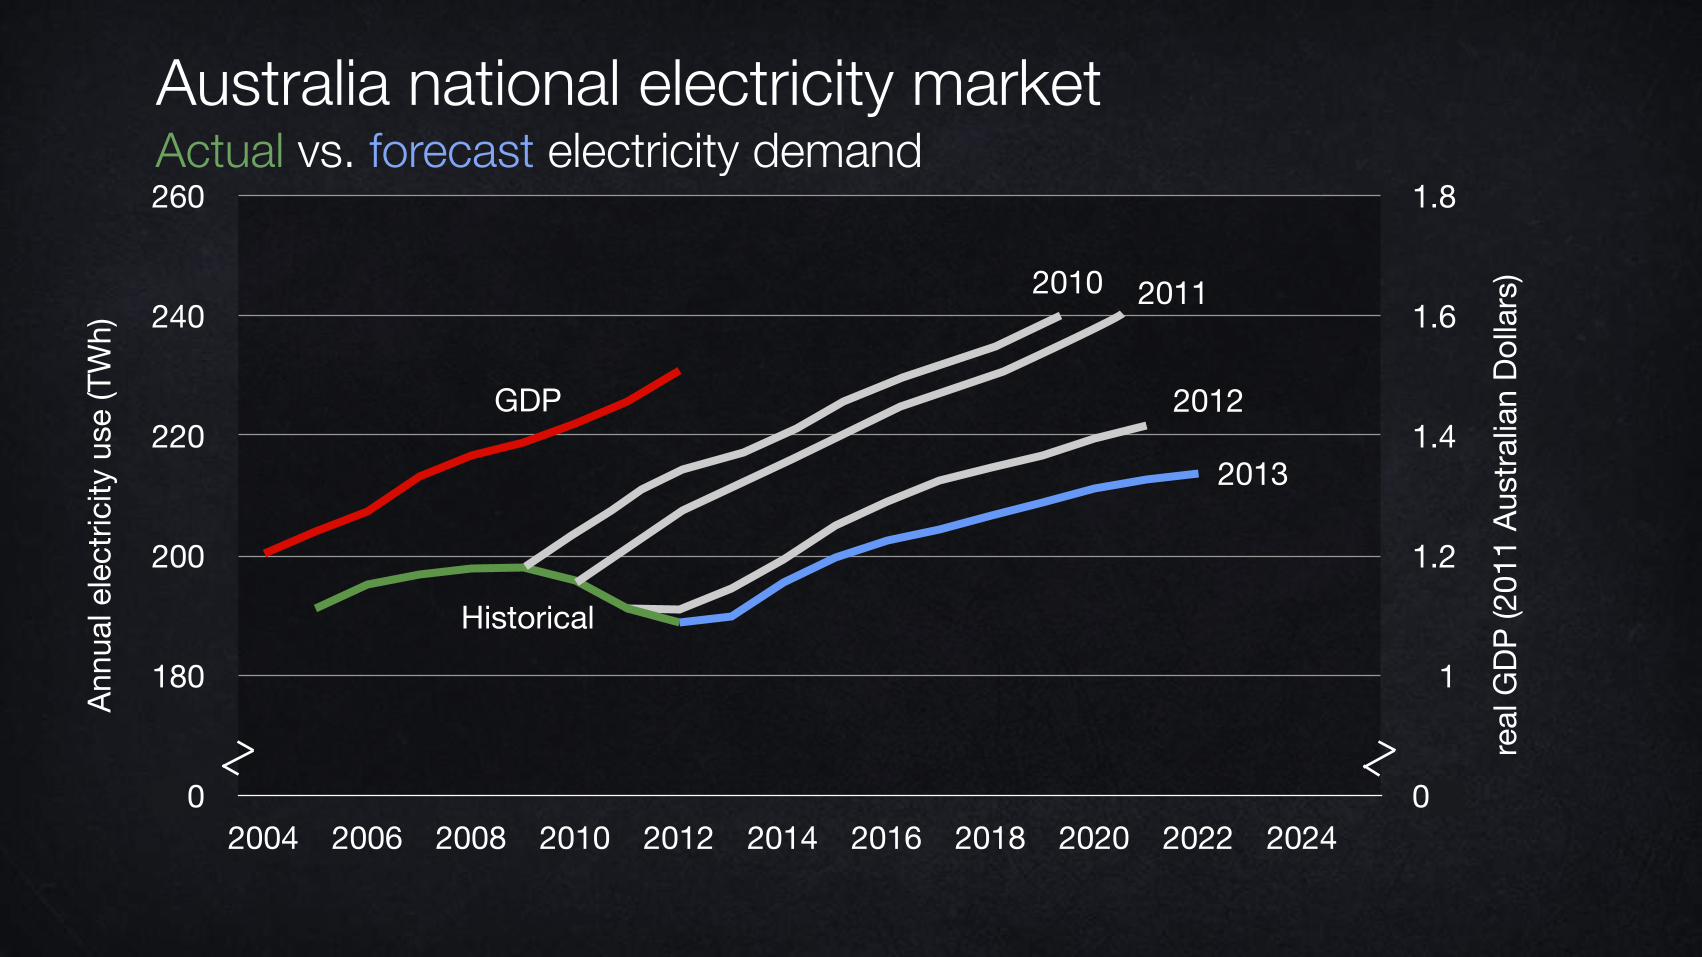
Australia national electricity marketActual vs. forecast electricity demand

160
180
200
220
240
260
2004 2006 2008 2010 2012 2014 2016 2018 2020 2022 20240.8
1
1.2
1.4
1.6
1.8
Annu
al e
lect
ricity
use
(TW
h)
real
GDP
(201
1 Au
stra
lian
Dolla
rs)
GDP
Historical
2012
2013
2010 2011
Australia national electricity marketActual vs. forecast electricity demand

160
180
200
220
240
260
2004 2006 2008 2010 2012 2014 2016 2018 2020 2022 20240.8
1
1.2
1.4
1.6
1.8
Annu
al e
lect
ricity
use
(TW
h)
real
GDP
(201
1 Au
stra
lian
Dolla
rs)
GDP
Historical
2012
2013
2014
2010 2011
Australia national electricity marketActual vs. forecast electricity demand

160
180
200
220
240
260
2004 2006 2008 2010 2012 2014 2016 2018 2020 2022 20240.8
1
1.2
1.4
1.6
1.8
Annu
al e
lect
ricity
use
(TW
h)
real
GDP
(201
1 Au
stra
lian
Dolla
rs)
GDP
Historical
2012
2013
2014
2010 2011
Australia national electricity marketActual vs. forecast electricity demand

160
180
200
220
240
260
2004 2006 2008 2010 2012 2014 2016 2018 2020 2022 20240.8
1
1.2
1.4
1.6
1.8
Annu
al e
lect
ricity
use
(TW
h)
real
GDP
(201
1 Au
stra
lian
Dolla
rs)
GDP
Historical
2012
2013
2014
2010 2011
Australia national electricity marketActual vs. forecast electricity demand

Utility revenues$ Distributed
renewables
Storage (including EVs)
Flexible demand

2002 2004 2006 2008 2010 2012 2014 2016
Renewable Energy’s Costs Continue to PlummetWind and photovoltaics: U.S. generation-weighted-average Power Purchase Agreement prices, by year of signing
U.S. wholesale power price
wind PPAs
utility-scale solar PPAs
250
200
150
100
50Pric
e (le
veliz
ed 2
014
$/M
Wh)
0

Cap
acity
add
ition
s (G
W)
Global power generation capacity additions, 2012–30
0
100
200
300
2012 2013 2015 2020 2025 2030
CoalGasOilNuclear
0
100
200
300
2012 2013 2015 2020 2025 2030
WindSolarHydroBiomass and wasteOther
10687 78
6452
39
Forecast
93 100
146
181
225
290Forecast
Source: Bloomberg New Energy Finance, redrawn from Michael Liebreich’s Summit Keynote, 7 April 2014

0 10 10 91 0Years
“Cathedral” Photovoltaics
0 10 20 30 40 50 60 70 8
0 GW-y1 GW-y3 GW-y6 GW-y10 GW-y15 GW-y21 GW-y28 GW-y36 GW-y45 GW-y0 GW-y3 GW-y1 GW-y2 GW-y

French windpower output, December 2011: forecasted one day ahead vs. actual
Variable Renewables Can Be Forecasted At Least as Accurately as Electricity Demand
Source: Bernard Chabot, 10 April 2013, Fig. 7, www.renewablesinternational.net/wind-power-statistics-by-the-hour/150/505/61845/, data from French TSO RTE
GW
0
0.5
1
1.5
2
2.5
3
3.5
4
4.5
5

!10% Downtime
!12% Downtime


Original loadLoad after efficiency
0
10
20
30
40
50
60
GW
Day
1 2 3 4 5 6 7
Choreographing Variable Renewable GenerationERCOT power pool, Texas summer week, 2050 (RMI hourly simulation)

Original loadLoad after efficiency
0
10
20
30
40
50
60
GW
Day
1 2 3 4 5 6 7
Choreographing Variable Renewable GenerationERCOT power pool, Texas summer week, 2050 (RMI hourly simulation)
Wind (37 GW)

Original loadLoad after efficiency
0
10
20
30
40
50
60
GW
Day
1 2 3 4 5 6 7
Choreographing Variable Renewable GenerationERCOT power pool, Texas summer week, 2050 (RMI hourly simulation)
Solar (25 GW)Wind (37 GW)

Original loadLoad after efficiency
0
10
20
30
40
50
60
GW
Day
1 2 3 4 5 6 7
Choreographing Variable Renewable GenerationERCOT power pool, Texas summer week, 2050 (RMI hourly simulation)
Solar (25 GW)Wind (37 GW)
Geothermal etc.

Original loadLoad after efficiency
0
10
20
30
40
50
60
GW
Day
1 2 3 4 5 6 7
Choreographing Variable Renewable GenerationERCOT power pool, Texas summer week, 2050 (RMI hourly simulation)
Solar (25 GW)Wind (37 GW)
Geothermal etc.Biomass/biogas

Original loadLoad after efficiency
0
10
20
30
40
50
60
GW
Day
1 2 3 4 5 6 7
Geothermal etc.
Choreographing Variable Renewable GenerationERCOT power pool, Texas summer week, 2050 (RMI hourly simulation)
HVAC ice/EV storageBiomass/biogas
Solar (25 GW)Wind (37 GW)

Original loadLoad after efficiency
0
10
20
30
40
50
60
GW
Day
1 2 3 4 5 6 7
Geothermal etc.
Choreographing Variable Renewable GenerationERCOT power pool, Texas summer week, 2050 (RMI hourly simulation)
HVAC ice/EV storageBiomass/biogas
Storage recovery
Solar (25 GW)Wind (37 GW)

Original loadLoad after efficiency
0
10
20
30
40
50
60
GW
Day
1 2 3 4 5 6 7
Geothermal etc.
Choreographing Variable Renewable GenerationERCOT power pool, Texas summer week, 2050 (RMI hourly simulation)
HVAC ice/EV storageBiomass/biogas
Storage recoveryDemand response
Solar (25 GW)Wind (37 GW)

Original loadLoad after efficiency
0
10
20
30
40
50
60
GW
Day
1 2 3 4 5 6 7
Geothermal etc.
Choreographing Variable Renewable GenerationERCOT power pool, Texas summer week, 2050 (RMI hourly simulation)
HVAC ice/EV storageBiomass/biogas
Storage recoveryDemand response
Solar (25 GW)Wind (37 GW)
Spilled power (~5%)

Europe, 2014 renewable % of total electricity consumed
Choreographing Variable Renewable Generation

27%Germany (2013 peak 70%)
≥55%Denmark (33% wind; 2013 windpower peak 136%—55% for all December)
50%Scotland
46%Spain (including 21% wind, 14% hydro, 5% solar)
64%Portugal (peak 100% in 2011; 70% for the whole first half of 2013, incl, 26% wind & 34% hydro; 17% in 2005)

1980
Denmark’s transition to distributed electricity, 1980–2012Central thermalOther generationWind turbines
2012
Source: Risø

Utility revenues
Customer preferences
$

Cascading blackouts threaten security

New Jersey, United States: resilience

Similar DifferentRisksCosts

India: air, reliable electricity, and development

Beijing, China: air

Germany: prosperity, climate, democracy
Stork near Schöneck, Frank Rumpenhorst/EPA, www.theguardian.com/environment/gallery/2014/may/02/the-beauty-of-windfarms-in-pictures
www.earthzine.org/wp-content/uploads/2013/08/solar-power.jpg
Stephen Glassman, https://stevenglassman.files.wordpress.com/2014/07/ballooning-10.jpg

Hawai‘i, United States: affordability and independence

Utility revenues$ Distributed
renewables
Storage (including EVs)
Flexible demand

Cheaper renewables and batteries change the gameIn Westchester, NY, 60% of residential consumption in the next decade could come more cheaply from PV
Source: RMI analysis “The Economics of Load Defection,” 2015

Load control + PVs = grid optional
0"
2"
4"
6"
8"
10"
12"
kW#
Uncontrolled: ~50% of solar PV production is sent to the grid, but if the utility doesn’t pay for that energy, how could customers respond?
EV-charging
!"!!!!
!2.00!!
!4.00!!
!6.00!!
!8.00!!
!10.00!!
!12.00!!
kW#
Unc!Load! Smart!AC! Smart!DHW! Smart!Dryer!
0"
2"
4"
6"
8"
10"
12"
kW#
Controlled: flexible load enables customers to consume >80% of solar PV production onsite. The utility loses nearly all its windfall and most of its ordinary revenue.
AC
DHW
Dryer
Other
Solar PVAC
DHW
Dryer
Other
Solar PVEV-charging
Source: RMI analysis “The Economics of Load Flexibility,” 2015

Utility revenues$
New financial and business models
Regulatory shifts

How can incumbents respond to the electricity shift?
http://recruitingdaily.com/wp-content/uploads/sites/6/2014/09/ostrich-in-sand.jpg

The Koch Attack on Solar EnergyBy THE EDITORIAL BOARDAPRIL 26, 2014
Solar Companies Sue Over New Rooftop Solar Tax In Arizona
No Free Sun for You! Why Arizona Wants to ‘Tax’ Solar PowerA new proposal would slap existing solar-paneled homeowners with a fee of up to $100 per month for the privilege of selling excess power back to the grid.
The world's dumbest idea: Taxing solar energy
Conservative group ALEC pushes stealth tax on homeowners who install solar panels


The German exampleSh
are
pric
e ($
/sha
re),
Euro
pean
Util
ities
Sha
re P
rice
50
70
90
110
130
150
2005 2006 2007 2008 2009 2010 2011 2012 2013 2014
Source: Morgan Stanley Capital International
European utilities lost $500
billion market cap in 6 years

The German example

重 能 :中源塑 国⾯面向2050年能源消费和⽣生产⾰革命路线图研究

Price > CostValue >

1900: where’s the first car?
Easter Parades on Fifth Avenue, New York, 13 years apart
1913: where’s the last horse?
Images: L, National Archive, www.archives.gov/research/american-cities/images/american-cities-101.jpg; R, shorpy.com/node/204. Inspiration: Tona Seba’s keynote lecture at AltCar, Santa Monica CA, 28 Oct 2014, http://tonyseba.com/keynote-at-altcar-expo-100-electric-transportation-100-solar-by-2030/
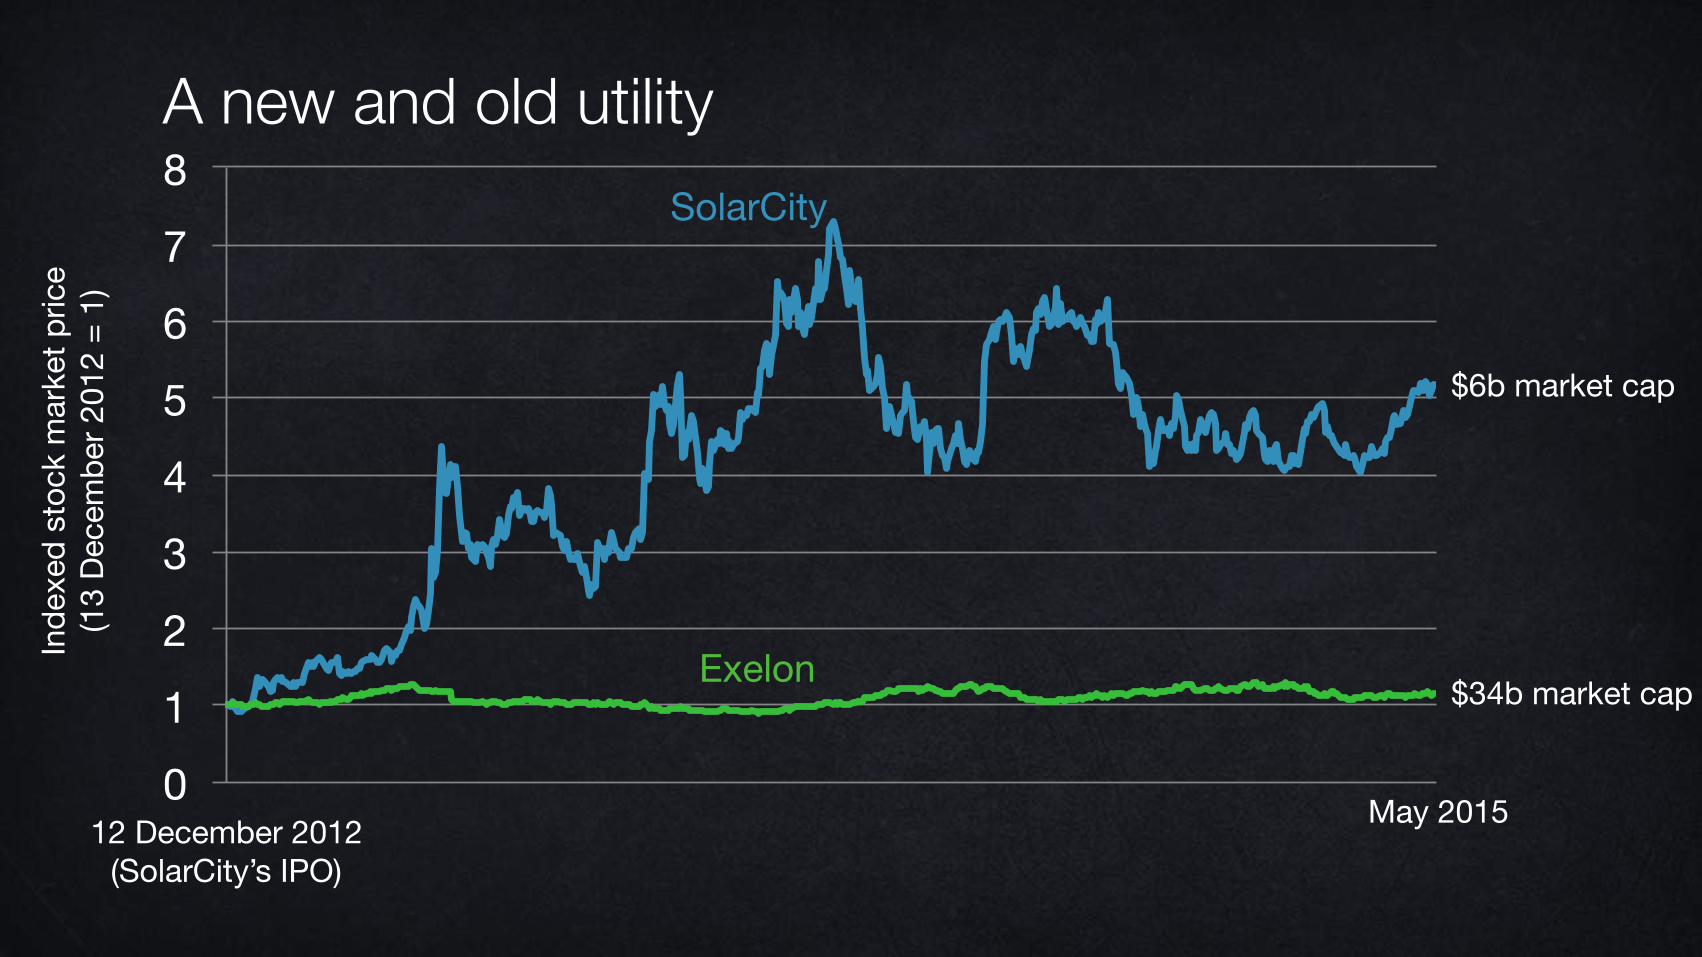
0 1 2 3 4 5 6 7 8
May 2015
SolarCity
Exelon
A new and old utilityIn
dexe
d st
ock
mar
ket p
rice
(13
Dece
mbe
r 201
2 =
1)
12 December 2012(SolarCity’s IPO)
$6b market cap
$34b market cap

29 June 2010(Tesla’s IPO)
May 2015
Tesla
0
2
4
6
8
10
12
14 A new and old automaker
General MotorsInde
xed
stoc
k m
arke
t pric
e(3
0 Ju
ne 2
010
= 1)
$30b market cap
$57b market cap
50 thousand cars per year
8 million cars per year

82
WHERE WOULD YOU INVEST YOUR MONEY?
OR

83
WHERE WOULD YOU INVEST YOUR MONEY?
OR

From the Age of Carbon to the Age of Silicon
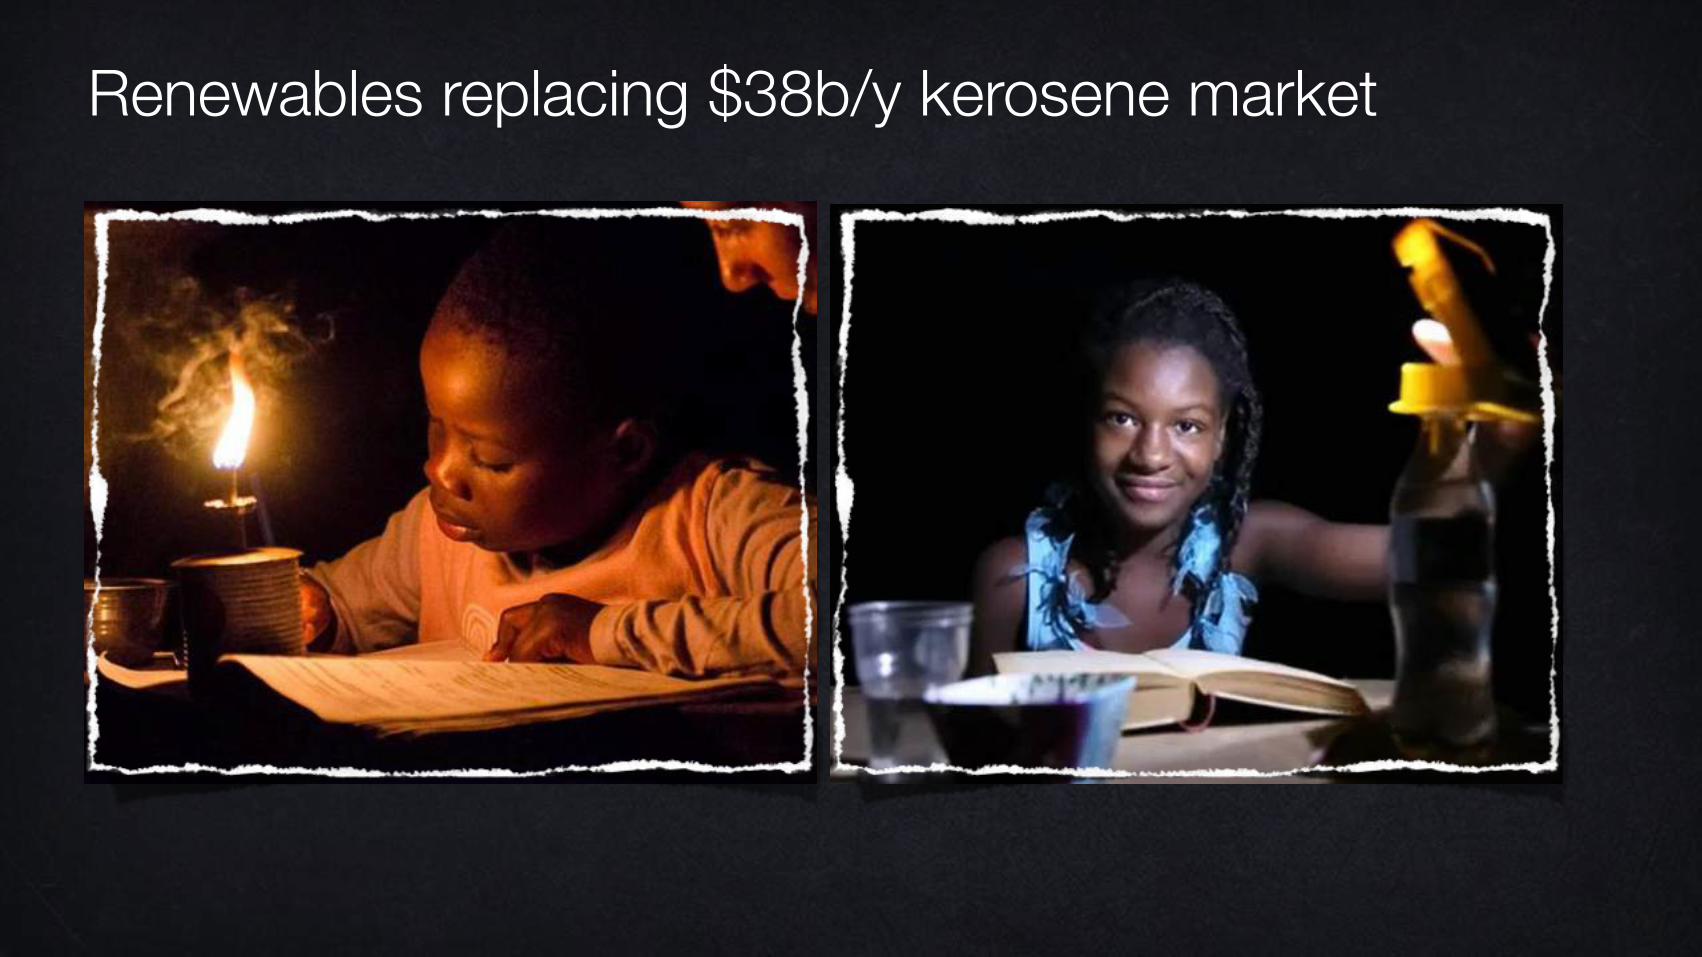
Renewables replacing $38b/y kerosene market

reinventingfire.com | www.rmi.org, [email protected] | Twitter @AmoryLovins
www.ted.com/talks/amory_lovins_a_50_year_plan_for_energy.html
www.rmi.org/Knowledge-Center/Library/2012-01_FarewellToFossilFuels
RO
CKY MOUNTAIN
INSTIT UTE
WAR R O O M
CARBON