yammer networks || 2018 - swoopanalytics.com · yammer networks are still growing and maturing....
TRANSCRIPT

SWOOP ANALYTICS' BENCHMARKING OF
Y A M M E R N E T W O R K S || 2 0 1 8
AUTHORS: Dr. Laurence Lock Lee, Chief Scient ist and Co-Founder
Sharon Dawson, Director , External Relat ionships & Communicat ions

2
EXECUTIVE SUMMARY 3
1 INTRODUCTION 7 1.1 Our 3rd Edition – What's New? 7 1.2 The Changing Environment for Enterprise Collaboration 8 1.3 Why Benchmarking? 9
2 SWOOP BENCHMARKING MEASURES 10 2.1 Alignment with Enterprise Social Network Maturity 10 2.2 Outline of Each Measure We Benchmark Against 12
3 BENCHMARKING RESULTS AND INSIGHTS 14 3.1 Demographics 14 3.2 Previous Year Comparison 15 3.3 Where are the biggest gaps between the best and worst? 16 3.4 Stepping your way up the ESN Maturity Curve 17 3.4.1 Platform Adoption 17 3.4.2 User Engagement 20 3.4.3 Connecting 21 3.4.4 Sharing 22 3.4.5 Problem Solving 23 3.4.6 Innovating 25 3.5 Summary 27
4 NETWORK PERFORMANCE LEADERS 28 4.1 Organizational Performance Comparisons 28 4.2 Who are our Collaboration Champions? 30 4.2.1 Hall & Wilcox 31 4.2.2 Real Foundations 33 4.2.3 Union for Reform Judaism (URJ) 35 4.2.4 Medibank 37 4.2.5 Bankwest 39 4.2.6 KFC 41 4.2.7 Telstra 43 4.2.8 Syngenta 45
5 CROSS ENTERPRISE GROUP BENCHMARKING 48 5.1 Curiosity Within Groups 48 5.2 Finding the 'Best Groups' Across All Enterprises 50 5.2.1 Summarized Benchmark Results 51 5.2.2 Curious Results when Mapping Curiosity to Group Performance 53 5.3 Champion Groups 55 5.3.1 Adopt and Embrace 55 5.3.2 Union of Reform Judaism: Working Out Loud Group 12 57 5.3.3 Blue Cross Blue Shield NC: New Media Group 58
6 TOWARDS A RICHER NETWORK PERFORMANCE MODEL 61 6.1 Three Factor Performance Model 62 6.2 Four Factor Online Cultrual Mapping Model 63 6.2.1 Sub-Cultures Aligned for Formal Organizational Structure 64 6.2.2 A Clash of Sub-Cultures? 65 6.2.3 Cultural Impacts of a Disruptional Change 65
7 FINAL WORDS 66
ABOUT THE AUTHORS 68
TABLE OF CONTENTS

3
SWOOP Analytics provides a unique online social networking platform which analyzes online interactions from Enterprise Social Networks (ESN) in real time. Through SWOOP, we have collected anonymized data from 74 organizations using Yammer over a six-month period. The organizations ranged in size from 100 to 161,000 users (average 16,700), across a full breadth of industry sectors and geographies. These 74 organizations represent more than 1.4 million users conducting over 12 million interactions during our six-month study period. This is the largest collaboration Yammer benchmarking analysis ever performed.
This third edition of SWOOP’s benchmarking studies makes use of our collaboration benchmarking framework, which positions specific measures against stages in the ESN maturity: Platform Adoption, User Engagement, Connecting, Sharing, Solving and Innovating.
Despite Yammer being considered the stalwart of Enterprise Social Networking platforms, we have found significant improvement across almost all of our collaboration indicators from previous years. Yammer networks are still growing and maturing. Even though we’ve seen many groups who have achieved excellent results, on average, we feel Yammer usage is still short of achieving a critical mass to influence the whole organization. The growth trajectory is positive, however, and we are confident that this will be achieved for the majority of Yammer networks. Some of our benchmarking partners have been there from the start, a decade ago. Many more are new to using Yammer, provided as part of their O365 subscription. There is still much to be learned from those that have been there before.
Some Yammer groups formed as teams will potentially be moving to the Microsoft Teams platform, which we estimate, based on our analysis, represents some 10-15% of the active Yammer groups. This effect may be a plus for Yammer, leading to a stronger focus on important enterprise-wide challenges such as innovation, competency development through social learning, enterprise knowledge sharing, employee engagement, organizational culture transitions, policy development and enterprise help forums.
This year we have introduced the SWOOP Awards for achieving outstanding results in the benchmarking.
The awards have been made to the leading organizations in each of the following categories:
• 100-1000 employees• 1000-5000 employees• 5000+ employees
Their stories highlight best practices and in this report we’ve shared examples of what has worked for these organizations. Common themes to success for all these leaders include;
» Making Yammer part of their everyday work.
» A community manager to facilitate Yammer and engage staff.
» Engagement from senior leaders and executives, ensuring front line staff feel connected to their leaders.
» An emphasis on working out loud so everyone in the organization can benefit from conversations and knowledge sharing, leading to innovation.
» Engaging with what staff are passionate about, often in the form of social groups.
EXECUTIVE SUMMARY

4
2018 BENCHMARKING, KEY INSIGHTS
The key insights from this year’s benchmarking report:
» Yammer network performance is still on the upward trajectory.
Eight of the nine performance metrics that are comparable with previous years showed stronger performance by, on average, an impressive 30%.
» Despite the improved performance, Yammer usage is still falling short of an adoption rate required to impact whole organizations.
An estimated 69% of employees are exposed to Yammer by at least reading messages but only 38% were contributing. Those who actively contribute more than once every two weeks make up 15%. Yammer is a social network whose performance is dictated by a strong ‘core’ of well-connected staff, so 100% of people posting messages is never a reasonable goal. We suggest a core of 25 – 30% active participants, containing a healthy sprinkling of senior management participation, could be sufficient. We estimate just under 30% of our benchmarking partners are currently operating at this level.
» The ‘big mover’ was Reciprocity, which was a 66% improvement on 2017.
As our measure of cohesion, it suggests that many of our benchmarking partners have managed to progress beyond the social media maturity phase to the social networking phase, which prioritizes people connections over content consumption. The other big improvement is in the reduction of the proportion of Broadcasters by 56%, reinforcing the maturation beyond simple content sharing.
» The new Curiosity Index (proportion of Posts and Replies that include questions) averaged 14%, but with a large range from less than 3% to more than 30%.
At the Enterprise level we found that Curiosity was positively correlated with the percentage of Engager personas and Diversity (participation in multiple groups). This bodes well for breakthrough innovation success; which requires all three of these indicators1.
» While we have seen a big improvement in reducing the number of Broadcasters, the Broadcaster measure was where the gap between the best and the worst was largest.
We therefore suggest those enterprises new to Yammer should monitor this measure closely. Even if operating at the social media phase, Broadcasters are likely adding little value.
» At the group level we found the high performing smaller groups asked more questions; perhaps demonstrating more agile working.
However, as the group sizes grew, better performance was associated with asking less questions. We suggest this is a reflection of larger groups acting more as information sharing forums than the co-operative and cohesive behaviors favored by our performance criteria.
1 See http://www.optimice.com.au/upload/Optimice_3Es_of_Innovation.pdf for a networking perspective on innovation

5
WHAT HIGH PERFORMERS DO
We’ve enjoyed learning from our high-performing benchmarking partners what they believe has
contributed most to their success. In summary, our leaders:
» Make Yammer a part of their day to day work culture.
For example, working out loud groups like Real Foundations’ “#What I’m Doing Today”; Adopt & Embrace's “What I am Working on”; URJ’s “WOL Groups”. Others have aligned formal business units with Yammer groups, like KFC’s restaurants and Blue Cross Blue Shield NC’s New Media group.
» Have dedicated community management resources.
The community managers at Bankwest, URJ and Blue Cross Blue Shield NC emphasized the importance of “facilitation” over “management” in this role.
» Know the importance of authentic engagement from executives and senior leaders.
It allows front line workers to feel connected to their leaders and build trust. The most discussed topic in the nine years of using Yammer at Telstra, a network of 55,000 users, was marriage equality. Yammer became a safe place to have views heard thanks to support from the CEO and senior leaders.
» Have a mix of knowledge-sharing collaborative groups and larger information sharing forums.
The smaller knowledge sharing groups are more curious, with a higher proportion of their posts containing questions. Real Foundations and Hall & Wilcox declared ‘Knowledge Sharing’ as the overriding mission for their Yammer network and achieved this through a mix of small and larger groups.
» Encourage groups to engage across the full membership, more so than over-relying on a small core of leaders.
The top performers employed a host of innovative techniques to broadly engage staff on Yammer. Yam Jams, competitions, CEO chats,“High Five” recognitions and fun selfie posts are just some examples.
» Encourage their membership to explore and become active in multiple groups; in this way building on their diversity of experiences.
Our leaders don’t stress over the large number of inactive Yammer groups that are typically formed. Providing the opportunity for staff to explore a breadth of experiences, and allowing groups to thrive or die organically, is seen as appropriate.
» Are innovative about the way they use Yammer.
Bankwest’s tracking of engagement around corporate messaging using #tags; URJ facilitating working out loud circles to build diversity across their network; Hall & Wilcox supporting staff in the field with real-time advice; Blue Cross Blue Shield NC’s coaching senior executives on exposing their ‘full selves’ online, are just a few examples.
» Engaging with what staff are passionate about, often this is a social group.
Bankwest boasts one of the highest participation rates on Yammer, something it attributes to encouraging staff to share pet photos and restaurant reviews. Yammer was the forum for discussion at Telstra about the same-sex marriage vote in Australia and URJ responded to the tragic Florida school shootings by marshalling their youth network to join the protest march on Washington DC on Yammer.

6
LIVING THE INNER/OUTER LOOP:
How much of Yammer’s lunch will
Microsoft Teams eat?
When Microsoft acquired Yammer in 2012, the Enterprise collaboration space was open for Yammer to dominate, with an expectation of 100% adoption being common. Today we see the market split into Enterprise-wide and Team-based collaboration; something Microsoft refers to as the Inner and Outer Loop collaboration.
Our benchmarking tells us the adoption of Yammer in organizations still sits below the 40% interactive users mark, with a high of 75%. While we would all like to aspire to the 100% target, we believe this is not a requirement for a Yammer network to be successful. We discuss this aspect in more detail in section 3.3.1. The ‘Outer Loop’ is still seen as a ‘discretionary participation’ option for most staff.
We would anticipate the Inner Loop Teams product should achieve a higher adoption rate, as for many, participation may not be discretionary at all. As we begin to move SWOOP into these new ‘Inner Loop’ markets, we anticipate our benchmarking of Outer Loop, Inner Loop and interactions between the two will be able to provide unique insights into how that balance can best drive enterprise value through effective collaboration at all levels.
INTENDED READERSHIP
We anticipate those responsible for the
successful implementation of the Yammer
platform will gain most
from this report.
» The Community Manager is provided with a structured approach, supported by analytics, to shepherd groups and communities towards achieving their true potential.
» Internal Communications Managers can learn how to move beyond simply broadcasting corporate messages to engaging with their audience through interactive conversation.
» The Human Resources Executive will find measures that comfortably fit within their scope of interests in ‘people analytics’.
» Senior Line Managers, CEO, COO and Functional Leads will find familiarity with the benchmarking approach from similar experiences in their own lines of work. They should find comfort that, as disruptive that an Enterprise Social Network can be to traditional lines of communication, the performance improvement techniques devised from decades of quality management experience are still critical to business success.
» Finally, the Yammer group leaders themselves will see how they compare with groups of similar sizes, across more than 3,000 groups selected from our benchmark data base.

7
1 INTRODUCTION
1.1 Our 3rd Edition – What’s New?
We are excited to be able to present this 3rd Edition of our Yammer Benchmarking results; each year gaining new and valuable insights to share with the industry at large. In 2016 we started with just 16 organizations; but even at that time, it was unique for its breadth and depth of analyses into how organizations really collaborate. In 2017 we grew that sample to 57 organizations, with a much greater coverage of organizations from all sectors and geographies. In 2018 we have invested in bringing our benchmarking activities and our SWOOP product into alignment and hosted on the same platform. This provides us with a major new capability to access the most up to date data and undertake ad hoc research and custom benchmarking exercises. It also enables us to dig deeper into the data to analyze collaboration performance.
In this report, for the first time, we have benchmarked Yammer groups across a majority of the benchmarked Yammer sites. We have added new sites but also rationalized some of our older sites to come up with a sample of 74 organizations, ranging in size from 100 to 161,000 users (average 16,700), across a full breadth of industry sectors and geographies. These 74 organizations represent more than 1.4 million users conducting over 12 million interactions during our six-month study period.
We will report on the key SWOOP indicators. Our intent is to make it easy for SWOOP users to identify the benchmarking measures directly with their SWOOP dashboards. Where it is appropriate, we will be commentating on movements in the measures for 2018 compared with previous years.
We are celebrating the performances of our benchmark leaders, both at the enterprise and groups level. All of our benchmarking analyses are presented using anonymised data; a condition we agree on with our benchmarking partners. For our leaders, we have reached out to them and interviewed them to gain specific insights into practices they have undertaken to help them achieve their success. With their permission, we have been able to share these best practices with you in this report. After all, that is why we do benchmarking; to find out what works and to share with everyone else, for the benefit of all.
How do we determine our leaders? The process has evolved a little this year. In previous years we have drawn from academic research that has identified the key performance indicators for a successful network, being its cohesion and diversity and how these indicators are maximised together. We have again relied most heavily on these two attributes:
» Reciprocity (for cohesion)2 and
» Diversity Index (for diversity).
This year we have also added the proportion of Interactive Users and overall activity levels as we wanted to find the organizations that were demonstrating the right collaborative behaviors but were also high frequency users.
One of our newest measures, the Curiosity Index, which measures the degree to which people ask questions, has also been used this year, for information purposes. Our rationale is that successful organizations should always be willing to question and challenge the status quo. They should also be looking to create new value through innovation (the highest stage in our maturity model – see section 2.1). Serendipitously, Harvard Professor Francesca Gino’s recent HBR article on “The Business Case for Curiosity3” agrees, suggesting that the most effective leaders look for ways to nurture their employees’ curiosity to fuel learning and discovery.
2 Reciprocity is at times referred to as “Two-Way Relationships” in the report, being the terminology used on the SWOOP dashboard. Cohesion (and trust for that matter) are seen as a consequence of Reciprocity.
3 https://hbr.org/2018/09/curiosity

8
1.2 The Changing Environment for Enterprise Collaboration
Yammer is celebrating its 10th birthday this year, and six years since it was acquired by Microsoft. In ESN terms, this puts Yammer in the ‘elder statesman’ category. As an elder statesman, Yammer is being challenged by newer market entrants. But Yammer remains a stalwart in its class; with a mountain of experiences and lessons, ready to be shared within the very substantial user base that Office365 represents.
The collaboration market has now clearly separated into Enterprise-level and Team-level collaboration tools. Microsoft Teams was launched in 2017 in reaction to the success of team-focused Slack (and recently merged Hipchat)4. Workplace by Facebook launched in 2016 and is a direct competitor to Yammer and Microsoft Teams. It is split into the same shared discussion vs private chat separation. Slack is moving into the Yammer space with Slack Enterprise Grid connecting various Slack sites. While the brand is the same, the software partitioning between Enterprise and Teams is in place for all.
Another natural separation is inside versus outside the enterprise with ‘customer collaboration’ tools forming a separate collaboration market sector.
Functionally, there is much overlap between the different layers of tools. While Yammer has always had the capability to support external customer networks and team level chat, the market has spoken and Yammer will be largely constrained to cross-enterprise collaboration, foregoing the team space to Microsoft Teams and potentially Yammer External Networks to customer collaboration tools, like Microsoft’s LinkedIn acquisition, which together with Microsoft Dynamics represent a powerful combination for external communities.
While this might be seen as a retreat from earlier aspirations, we believe Yammer has a clear role to play. While some commentators are predicting a Microsoft Teams takeover5, we believe a natural order now exists which prevents any single tool from becoming all encompassing. Conveniently, Microsoft last year came out with its “Inner Loop – Outer Loop” framework6 to describe how Yammer, Teams and Email effectively co-exist.
Figure 1 - Collaborating Your Way to Customer Success
TEAMS(Microsoft Teams)
NETWORKS(Yammer)
CUSTOMER COMMUNITIES
(LinkedIn / Microsoft Dynamics)
4 https://www.cmswire.com/digital-workplace/slack-and-microsoft-teams-is-enterprise-collaboration-a-two-horse-race/?utm_source=cmswire.com&utm_medium=email&utm_campaign=cm&utm_content=nl-daily-180808&mkt_tok=eyJpIjoiTXpWaVl6bGxZV0k0WVRjMCIsInQiOiJ1M
5 https://en.share-gate.com/blog/microsoft-teams-vs-yammer
6 https://blogs.technet.microsoft.com/cloudyhappypeople/2017/09/28/now-it-makes-sense-microsofts-collaboration-story-in-a-single-slide/

9
We are very supportive of this characterization. Our earlier research on multi-channel collaboration7, described in our 2017 benchmarking report8, found organizations naturally gravitate towards particular tools for different types of collaborations. And in Yammer’s case, it played a clear role in horizontal and vertical connections for the whole enterprise; more so than email, chat and process/project management tools. We can anticipate the activity level will diminish as we move from the ‘here and now’ Teams and Email collaboration, to the ‘explore and develop’ Yammer collaboration and then the ‘engaging the customer’ Dynamics/LinkedIn collaborations. But activity is not always correlated with success; as we have demonstrated previously9. It’s about finding the ‘right’ amount and type of activity that really matters.
Within this reduced, but now more focused scope, we are in a position to identify realistic goals and aspirations for Yammer. We believe Yammer will still be the ‘go to’ tool in the Microsoft Office365 toolset for innovation, competency development, employee engagement, enterprise knowledge sharing, organizational culture transitions, policy development and enterprise help forums.
We believe collaboration analytics will provide important guidance to organizations and individuals as to how to best synthesize the different levels of collaboration tools, to maximize enterprise value overall.
1.3 Why Benchmarking?
When organizations start out with a tool like Yammer, the Yammer leaders will often come to us saying their executives are asking the ‘ROI’ question. How can they best respond? Without resorting to an auditable ROI, organizations can still judge how they are performing against like organizations to assess their relative performance. And let’s face it, this is what most executives really want to know. Are we better than our competition? This is not something new. The ‘quality movement’ has relied on benchmarking to assess organizational progress for decades. The popular business improvement method Six Sigma identifies the benefits of Benchmarking10 as:
• Providing a focus on best practices;• Strives for continuous improvement;• Enable partnering to share information;• Needed to maintain a competitive edge; and• Facilitates adaptation based on customer needs after examination of the best.
Benchmarking services11 are widely available across many organizational disciplines and industry sectors for precisely this reason. You do not have to be the ‘best’ in the world at everything but you do want to compare favorably to those organizations that matter most to you e.g. your closest competitors or other organizations you admire. To date, these benchmarking services do not extend to ESNs. And as we have stated earlier, it’s not only about numbers, but the stories about how the new practices are making a real difference; and how these ‘best’ practices can be shared for the benefit of all.
What we provide here is the world’s largest benchmarking analysis of Yammer network performance. The dimensions for comparisons are the result of more than a decade of applied research and development,
7 http://www.swoopanalytics.com/why-90-of-organisations-would-not-survive-a-digital-disruption/
8 https://en.share-gate.com/blog/microsoft-teams-vs-yammer
9 https://www.cmswire.com/social-business/the-smoke-and-mirrors-of-enterprise-social-networking-metrics/
10 https://www.isixsigma.com/methodology/benchmarking/understanding-purpose-and-use-benchmarking/
11 https://www.apqc.org/benchmarking
focused specifically on social networking - enabled collaborative performance. In this third edition we have benchmarked 74 organizations, ranging in size from 100 to 161,000 users (average 16,700), across a full breadth of industry sectors and geographies, over an extended six-month study period.

10
2 SWOOP BENCHMARKING MEASURES
2.1 Alignment with Enterprise Social Network Maturity
The SWOOP dashboard measures according to an established ESN maturity framework12, and full description of the maturity framework, can be found in our ebook13.
The maturity framework identifies six stages of evolution of ESN exploitation, from the initial stage of encouraging staff to log onto the platform through to the use of the ESN to facilitate a fully innovating, adaptive and responsive organization. Using SWOOP, we can trace the journey from first digital experience, through to online collaboration champion, using Yammer interaction data.
12 We acknowledge the contribution of prior work from Siemens and Simon Terry to this maturity framework.
13 http://www.swoopanalytics.com/products/#ebook
Figure 2 - ESN Maturity Model
UserEngagement
ObserversActive Users
Influencer Risk% Engagers% Catalysts% Responders
Threads / UserReplies / PostPublic Messages
Activity Per UserRecognition% Broadcaster
ReciprocityResponse Rate
DiversityCuriosity
% Public Messages
Connecting
Sharing
Solving
Innovating
PlatformAdoption
SOCIAL MEDIA
BENCHMARKS BY MATURITY LEVEL
SOCIAL NETWORKING
JOB FULFILMENT
Benchmarks by Maturity Level

11
The above graphic positions each SWOOP measure included in this benchmarking report against the stage of ESN maturity14 it is most related to. Two important transitions are identified that require a significant change in the way both individuals and organizations are thinking and acting:
1. Social Media to Social Networking
The first occurs when an organization becomes less reliant on social media to attract staff (User Engagement Stage) and more cognizant of the need for staff to connect and build relationships. We call this the ‘Social Media’ to ‘Social Networking’ transition.
2. Social Networking to Job Fulfilment
The second important transition point occurs when we move from happily connecting and sharing knowledge to acting on that shared knowledge to create tangible value. We call this the ‘Social Networking’ to ‘Job Fulfilment’ transition. This is where the rubber hits the road in terms of tangible business results (and ROI). Everyone in the organization has a job to do. Increasingly, these jobs are becoming interdependent on others. When the job is done, be it a difficult problem solved, or a new opportunity grasped, tangible enterprise value has been achieved. Relationships can be leveraged to more effectively share tacit knowledge, problem solve and ultimately create new value through innovation.
When assessing each benchmarking indicator, it is helpful to identify them with the maturity stage for which they are most indicative.
14 http://www.swoopanalytics.com/blog/enterprise-collaboration-maturity-frameworks/

12
2.2 Outline of Each Measure We Benchmark Against
The following table identifies the measures we have included in the benchmarking study and how each SWOOP measure should be interpreted in relation to the ESN maturity stage.
InterpretationSWOOP Benchmark
STAGE 1: PLATFORM ADOPTIONPlatform adoption is the initial stage when an ESN is newly launched and the key motivation is attracting staff to its use.
The number of people who have been given access to Yammer i.e. the size of the potential participating membership.
Number of Users
On launching a new ESN platform, this should be the first measure to monitor. Basically, how many of the eligible staff have logged in and taken a tangible action e.g. made a post or like etc. Excludes ‘reading’.
Number of Interactive Users
Measures the proportion of Observers. Observers are classified as those that have been interactive less than once every two weeks. Organizations that score well on this measure have a low proportion of Observers.
Observers
STAGE 2: USER ENGAGEMENT (around content)Initial user engagement is through the content of social media e.g. moving corporate news or announcements to the ESN to facilitate active feedback.
Measures the proportion of Broadcasters. Broadcasters is one of the five SWOOP personas. The Broadcaster is characterised by posting messages but isn’t getting many replies or likes. The lower the score, the better.
Broadcasters
Recognition is the percentage of all interactions that are ‘likes’ or ‘mentions’, and it is a measure of ‘social recognition’. In the social media context, a ‘like’ or a ‘mention’ is usually an indicator of positive feedback on posted content.
Recognition
Measures the number of activities per person (post, reply and like). This simple ratio can provide a quick assessment of engagement with the platform. A high score indicates that activity isn’t being dominated by a selected few.
Activity/User
STAGE 3: CONNECTINGThe Connection stage marks the important transition from engaging with the platform and content, to engaging with people. This is an important step in the move toward effective collaboration.
These are all SWOOP personas and depending on the context, individuals can play positive roles with any of them. That said, we prefer to see a high proportion of Engagers, who are people who connect others. Catalysts are also important because of the way they drive activity and connections. Responders are seen as the ‘care-givers’ and are key to sustaining communities and groups.
Distribution of:• Engagers• Catalysts• Responders• Broadcasters
This measures how reliant the organization is on a selected few power networkers. Networks will always have a core and a periphery, but if that core becomes too small, the network becomes at risk, should certain key players leave the network. A lower Influencer Risk score means less risk or higher resilience to the loss of core members.
Influencer Risk*
Table 1 - Maturity Model Measures

13
InterpretationSWOOP Benchmark
STAGE 4: SHARINGAt this stage the organization is actively sharing knowledge. This may be in the form of explicit content, or in the form of tacit knowledge, shared through rich and regular conversations.
Measures the percentage of messages that have been posted in public groups. This is an indicator of overall transparency. In general, we would like to see this score to be high, indicating a maximum opportunity for broader knowledge sharing.
Public Messages
This simple ratio is an indicator of how conversational a network has become. Once the volume of Replies exceeds the number of Posts, we can be confident that conversations facilitating tacit knowledge sharing are starting to happen.
Replies/Post
Discussion threads per user is used to assess the breadth with which online discussions are pervading the organization. We can infer that if the majority of participants are actively involved in conversation threads, then broad based knowledge sharing is happening.
Threads Per User
STAGE 5: SOLVINGProblem solving marks another important transition from knowledge sharing to action. Tangible benefits only arise from positive actions i.e. job fulfilment. Organizations must reach this stage of maturity if they are to demonstrate real tangible value.
The response rate is an indicator of both how much an organization is sharing its problems in the form of questions, and then how much people are responding to them. It is one of the most direct measures of value available. The measure only includes written replies i.e. excludes likes, mentions etc., to emphasize the importance of conversation.
Response Rate
This measures the degree to which connections are reciprocated, i.e. A response to B, and B to A (replies, mentions or likes). We know that high reciprocity leads to higher trust and therefore a higher potential for positive actions. On the SWOOP platform this is called “Two-Way Relationships”.
Reciprocity
STAGE 6: INNOVATINGThis stage is placed as the final maturity stage, as it is an indication that an organization is creating new value. It is also something that most organizations struggle with.
Successful innovation is regularly linked to diversity in an organization. Diversity can be measured across many dimensions e.g. cross business unit, geography, gender etc. In this benchmark we use the diversity across Yammer group activity. An individual with high diversity would be equally active across a large range of groups.
Diversity
Without questions, there is no change. This measure identifies the proportion of posts and replies that are framed as questions. We infer that organizations with relatively high curiosity are also likely to be more adaptive and innovative.
Curiosity
It is important to appreciate that while this report is assessing Enterprise level performance against these maturity stages; inside the Enterprise, there will be different groups at different stages of maturity. More on this later.

14
3 BENCHMARKING RESULTS & INSIGHTS
3.1 Demographics
Our sample is formed from organizations with a minimum of 100 active participants.
Using the Global Industry Classification Standard (GICS), we can see the sample has representation across all sectors. A high proportion of the benchmarked organizations are global in their operations. Headquarters are located in the United States, United Kingdom, Canada, Switzerland, Australia, Japan, India, Mexico and Sweden.
Participants by GICS Sector
Figure 3 - GICS Industry Segmentation

15
3.2 Previous Year Comparison
As we indicated, the majority of comparable measures compared with results from our 2017 report have shown a healthy improvement. The following table provides a year on year comparison:
*Lower score is better
Academic research has identified cohesion as one of the key performance indicators for a successful network, and since Reciprocity is our chosen proxy for cohesion, it is therefore gratifying to find its improvement at the top of the table.
Seeing a reduction in the number of Broadcasters is equally gratifying. However, this measure also shows the greatest variation amongst our benchmarking partners – see section 3.3.
The Activity/User measure indicates how the Yammer activity is increasingly being shared across all users, and like the other measures is an indication of a stronger ESN maturity.
Table 2 - Year on Year Comparison
% Movement20182017Measure
66%24.214.6Reciprocity
56%818Broadcasters*
38%2921Activity/User
32%2.712.05Threads / User
28%1.721.34Reply/post
18%42.536Diversity
15%4640Response rate
13%5968Observers*
9%6156Recognition
-8%6874Public Messages

16
3.3 Where are the biggest gaps between the best and worst?
Benchmarking offers the opportunity to learn from the measured highest performing organizations. Areas of greatest opportunity for improvement exist where there is a large range of scores. Where large variances exist in a key maturity dimension, the strength of the opportunity is amplified. The following graphic plots the average variances for each of the benchmarked dimensions:
As the chart shows, reducing the proportion of Broadcasters is the biggest opportunity for improvement.
It appears many of the new entries into our benchmarking are newcomers to Yammer and still operating at the ‘Social Media’ phase of maturity. These organizations are still looking to engage staff through posting content; and in this case, not very engaging content. The Broadcaster persona describes individuals whose posts attract little or no reaction. Organizations with a high proportion of Broadcasters are not making effective use of the Yammer platform.
The Threads/User measure (not yet on the SWOOP dashboard) measures how well discussions are spread across the user base. A low score indicates discussions are only occurring within a limited number of cliques. The Activity/Active User measure is a generic ‘adoption’ measure. Similar to the Threads/User measure, it looks to see how pervasive the engagement is across those that have already been active at some stage.
We note that the key performance indicator of Two-Way Relationships (reciprocity) has moved down the list since 2016, indicating that for this dimension, the gap between the best and worst performing organizations is narrowing.
Figure 4 - Improvement Potential from Benchmarking
Relative Variance - Scope for Improvement

17
3.4 Stepping Your Way Up the ESN Maturity Curve
We structure our benchmarking reports around the ESN Maturity framework. We will report on the benchmarking results as they relate to each maturity stage. We also suggest realistic targets for each metric, based on what has already been achieved by our best practice leaders.
Figure 5 - Average Yammer Adoption
have only ‘read’on Yammer
31%haven’t logged
on to Yammer
31%
actively interacton Yammer
15%modestly interacton Yammer
23%
Average Yammer Adoption
3.4.1 PLATFORM ADOPTION
At this very early stage, we are most concerned with getting staff to experience the Yammer platform. One obvious measure is to identify the percentage of staff that has logged on. This will be a meaningful measure for many but for some, the figures could be skewed by policy decisions made about how the platform is initially introduced. Some choose an incremental approach, where only a proportion of staff is invited in. Others will have a policy to ensure everyone is logged in, even if they are not real candidates for early participation. Even after someone has logged in, if they are not active i.e. potentially just reading content, the data can be somewhat unreliable.
Maintaining the user accounts, taking into account the comings and goings of staff, is also often problematic. In previous years we have avoided this situation by only analyzing interactive users that we could measure reliably. However, many of our clients at the early stage of Yammer usage are keen to know what percentage of all staff log into Yammer.
Therefore, we have tried to make a best effort to determine the average number of staff registered for Yammer use. For the most part, we have chosen
to use the average registered users for the most recent 30-day period.
‘Interactive users’ are defined as those that have made an active contribution e.g. pushed the ‘like’ button or more. The average performance is 38% with a best performance of 76%.
Range 6% - 76%
Average %Interactive Users: 38%We have conducted some analysis of individual organizations using the Yammer ‘Seen By’ counts, which suggests that for those that have not become interactive on Yammer, about half of those have at least read or seen something on Yammer.
We can therefore estimate the adoption characteristics for Yammer on average, and demonstrated best practice:

18
On the surface this looks like a pretty modest result. Best practice performance was just over 75% interactive users, so there is a significant gap between average performance and what at least one organization has been able to achieve. High adoption figures are more easily achieved for the smaller organizations, but one organization with over 3,000 staff was still able to achieve a 64% interactive user rate.
What should we expect from a Yammer platform in terms of active participation across the whole enterprise?
Naïve expectations will be 100% active participation for Yammer. In this light the above results would paint Yammer as a failure; yet this is far from the case. Yammer is an Enterprise Social Network. Networks do not, and need not, achieve 100% participation to be successful. A common structure for a network is what we call a “Core-Periphery15” model. As the term suggests, the structure is one of a core of very active and interconnected people, surrounded by a periphery of less connected people. This is precisely what we are seeing here. Even staff who have never logged on to Yammer are not immune to the influence of a core Yammer member, outside of Yammer. It is therefore the size and composition of the ‘core’ that will dictate how successful, or otherwise, the Yammer network will be.
The size of the core could also be referred to as the ‘critical mass’ required to sustain and grow the network. It’s hard to be precise about how big this needs to be, but at least one study16 related to politics and gender suggests around 30%. A recent article in the Scientific American suggested it takes 25% of people to start a revolution17. Of course, a good proportion of the core needs to be ‘organizational influencers’ and not just ‘Yammer Influencers’. Having executive leadership in the Yammer core is therefore critical to attracting other organizational influencers into the core.
Based on the average adoption figures reported here, there is still some work to do to achieve the critical mass required. But the results below, when compared with prior years, suggests it is within reach. We estimate that just under 30% of our benchmarking partners are currently operating at this level.
Once we have identified those staff who have become interactive on Yammer, we can drill down further to understand the breadth of interactive activity.
15 https://en.wikipedia.org/wiki/Core%E2%80%93periphery_structure
16 https://www.cambridge.org/core/journals/politics-and-gender/article/story-of-the-theory-of-critical-mass/592171C05B9B828DBBDCC121B05780D4
17 https://www.scientificamerican.com/article/the-25-revolution-how-big-does-a-minority-have-to-be-to-reshape-society/
Networks do not, and need not, achieve 100%
participation to be successful.
Having executive leadership in the Yammer core is therefore critical
to attracting other organizational influencers into the core.

19
3.4.1.1 Observers
Once a staff member has become interactive on the platform, they are included in our benchmarks. The next level of participation we have set is to be active on the platform more than once every two weeks, on average. ‘Observers’ are those that have not achieved this level of participation over the most recent six-month period.
The average score is 59%, which is again an improvement on 2017 figures (68)%, and 2016 (75%). Across the sample, Observer scores as low as 25% have been achieved. Looking in more detail at the frequency distribution, we can see the majority of organizations are in the 50-70% range, a definite improvement on 2017 results.
Figure 7 - Observer Distribution
%Observer Distribution
What is an appropriate target for participation?
We suggest a target of 40%+ active participation is not an unreasonable goal for Yammer usage. That means that the proportion of Observers should not exceed 60%.
Range 25% - 88%
Average %Observers: 59%

20
3.4.2 USER ENGAGEMENT
Once we have people on the platform it is time for them to contribute. We use three measures for this; proportion of Broadcasters, proportion of Recognition and Activity per User. These are described in more detail below.
3.4.2.1 Broadcasters
Now that we have managed to influence staff into becoming active on the platform, we need to try and keep them there. The most common method is to provide content they can only access on the platform. Given that ESN platforms are a derivation from consumer social networking sites, there is significant experience available on how to engage people through social media. User engagement around content requires people to react to the content, either by commenting, sharing or simply acknowledging with a ‘like’. Ineffective content is therefore content that gains little or no traction. We have characterized people who are responsible for this style of content as “Broadcasters”. In other contexts, broadcasting may not be a negative behavior. But in an ESN it is. We believe that this measure should have targets to minimize broadcaster behavior. The average of 8% this year is a big improvement on the 2017 benchmarking report’s 18%, but the larger range points to a large room for improvement for many organizations.
We suggest trying to keep the %Broadcaster to below 5%
3.4.2.2 Recognition
A core characteristic of any social system is social recognition. The ubiquitous ‘like’, or related signal the @ ‘mention’, form part of the social recognition system. The measurement of social recognition is important for assessing how users are engaging with the social model of collaboration. The Recognition is simply the percentage of all interactions that are ‘likes’ or ‘mentions’.
There should, however, be an upper limit to this. If the proportion of social recognition becomes too high, we run the danger of turning Yammer into a mutual admiration system, at the expense of developing tangible outcomes. We should also note however that a “mention” is a form of tagging which we know attracts more replies. The higher average than the 2017 report’s 56% is perhaps too high though, with the range being even larger this year.
We suggest a target range for Recognition to between 40% – 60%
A common measure of success for social media systems is the raw activity that the platform is attracting. Social systems are characterized by a ‘long tail’ effect, whereby lead users are responsible for a significant proportion of the activity.
A quick measure to identify the extent that this is occurring is to measure the ‘Activity/Active User’ ratio. The average activity/user works out to be just over one activity/week/user. Best practice (125.1 activities / active user) performance works out to just under five activities/week/user, or once every working day. Again, the performance comfortably exceeds the 2017 report’s score of 21. This is a measure that we would like to maximize without limit.
Average % Broadcaster:
8%Range 0% - 56%
Average % Recognition:
61%Range 12% - 81%
Average Activity/User:
29Range 3.1 – 125.1
We suggest a practical initial target for this measure is more than one activity per week for every active user and then toward or exceeding the best practice of one activity each working day.

21
3.4.3 CONNECTING
Connecting signals the transformation from a media focus to a relationship focus. For many adopters of Yammer this is a critical transition. While content is used to attract people to Yammer, the real value in the platform comes from people connecting with other people. Once connections are made, the pathways have been established for true knowledge sharing, problem solving and innovation.
3.4.3.1 Proportion of Engagers, Catalysts, Responders and Broadcasters
The Persona scores assess the percentage categorizations for the non-observers i.e. those that are active more than once every two weeks. SWOOP identifies Personas based on interaction behaviors18.
We can see the Responder has the highest average score. A Responder is someone who reacts to others with replies and likes. We often refer to them as the ‘caregivers’ who help sustain communities. They have displaced the Catalysts as the most prolific from the 2017 benchmarking report. The Engager is our aspirational persona. Engagers are able to balance posting and responding. This behavior therefore lends itself to relationship building and the movement from engagement around content, to building connections.
In terms of targets for the positive Personas, we suggest the proportion of Engagers should be above 30%, and Catalysts and Responders should be comfortably between 30–40%.
In summary, we identify Observers and Broadcasters as the least attractive personas, in the context of moving an organization beyond content consumption, to collaboration. The positive behavioral personas of Engagers, Catalysts and Responders are required to push organizations into relationship building; a key prerequisite for effective collaboration.
18 http://www.swoopanalytics.com/personas/
Figure 8 - Behavioral Persona Distributions
%Persona (Average/Range)

22
3.4.3.2 Influencer Risk
Influencers can attract eyeballs to content and therefore advertisers and revenue for the content owners. Engaging users around content is the ‘end game’ for social media. For Enterprise Social Networking it is more like the beginning of the journey. Once an organization starts to prioritize connections and relationships over content, it is the relationship network that becomes the focus. The influencers are the people central to these networks. They are the ‘go to’ people and the people that are positioned to broker new connections. However, networks can become over-dependent on a single hub. When this is the case, a network can disintegrate, should the hub leave the network. The extent to which a network is at risk to this happening is captured by our Influencer Risk. This index calculates the degree to which the network is dependent on a selected few. The higher the score, the higher the risk.
The average score is 34 with a ‘best practice’ i.e. lowest risk score of 1.9. A high Influencer Risk Index means that the network is at risk if a few key people were to leave. Just like hierarchical roles, it is always good to build some redundancy into the network, encouraging multiple hubs to form, and to lower the key player risk.
We encourage a target to be initially set at maximum of 20%.
Influencer Risk:
34Range 1.9 - 78.7
3.4.4 SHARING
The sharing stage leverages the connections we have built. Connections provide the pathways for knowledge sharing. Knowledge comes in two forms; explicit and tacit. Explicit knowledge is just another name for information or content. Most organizations have many ways of sharing information.
While we might argue about which ways work the best, for the most part, explicit knowledge sharing is relatively easy, compared with tacit knowledge sharing. By definition, tacit knowledge is not codified. It is shared through frequent and rich conversations.
The most effective means for sharing tacit knowledge is face to face. However, the ESN is available to fill the gaps between important face to face knowledge sharing sessions. The richer and more frequent the online conversations are, the more effective face to face interactions will be, once the opportunity arises.
For this stage we’re applying the measures of ‘Public Messages’, ‘Post/Reply’ ratio, ‘Thread/User’ and these are outlined below.
3.4.4.1 Public Messages
A number of benchmarks can be used as indicators of sharing. The Public Messages measure identifies the percentage of messages that are open and transparently available across the network, i.e. posted in public groups. While there are always good reasons for maintaining privacy for certain messages, we believe that a ‘sharing organization’ should be continually challenging private spaces. For example, it is a common practice for teams to be formed as private groups in ESNs. Often setting these group areas to private is because team members just don’t think anyone else would be interested in the detail of their day
% Public Messages
68%Range 7% - 100%

23
Average Reply/Post:
1.72Range 0.27 - 4.23
to day work. Largely, this may be true but by setting these groups up as private, it completely removes the opportunity to share.
At 68%, the percentage of public groups is actually a little lower than the 2017 report’s 74%, with one organization having only 7% public messages. Many of the highly collaborative organizations are still sustaining over 80% public groups. We would anticipate that as private teams move to Microsoft Teams, the proportion of Public messages should improve again.
We suggest an appropriate target for Public Messages is greater than 80%.
3.4.4.2 Reply/Post Ratio
We often refer to the Reply/Post ratio as ‘pump priming’. When networks are starting up, it is common for the leaders to post a lot of content to attract people to the network (Reply/Post < 1). At this stage we expect the number of posts to exceed the number of replies during start-up. But as the network matures and becomes more conversation-centric, we would expect the ratio to reverse, with Replies outnumbering Posts. If this isn’t happening, then there is a good chance effective knowledge sharing is not occurring.
At 1.72 we see that on average, organizations are still only marginally replying more than posting. This suggests that ESN discussions still have a way to go. That said, this year’s performance is an improvement on 2017’s 1.34, with the best practice score of 4.23 replies for every post being comfortably better than 2017’s 3.03.
We suggest a practical target for a Reply/Post ratio should be above 2.5 replies for every post
3.4.4.3 Threads/User
This measure is designed to capture the breadth of engagement of staff in discussions. The more discussion threads that staff are involved in, the more likely that active knowledge sharing is occurring.
The results suggest engagement in active discussions is still low, with an average of less than three threads per active user, over the full six-month period. The score however is an improvement on our 2017 report’s 2.05 with the ‘best practice’ score a healthier 14.8, significantly better than 2017’s 7.82. This is another measure where there should be no upper limit.
We would suggest a practical initial target based on best practice leaders would be more than six threads/user over a six-month period, or one thread/user every four weeks and then moving toward best practice of one thread every two weeks.
3.4.5 PROBLEM SOLVING
A problem shared is a problem solved. This well-known saying correctly identifies that problems are rarely solved in isolation. But it is also true that a lot of knowledge is shared without an express purpose. For example, gossip is a form of knowledge sharing, but it rarely moves the organization forward, and sometimes quite the contrary.
Average Threads/User:
2.71Range 0.25 - 14.8

24
The transition from knowledge sharing to problem solving is another key transition, just like the one between engaging around content and connecting. Once a problem solving purpose is acknowledged, we have a path to true value creation. Tim Baker and Aubrey Warren in their book “Conversations at Work: Promoting a Culture of Conversation in the Changing Workplace19” identify conversations without questions being simply statements passing back and forth with no result. “Questions add the vital ingredients of reflection, investigation, and integration”; all of which are required to solve difficult problems.
For this stage we’re applying the ‘Response Rate’ and ‘Reciprocity’ measures.
3.4.5.1 Response Rate
The Response Rate looks to directly capture responses to posts. For this benchmark we only include written replies; some of which may be further questions. ‘Likes and Mentions’ have been excluded from this benchmark (though are available in the SWOOP dashboard), because a ‘like’ can be a conversation killer i.e. how do you extend a conversation after a ‘like’?
The average of 46% is an improvement on 2017’s 40%, with a best practice of 70% (64% in 2017).
We can see most performances fit in the range of 30 – 70%. Those handful of organizations with written reply response rates over 60% are generating richer conversations. Those operating below 30% are
Average Response Rate:
46%Range 13% - 70%
likely to be still ‘broadcasting’ style organizations; which should only be justified in the early phases of ESN maturity, where you may still be looking to use content to attract staff to the platform.
We would recommend a target of at least 50% be adopted for this important measure.
Figure 9 - ‘Reply’ Response Rate Distribution
‘Reply’ Response Rate Frequency
19 https://www.amazon.com.au/Conversations-Work-Promoting-Culture-Conversation-Changing-Workplace/dp/B017J5HBDC

25
3.4.5.2 Reciprocity
A two-way connection is formed when you initiate an interaction with someone e.g. you ‘like’ their post and they, in return have perhaps replied to one of your posts. Two-way connections are a signal for a relationship being formed. And of course, the more two-way interactions you have with someone, the more likely you are to have formed a stronger relationship with them.
The Reciprocity measure is simply the percentage of all relationships that are two-way connections. The average score and best practice are a substantial improvement over those recorded in 2017 (14.6% versus 24.2%). We suggest organizations should be trying to maximize both measures, looking to achieve Reciprocity above 35% for organizations with less than 1,000 people; 30% for organizations of between 1,000 – 5,000 people and 25% for organizations with more than 5,000 people.
It should be noted that the 2017 report’s average two-way connections score was less influenced by the relative size of the organization. However, we have dropped this measure in favor of the easier-to-interpret Reciprocity (Two-way Relationships on the SWOOP dashboard). It is, however, more sensitive to organization size (larger organizations will find it harder to achieve high Reciprocity scores when compared with smaller organizations).
If you have a group with a high number of two-way connections, it is more than likely the group is densely connected, and therefore more cohesive in its operations. It is common to judge an ESN group by how active it is. But if the activity is simply statements or opinions ‘passing in the night’, performance is simply an illusion.
The Reciprocity score is the most reliable measure of relationships forming and problems being solved.
3.4.6 INNOVATING
While regular problem solving is akin to incremental innovation, we reserve the final stage of maturity for when organizations exhibit a culture of continuous innovation, adaptability and responsiveness. Clayton Christensen introduced us to the concept of disruptive innovation in his book the “The Innovator’s Dilemma22” some 20 years ago. Disruptive innovation occurs when a diversity of views is brought to bear on a problem or opportunity.
For this stage we’re applying the ‘Diversity’ and ‘Curiosity’ measures.
3.4.6.1 Diversity Index
In essence, a key prerequisite for successful innovation is diversity of thought, which comes from a diversity of connections, leading to a diversity of experiences. Diversity can be measured across a multitude of dimensions. While the popular media aligns diversity with gender, business enterprises are more regularly concerned about diversity of connections across the formal lines of business, or exposure to a
Average % Reciprocation(Two-Way Relationships):
24.2%Range 9.58% - 42.2%

26
diversity of perspectives and thinking. The diversity dimension used for this benchmark is diversity of participation in Yammer groups or communities. One can build diversity by being active in a larger number of groups.
The diversity measure takes into account the number of groups one is a member of, and how evenly activity is spread across those groups. Through participation in Yammer, staff can build their diversity of thought by being active in a larger number of online communities or groups. The enterprise diversity score is simply the average of individual staff diversity scores.
The average diversity score of 42.5 (best practice 69) is comfortably better than the 2017 performance (36/64).
However, one organization set a new low of one, which essentially means staff are members only of their own silo groups; not a good sign for knowledge sharing and innovation.
Average % Diversity:
42.5%Range 1 - 69
The Diversity Index distribution has moved forward since 2017, with the bulk of organizations in the 30 – 60 range. To maximize a diversity score, an individual would need to spread their activities evenly across a large number of groups. There is a practical and sensible limit to how much one should aim do this.
We suggest a practical target for Diversity is to exceed 50%.
While diversity is required to source the breadth of ideas and opportunities available, the conversion of highly prospective ideas into successful implementations requires focused collaboration and cohesive teams. Therefore, it is the dual benchmarks of Reciprocity and Diversity (and now Curiosity) that together reflect how innovative an organization is likely to be.
3.4.6.2 Curiosity
This is a new measure for our benchmarking. The measure simply calculates the proportion of posts and replies that include a question. On its own, a high Curiosity might signal a more inquisitive
Figure 10 - %Diversity Distribution
Diversity Index Frequency

27
organization; and one whom is willing to entertain change, innovate and/or challenge the status quo. Inside a cohesive team, questioning might be less about discovery and more about co-ordination and co-operation.
A cohesive team that questions is a team that identifies with agility and adaptability. On the other hand, a poorly cohesive team with a high curiosity index might indicate undue procrastination and therefore poor productivity.
Of the 74 Benchmarking sites, 55 had curiosity data. The range of 2.8% to 30.6% looks substantial, yet there were no statistical differences between large and small organizations. We will explore curiosity in more detail at the Group level in section 5.1.
3.5 Summary
Of the nine measures that are directly comparable with 2017, with the exception of the Public Messages, the 2018 performance exceeded that of 2017 by, on average, more than 30%. The %Public was 8% lower than the 2017 performance. While the sample of companies was not identical, we are comfortable in suggesting that the overall maturity of Yammer sites has increased significantly since 2017. The largest improvement was seen in the key cohesion measure Reciprocity; the lower proportion of Broadcasters; the higher Activity/ User rate and the Threads/User rate.
Perhaps what we are seeing is that those organizations adopting Yammer for the first time, through Office 365, would now be moving beyond the early driving adoption phases to connecting and collaborating more intensely, with a closer focus on business value generation.
Curiosity Index:
14%Range 2.8% - 30.6%

28
4 NETWORK PERFORMANCE LEADERS
4.1 Organizational Performance Comparisons
We have used the same performance framework from previous years to plot each of our benchmarked organizations on an overall performance chart. We identify our measure of Diversity on the Y-axis and Reciprocity (Two-Way Connections) on the X-axis as our measure of cohesion.
For 2018 we have made three changes:
1. The Cohesion score from previous years was the average two- way scores of all interactive members. For this year, we are using the SWOOP dashboard measure of Two-Way relationships across all relationships (the %Reciprocity measure from previous reports). While these two measures were highly correlated, the former was less sensitive to the size of the organizations. That said, we have found the %Reciprocity something our clients can better relate to, so hence have chosen that measure as our preferred measure of cohesion. The penalty, however, is that we will now divide our performance comparisons into three different organization sizes, so the larger organizations are not disadvantaged by the change.
2. The second change is adding the %Interactive User score to our ranking score. This measure is a reflection of the level of Organizational Engagement and we feel it is an important indication of the penetration Yammer has within an organization. Again, this measure favors the smaller organizations, so the size categories are again relevant.
3. The third change is the inclusion of the new Curiosity measure as a key performance indicator. We have included the Curiosity score for “informational purposes”, to provide additional commentary on an aspect of performance we think will be critical in the future (see Section 6) . We will be validating this proposition for its potential formal inclusion in the ranking process for 2019.

29
As we can see there are a few standout organizations that are successfully balancing diversity and reciprocity for maximum performance. We can also see the size-sensitive criteria of Cohesion and Interactive Users results in the smaller firms performing best. The selected benchmarking leaders for each size category are marked on graph, with the color indicating the size category they belong to.
As stated earlier, for this year we planned to use the Curiosity Index for informational purposes only, in relation to performance rankings. At the enterprise level we were not able to find any correlation between Curiosity and Performance as assessed by Reciprocity, Diversity and Interactive Users; though it is at least correlated with Diversity.
It is early days in our analysis of Curiosity in the Enterprise. In Section 5.1 we address Curiosity at the Group level, where correlations between curiosity and performance do exist.
Figure 11 - Benchmark Performance Results
Benchmark Performance - All Enterprises

30
4.2 Who are our Collaboration Champions?
Our SWOOP Award recipients have been chosen based on the three key performance indicators of Cohesion, Diversity and %Interactive Users. We have excluded SWOOP partners from our Champions list. Of course, they are champion performers but social networking is their vocation, so we thought it best to reward those that don’t do enterprise social networking for a job. We also chose to exclude a handful of organizations who did not have current 2018 data, simply because we can’t be sure of their current performance.
SWOOP's category winners are:
Small Enterprise (<1,000 interactive users)
» Hall & Wilcox (law firm)» RealFoundations (real estate services)» Union for Reform Judaism (non-profit)
Medium Sized Enterprise (1,000 – 5,000 interactive users)
» Medibank (health insurance)» Anonymous (Canadian financial services)» Bankwest (financial services)
Large Enterprise (>5,000 interactive users)
» Yum/KFC (restaurant)» Telstra (telco)» Syngenta (agribusiness)
An important benefit from any benchmarking exercise is to learn from our leaders. We reached out to each of our champions and asked them to nominate any particular business practices they felt had helped in their successful use of Yammer. We also sought commentary on significant problems solved or new innovations achieved. We thank each of our leaders who have generously shared their experiences and good practices.

31
4.2.1 HALL & WILCOX
Hall & Wilcox is one of Australia’s leading law firms. In just four years, it has expanded from one office in Melbourne, to six offices across the country with 650 people.
Yammer was initially introduced in December 2011 to connect the firm’s people, who despite being in the same building in Melbourne, were spread across five non-contiguous floors. That had an impact on collaboration and efficiency within the office.
“We didn’t have stairs between each floor and even though we were in the one building, we felt that there were culturally three or four independent firms emerging within the one firm,” said Chief Operating Officer Sumith Perera.
“We needed some way to keep people informed in the moment of what was happening across the firm.”
From broadcasting to collaborating
In the first 12-18 months after Yammer was introduced, Sumith says activity was fairly low. It was used more as a broadcast tool and some people questioned its worth. But as the company grew, so did the Yammer network with help from executive engagement and a dedicated technology trainer.
With new offices in Sydney, Newcastle, Perth, Brisbane and Canberra, Hall & Wilcox’s Yammer network was the tool that connected them all. In the past year, the active user rate has grown from 40 per cent to 70 per cent, according to data from SWOOP.
Hall & Wilcox practices Smarter Law, its response to disruption in the legal industry. Smarter Law means being imaginative, agile, tech savvy and collaborative to deliver greater value to clients.
Sumith says using Yammer is consistent with Smarter Law by engaging people in servicing clients and ensuring the entire knowledge of the law firm is being leveraged.
“We’re getting a lot more diverse thinking to client problems and we’re being able to source that either by people observing what’s happening across the firm based on the activities that people are sharing on Yammer, or by actually crowd sourcing answers
to particular legal problems or situational problems that people want advice on,” he said.
Removing barriers to access
Hall & Wilcox Technology Trainer Jason Soo says it’s important to train people to use Yammer, which he does as part of his induction for every new employee.
“Don’t just give them Yammer, teach them how to use it and show them how to set it up properly,” he said.
Every time a Hall & Wilcox employee signs onto a computer, Yammer automatically opens in a browser, removing any barriers to accessing the network.
“A simple fix like that is something that can make a big difference, making it turned on by default so it is available, ” Jason said.
He also encourages staff to tailor their Yammer feed so they follow only the groups they have joined and turn off Yammer email notifications if it’s becoming too “noisy”.
Executive engagement
Jason attributes much of the company-wide success of Yammer to the engagement from Managing Partner Tony Macvean and Sumith, who both endorse Yammer as a tool for working out loud.
Tony and Sumith post a weekly Friday update on Yammer, usually a summary of what’s been happening across the firm during the past week. Sometimes they’ll record a short video on the phone and upload it, other times it’s a written summary and it usually includes photos from the past week.

32
Learning on Yammer
Hall & Wilcox encourages staff to use Yammer as a place for learning. It’s where people ask questions and receive answers. The result is a better service for clients.
In an effort to boost the Yammer network, Jason presented to the executive leadership team late last year and highlighted best practices, including asking questions and to find answers and praising staff. He also advised to @ mention people in Yammer posts which he says has resulted in greater collaboration.
SWOOP for benchmarking
Jason uses SWOOP to benchmark leaders and some groups to help coach them on how they can improve or hone their engagement skills. SWOOP’s benchmarking tool shows individuals their current SWOOP persona and compares their level of contribution, as well as showing how others engaged with them.
“Showing people the two-way interaction of their conversations helps people become more of an Engager or Catalyst and helps them change their behavior once they get that snapshot,” Jason said.
Innovations
A team from Hall & Wilcox recently mentored a group of law students at the University of Western Australia’s Law School during a weekend Hackathon called Disrupting Law. The purpose of the hackathon was to develop a software solution for a specific problem from the legal profession.
Teams had 54 hours to brainstorm, ideate, validate, prototype and build a business model which they
presented to an industry panel for judging. The aim was to provide real world solutions to reduce costs for end users.
The Hall & Wilcox team, called the Hallstars20, used Hall & Wilcox’s Yammer group Smarter Law to bounce ideas with their industry expert colleagues from around the country.
“The Hackathon went on for the whole weekend and people were getting their updates on Yammer and posting their ideas and feedback and links to websites to give the team on the ground feedback and help,” Jason said.
“The IP is in our Yammer network. You’re not just hiring one lawyer from a law firm, you’re leveraging their entire network of knowledge and drawing into the expertise of everybody who is at the organization.”
Read more about Hall & Wilcox's journey with Yammer and SWOOP21.
“The IP is in our Yammer network. You’re not just hiring
one lawyer from a law firm, you’re leveraging their entire network of knowledge and drawing into the expertise of everybody who is at the
organization.”
20 https://www.linkedin.com/feed/update/urn:li:activity:6439728943301042176
21 http://www.swoopanalytics.com/case-studies/providing-better-service-and-smarter-law-with-yammer-and-swoop/

33
4.2.2 REAL FOUNDATIONS
RealFoundations is a global professional services firm focused on helping companies that develop, own, operate, service, occupy or invest in real estate make smarter and more profitable decisions.
RealFoundations advises on everything from designing cost-effective solutions for energy efficiency to implementing operation strategies. Its headquarters are in Dallas, Texas, with offices across the United States, Asia, Australia and Europe. There are 400 RealFoundations Yammer users.
What sets RealFoundations apart from its competitors is its collective knowledge and capabilities, which it calls the “(rf)X Factor”. It is the ability to easily and quickly tap into the knowledge and capabilities of every single person who is working at the company, or has previously worked there, to deliver a better outcome for customers. This is done via Yammer, Microsoft Teams and SWOOP Analytics.
Executive leadership on Yammer from day one
RealFoundations began using Yammer in 2014. Back then, it was driven by chief executive Chris Shaida. He would give weekly tips on how to use Yammer and would engage staff by posting, sharing, tagging and commenting.
Five years later, RealFoundations’ Director of Presence and Assets, Naomi Souza, says she still refers people back to those tips.
“Chris challenged us to think every time before you send an internal email,” Naomi said.
“Ask yourself, are you certain that everybody who might know the answer to that question is in the distribution list? Or are there people who might benefit from hearing this conversation. Should this be an email or should this go in Yammer?”
Naomi says sharing information on Yammer and Microsoft Teams is now a part of company culture. The question is no longer whether something should be emailed but whether it’s best shared on Yammer or on Teams.
A sign of RealFoundations’ Yammer maturity is the fact the CEO has been able to step back from being the most influential person on the
network, because using Yammer is now part of the company’s everyday culture of working out loud – it’s where people work.
“In the beginning Chris was very active. If you looked at SWOOP two years ago, and today, Chris has definitely tried to step back so that others can step forward. He reads everything in Yammer still, but that’s not apparent to everybody,” Naomi said.
The importance of sharing knowledge So important is it to collaborate and share knowledge to innovate at RealFoundations, it has become a part of every employee’s bi-annual performance review. Data from SWOOP shows how and when each employee has collaborated and contributed to the company’s knowledge base on Yammer.
“Being a professional services firm, we sell our knowledge and capabilities in the real estate space,” Naomi said.
“So for us, it’s really important to know what we know as a firm and in order to do that, we really have to get out of people’s heads what they know, and what they know how to do, and get that knowledge in a place where other people can learn from them, where it’s accessible to other people. For us, that’s Yammer and Teams.”
Twice a year, Naomi runs a SWOOP benchmarking report for every employee for the previous six months which is discussed at their bi-annual review.
“If you are new to RealFoundations, or if you are junior in our consulting practice, there’s this expectation, maybe you’re not posting a lot but we want to see that you’re liking things, maybe you’re asking questions,” said Naomi, adding that Teams

34
and email usage is also reviewed and discussion is often around ways knowledge would be better shared by working out loud in Yammer and Teams.
“Certainly, as you move up in your career we want more responses, more knowledge sharing, more thoughtful questions that turn into these problems solved. We look at it differently at different levels, but we do look at the SWOOP personas in these reviews.”
Naomi said it is important there are no Broadcasters in senior groups, only Engagers or Catalysts.
#What I’m Doing Today With employees scattered across the globe, RealFoundations has an initiative called #WhatImDoingToday, where each employee begins their day with a quick post on what they’re doing each day. The hashtag can be tracked on SWOOP.
“I have five people in my team in India,” Ms Souza said. “We all come in and post what we’re doing. It makes you feel much more connected and when I finish something at the end of the day, to be able to pass that thread on and have them pick that up is invaluable."
“To be able to work out loud in that way makes us definitely more productive. You have your pulse on what’s going on.”
Live blogging on Yammer
RealFoundations staff attend about 50 conferences every year. They create a Yammer group for every
conference. While this means there are a lot of groups on the Yammer network, it also means it’s easy to share news from each event and refer back to the previous year’s event.
Usually four to five employees attend each conference and they all live blog on Yammer to share what they’re learning. They also use the group to answer questions from potential customers who visit the RealFoundations booth. They can snap a photo of a business card, ask the question on Yammer and tag the relevant person, and either give the answer to the customer or get the person they’ve tagged in the Yammer post to follow up.
“It gives people the opportunity to learn and feel like, even though I didn’t physically go to this event, I know what happened, I know who we talked to, I know the big themes that were discussed,” Naomi said.
Read more about RealFoundations’ journey with Yammer and SWOOP22.
“To be able to work out loud in that way makes us
definitely more productive. You have your pulse on
what’s going on.”
22 http://www.swoopanalytics.com/case-studies/tapping-into-the-x-factor-to-deliver-better-outcomes-for-clients/

35
4.2.3 UNION FOR REFORM JUDAISM (URJ)
The Union for Reform Judaism (URJ) is based in the United States with almost 900 congregations and more than one million members across North America and beyond. URJ introduced Yammer in 2014 because its email distribution list had blown out to more than 5,000 recipients and in the age of enterprise social networks and collaboration, URJ knew the day of email list serves had been eclipsed.
Initially, an external Yammer group called The Tent was established to connect lay and professional leaders across North America and beyond. It now has 12,000 users. But Larry Glickman, the Director, Network Engagement and Collaboration at URJ, soon realized this external network wasn’t going to work without the help of URJ professional staff.
An internal URJ Yammer network was established for the 400 URJ employees.
“In order for our staff to be more comfortable in our external Yammer network, they needed to first see the benefits of a platform like Yammer by using it for our work. One wasn’t going to happen without the other one,” Larry said.
It’s this internal Yammer network of 400 users that earned its place among the top performers in SWOOP’s 2018 Benchmarking of Yammer networks. To its credit, the external network known as The Tent was ranked 26th out of 74 organizations when measured on cohesion and diversity scores.
Three keys to URJ’s success – Working Out Loud, a community manager and time
The URJ team had been using Yammer since 2014 and things were bubbling along nicely, mostly thanks to Larry’s intervention to ensure he got staff onto the network by tagging them, using SWOOP to recognize the top posts of the week, and even sending an email with teasers to direct staff to the Yammer network.
But activity began to speed up when Larry introduced the first Working Out Loud circle23 in January 2017.
Working Out Loud Circles are small peer support groups in which you build relationships related to a goal, using simple structured guides over 12 weeks. Over that time, you develop habits and a mindset you can apply to any goal. The URJ team carried out their “circles” on video conference calls.
“We began our first Working Out Loud Circle with the express hope that it would help our staff be more accustomed to working in this more collaborative, transparent way - knowing that this feels good and this works and that would carry over to our Tent network,” Larry said.
“We just launched our 17th Working Out Loud Circle this month. People have really enjoyed it, they have really gotten a lot out of it and I think that our Yammer networks have really grown.”
URJ was benchmarked in SWOOP’s 2017 report on Yammer networks and while it performed well, it has improved considerably since implementing Working Out Loud Circles.
Along with Working Out Loud circles, Larry says the two other keys to success is having a community manager and giving the network time to grow.
23 http://workingoutloud.com/en/circle-guides/

36
He doubts the Yammer network would grow without a community manager.
“I think it would sustain itself (without a manager) but I don’t know that it would grow as much,” Larry said.
“I’m just trying to keep people engaged and more and more, the staff is falling in love with it.”
His final tip is to give the network time.
“You’re not going to get engagement in a month,” he said.
“You have to really be determined to make the space work or to at least give it time and to lead the way. If you don’t use the space wisely, nobody else is going to”.
“We just didn’t give up. We are finding more and more teams throughout our staff organization use Yammer as the place where they share information, where they connect with one another each week.”
Connecting staff and creating community
URJ’s professional staff are scattered across North America and about half work remotely. It was important to make them feel connected and give them a space to share ideas and work together.
“We really wanted to launch a space where our users could not only connect with one another but we could really host a meaningful knowledge repository online,” Larry said.
“People could make connections with one another and realize they’re not alone in the work that they do and create this community online.”
Innovations
Larry keeps staff engaged on both networks by
using SWOOP to identify top posts and track hashtags and trending topics. He also sets challenges in Yammer where he will encourage staff to make a post, tag three people and add at least two hashtags.
This always draws more people into the conversation, he says, adding that the more he tags people, the more replies he receives.
With such a huge external network to navigate, Mr Glickman has introduced “verified groups”, easily visible by the check mark, or tick, next to the group name.
“Users will know that it’s a verified group, their posts will get replies, the files will be named according to our file naming conventions, there will be hashtags, it will be a well curated space,” he said.
Yammer has become URJ’s greatest onboarding resource for new staff. When a new employee opens their email inbox, it is empty. But by engaging on Yammer, they are in the thick of things from the get go.
“We have created a really meaningful legacy of information and conversation and resources in our staff Yammer network,” Larry said.
Read more about URJ’s story with Yammer and SWOOP24.
“We really wanted to launch a space where our users could
not only connect with one another but we could really
host a meaningful knowledge repository online,” 24 http://www.swoopanalytics.com/case-
studies/building-community-in-a-world-hungry-for-social-connection/

37
4.2.4 MEDIBANK
Medibank is one of Australia’s largest private health insurers with 3.7 million customers.
Medibank launched its Yammer network in December 2016, and in less than a year 2,600 of the company’s then 3,000 employees had activated their accounts, with more than half now active users.
The decision to implement Yammer was in response to a ‘fragmented landscape’ where there were four intranets and a host of social network tools, which meant the company could not connect across boundaries.
However, there was clearly an appetite within Medibank for its own social network.
The goal, according to Medibank’s former Internal Communication Channels Business Partner, Evita Puccio, was to: “Achieve a single corporate intranet, with an enterprise-wide social network, enhancing engagement, productivity and greater connection between individuals, teams and across business units”.
The network needed to connect employees working in retail, nurses working from home on help lines, call centers and those working in corporate locations.
They all needed to be kept up to date, connect and find colleagues. The decision was made to launch Yammer.
A pilot was launched within the retail arm. Evita said the leadership immediately began replacing monthly emails with Yammer posts and using it for recognition and praise of employees.
“The uptake of Yammer has shown us the value social can bring to Medibank, opening up powerful conversations, and enabling fast and effective communications across the network,” she said
Engaging employees on Yammer
As part of a corporate purpose and values refresh, Medibank launched an eight-week campaign to engage employees and find out what makes Medibank unique and a great place to work. It was called the #HeartofMedibank.
The purpose was to learn what behaviors and values needed to be shared across the company.
It was led by the CEO who told employees on the Yammer network that this was the time for them to have their say and be a part of the conversation.
Who better to refresh the corporate values of the private health insurer than those who work there and serve customers every day?
CEO Craig Drummond was supported by the executive leadership team in finding the answers and asking questions on the Yammer network.
The campaign was tracked on SWOOP to monitor engagement levels and to see which posts were resonating.
At the end of the campaign, which also included in-store and in-office booths, along with listening forums, there had been 554 comments linked to the #HeartofMedibank on Yammer and more than 2300 likes.
“This was a very powerful way to get people together and have conversations about what really makes us tick as an organisation,” Evita said.
“It was really on Yammer that all of this buzz and activity started surfacing and really showing that there was something happening across the network.”
“Fantastic corporate values came from our people.”
A #CustomerObsessed campaign on the Yammer network was also incredibly successful, with more than 2000 comments, almost 1000 people engaged and more than 9500 likes.
It was a way for employees, particularly those on the frontline, to share their stories and experiences.

38
“For them to be able to share their stories on Yammer is one of the most powerful things because it connects those who aren’t on the frontline with one of the key purposes of our business,” Evita said.
Innovations and business outcomes
While Medibank’s Yammer network is a powerful resource for connecting people, launching campaigns, informing employees, welcoming and introducing new starters to the company, Evita says the real business value comes from problem solving.
“When you talk about some of the aspirational ways that a business can use Yammer, there’s connecting and there’s sharing and then you come into things like problem solving and innovation,” she said.
“Problem solving is somewhere where you can start delivering real business value for Yammer. We’ve got some fantastic knowledge sharing groups, like “Fix It.”
She explains the “Fix It” group was initially a closed pilot for 700 frontline employees to raise any issue they wanted, whether it be a squeaky door to the shop front, software hiccups, and policy concerns – absolutely anything that impacted their ability to do their job.
An admin team would triage the issue raised and refer it to the relevant team.
At the end of the day, Evita said the Fix It group has gained a cult following because: “Every single item that was raised was actually managed and responded to appropriately”.
“Problem solving is somewhere where you can start delivering real business value for Yammer. We’ve got
some fantastic knowledge sharing groups...”

39
4.2.5 BANKWEST
Bankwest is headquartered in Perth, Western Australia, one of the most geographically isolated cities in the world. Founded in 1895, the organization is now a subsidiary of the Commonwealth Bank of Australia, the largest listed company on the Australian stock exchange, worth more than $AUD26 billion.
Bankwest has branches across Western Australia as well as in Adelaide, Brisbane, Canberra, Melbourne and Sydney.
The bank began using Yammer in 2012 but engagement rates began to rise in 2013 when Matt Dodd joined the organization as Bankwest’s Senior Manager Digital Channels.
The network soon grew from 500 users to today’s 4,500 active users.
Matt says Yammer is now “part of the furniture” at Bankwest. It’s become part of the company culture - a place to test new ideas and products and to share news and information.
Engage and educate
For Bankwest, the focus on Yammer initially was not about the technology or the network, it was on the people.
When the network was first taking off, Matt would encourage staff to celebrate their co-worker’s birthday with a photo on Yammer or celebrate someone’s work anniversary and @ mention that person on Yammer, all with the goal of drawing new people onto the platform.
The power of social groups
Bankwest is a big advocate for getting people involved in social groups on Yammer, sharing pictures of their pets or favorite restaurant.
“It’s that low entry point that’s been critical for us and it starts to build that capability so that people feel they can take part,” Matt said.
“We went all-in on social groups and we really made a conscientious effort to encourage it to grow organically. Ultimately, we’ve let people be people. We’ve treated them as adults and they’ve responded to that.”
He said in five years overseeing Bankwest’s Yammer network he has removed only two posts.Matt acknowledges a community manager is needed for a healthy Yammer network but he prefers to see himself as a ‘community engager’ rather than someone who manages the network. He wants to get people engaged and give them the opportunity to think in different ways and share ideas.
He also wants to create a safe space for people to ask the hard questions and get answers, where people are commended for asking difficult questions.
“With everything going on in financial services we need to make sure our culture stays strong and people feel they can speak up and say whatever they want to say in the group,” he said.
“I see my role is to engage and educate rather than delete and discipline.”
Measuring success with SWOOP
Bankwest is a big user of hashtags for campaigns on Yammer, especially for recognition and corporate values, with #BeingBrilliantOrange (or #BBO) and #AmazingMate among the most popular.
What makes the hashtags important is the ease with which the campaigns can be measured on SWOOP and how simple it is to report the results to senior leaders and executives.
“We can actually see those trends, we can see whether a hashtag is popular and we can really see those cultural echoes,” Matt said.
“Senior leaders and our executive team can see

40
the effort that we’re putting into these campaigns is being realized and is being engaged with and it isn’t just a one-way broadcast, it shows real activity.“That really lends itself to the idea, as we move towards the more agile workplace, that sort of servant leadership, that we’re actually listening to what people say.”
Bankwest is transforming the way it works, by embracing an agile mindset across the whole organization as focus shifts to digital banking.Matt says Yammer has been a consistent place to have discussions about the changes.
“We have radically changed in the last 12 months in terms of our operating model but having that established channel where our conversations can help and people can ask questions and share knowledge has been wonderful,” he said.
“When you think about these big changes that have really changed the way people are now working and who they’re working with, what we’ve managed to do is keep our culture running and lot of that is has been down to Yammer.
“The way people can talk and engage and feel part of the organization, we’ve maintained that through things like Yammer.”
As Bankwest continues its shift from a traditional command to servant leadership model, Matt said SWOOP will be used for “personal branding”, showing leaders their SWOOP persona and guiding them on their interactions.
Innovations
Yammer has been a key part in the way Bankwest innovates and improves things for its customers.For example, a Bankwest employee’s partner runs a small business. They were depositing money into an ATM when the machine “swallowed” the money without verification.
The small business owner lodged a disputed transaction claim to recover the money. This process was lengthy and cash flow was crucial for this small business - it was a big issue for the small business owner.
The Bankwest employee, frustrated by the process, posted on Yammer about the problem. Colleagues immediately began to comment on the situation and @ mentioned relevant people in the disputed transaction process and others involved in ATM balancing.
The story on Yammer contributed to the entire Disputed Transaction Claim process being changed at Bankwest, with claims now processed quickly.
“It’s all because of feedback through Yammer,” Matt said.
“It’s the fact people were commenting. It gets that groundswell. Then someone looks at the process and you can @ mention the people who look after that team and they can look at it and go and sort it out.”
Another example is using Yammer for diversity of thought. A new ATM was recently being installed and details were posted on Yammer. Questions were asked about features for customers with disabilities. In this case, disability testing had been done but Matt was pleased it got people talking about how to better service all customers.
“It’s that informal learning,” he said.
“If that conversation sparks someone else to test something it’s great outcome for us. It builds that accountability.”
Read more about Bankwest's story with Yammer and SWOOP25.
“The way people can talk and engage and feel part of the
organization, we’ve maintained that through things
like Yammer.” 25 http://www.swoopanalytics.com/case-studies/authentic-leadership-cultural-change-social-groups-matter-esn/

41
4.2.6 KFC
KFC uses Yammer across the South Pacific market to bring its “People Promise” to life; be your best self, make a difference and have fun.
The restaurant chain has more than 35,000 employees spread across 642 company and franchisee-owned restaurants. One in 45 Australian youths work at KFC. In total, 28,000 employees use KFC’s Yammer network, with an average 40 per cent engaging on the network each month, according to SWOOP data.
KFC’s People Capability Director, Jonathan D’Souza, says Yammer at KFC is about engaging staff by celebrating them, spreading brand love and interacting in ways that wouldn’t always be possible face to face.
KFC launched Yammer in 2015 to achieve the goal of connecting staff and to give them a voice.
Engaging staff with authentic leadership
KFC’s Yammer network is led from the top. KFC’s South Pacific Managing Director Nikki Lawson is one of the most prolific to recognize and congratulate team members. She is one of KFC’s top 10 most active users on Yammer, according SWOOP.
The network also has a dedicated community manager, Emily O’Brien. Emily says some of the ways KFC has engaged team members on Yammer is by running competitions, having dedicated Yammer groups for every store, using it for
recognition of team members and engaging with memes.
She said competitions have been a strong driver of engagement on Yammer this year with the offer of small incentives, but in large quantities, of things like KFC merchandise, movie tickets and small gift vouchers. The competitions often mimic social media trends to increase engagement with things like; “Tag a friend to win”.
Yammer has become the go-to place for store interactions. Most restaurants have a Yammer group which has become a one-stop location for store updates, access to rosters, shift swapping, event reminders, recognition and general notices.
Emily and Jonathan said the recognition culture is thriving on “Yammertime”. It’s about sharing day-to-day stories and recognizing great work. These recognition posts, some of which come from senior leaders, have gone viral.
“The impact of peer-to-peer recognition in real time is just amazing,” Jonathan said.
Emily said KFC staff love memes on Yammer and have a dedicated group to KFC memes called “Zinging Memes” with more than 5,500 members. Most of the memes are user generated. Using analytics to understand behaviors
Jonathan said while it’s great to have 28,000 team members on Yammer, there was no point having those numbers if team members are not regularly using it.
“The biggest thing we wanted to understand is what is the active engagement rate as opposed to just measuring the number of people that were on there and SWOOP does that for us,” he said.

42
KFC set the goal this year of 35 per cent active engagement, which was well surpassed by April.
The next step for KFC is getting area coaches to use their own SWOOP dashboard to better understand how each franchisee is collaborating and which stores are more active on Yammer.
“They may have eight stores in their area, and they may use SWOOP to understand if it is one store that is driving all the engagement in their area, or is it all stores?” Jonathan said. “How do they get all eight of their stores more actively engaged?”
Emily said SWOOP also allows her to optimise Yammer campaigns by tracking what posts work and what time of day team members are most likely to interact on Yammer.
Innovations
From a business outcome, KFC can directly link Yammer campaigns to a 28 per cent increase in safety incident reporting across its 642 restaurants in Australia. Engagement across the business is up 40 per cent and team members are feeling connected. KFC uses Yammer to encourage healthy competition between restaurants, which is driving direct business outcomes.
They hold Peak Speed Competitions, measuring the night’s average speeds on drive-through service and the store with the fastest service is declared the winner. Restaurants have “Friendly Friday”, where team members are given free license to go out and engage with their customers.
26 http://www.swoopanalytics.com/case-studies/kfcs-recipe-for-success/
“The biggest thing we wanted to understand is what is the active engagement rate as opposed to just measuring
the number of people that were on there and SWOOP
does that for us.”
“They dressed as super heroes and, I can tell you, not only did customer satisfaction get up on a Friday but all week round,” Jonathan said. “It becomes infectious to the rest of the brand.”
It all leads to a better a customer experience. KFC has introduced a Mobile Ordering App. Initially, there was frustration from some team members about the app but through transparent discussion on Yammer the issue was addressed, creating a shift in attitude.
Some of that change in attitude was the result of a competition encouraging team members to share their product ideas on Yammer. Staff were using ingredients already in store to create new products and sometimes these new menu ideas were posted on Yammer.
“We developed a competition that encouraged team members to share their innovation product ideas on Yammer,” Emily said.
“The prize being that their creations would be featured on the KFC App secret menu.”
Read more about KFC’s story with Yammer and SWOOP26.

43
4.2.7 TELSTRA
Telstra is Australia's largest telecommunications company worth $US29 billion. It builds and operates telecommunications networks and sells voice, mobile, internet access, pay television and other services.
Telstra had been dabbling with Yammer since 2008 but it was in 2012 when former CEO David Thodey made a company-wide push to use Yammer to address what he called “ineffective communications” and to change the organization’s email-only culture.
It now has more than 55,000 Yammer users – Telstra employees as well as contractors and partners. It is one of the largest Yammer networks in the Asia Pacific region. Telstra has been using SWOOP since 2014 and was one of our first customers.
Connecting in a meaningful way
Jason Laird, Telstra’s former Executive Director Communications, said with active senior leadership supporting Yammer they had been able to break down silos, cut through hierarchy and share people’s knowledge more easily. “It’s common for anyone in the organization to have a Yammer conversation with the CEO and be seen, shared and commented on by the entire employee base,” Jason wrote in a blog post27.
“It feels like Yammer has made Telstra more innovative, flexible and responsive. It’s connected our people across every level, giving us a platform to collaborate in an open, friendly environment, regardless of position, location or business unit. It has become our daily pulse.”
Former Internal Communications Manager Liz Green said SWOOP had become an integral part of coaching Telstra’s senior leadership team by showing them their online behaviors through SWOOP personas, their personal network map and the list of most influential people.
Marriage equality – the most discussed topic in nine years of Yammer
In 2017 Australia held a national postal vote on same-sex marriage. At times, it became a bitter and divisive two-month campaign marred by harsh rhetoric and wild allegations of the consequences of a "yes" vote.
Telstra publicly declared its strong support for marriage equality. CEO Andrew Penn said for Telstra it was about celebrating equality28 in all of its forms so its people feel safe, comfortable, and proud to love and marry their chosen partner.
Discussion about same-sex marriage and the vote was passionate at Telstra. Yammer was where employees could have their say. It became the single most discussed topic across Telstra’s nine-year history on Yammer, according to SWOOP data.
Group Executive, Human Resources, Alex Badenoch, said through employee networks like Yammer, Telstra was providing open channels and opportunities for advice, support, information and engagement for LGBT+ inclusion.
“It’s around these issues that ignite personal
27 https://exchange.telstra.com.au/why-social-is-great-for-business/
28 https://exchange.telstra.com.au/easy-decision-difficult-debate/
29 https://exchange.telstra.com.au/supporting-equality-equally-and-respectfully/

44
passion in our people that our internal social network Yammer really comes to life,” she said in a Telstra blog post29.
“Yammer is the voice of our people and as a company, we are committed to fostering open conversations in a way that ensures everyone can have their say, and be heard respectfully.”
More than 12.7 million people across Australia, or 79.5 per cent of the population, took part in the survey with every state and territory returning a majority "yes." Australia’s parliament passed the same-sex marriage law in December 2017.
It was a huge moment for many, including Nick Collins, Telstra’s Director of Global Customer and Sales Operations, who said the frequent messages of support from Mr Penn and Telstra’s senior leadership team on Yammer encouraged open and honest discussion and brought to life Telstra’s values.
“Personally, I was really buoyed by the support I had from my colleagues and the level of interest they had in the survey,” he said in on Telstra Exchange30.
“It was terrific to see the conversations on Yammer and the availability of support via work/life coaching for our people that may have needed to talk to someone. I am proud to work for a company that not just talks but acts on a higher-purpose to create a better society.”
While the same-sex marriage debate may not obviously seem to have a direct impact on every day work at Telstra, it was as issue of passion affecting many. By providing a safe forum on Yammer, employees were able to feel supported by, and connected to, their executives and given the opportunity to be heard with respect. Read more about David Thodey’s experience31 implementing Yammer and SWOOP at Telstra.
30 https://exchange.telstra.com.au/one-small-step-for-lgbt-one-giant-leap-for-marriage-equality/
31 http://www.swoopanalytics.com/a-view-from-the-top-david-thodey-interview-part-1-why-enterprise-social-networking/
“It’s common for anyone in the organization to have a Yammer conversation with
the CEO and be seen, shared and commented on
by the entire employee base.”

45
4.2.8 SYNGENTA
Syngenta is a leading agriculture company helping to improve global food security by enabling millions of farmers to make better use of available resources.
Based in Basel, Switzerland, Syngenta has offices in 90 countries with 28,000 employees around the world. The company has 16,000 Yammer users with an impressive active user rate of 30 per cent, according to SWOOP. It also has external Yammer networks with partners, suppliers and agents, with about another 3,500 users.
Yammer was introduced in October 2015 to better connect employees scattered across the globe.
“We needed a collaboration tool,” said Syngenta’s Head of Global Engagement Programs & Internal Communications Switzerland, Sven Fritzsche.
“We said to IT; ‘We will need to launch Yammer in three months to support an important internal campaign,’ and both teams had to work hard together to meet this tough deadline.”
IT challenges became the first hurdle for Yammer adoption because employees had to authenticate themselves each time when accessing Yammer, as the single sign-on functionality didn’t work when Yammer was launched. But Sven said they pushed through by working closely with the IT department and once single sign-on was enabled most of the technical issues were resolved. Syngenta now boasts one of the world’s top Yammer networks.
In fact, Syngenta’s Communications Manager and Yammer Channel Manager, Global Engagement Programs, Melinda Schaller, was surprised it was only three years since Yammer was introduced.
“It feels like a lot longer because Yammer is so embedded here,” she said.
Melinda said the “key argument” for using Yammer across the organization was to show how it would better connect everyone and establish improved ways of working with each other.
“We don’t have to rely on email and worry about time zones when communicating on Yammer – messaging is instant,” she said.
“Our story to position Yammer within the organization once we had launched was that
this is going to make us better connected as an organization, across borders, across function and across time zones.
“Furthermore, you don’t know what you don’t know, so if you needed to contact somebody in another country but you didn’t know their name, you can’t find them in the email directory.
“Whereas, if you go to Yammer, it’s easy to be able to type in; ‘I’m looking for someone who has this kind of expertise’, and you can search by location or other key words. SWOOP made that even easier because you can search by location when looking at the data.”
Kicking off Yammer
In the early days of Yammer, Syngenta’s internal communications team conducted step-by-step training about how to use the network, and ran campaigns led by employees.
These campaigns featured staff explaining how they use Yammer to make their job easier and more productive.
But the whole network really gained momentum when the then head of Production and Supply (P&S) began doing regular YamJams. A YamJam is a live Q&A held on Yammer where anyone can ask questions and the panellist answers and discusses users' questions for a set period of time.
Sven said the head of P&S was “a bit techy” and a strong communicator and he did YamJams in his group, which had about 1,000 members. For every YamJam he initiated, there were hundreds of comments and likes.
“He really started a trend with that,” Sven said.

46
“People started following those YamJams and people started talking about him on Yammer, or just in general, and word got to the other leaders about how great this leader was because of what he was doing and how much better connected he was to employees all over the world. Other leaders took note and thought, ‘Maybe I should do that’.”
Sven and Melinda’s No.1 tip for a healthy Yammer network is to get leaders involved. Sven recommends identifying five strong leaders to start with and working with them.
Executive engagement with the help of SWOOP
Syngenta got more leaders engaged with the help of data from SWOOP. The organization has an annual global leadership conference and the internal communications team used it as an opportunity to benchmark all leaders on SWOOP and show them the leader board.
“As soon as we had SWOOP we were able to benchmark all the leaders against each other,” Melinda said.
“At our leadership conference we were able to show hard data about where successes were and so put the argument to them; ‘This is why you should be talking to your teams on Yammer’.”
Melinda said the engagement leaders who were using Yammer had with their teams was far superior to that of those that were not on Yammer. She said it was much more difficult to communicate with their entire workforce effectively because email or telecons don’t allow for personal connections the way Yammer does.
“You see personality come through on Yammer, you don’t see that in email,” Melinda said.
The graphic shown at the annual conference with the SWOOP leader board had a big impact.
“We also showed them the top performing leaders on Yammer and this ignited their competitive streak, which really made them think about how they too could be using Yammer in their day-to-day jobs to be better connected and work smarter,” Melinda said.
“Leaders came to us saying; ‘How do I get to be a top user and become a top engager?” Melinda said, adding that they showed leaders the SWOOP personas and coached them on how to improve their online behaviors.
“We really used those personas to try and motivate leaders and that worked really well. Many leaders wanted to become better and it resulted in our CEO doing a YamJam as well.”
With so many leaders now active on Yammer, many more employees followed and engagement on Yammer began to soar.
“That was the aim all along – to get leaders on board so employees could hear from them and connect with them,” Melinda said.
She said initially leaders were hesitant to use Yammer because they didn’t see the benefits and therefore didn’t encourage their teams to join. But once leaders could clearly see the business benefits of sharing on Yammer, they began using it and so too did their teams.
“As soon as we had the leaders on board, everything else became a lot easier,” Melinda said.
“The No.1 way to get more people on board is by saying; ‘Your leader is there, or your CEO is there, why aren’t you?’”
Sven said the power of YamJams is the ability to keep learning and asking questions long after the session is over. It becomes a resource of information anyone can refer to and learn from, no matter where they are situated and whether or not they were working at the time of the YamJam.
“As soon as we had SWOOP we were able to benchmark all the leaders
against each other... At our leadership conference we were able to show hard
data about where successes were and so put the argument
to them; ‘This is why you should be talking to your
teams on Yammer’."
47
Innovations with Yammer
With offices across 90 countries, there are multiple languages with which to communicate with employees, customers, suppliers, partners and agents at Syngenta.
The translation feature in Yammer is a way to eliminate many of these barriers. But there are other ways Yammer has saved Syngenta money when it comes to translations.
Melinda tells the story of when she had a large document translated into multiple languages through an agency, an expensive and time-consuming exercise.
One sentence in the document needed changing at the last minute. With so many bilingual speakers at Syngenta, Melinda had a list of employees she could go to for translation for the one sentence.
But the person she checks Russian translations with was uncontactable, and this document needed to be published.
Melinda posted on Yammer, asking if anyone could translate Russian for her.
“I put a post on Yammer, “Does anyone speak Russian?” she said.
“Someone came back straight away and said; ‘I do, what do you need?’ I sent them that one line and within half an hour that whole problem had been solved and we didn’t have to spend any money for
it. It was a native Russian speaker that was able to help us out.
“We have that connection now and we use her all the time. I would never have found her in Outlook.”
All Syngenta employees work in regional areas but being a global business they have the same products, branding guidelines and key messages.
“So whenever we come to do a presentation, for example, people always ask if there is something similar out there or has been done before on Yammer to make sure we are consistent in messaging but also so we are not wasting time constantly reinventing the wheel,” Melinda said.
“We use Yammer to really leverage work that has been done before. Someone has often covered the same topic beforehand and already produced slides suitable for the presentation.
“That has been done so often that it’s saving so many hours, you actually could put a business cost against that.”
Sven said the IT department is probably the best at sharing information quickly and saving colleagues time and effort by quickly responding to technical questions, even though the answers may be buried somewhere on the intranet or in an email.
Collaboration culture
Sven and Melinda said Yammer complements Syngenta’s culture of wanting to help each other. Employees genuinely want to collaborate.
“Another reason why Yammer works so well now that we have so many people on the network is the culture here is very much helping each other out,” Melinda said.
“People do want to answer you. You see it a lot on Yammer, people say; ‘I don’t know the answer but this person might’ and they’ll cc that person in.”
“People want to help you and that’s why it works so well for us.”
“Another reason why Yammer works so well now that we
have so many people on the network is the culture here is very much helping each
other out... People do want to answer you. You see it a lot on
Yammer, people say; ‘I don’t know the answer but this person might’ and they’ll
cc that person in.”

48
5 CROSS ENTERPRISE GROUP BENCHMARKING
We have introduced the benchmarking of Yammer groups for the first time this year. We believe groups are where the ‘rubber hits the road’ in generating real business value from Yammer. We are excited to be able to recognize those groups that are leading the way in generating value for their respective organizations through their use of Yammer.
As most Yammer community managers are painfully aware, the majority of groups formed are largely passive. For large organizations we have found that 7 – 12% of groups are responsible for 80% of the activity. Even for smaller organizations 20 – 25% of their groups are responsible for 80% of the activity. In network parlance we call this “the long tail” effect.
Some may be concerned about these figures and might look to introduce more restrictions on group formation. We would counsel against this. Staff should be given the leeway and autonomy to experiment with group formation. Uptake of groups formed “bottom up” can be unpredictable. We believe it is a better use of resources to concentrate on those groups gaining traction, to help them to become even more successful for the business.
The following group benchmarking results will provide group leaders with insights on the quantitative targets that may be appropriate for their respective groups. We appreciate there are many different types of groups, with varied purposes. Specific recommendations beyond target setting is beyond the scope of this report. However, we have commenced a blog series on Groups32, which can be accessed in concert with reading this report. In this blog series we identify the different types of groups that commonly exist on Yammer. We then take each group type and go deeper into “what good looks like” and how you can monitor and measure your way to group success.
5.1 Curiosity within Groups
We introduced our new curiosity measure at the Enterprise level across 55 sites in section 3.4.6.2. Because of the many business contexts that exist across Yammer, it’s important to set curiosity targets accordingly. The following frequency chart identifies the current curiosity index distribution by groups:
32 http://www.swoopanalytics.com/getting-the-best-out-of-online-groups-at-work/

49
Figure 12 - Frequency of Groups by %Curiosity
Curiosity Index (%) Frequency
Across all groups the average curiosity score is 11.8%, with the majority of groups having a curiosity index of < 10%. We think this is a little low if one is looking to generate the deeper levels of conversations required to generate real business value. When we look at curiosity by group size, we do see a movement toward lower curiosity with larger group sizes:
The higher proportion for the ‘team-sized’ groups suggests the questioning relates to co-ordination activities. As the groups grow larger, the questions may become more exploratory and therefore less frequent. For the largest groups, perhaps the group activities are more focused on content sharing than discussion and dialogue. While in general more curiosity is better, there is a limit. For example, if your curiosity index exceeds 50% then it’s likely many questions are going unanswered.
Table 3 - Average Curiosity by Group Size
High ScoreAverage Curiosity
Group Size
6214.2Less than 20 members
5612.4Between 21 and 100 members
8210.6More than 100 members

50
We recommend curiosity targets should be set to exceed the average scores reported here, depending on your group size. Beware though, there is a cap to how high it should go.
Some of the statistically significant correlations do make interesting reading:
Table 4 - Curiosity Index Correlations
Negatively Correlated with Curiosity Index
Positively Correlated with Curiosity Index
‘Likes’ Response RateEngagers
RecognitionDiversity
‘Reply’ Response Rate
Replies/Post
Organizations with a high proportion of our aspirational persona, the Engager, are more curious; as is also the case with higher diversity organizations. This may not be a surprise, but nice to be confirmed in the data. The positive correlations we anticipated with ‘Reply’ Response Rate and Replies/Post also exist.
The negative correlations related to ‘Likes’ and Recognition is perhaps understandable as an over-use of ‘likes’ can be a conversation killer33. Those organizations still in the Social Media maturity phase typically have high scores for these two measures.
What is a good score for the Curiosity Index? Of course, it depends. We could look at Yammer as a learning environment; one where we get to learn from each other. When you go to a seminar or a lecture in a class room there are often common protocols for time allowed for questions. If we set a target at the current average of 14%, then for a one hour talk we would allocate 8.4 minutes for questions. This seems a little short? If we went for the maximum score of 30% we get 18 minutes; perhaps a little long? It really depends on what the learning opportunity is. An IT Help desk group would anticipate a high proportion of questions. A company news group might expect very few. We will explore this further in section 5.2.2.
5.2 Finding the ‘Best Groups’ across All Enterprises
To create a representative set of Yammer groups for analysis we chose to select a short list of groups with more than five members and more than 100 activities (posts, replies, likes) over the selected six-month period. In total 3,125 were short listed and then divided into three groups sizes:
• Less than 20 members (approximates a team)• Between 20 and 100 members (approximates a community)• More than 100 members (approximates an information sharing forum)
To identify the leading groups in each category we then ranked the list according to Cohesion (two-way relationships), Diversity, Group
33 https://www.cmswire.com/digital-workplace/can-the-like-economy-work-inside-the-enterprise/

51
participation (%) and overall activity. As SWOOP does not identify Groups by name, we reached out to the Community managers to find out who the groups were, and whether they were happy for us to acknowledge them in this report.
We want to acknowledge the tremendous achievement of Adopt & Embrace in being named the Global Microsoft Partner of the Year for 2018 in the Teamwork category34. Adopt & Embrace ‘walk the talk’ and our SWOOP analytics can testify to that; with Adopt & Embrace teams being ranked No.1 and No.2 in our list of more than 3,000 most active Yammer groups. Not only that, they took up six of the top 10 ranking places! We feel we have not only validated Microsoft’s choice of Adopt & Embrace as a winner, but at the same time, helped validate our ranking methodology!
5.2.1 SUMMARIZED BENCHMARK RESULTS
The following tables summarize the results for each group size class. We also include the ‘Best/High Score’ results as an example of the extreme results at least one group has been able to achieve. ‘High’ does not always mean ‘best’. As we don’t know the context within which these groups are working, our suggested targets are derived from a combination of these best score results and the scores our group leaders have achieved. Even amongst the leaders there are quite a variety of scores. So pragmatically, it is best to compare yourself with the average result. If you are below the average aim to at least reach that result. If you are above average, look to our recommended targets to set as your group goals.
5.2.1.1 Small Sized Group of less than 20 members
The small sized group was selected to approximate a typical team size. 304 groups were selected, or about 10% of our short-listed groups.
34 https://www.adoptandembrace.com/microsoft-global-partner-of-the-year/
Table 5 - Small Group Benchmark Results
Recommended Target
Best/Highest*
Average
100.0100.070.3Active Users
0.00.041.0Observers*
0.00.010.9Broadcasters*
40.0100.029.3Engagers
20.067.017.7Catalysts
40.0100.042.2Responders
70.0708.435.1Activity/User
0.00.029.7Influence Risk*
70.0100.055.0Reply Response Rate
90.0100.049.3Reciprocity
80.085.154.5Diversity
20.062.014.2Curiosity
*Best in some cases (marked*) are the lowest score

52
5.2.1.2 Medium Sized Group of between 20 – 100 members
The medium sized group was selected to approximate a typical community size. 1,553 groups were selected, or about 49% of our short-listed groups.
Table 6 - Medium Group Size Benchmark Result
Table 7 - Large Sized Group Benchmarking Results
Recommended Target
Best/Highest*
Average
90.0100.046.4Active Users
45.00.071.6Observers*
3.00.06.0Broadcasters*
40.0100.021.7Engagers
30.0100.037.8Catalysts
30.0100.034.5Responders
50.0478.512.8Activity/User
20.00.041.6Influence Risk*
60.0100.052.3Reply Response Rate
60.075.126.5Two-Way
65.084.555.2Diversity
18.056.412.4Curiosity
Recommended Target
Best/Highest*
Average
80.098.839.7Active Users
50.00.076.4Observers*
3.00.03.8Broadcasters*
25.068.017.1Engagers
40.0100.041.9Catalysts
32.097.037.2Responders
40.00.80.3Recognition
200.0727.812.3Activity/User
20.00.040.2Influence Risk*
60.0100.055.8Reply Response Rate
*Best in some cases (marked*) are the lowest score
5.2.1.3 Large Sized Group of More than 100 members
The large sized group was selected to approximate a typical forum size. 1,262 groups were selected, or about 40% of our short-listed groups.

53
Recommended Target
Best/Highest*
Average
40.047.020.5Two-Way
50.080.052.9Diversity
15.082.510.6Curiosity
*Best in some cases (marked*) are the lowest score
5.2.2 CURIOUS RESULTS WHEN MAPPING CURIOSITY TO GROUP PERFORMANCE
Up to this point we have demonstrated that as the groups get bigger the curiosity levels go down. But what happens when we take Group Performance (Two-Way, Diversity, Active Users and Total Activity) into account? We indicated earlier that we could not relate curiosity with performance at the enterprise level. This was not the case at the group level. For each of the group sizes we split them in two, by ranked performance. We then compared the average curiosity scores for the high performers and the low performers for each group size:
The somewhat surprising outcome was that it was only for the small teams sized groups that the top performers asked more questions than the lower performers, as anticipated. For the larger groups it was the lower performers that asked more questions. In fact, the top performers from the large sized groups had the lowest curiosity score of all, with the difference from the lower performers the greatest for all group sizes.
This is a curious result and one that further research is required to fully understand. For the smaller team sized groups, where we associate questioning with co-ordination and co-operation, it makes sense that the better performing groups are asking more questions. But what is going on with the larger groups?
We undertook a correlation analysis for each of the four performance factors with the curiosity scores. The common correlation factor across all group sizes was diversity, which was correlated positively with curiosity for all group sizes. It was the Active Users measure for the larger groups that showed a high negative correlation, that did not exist for the small sized groups. In other words, for larger group sizes; a high percentage of active members is associated with a lower curiosity level.
Table 8 - Curiosity by Group Size and Performance
Average Curiosity
Group Size
15.66Top PerformersSmall Sized Group (< 20 members) 12.72Lower Performers
11.76Top PerformersMedium sized Group (21-100 members) 13.06Lower Performers
8.80Top PerformersLarge Sized group (> 100 members) 12.32Lower Performers

54
Groups with a lower percentage of active members are characterized by a small core and larger gallery of periphery members (readers only, if that). The data indicates that the larger the group, the larger the gap between the core and the periphery.
Figure 13 - Core-Periphery Structure
PERIPHERY
CORE
The larger the groups, the larger the peripheral gallery, compared to the core
Is it the case that in these situations, core members are asking more questions to attract the periphery into the active core i.e. drive higher participation and engagement? Or is it the fact that when a larger gallery exists, the core is more inclined to ask more questions, with an expectation that a better answer might be received? The “Expert Group” type could also explain this effect, where a small core of ‘experts’ is established to answer questions online from a large gallery of group members. Expert groups would not be ranked highly by our group performance criteria, as cohesive and co-operative behaviors are not necessarily sought in this context.
As we have stated earlier, setting curiosity targets is very context specific. Clearly, if your group is an Expert Q&A group, you want as many questions as you can get; but also a high reply rate. An 80% Curiosity score, for instance, means there are a lot of questions not getting answered. Large groups with a high %Active rate i.e. smaller periphery; might be a community of practice, where the majority of members are actively participating in discussions. The question types could be more exploratory, than problem specific. From this discussion we could infer the different types of questioning based on group size:

55
Table 9 -Questioning Styles
CommentaryQuestioning styleGroup Size
High Curiosity suggests greater
agility
Coordinating, Co-operatingSmall team sized group
High Curiosity suggests greater
innovation
Exploring; Validating
Medium community sized group
High Curiosity could indicate poor problem solving (many unanswered questions)
Problem Solving, Q&ALarge Forum sized group
The curiosity index is adding a new dimension to our understanding of Yammer group performance. Creating brand new value through innovation is at the top of our maturity model. Curiosity, along with diversity, could be considered key indicators of an organization’s creativity levels; the first step in being a truly innovative organization. But there are also situations where being over-curious or explorative could lead to insufficient focus on convergence and execution.
5.3 CHAMPION GROUPS
Our benchmarking process allowed us to identify the champion groups within the different size categories. We reached out to the organizational owners of these groups looking for stories of their practices they were willing to share in this report. We acknowledged that some of the identified groups might be private groups or less accessible to the organization’s community managers36. These profiles we consider particularly rich in shared learnings. Without exception, the groups we successfully reached out to for interviews, were pleasantly surprised by their benchmarked performance and were willing and generous in sharing their experiences.
5.3.1 Adopt and Embrace
Adopt & Embrace35 (A&E) is a small Australian consultancy focused on helping organizations adopt and use Office 365. A&E had six of the top 10 in the small groups category, so we were pleased that founder Paul Woods was happy to share his experiences here.
Group/s Context
Here are the names and short descriptions of the A&E benchmarked leading groups:
35 http://www.adoptandembrace.com/
36 We acknowledge 3 Medibank groups and 2 Pepsico groups ranked highly in our medium to large groups sizes; that time did not permit a full profile to be provided. We were advised however that the 3 Medibank groups were supporting front-line operations and that the Pepsico groups were located in Greece.
56
Table 10 - A&E Champion Groups
Space where we “work out loud” – sharing with the team our goals for the day/week – making our work visible so we can help each other in the team achieve what they set out to achieve.
What I am working on?
Our safety channel. We use this to share with the rest of the team that we have safely made it to a customer site after a long drive, post ‘proof of life’ check-ins when you have your two hourly driving break, have made it home after a late night flight home etc.
Check-in channel
A group specifically about our team get-together where we shared resources from presentations, follow up questions etc. (an event-focused group)
A&E Team Week
Our social learning group where we share things we discover, reflect on, lessons learned etc.
Customer connection
Our social learning group where we share things we discover, reflect on, lessons learned etc.
Today I Learned (TIL)
Focused conversation re: on our content marketing / website service catalogue etc.
Content Marketing Central
What worked for the group/s What is apparent from the first two groups is these groups are ‘operational’. They are aligned with a business norm that is not seen as discretionary. As a business norm, participation is expected to be high and activity constant. Rather than being simple reporting systems, A&E has introduced a sense of fun where, for example, in the “check in channel”, if a staff member is taking their compulsory two-hour driving break at a roadside café, they might post a selfie which other staff can respond to. The other leading groups were either event based e.g. “A&E Team Week”, or more discretionary. Again, the strong benchmarked performance suggests a majority of consultants are engaged in all of these groups, i.e. strong cohesion, diversity and participation scores. A&E is also a heavy user of Microsoft Teams. A&E has “customer teams” using Microsoft Teams, where all interactions on a client project are centered. Everything else related to the business is in Yammer. Problems solved A sign of ESN maturity is that real problems are being solved. A common problem most organizations face is the rapid onboarding of new staff. Much of how A&E works is visible within its Yammer groups, so Yammer becomes a key resource for onboarding, not just about how things are done in A&E, but also who to talk to when you have an issue or problem.

57
A story Paul shared was a time when they were experiencing cash flow issues. Like many small businesses, ‘slow payers’ can have a dramatic effect on the cash flow of even profitable businesses like A&E. Paul was able to solicit ideas on Yammer as to how they could best manage this short-term situation, through accessing new opportunities rapidly or deferring some costs. And with the help and creativity of his staff, they were able to quickly overcome this short term challenge. Innovations Shared learnings and how we respond is a good indicator of innovation in action. A&E has a group called “Today I Learned” that specifically provides a space for this. Another innovation example provided was in the “Check-in Channel”, where consultants on the road have been able to access the help of others in the office when travel disruptions had occurred, for example; “I only have five per cent on my phone battery and I need to find a new flight home”. A&E does not have a dedicated travel department. Overall, A&E sustains a working culture that builds trust across the organization. The fact the CEO was prepared to share and receive help on a business issue like cash flow is testimony to that. Group formation is also encouraged, with groups actually outnumbering staff in number. While this might concern many organizations, it is not the case with A&E, and its high diversity scores speak to this. We know that diversity is a key predictor for innovation.
5.3.2 Union of Reform Judaism: Working Out Loud Group 12
The Union for Reform Judaism’s (URJ) success with Working Out Loud (WOL) circles was evident when its “Working Out Loud Group 12” came in as one of the top group performers. The group is facilitated by David Billotti.
Group Context
“WOL Group 12” was formed according to the guidance on WOL circles provided by key proponent John Stepper37. It is a small peer support group in which you build relationships related to a personal goal, using simple structured guides over 12 weeks. Over that time, you develop habits and a mindset you can apply to any goal.
What worked for the group?
This WOL exercise started in January 2018 with a completion time in the March/April time frame. Given our benchmarking took in the period from February through to the end of July, it was clear that WOL 12 did not stop collaborating when its 12 weeks was up. The appointed leader, David Billotti, was quick to inform us that his role was more as a facilitator, than a directing style leader, something he felt contributed to the group performing well. He described the members as an “eclectic bunch”, which he felt also contributed to their performance (and no doubt added to their diversity score). The WOL 12 group was formed as a private space. David felt that this was important to provide a safe space for the members to be more
37 http://workingoutloud.com/en/circle-guides/

58
open and transparent. While in general we are more supportive of open and public groups, we feel that this context is one where a private group is justified.
Problems solved
URJ runs a network of youth groups called NFTY (North American Federation of Temple Youth) with about 10,000 kids as members. Some of the network members were involved in the tragic Florida school shooting incident in April of this year.
One of David’s roles was marketing NFTY and he soon became aware of the youths’ intention to join a national march on Washington DC to demand political action on gun control. David raised the issue in the WOL 12 group and soon learned one of the members was a political advocate in Washington DC, another was responsible for the music for the URJ teenagers’ participation in the march and a third was the event’s organizer, charged with managing the logistics for a URJ pre-march event.
With URJ’s participation being some 5,000 NFTY members, the logistics were clearly challenging. While there were more than their group members organizing the event, David felt that having the group and the safe space on Yammer to vent about the emotionally-charged event helped them effectively collaborate to deliver in six weeks what would normally have taken more than 12 months to achieve.
Innovations A key innovation here is the use of the WOL learning experience to establish connections, leading to trusted relationships that would never have occurred without such an intervention.
Connecting people across a distributed enterprise is a challenge in itself. Non-work groups can often play this role. However, a WOL program is a more direct intervention that not only helps the individuals with their personal goals, but helps build both cohesion and diversity across the enterprise at the same time.
We highly recommend WOL to any organization looking to drive cross enterprise networks and collaboration.
5.3.3 Blue Cross Blue Shield NC: New Media Group
Blue Cross Blue Shield of North Carolina (Blue Cross NC) is a health insurance provider in the United States. Its champion group was the “New Media” group. James LaCorte, Social Media Manager, is the group’s leader.
Group Context
The New Media group began as a small team space for the department by the same name. They leveraged Yammer to be more transparent, initially to build out the weekly team meeting agenda. Over time the team invited employees from other locations to meetings and the Yammer group grew to accommodate this broader group. Often employees from other areas can not make the meeting but are active in the Yammer group to stay connected.

59
What worked for the group? The group started small but once it began @ mentioning others that had an interest in its activities, the group evolved into more of a community. In this way, the group could not only work more efficiently on Yammer, but also engage with the broader community at the same time. They reduced emails by moving emails that included all team members over to Yammer, sharing examples, articles, useful tips, questions and links. Using tags, they created a knowledge base the team references daily.
Before every weekly meeting, the New Media group collaboratively develops a meeting agenda in Yammer. Since incorporating Yammer into this process, now when they meet, they do not waste time going around the table sharing lots of updates. Instead, individuals add the desired topics they want to discuss what they are working on. Team members review the agenda in the meeting upfront, only discussing the updates others have questions on. This allows the group to concentrate on higher level work, like brainstorming or agreeing on group actions.
James said the “pin” feature in Yammer enabled the group to build a bridge between the Yammer conversations and the more formal content held in Sharepoint. In this way, the Yammer group has become the team hub for information. James uses SWOOP to view participation rates of team members to gauge engagement. He also looks at the cross-team collaboration widget, which signals to him how his external stakeholders are engaging with the group. The “Hot Topics” on SWOOP is another James monitors to see how effective the discussions are around topics. Problems solved Employees are asking questions on Yammer and seeking answers to problems. Colleagues are responding with the answers - something that previously was attempted in email, without much success. Employees are proud to post solutions on Yammer and as a result are building their personal brand as experts. Spreading the word about Yammer is a common problem. An innovation Blue Cross NC is using was to form a Yammer champions group, Yambassadors, to share best practices in their own areas and as an advocate to increase use of Yammer across the company. One highly effective use of the Yambassadors is to include them in the new employee onboarding process. As new employees join their area, the Yammbassador connects with the new employee in real life and then posts a welcome message on Yammer to introduce the company to the new employee.
Yammer training is also part of the Blue Cross NC onboarding process. These efforts help new employees quickly learn about the value of Yammer and increase employee engagement.
A problem Blue Cross NC solved with Yammer is with its formal recognition system. Blue Cross NC has a formal system for recording kudos when a staff member is recognized by a peer. But the tool does not easily show who received Kudos in your group. James has

60
undertaken a practice to amplify the recognition through Yammer. A related innovation which came up organically by employees is the Friday “High Five” peer-to-peer recognition, done directly on Yammer, to help with team building. Innovations Coaching executives on how to use Yammer is also a common practice. However, in Blue Cross NC’s case its previous CEO decided to not only share business updates, but to also share random recipes, books read and activities he was involved in. He also quickly realized Yammer was a source for unfiltered information, listening and connecting with various groups to collaborate with employees he may have never personally connected with. He was less concerned about how many replies or likes his posts gained. One of his measures of success was the personal connection he made through Yammer. For example, an elevator ride with the CEO can be uncomfortable, employees tend to look down at their shoes. But since the use of Yammer employees no longer stress about the elevator ride! They can talk to him about the many topics he has share in Yammer.

61
6 TOWARDS A RICHER NETWORK PERFORMANCE MODEL
It has become a practice of ours to include at least one section in our benchmarking report that deals with the future, and where SWOOP’s own R&D is being directed. In last year’s report we addressed the growing need for “Multiple Channels or Toolsets for Collaboration”; where we looked at how our performance framework (Cohesion vs Diversity) could be employed to help match tools to tasks/missions.
Our network performance framework draws from the social sciences, particularly social networks, and therefore not surprisingly, is relationship-centered. The other area of science that is commonly drawn into the collaboration research space is human psychology. The fields are interdependent in that the way we think and behave is closely intertwined with the relationships we choose to form and grow, and vice versa. We are seeing more of the research into team performance identifying factors such as psychological safety and cognitive diversity38 as key contributing factors to collaborative performance. In this light we are looking at how we could enrichen our current performance model with additional psychological-centered factors. The two we have chosen to explore more closely are our “Curiosity Index” and the “Employee Sentiment”.
Figure 14 - SWOOP Sentiment Monitoring
Our Curiosity Index is simply the proportion of posts and replies that are framed as questions. Questions invite responses, and therefore lead to building relationships. Sentiment Analysis is maturing to the point that it is now commonly used to monitor customer feedback on consumer sites. Within SWOOP, sentiment is an optional extra; where Yammer messages are directed to the Microsoft Cognitive Services Text Analysis39 engine, which returns sentiment ratings for every
38 https://www.nytimes.com/2016/02/28/ magazine/what-google-learned-from-its-quest-to-build-the-perfect-team.htm
https://hbr.org/2017/08/high-performing-teams-need-psychological-safety-heres-how-to-create-it
39 https://azure.microsoft.com/en-us/services/cognitive-services/text-analytics/

62
sentence posted back to SWOOP. SWOOP then displays how the aggregated employee sentiment is tracking over time. Increasingly, Sentiment Analysis is being employed to identify movements in employee engagement40. As not all SWOOP clients have chosen to access sentiment analysis, we are providing two levels for an enrichened performance model. The first adds the Curiosity Index to Cohesion and Diversity. The second adds sentiment as well.
6.1 Three Factor Performance Model
By adding curiosity to our current Cohesion/Diversity model, we are opening up a number of important performance characteristics. Without curiosity, we can’t generate new ideas, generate innovations from such ideas or even enact positive change within an organization. Looking inside the organization, there will be a differential interest in curiosity. A department charged with executing tried and tested business processes efficiently may find increased questioning simply a distraction. On the other hand, a strategy and planning department would be recalcitrant if it didn’t develop a questioning culture; and a predisposition for challenging the status quo.
Below we draw from the work of organizational learning icon Peter Senge41 who used archetypes to identify complex systems of behaviors. Identifying with an archetype can provide key insights into how aligned your enterprise, departments or groups are with your objectives and mission.
40 https://www.theatlantic.com/magazine/archive/2018/09/the-secrets-in-your-inbox/565745/
41 https://en.wikipedia.org/wiki/System_archetype
These three single factor archetypes are unlikely to be seen in practice, but we do see some departments and groups approaching these archetypes. On their own none are likely to provide long term business value. If your organization, department or group approaches any of these single factor archetypes you would need to identify what changes may be required to move toward a more constructive archetype.
More regularly we see patterns that prioritize multiple performance factors to differing degrees. The following dual factor archetypes provide a broader scope of productive use.
Figure 15 - Single Factor Archetypes

63
Depending on the business context, we could perceive many productive business contexts for which one or more of these archetypes could prove productive. For example, an agile software development team tends to be staffed with simmilarly skilled members. The uncertainty that requires agile behaviors are usually to do with changing requirements and time frames.
For an organization undertaking a significant, disruptive change; the team charged with orchestrating the change should likely be maximised on all three factors. Even though planning for change could be faultless, change is rarely linear, so having the agility and diversity to react to the unseen or unexpected may be crucial.
Another common context is innovating; the phase at the top of our maturity curve. Your organization may have the diversity and curiosity to generate highly prospective ideas, but without the cohesion of an implementation team, they will remain on the shelf as good ideas unimplemented.
6.2 Four Factor Online Cultural Mapping Model
With the addition of employee sentiment to our three-factor performance model, we believe we have a viable approach for tracking organizational culture changes in close to real-time. As with the four-factor model, archetypes can be devised to describe the different ogranizational cultures being demonstrated.
A radar chart representation can be used to assess the visibility of an operating culture being demonstrated. For example, on the radar chart, high values in two or more factors will identitfy with a visible culture.
Figure 16 - Dual Factor Archetypes

64
On the other hand low scores for all factors would imply an invisible and a more likely toxic culture existing.
In practice, we find that on Yammer, lower sentiment scores tend to reflect shorter, sharper and sometimes more challenging language, rather than offensive or abusive language. In the right context, therefore, low sentiment scores could be appropriate e.g. when a team is co-ordinating a time-critical task online.
Figure 17 - Online Cultural Mapping
Figure 18 - Formal Department Sub-Cultures
6.2.1 SUB-CULTUES ALIGNED FOR FORMAL ORGANIZATIONAL STRUCTURE
We have now conducted a number of culture mapping trials with SWOOP clients that have sentiment turned on. The earliest insight was that when we mapped the formal business units, their culture maps reflected the role the specific department played in the organization. The representations below have been generalized for confidentiality reasons.
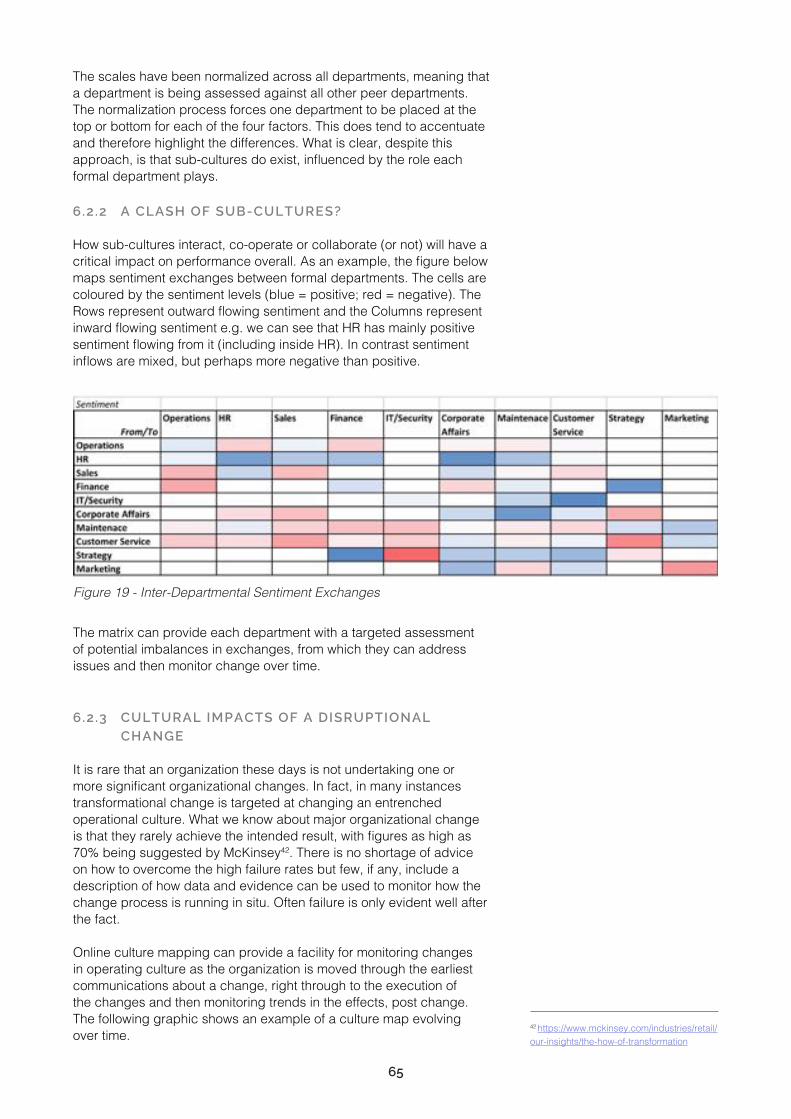
65
The scales have been normalized across all departments, meaning that a department is being assessed against all other peer departments. The normalization process forces one department to be placed at the top or bottom for each of the four factors. This does tend to accentuate and therefore highlight the differences. What is clear, despite this approach, is that sub-cultures do exist, influenced by the role each formal department plays.
6.2.2 A CLASH OF SUB-CULTURES?
How sub-cultures interact, co-operate or collaborate (or not) will have a critical impact on performance overall. As an example, the figure below maps sentiment exchanges between formal departments. The cells are coloured by the sentiment levels (blue = positive; red = negative). The Rows represent outward flowing sentiment and the Columns represent inward flowing sentiment e.g. we can see that HR has mainly positive sentiment flowing from it (including inside HR). In contrast sentiment inflows are mixed, but perhaps more negative than positive.
The matrix can provide each department with a targeted assessment of potential imbalances in exchanges, from which they can address issues and then monitor change over time.
6.2.3 CULTURAL IMPACTS OF A DISRUPTIONAL CHANGE
It is rare that an organization these days is not undertaking one or more significant organizational changes. In fact, in many instances transformational change is targeted at changing an entrenched operational culture. What we know about major organizational change is that they rarely achieve the intended result, with figures as high as 70% being suggested by McKinsey42. There is no shortage of advice on how to overcome the high failure rates but few, if any, include a description of how data and evidence can be used to monitor how the change process is running in situ. Often failure is only evident well after the fact.
Online culture mapping can provide a facility for monitoring changes in operating culture as the organization is moved through the earliest communications about a change, right through to the execution of the changes and then monitoring trends in the effects, post change. The following graphic shows an example of a culture map evolving over time.
Figure 19 - Inter-Departmental Sentiment Exchanges
42 https://www.mckinsey.com/industries/retail/our-insights/the-how-of-transformation

66
Figure 20 - Culture Mapping Over Time
Positive culture; constructive exploration
Continued very positive culture
Reduced exploration;
more focus on execution
Nearly a total focus on execution
Execution focus exchanged for strong
questioning and a reduction in
sentiment
In the first month (February), the culture is a positive one. The maximum scores for Diversity and Curiosity imply a strong exploration focus; positive sentiment in the discussions and a healthy Reciprocity, which is a good proxy for work getting done. March continues this positive culture across all four factors. In April we see a reduction in exploration (lower curiosity and diversity) and a reinforced execution focus (high reciprocity and sentiment). By May the execution focus is even more pronounced, virtually no exploration but the high sentiment suggests the execution focus is positive and constructive. The June result shows a dramatic change. The execution focus has been replaced by one of intense questioning (high curiosity). Sentiment has also reduced. In effect, work has stopped and the organization looks like it is moving into a state of disarray. This is a red flag. How should the organization respond?43
You can see that ‘events’ can have significant and rapid changes to how staff behave and interact. Often these ‘event’ impacts may not have been anticipated at all. The effect though can be swift and damaging. An anticipated disruptive change like a major restructure will in all likelihood have some negative impact on the operating culture. That’s just human nature. However, if the organization is able to monitor effects throughout the change process, it is better placed to avoid the wild negative swings that can undermine the whole change process.
While it is still in its early stage, we are being encouraged by feedback from our pilot studies, especially in the way the cultural mapping accurately reflects the formal business units. It is commonly claimed that effective collaboration is more about people and culture than the technology itself. We are encouraged by what we have been able to achieve so far and look forward to being able to bring these more human/cultural insights to your SWOOP dashboard.
43 This series of culture maps uses real client data from a Yammer site.

67
In this third and largest benchmarking of Yammer networks, we are pleased to report the maturity of Yammer usage is still growing at a healthy rate. We are aware that Yammer is considered in some quarters as an ageing platform with faltering enterprise-level support. We see no evidence of this. In fact, we see that since the introduction of Yammer as part of the O365 suite, many more Yammer sites are coming into our benchmarking; and as an overall group, maturing in their use. Mature users of Yammer are demonstrating enterprise-wide value generation, whether it’s through difficult and complex problems being solved or new value generated through innovation.
Despite these promising results, it must be said that the majority of our benchmark partners have yet to grow and populate their core of Yammer participants to the level that can achieve a true enterprise-wide impact. We are confident the growth trajectory is such that a growing number of Yammer users will reach that level in the near term.
We can’t finalize this report without commenting on what we believe the impact of Microsoft Teams might be on Yammer usage. Our data suggests about 10% of current active small Yammer groups will be more appropriately serviced by Microsoft Teams. There may be a higher proportion of all groups that will find Microsoft Teams more attractive; but these Yammer groups currently are not rated as high performing Yammer groups (part of the long tail of Yammer groups), and therefore their loss is not likely to impact on Yammer’s overall contribution to the Enterprise. In fact, we believe the ceding of Yammer team activity to MS Teams will result in a stronger focus for Yammer on the important Enterprise-wide initiatives.
We remind readers of this report that many more specific topics, and in particular those relating to different Yammer group types, are addressed on our SWOOP Blog44. We also welcome your feedback on our SWOOP for Yammer User Community - https://www.yammer.com/swoopusercommunity45.
7 FINAL WORDS
44 http://www.swoopanalytics.com/blog/
45 https://www.yammer.com/swoopusercommunity

68
ABOUT THE AUTHORS
Dr. Laurence Lock Lee46 is the Co-founder and Chief Scientist at SWOOP Analytics47 and also Co-founder of Social Network Analysis Consulting firm Optimice48. He is an experienced professional, with over 40 years’ experience as a researcher, technology leader, educator and management consultant. Dr Lock Lee is one of world’s leading practitioners in Social Network Analysis for organizational change, having conducted more than 100 consulting assignments for clients around the world. He holds a PhD on corporate social capital from the University of Sydney. In the 1980s, at BHP Research, he led the largest private sector Artificial Intelligence laboratory in Australia. He also previously led the national Knowledge Management consulting practices at BHP Information Technology (BHPIT) and at Computer Sciences Corporation (CSC). Dr Lock Lee has published two books and numerous journal and industry articles. He is a regular contributor to CMSWire49 and blogs at SWOOP Blog50.
Sharon Dawson is SWOOP's Director, External Relationships & External Communication. She is experienced in media and communications, having spent more than a decade working for Australian Associated Press (AAP) in the Sydney, Canberra and London bureaux. Sharon has covered Olympic and Commonwealth Games, worked in the Australian federal press gallery, reported on Australian federal elections and been a sports correspondent for many years. Prior to moving to the United States, Sharon worked as a Communications Officer for a NSW State Government Department. She joined the SWOOP team in 2017 as it expanded into the US. Sharon holds a Bachelor of Arts (Communication Studies) from The University of Newcastle.
46 https://www.linkedin.com/in/llocklee/?ppe=1
47 http://www.swoopanalytics.com/
48 http://www.optimice.com.au/
49 http://www.cmswire.com/author/laurence-lock-lee/
50 http://www.swoopanalytics.com/blog/

© 2018 SWOOP Analytics. All rights reserved. SWOOP Analytics is a registered trademark.