yan y. kagan dept. earth and space sciences, ucla, los angeles, ca 90095-1567,...
TRANSCRIPT

Yan Y. Kagan
Dept. Earth and Space Sciences, UCLA, Los Angeles,
CA 90095-1567, [email protected], http://eq.ess.ucla.edu/~kagan.html
EARTHQUAKES: Statistics, Models, Testable Forecasts
http://moho.ess.ucla.edu/~kagan/Extr13.ppt

Outline of the Talk
• Tohoku M9 2011 earthquake -- extreme disaster.
• Long- and short-term seismicity rate forecasts in NW Pacific (Tohoku area) region.
• Statistical analysis of earthquake occurrence – earthquake numbers, spatial scaling, earthquake size, time, space, and focal mechanism orientation statistical distributions.
• Current global earthquake forecasts and their testing.

1. Modern earthquake catalogs include origin time, hypocenter location, and second-rank seismic moment tensor for each earthquake.
2. The moment tensor is symmetric, traceless, with zero determinant: it has only four degrees of freedom -- the norm of the tensor and the 3-D orientation of the focal mechanism (quaternions are used to model).
3. An earthquake occurrence is controlled by power-law (stable) distributions.
Earthquake Phenomenology


Seismicity: Turbulence of Solids, Nonlinear Science
Today, 2, 1-13, 1992.

World seismicity: 1976 – 2012 (Global Centroid Moment Tensor catalog)

http://bemlar.ism.ac.jp/wiki/index.php/Bird%27s_Zones

Losses from 2011 Tohoku (Japan) M9 earthquake
• Close to 20,000 dead and more than $300 billion (perhaps close to one trillion – $10^12) in economic losses.
• However, the number of casualties is more than 10 times fewer than for the 2004 Sumatra earthquake of similar magnitude.
• If an appropriate alarm has been issued in the first few minutes after the earthquake, the casualties may be reduced by a factor of 10 (Kanamori, 2011).

Tohoku M9 earthquake and tsunami


Lay, T., and Kanamori, H., 2011. Insights from the great 2011 Japan earthquake, Phys. Today, 64, 33-39.
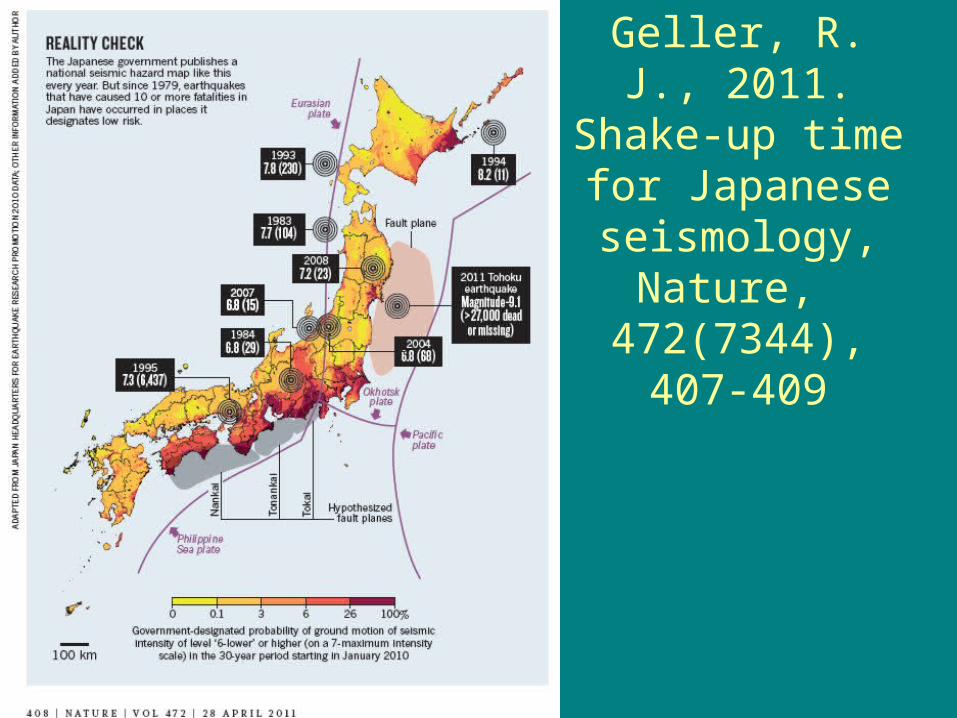
Geller, R. J., 2011.Shake-up time for
Japanese seismology,
Nature, 472(7344), 407-409

Simons, M. et al., 2011. The 2011 magnitude
9.0 Tohoku-
Oki earthquake: mosaicking
themegathrust
from seconds to centuries,Science,
332(6036), 1421-1425

2011 Tohoku earthquake
Maximum size estimates for subduction zones relevant for Tohoku (Japan) M9 earthquake:
1. Historical/instrumental seismicity record (M7.7 maximum magnitude predicted).
2. Statistical method (likelihood optimization).
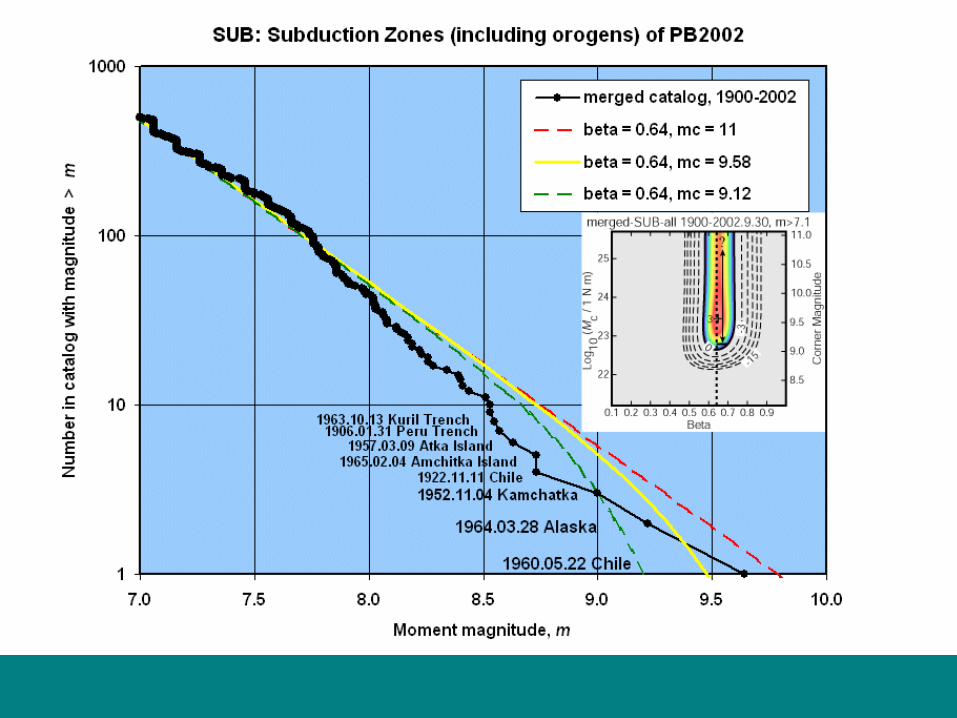
3. Moment-conservation method (tectonic versus seismic moment rates) -- calculations for Flinn-Engdahl zones.
Long- and short-term seismicity rate forecasts in Tohoku region.

thresholdmagnitude
95%-confidencelower limit
95%-confidencelower limit
not to betaken
literally!(“a largenumber”)
95%-confidenceupper limit

Review of results on spectral slope,
Although there are variations, none is significant with 95%-confidence.Kagan’s [1999] hypothesis of uniform still stands.


Flinn-Engdahl seismic regionsWhy select them? Regions were defined before GCMT catalog started (no selection
bias), and it is easier to replicate our results (programs and tables available).

DETERMINATION OF MAXIMUM (CORNER) MAGNITUDE: AREA-SPECIFICMOMENT CONCERVATION PRINCIPLE
Seismic moment rate depends on 3 variables --1.The number of earthquakes in a region (N),2.The beta-value (b-value) of G-R relation,3.The value of maximum (corner) magnitude.
Tectonic moment rate depends on 3 variables -- 1. Width of seismogenic zone (W – 30-104 km),2. Seismic efficiency coefficient (50 -- 100%),3. Value of shear modulus (30GPa -- 49GPa).
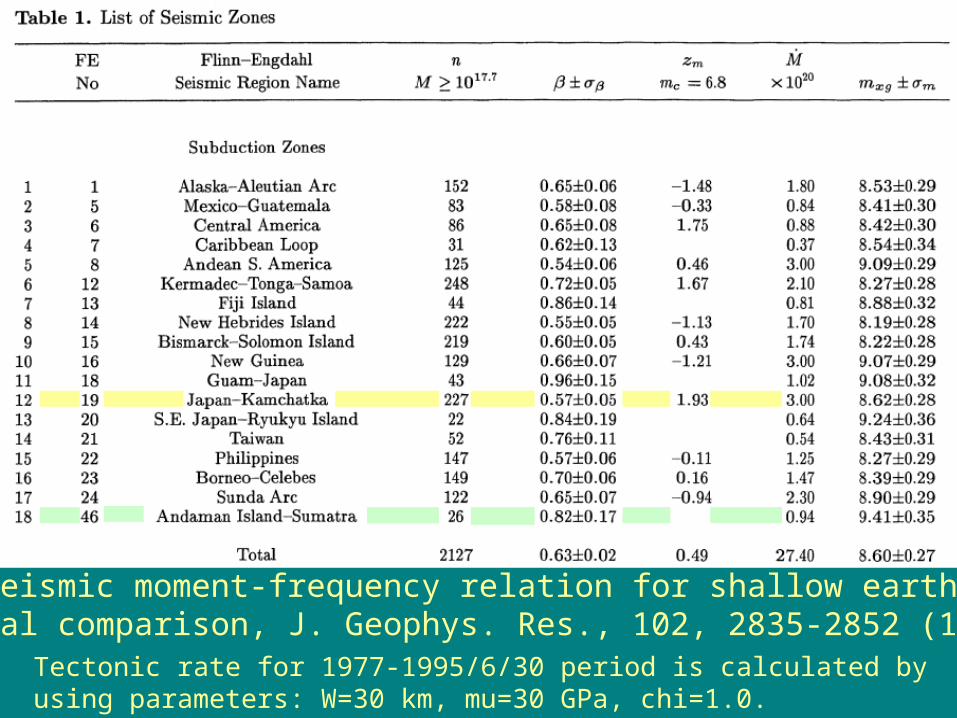
Kagan, Seismic moment-frequency relation for shallow earthquakes: Regional comparison, J. Geophys. Res., 102, 2835-2852 (1997).
Tectonic rate for 1977-1995/6/30 period is calculated by using parameters: W=30 km, mu=30 GPa, chi=1.0.

Tectonic rate for 1977-2011 period is calculated by using Bird & Kagan (2004) parameters: W=104 km, mu=49 GPa, chi=0.5

Beta values for 1977-2011 in Flinn-Engdahl zones


For the Tohoku area the approximate recurrence interval for magnitude
M>=9.0 earthquakes is on the order of 350 years

For the Tohoku area the approximate recurrence interval for magnitude
M>=9.0 earthquakes is on the order of 350 years


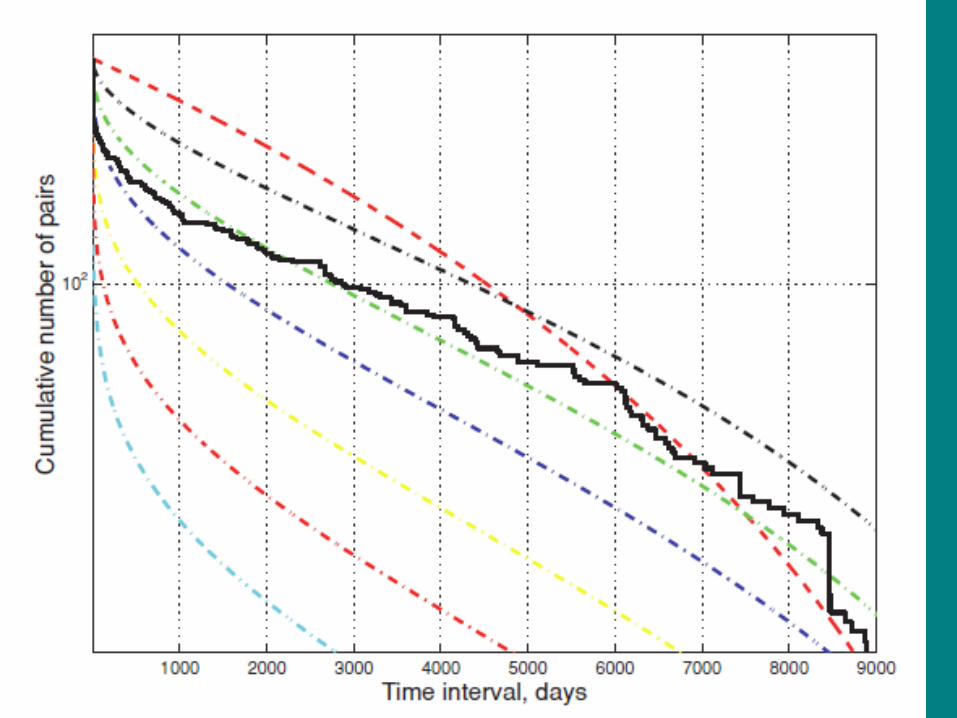
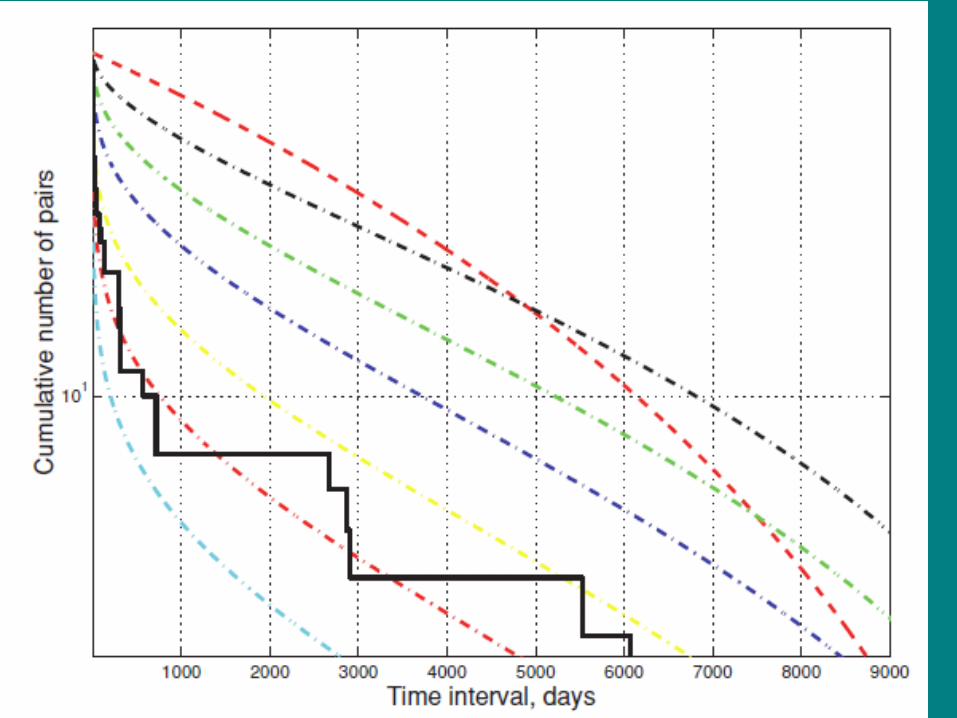
Log aftershock zone length against magnitude, 1977-2000

Log aftershock zone length against magnitude, 1977-2013


Jackson, D. D., and Y. Y. Kagan, 1999. Testable earthquake forecasts for 1999, Seism. Res. Lett., 70, 393-403.
Combined long- and short-term forecast for north- and south-western Pacific area

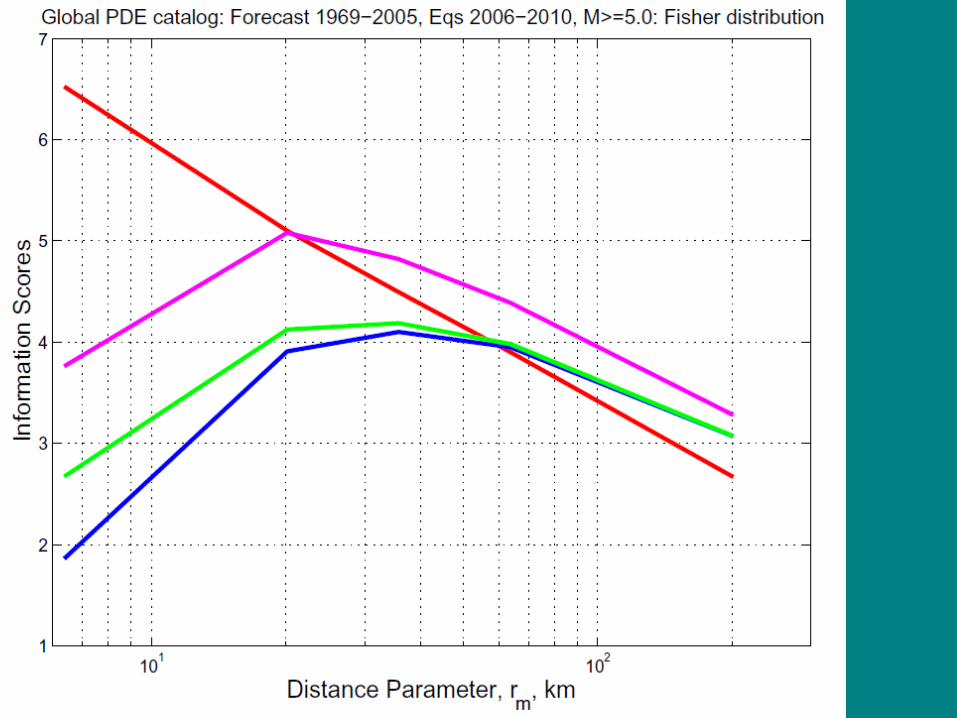
Focal mechanism forecast

Error diagram tau, nu for global long-term seismicity (M
> 5.0) forecast. Solid black line --
the strategy of random guess. Solid thick red
diagonal line is a curve for the
global forecast. Blue line is earthquake
distribution from the PDE catalog in
2004-2006 (forecast);
magenta line corresponds to
earthquake distribution from
the PDE catalog in 1969-2003
Earthquake forecast conclusions• We present an earthquake forecast program which
quantitatively predicts both long- and short-term earthquake probabilities.
• The program is numerically and rigorously testable both retrospectively and prospectively as done by CSEP (Collaboratory for the Study of Earthquake Predictability) worldwide, as well as in California, Italy, Japan, New Zealand, etc.
• It is ready to be implemented as a technological solution for earthquake hazard forecasting and early warning.

END
Thank you

The aim of this work is the comprehensive and methodologically rigorous analysis of earthquake occurrence. Models based on the theory of the stochastic multidimensional point processes were employed to approximate the earthquake occurrence pattern and evaluate its parameters. We show that most of these parameters have universal values. These results help explain the classical earthquake distributions (Omori's law and the Gutenberg-Richter relation) and the fractal correlation dimension for spatial distributions of earthquake hypocenters was determined. We also investigated the disorientation of earthquake focal mechanisms and showed that it follows the rotational Cauchy distribution. These statistical and mathematical advances made it possible to produce quantitative forecasts of earthquake occurrence.As an illustration of extreme consequences of earthquakes and the possibility of their forecasting we consider three problems related to the 2011 Tohoku, Japan mega-earthquake: (1) how to evaluate the earthquake maximum size especially in subduction zones and why the event size was so grossly under-estimated for the Tohoku area; (2) what is the repeat time for the largest earthquakes in this region; (3) what are the possibilities of numerical long- and short-term forecasts during the 2011 earthquake sequence in the Tohoku area. We discuss the quantitative methods which are available to answer these questions. We show that for all the subduction zones the maximum moment magnitude is of the order 9.0--9.7, and for major subduction zones the maximum earthquake size is statistically indistinguishable.
Abstract

Kagan, Y. Y., and D. D. Jackson, 1995. New seismic gap hypothesis: Fiveyears after, J. Geophys. Res., 100, 3943-3959.
N test (events number) L test (events location likelihood)R test (likelihood comparison of models)