year ended march 31, 2009 nissin foods holdings · instant noodle product. in 2009,...
TRANSCRIPT

AnnuAl RepoRt 2009Year ended March 31, 2009
nISSIn FooDS HolDInGS

nISSIn FooDS HolDInGS Co., ltD. and its seven principal companies (together,
“the NISSIN FOODS Group”) believe that there should be no borders to the
enjoyment of good food. In 1958, Nissin Chicken Ramen became the world’s first
instant noodle product. In 2009, customer-focused branding based on originality,
convenience and responsibility is enabling us to develop innovative and fun food
for the potential satisfaction of people everywhere on Earth.
01 PhilosoPhy02 Branding CorPoration10 FinanCial highlights11 President’s Message16 review oF oPerations20 Quality and saFety21 environMental aCtivities
22 soCial ContriBution aCtivities24 CorPorate governanCe and CoMPlianCe26 Board oF direCtors and oFFiCers27 FinanCial seCtion58 worldwide network60 CorPorate data61 investor inForMation
Contents

“Earth Food Creator” expresses the corporate philosophy
of NISSIN FOODS Group, a company that creates food for
people all over the world. “Earth Food Creator” also refers
to a company that respects and draws on the bounty
of nature for wholesome ingredients that are served up
in innovative products our customers find to be tasty,
convenient and thoroughly enjoyable.

BRAnDInGCoRpoRAtIon
02 nISSIn FooDS HolDInGS Co., ltD.

The NISSIN FOODS Group aspires to create and develop market-leading brands
in our chosen food product categories for markets around the world—in other
words, to be a Branding Corporation. To realize this vision, in 2008 the Group
established 11 profit centers, consisting of seven operating companies in Japan
and four overseas business regions, to maximize the Group’s corporate contri-
bution on the basis of a more flexible, efficient and responsive management.
03nISSIn FooDS HolDInGS Co., ltD.

RIGINALOCuStomeRS ReCoGnIze
tHAt tHeRe CAn
only eveR Be one
oRIGInAl. BeInG tHe
FIRSt ADDS vAlue to
ouR BRAnD.
04 NISSIN FOODS HOLDINGS CO., LTD.

05NISSIN FOODS HOLDINGS CO., LTD.
Cup nooDle is another Nissin original. We invented the concept of noodles
packaged, prepared and eaten in the same container so people could eat when-
ever and wherever they were hungry, bowl or no bowl. If there is an improvement
to be made, a way to make things safer, a new food product concept, we want
to be the first—the one and only ORIGINAL.

CGo FAn, new flavored rice products cook in a microwave oven with the addition
of only tap water. Consumers tell us that the flavor and texture are just like
homemade, but preparation takes a fraction of the time—especially when you
consider the normal cooking time for rice. When we make food more convenient,
we don’t want to diminish the quality.
06 NISSIN FOODS HOLDINGS CO., LTD.

onvenientCmAkInG pRoDuCtS tHAt mAke lIFe
eASIeR GIveS ouR CuStomeRS moRe
FRee tIme At tHe oFFICe,
outDooRS AnD At Home.
07nISSIn FooDS HolDInGS Co., ltD.

esponsibletHeRe IS no Room FoR CompRomISe wHen It ComeS to ASSuRInG FooD SAFety AnD A SuStAInABle envIRonment.
08 NISSIN FOODS HOLDINGS CO., LTD.

09NISSIN FOODS HOLDINGS CO., LTD.
HeAltHFul FooD enJoyment is the primary aim of every plan and process
at NISSIN FOODS Group. We are tackling initiatives to ensure food safety and
environmental protection—two preconditions to the preparation and enjoyment
of delicious food. We monitor raw and processed food under the strictest stan-
dards and work to achieve a recycling-based society that will be the pride of
generations to come.

FinanCialhighlights
NissiN Foods HoldiNgs Consolidated sales by Category (Years ended March 31)
(Millions of yen) 2009 2008 2007■ Instant Noodles
■ Pillow-type Instant Noodles ¥ 58,447 ¥ 64,915 ¥ 57,871
■ Cup-type Instant Noodles 214,831 237,537 226,315
■ Chilled and Frozen Foods 49,559 44,369 41,282
■ Other Business 39,220 38,649 32,770
Total 362,057 385,470 358,238
NissiN Foods HoldiNgs Consolidated sales by geographic Area (Excluding Intersegment Sales) (Years ended March 31)
(Millions of yen) 2009 2008 2007■ Japan ¥ 311,954 ¥ 329,984 ¥ 303,718
■ North America 26,126 29,559 30,505
■ Others 23,977 25,927 24,015
Total 362,057 385,470 358,238
For the year Net sales Operating income Net income
At year-end Total assets Net assets*2
Per share (Yen and U.S. dollars)
Net income Cash dividends applicable to earnings of the year
Net assets
Value & performance indicators Operating margin (%) *3
Return on assets (%) *4
Return on equity (%) *5
Inventory turnover (Times) *6
Years ended March 31,
(6.1) (14.9) 16.9
4.1 (1.1)
16.9
—
(1.0)
%
$ 3,686240162
$ 4,161 2,907
$ 1.32
0.51
23.28
2009
¥ 358,23833,73518,969
¥ 410,407 288,476
¥ 156.12
50.00
2,304.40
9.44.97.0
12.9
2007
Notes: 1. U.S. dollar amounts represent translations of yen, for convenience only, at U.S.$1 = ¥98.23, the approximate rate prevailing on March 31, 2009. 2. Net assets: In compliance with the Corporate Law, from fiscal 2007, net assets include minority interests. 3. Operating margin = Operating income / Net sales 4. Return on assets = Net income / Average total assets 5. Return on equity = Net income / Average total net assets 6. Inventory turnover = Cost of sales / Average total inventory
¥ 362,05723,55215,891
¥ 408,729 285,569
¥ 129.98
50.00
2,287.21
6.54.05.7
13.5
2009 2008
¥ 385,47027,67213,591
¥ 392,695 288,844
¥ 111.17
50.00
2,310.36
7.23.44.8
13.4
Millions of yenMillions of
U.S. dollars Percentchange
Forward-looking Statements
This report contains forward-looking statements regarding the Company’s plans, outlook, strategies and results for the future that are based on management's estimates, assumptions and projections at the time of publication. Certain risks and uncertainties could cause the Company’s actual results to differ materially from any projections presented in this report. These risks and uncertainties include, but are not limited to, the domestic and international economic circumstances surrounding the Company’s businesses, competitive activity, related laws and regulations, product development programs and exchange fluctuations.
16.2%10.8%
6.6%
7.2%
13.7%
59.3%
86.2%
10 NISSIN FOODS HOLDINGS CO., LTD.
*1

President’sMessage
NISSIN FOODS HOLDINGS was first out of the gate with the world’s original instant noodles in 1958. Fifty years later, the industry we launched is still opening up new markets around the world. To win hearts in each of those markets, we strive to out-distance the competition not only through innovation, but also through our commitment to deliver the ultimate in food safety and customer enjoyment.
to Be numBeR
one President
Koki Ando
11nISSIn FooDS HolDInGS Co., ltD.

On October 1, 2008, our 50th anniversary, NISSIN FOODS HOLDINGS CO., LTD. (“the Company”) imple-mented a transformation to a holding company structure. We are embarked on a new course, suited to the times and in pursuit of the unlimited potential of food.
Review of Business Performance
In the year ended March 31, 2009, the Company posted consolidated net sales of ¥362,057 million (U.S.$3,686 million), a 6.1% decrease from the previous year. Numerous factors contributed to the sales decline, including a drop off in selling power resulting from the first price increase in 17 years, sharp yen appreciation, a change in the sales mix caused by factors such as open pricing*, a sales decline caused by a transferred odor problem and a global recession triggered by the economic crisis in the U.S. Operating income fell by 14.9% year on year to ¥23,552 million (U.S.$240 million). The decrease is at-tributable to factors including higher expenses related to retirement benefits, higher manufacturing costs due to soaring prices of flour and other raw materials, the sales decline and advertising costs to publicize a product recall and correct product storage methods.
* Open pricing is a method of pricing by which the manufacturer does not include advertising and promotion costs in shipping prices and does not decide suggested retail prices. Ordinarily, open pricing leads to selling at low prices.
In the Food Industry, Economic Recession is an Opportunity for Growth
The year under review brought an unprecedented business environment in which we had to cope with both inflation and deflation in a single fiscal year. The first half began with sharp inflation in the prices of oil and flour and other raw materials, and in the second half, Japan’s economy saw deflationary trends in prices of consumer goods. To cover the higher prices for raw materials, in January we felt it was unavoidable that we raise prices for instant noodles in Japan, the Company’s mainstay products—the first increase in 17 years. To ac-complish this, we implemented a sales policy for these products that enabled retailers to sell them at ap-propriate prices with the aim of bringing market prices, which had fallen too far, in line with brand value. We simultaneously expanded the range of products sold under an open price system, to satisfy the needs of those retailers and consumers who demand everyday-low-pricing or uniform ¥100 pricing. These measures to support the market price of flagship products, while also allowing open pricing on other products proved successful. We were able to secure an increase in operating profit, excluding retirement benefits expenses, amid sharp increases in raw materials costs.
Product Quality Enhancements Necessary to Protect Brands
Amid what has been called a “once in a hundred year recession,” we undertook quality improvements appropriate to the times for products for which we implemented price increases, even as we offered other items intended to sell at low prices. The low-priced products are open price products and products developed jointly with retailers or private brands. An example of a quality improvement is the switch from styrofoam to the paper ECO cup as the pack-aging material for Cup Noodle, our mainstay product. Paper-based packaging materials make it pos-sible to reduce flavor loss by better sealing out moisture, and they reduce CO2 emissions. With regard
President’sMessage
12 nISSIn FooDS HolDInGS Co., ltD.

to Donbei Japanese-style noodles, we perfected a “straight noodle technology” that made it possible to convert wavy noodles to completely straight ones 32 years after the product’s introduction. Also, as an experiment, we introduced Cup Noodle Light, a new product having only 198 calories that offers the same flavor as regular Cup Noodle, which has 364 calories. The introduction enables us to recommend Cup Noodle Light to customers who watch their calories.
Consumer Safety Increased: the Transferred Odor Problem and an Improved Paper Cup
The food products industry faced another major problem in 2008. A spate of news reports involving tampering with food products and food mislabeling shook consumer confidence in food products, and consumer wariness about food safety and quality increased. The NISSIN FOODS Group (“the Group”) experienced a problem in October when odor from insect repellent was transferred to a subsidiary’s product. It turned out that the problem was caused by the way the customer stored the product and not a problem in the manufacturing, distribution or retailing processes. Nevertheless, we believe that as a manufacturer with a well-known brand, we should take responsibility for our products until the time of consumption. We ran advertising promoting to customers the optimal product storage methods. We also improved the Cup Noodle container by changing to a new composition with improved sealing, en-suring that odors will not be transferred under any circumstances. For a brand manufacturer, damage to a brand can be a life-or-death matter. A product that is not safe is not a food product. We check and double check the meat, leeks, eggs, shrimp and flour we use in our products. We are exceptionally care-ful about our quality control because it benefits no one, not even competitors if defects are found in our products. That’s what brand management is all about. We are very sensitive to this, and it is probably fair to say that no other company in the processed food industry is more sensitive about safety than us.
Overseas Markets—Improved Profitability in North America and Market Expansion in Russia
Although we recorded a loss of ¥1,482 million (U.S.$15 million) in the full year results for North America, in fact we recorded the first quarterly profit in several years in the fourth quarter. Until re-cently, selling prices had fallen altogether too low. At a time of soaring prices of crude oil and wheat and other raw materials, we took the opportunity to raise prices. Products with selling prices of about a dollar began to sell well, among them CHOW MEIN, Souper Meal and Bowl Noodles (spicy and sour noodles in lemon and lime flavor containing red pepper). In Japan we offer not only the cup-type products such as Cup Noodle, but also a wide variety of products in bowls and fried-type noodles, and similar product range development has finally begun in the U.S. We have entered into a business alliance in Russia, the only BRICs market that we had not yet entered. Total annual demand for pillow-type instant noodles in Russia has grown to approximately two billion servings, or about 14 servings per person. Russia, together with the Ukraine and other surrounding countries, represents a promising new market with a population of about 300 million. Accordingly, in December 2008 we entered into an agreement for a capital alliance with ANGLESIDE LIMITED (currently, MAREvEN FOOD HOLDINGS LIMITED), parent company of LLC Mareven Food Central, Russia’s largest instant noodle maker. As our equity position is currently 14.9%, the com-pany is not yet an equity method subsidiary. Through this alliance with a leading manufacturer, we anticipate synergy over the medium to long term to increase corporate value for both parties.
13nISSIn FooDS HolDInGS Co., ltD.

President’sMessage
14 nISSIn FooDS HolDInGS Co., ltD.
NISSIN FOODS as a Branding Corporation
The Group aims to be a Branding Corporation, which we define as a conglomerate that creates and develops market-leading brands in our chosen food product categories. The Group has many brands in product lines including instant noodles, chilled food products, frozen food products, cereal products, confectionaries, and lactic acid bacterial beverages. We seek to be a Branding Corporation that can cre-ate numerous brands loved by customers for years to come. To realize this vision, in October 2008, we shifted to a holding company structure and launched the Group consisting of seven operating companies in Japan and four overseas business regions. By in-creasing the number of presidents from one to 11, we aim to establish a business structure that can maximize the Group’s overall corporate value through the operating company presidents on the basis of a more flexible, efficient management system. A characteristic of this corporate structure is that the holding company is positioned below the operating companies so as to support the 11 companies that have profit center responsibility.
Growing and Profiting Together with Stakeholders
The Company constantly strives to boost the Group’s earning potential. We recognize that the enhance-ment of corporate value and appropriate shareholder returns are the most important management priori-ties and have formulated a basic policy of providing continuous and stable shareholder returns. In accor-dance with this policy, we will continue to aim for a full-year dividend payout ratio of 30%, and we plan to pay an annual dividend of ¥50 (U.S.$0.51) for the year under review. The structure of the instant noodles business is such that business performance doesn’t deteriorate substantially as a result of economic recession. The food products sector has always been called a de-fensive sector, and it is a stable business provided major accidents can be avoided. The global economy may be in recession, but we consider this a time of growth. We will continue to reward the expectations and confidence of our stakeholders by pursuing global business development centered on our brand business. I ask your continued support and encourage-ment in the years to come.
We seek to be a Branding Corporation that can create numerous brands loved by customers for years to come.
“”

15NISSIN FOODS HOLDINGS CO., LTD.
pRoDuCtS wItH GloBAl tASte can bring more color and fun to tables
everywhere. Although we originated instant noodles in Japan, they were
always meant to be a world food. And, today they are fast becoming so.
But, with so many cultures and so many interpretations of great taste, we
are now exploring new foods and new themes for existing foods to realize
a higher level of enjoyment.
Worldwide debut ofCucina della Nissin It is a new line of instant pasta products based on our “straight noodle” technology, released simultaneously in the Americas, Asia and Europe in April 2009. The name means “ Kitchen” in Italian.
woRlDwIDe

Review of PerformanceIn the results for pillow-type instant noodles in Ja-pan, the NISSIN FOODS Group (“the Group”) en-gaged in a number of marketing initiatives, includ-ing the launch of products commemorating the 50th anniversary of the founding of Nissin Foods. A notable example from the Chicken Ramen se-ries, launched 50 years ago, is W (Double) Tamago Pocket, a product reintroduced with improved egg preservation performance. Also, sales of the MYOJO HYOUBANYA series of open price prod-ucts and products developed jointly with retailers increased sharply in keeping with an increase in consumer thriftiness. In developments related to the mainstay Cup Noodle series, the Group improved its new environment-friendly paper ECO cup. We also introduced a num-ber of new products, notably microwavable Range Style products that can be prepared using tap water and Cup Noodle Light, a low-calorie product that has the same flavor as the regular product. Further-more, we endeavored to increase brand value by replacing the noodles in Nissin-no-Donbei series with straight noodles that more closely resemble traditional hand-rolled noodles and by reintroducing Nissin Yakisoba U.F.O. with improvements such as increased volume. MYOJO Kiwamen, a product with superb mouth-feel produced using super non-fry preparation technology, has caught the attention of the public,
and sales are steadily increasing. This product has been a success at convenience stores, where sales volumes increased even after the price revision. Nevertheless, overall sales volumes in Japan de-creased as a result of factors including the impact of limiting the discount sales of mainstay products, the transferred odor problem and lower unit selling prices attributable to a higher proportion of open price product lines in the sales mix. Meanwhile, revenue from overseas decreased, owing to the im-pact of exchange rates, notwithstanding favorable sales of existing products in North America.
Future DirectionAmid sweeping change in the market environment, notably slumping consumption and erratic fluctua-tion in raw materials prices, the Group plans to cope with the fragmentation of consumer needs into distinct purchase behaviors driven by quality, price and novel technologies or concepts. The so-lution is to divide products into three product cat-egories: Core brands, Price brands and Concept brands. The Group will pursue higher customer satisfaction through new efforts that emphasize the enhancement of noodles and ingredients using new technologies, the expansion of product lines that offer excellent value for money and the devel-opment of fun products.
InStAntnooDleS
75.5%
review oF oPerations
’05
’06
’07
’08
’09
500 100 150 200 250
Consolidated Sales (Years ended March 31) (Billions of yen)
16 nISSIn FooDS HolDInGS Co., ltD.
of total consolidated sales
■ Pillow-type■ Cup-type

Instant noodles
¥58,447 million
pIllow-type
Instant noodles
Cup-type
Net sales
Net sales
¥214,831 million
17NISSIN FOODS HOLDINGS CO., LTD.

CHIlleD AnD FRozen FooDS
Review of PerformanceThe market for chilled foods, chiefly fresh noodles, and easy-to-prepare frozen foods with fresh-cooked flavor continues to show stable growth. Sales of chilled foods increased, in particular, products such as the Tsukemen no Tatsujin series and the Nissin Yakiudon fried-noodle series. Sales of frozen foods also increased, as Nicky Foods Co. Ltd. was newly included in the scope of consolidation during the fiscal year under review.
Future DirectionNISSIN CHILLED FOODS will focus on development of new flavors of Tsukemen, a growth category. NISSIN FROZEN FOODS will strive to reinforce and nurture brands in the frozen food sector, where room for market development remains, by introducing seasonal products for spring and summer, such as Nissin Sharishari Ice Soup Noodles and Frozen Nissin Pirikara Maze Soba, to satisfy continually diversifying consumer needs.
13.7%
Net sales
¥49,559 million
18 nISSIn FooDS HolDInGS Co., ltD.
’05
’06
’07
’08
’09
100 20 30 40 50
Consolidated Sales (Years ended March 31) (Billions of yen)
of total consolidated sales

Review of PerformanceIn the Ciscorn breakfast cereal series, the Frost and Mild Chocolate flavors of Ciscorn BIG, in-troduced in family-size packaging for family consumption, have been highly popular among consumers—ranking first and second, respec-tively, in unit sales among NISSIN CISCO cereal products from April 2008 to March 2009. In addi-tion, the confection Coconut Sable, and the lactic acid bacterial beverage Pilkul continued to deliver strong sales performance.
Future DirectionNISSIN CISCO plans to further expand its prod-uct range and increase sales by offering a diverse product lineup centered on the mainstay Ciscorn series. For instance, it will offer products on a limited-time basis in addition to the three regular Ciscorn BIG items. NISSIN YORK aims to respond to heightened health consciousness and develop new customers with Pilkul Slim, a product that of-fers the same great taste as long-selling Pilkul with 30% fewer calories.
otHeRBuSIneSS
10.8%
Net sales
¥39,220 million
19NISSIN FOODS HOLDINGS CO., LTD.
’05
’06
’07
’08
’09
0 10 20 30 40
Consolidated Sales (Years ended March 31) (Billions of yen)
of total consolidated sales

Quality and saFety
To Assure Complete Confidence in Our ProductsIn 2002, NISSIN FOODS HOLDINGS established the Food Safety Research Institute to develop scientifi-cally based quality assurance, allowing consumers and their families to enjoy food with total trust in its quality and safety. The institute performs the criti-cal tasks of checking the quality of daily production (central control system) and assessing the amount of hazardous substances that the product may contain. It also develops new testing and analysis procedures against emerging hazardous substances. Through quality surveys and process control at the manufac-turing sites, we are taking crucial responsibility for the quality of our products. The FOOD SAFETY EvALUATION & RESEARCH INSTITUTE in Shanghai, China commenced full-scale operation in January 2007, marking the completion of a system for restricting the export of China-originated raw materials to only those that have been confirmed to have good quality. Since the raw materials used in our products are in wide variety and numerous and also are supplied from all over the world, we have developed NAS-RAD-550. This is a proprietary automated system for simultaneous detection and analyzes traces of ag-ricultural chemicals and veterinary pharmaceuticals
that they may contain. The system also checks al-lergenic substances. Furthermore, in April 2008, the Food Safety Research Institute obtained certification for ISO 17025 (the international standard for testing capabilities and management systems) on analyses of residual agricultural chemicals, veterinary phar-maceuticals, and microbe tests and is continuing to upgrade its quality control systems. The Food Safety Research Institute also performs safety audits under Nissin’s Inspection Standards for Food Safety (NISFOS), established in 2004. It covers food safety management systems, general hazard-ous substance countermeasures, manufacturing standards, facilities maintenance and sanitation at the plants of raw materials suppliers. Evaluation is carried out objectively using inspection checklists, and the inspection results are expressed numerically as “Safety inspection points.” If the plant receives a low score, remedial guidance will be provided. In process control, the institute posts supervisors to supplier sites to confirm “4M Control,” (the confirma-tion of materials, methods, machines and manpower involved in manufacturing processes). Analysis accuracy, quality surveys and process control are together the backbone of our product quality assurance.
Fishfarms
Inspection and analysis of the environment and veterinary-use pharmaceuticals
Farms
Inspection and analysis of the environment and residual agricultural chemicals
Breeders
Inspection and analysis of the environment and veterinary-use pharmaceuticals, man-agement of animal growth status and water control
Feedplants
Management of hygiene and manufacturing process, and safety inspection, improvement and instruction
Ingredient plants
Nissin and Nissin’s plants
Detection of residual agricultural chemicals, veterinary-use pharmaceuticals, cancer-causing substances, genetically modified organisms and microbial levels in ingredients
Quality control at plants and investigation of analysis gap and correction
Consumers
Food Safety Research Institute
20 NISSIN FOODS HOLDINGS CO., LTD.

For a Future of Healthful Food EnjoymentTo build a harmonious coexistence with society and improve the global environment, the Group established the Environmental Charter in 1999, a group-wide commitment to business activities that furthers the interests of environmental protection and resource conservation. Since the start of fiscal 2008 (year ended March 31, 2008), the Group has implemented global warm-ing countermeasures aiming at reducing CO2 emis-sions by fiscal 2011 to a level 13% below emissions in fiscal 2005. Our activities have steadily produced results. For instance, we have sharply reduced CO2 emissions by converting the fuel for the boilers used in noodle manufacturing at our main plants from heavy oil to natural gas, which emits less CO2 when burned. In May 2007, we established the Basic Guide-lines on Environmentally Friendly Container and Packaging Design. Expanding our environmental measures beyond production activities to the
products themselves, in March 2007, we launched sales of Cup Noodle as a refill product called Cup Noodle Refill to lower the volume of throw-away containers and packaging materials. This eco-friendly product promotes the concept “Delicious eating in eco-style.” In April 2008, we reduced CO2 emissions further by replacing the traditional styrofoam Cup Noodle container with the ECO cup, a newly developed paper container. The ECO cup name comes from the motto “For Ecology, for Customers, for Original-ity.” The ECO cup is not only eco-friendly, it is also consumer-friendly, listing allergenic substances and sodium chloride equivalents in a large, readable la-bel, and improving preservation of flavor and fresh-ness through better sealing performance. As the pioneer inventor of instant noodles, which have become a “world food” in both name and reality, we will continue to engage in business activities aimed at the realization of a sustainable society.
environMentalaCtivities
21NISSIN FOODS HOLDINGS CO., LTD.
Our refill product, Cup Noodle RefillIt combines minimal-packaging noodle packs with a sturdy, reusable serving cup—higher resource savings.

soCial ContriButionaCtivities
Out of a keen awareness of corporate social responsibility, NISSIN FOODS HOLDINGS engages in activities in and with local communities that contribute to the realization of a better society by promoting harmonious coexistence. In 2008, we launched the Hyakufukushi* project to carry on the socially beneficial activities of Momofuku Ando, the founder of Nissin Foods.
* The project name means “One hundred followers,” and was taken from “fukushi,” the term for the retainers of a diplomatic mission head in the Edo period. It refers to Nissin employees and others who are inspired to follow Momofuku Ando’s ideals.
Follow-up on the Kenya Oishii ProjectSince 2008, we have provided distribution support for the serving of Chicken Ramen in school meals for undernourished children in Africa, while simultaneously helping to establish local instant noodle production infrastructure to further economic independence within Kenya. This project was named the Kenya Oishii Project (oishii means “delicious” in Japanese). In 2009, we held a ceremony at the Jomo Kenyatta University
of Agriculture & Technology, to mark the opening of a new laboratory building to house a donated instant noodle manufacturing laboratory and manufacturing equipment (to be collectively known as the Oishii Project Laboratory). The university was introduced to us by JICA (the Japan International Cooperation Agency), which supports the socioeconomic development, recovery and economic stability of developing regions.

23NISSIN FOODS HOLDINGS CO., LTD.
Newly developed Canned Chicken RamenThe extended shelf life was achieved by the removal of oxygen from the container and curbing of deterioration of oil and other contents by means of an included deoxi-dizer in a plastic container.
Idle to Idol Project Trains Nature Experience LeadersLaunched last year in the first year of the Hyaku-fukushi project, the Nature Experience Activities Leader Development Project has been nick-named the “Idle to Idol project,” because it gives retirees and other members of the baby boom generation a new and purposeful active post-employment alternative. This project gives Group employees and third-party company employees aged 50 or older special training toward certifica-tion as a volunteer guide for children’s outdoor activities. The Ando Foundation, established by Nissin founder Momofuku Ando plans to open the Momofuku Ando Nature Experience Activities Advanced Leader Training Center in April 2010 in Nagano Prefecture. The Group provides addi-tional support for this undertaking.
The Canned Chicken Ramen Just-in-Case ProjectThe Group has donated newly developed long-term storage cans to three local governments in Osaka as disaster rations. In Osaka, the birthplace of instant noodles, we have delivered to local governments a total of 100,000 servings of newly developed Canned Chicken Ramen (long-term storage cans for di-saster relief). In light of the fact that food is the most necessary commodity in times of disaster, we developed this product to permit storage for three years. (The ordinary shelf life for pillow-type Chicken Ramen is six months and five months for Cup Noodle.)

CorPorate governanCe and CoMPlianCe
NISSIN FOODS HOLDINGS (“the Company”) regards the enhancement and reinforcement of corporate governance as an important management priority, along with the provision of safe, high-quality food and the conduct of business that maximizes the interests of all stakeholders. All corporate officers and employees of the Company and its subsidiaries are tasked with corporate social responsibility under the NISSIN FOODS Code of Ethics and NISSIN FOODS Code of Compliance and strive to obey relevant laws and regulations and practice ethical behavior in the performance of their duties.
Basic Policy on Corporate GovernanceThe Company strives to achieve highly objective and transparent management by appointing multiple outside directors and outside corporate auditors and actively reflecting the opinions of outside experts in management. In June 1998, we introduced an executive officer system to promote rapid decision-making and to separate management oversight from business execution. The Board of Directors consists of eighteen members: fourteen directors, including two outside directors, and four corporate auditors, including two outside corporate auditors. The Board meets monthly and convenes extraordinary meetings as otherwise necessary. The Board decides on important matters concerning business execution, including basic management policies and strategy, and supervises the execution of duties by the directors. The Company has a Chief Officers Committee (CO Committee), consisting of the full-time
directors, standing corporate auditors and executive officers, which meets monthly. Also, the Management Committee, consisting of the full-time directors and standing corporate auditors, meets twice monthly to discuss matters to be decided by the Board and to discuss and decide matters delegated to it by the Board. In addition, the Investment and Loan Strategy Committee, consisting of the full-time directors, standing corporate auditors, executive officers, and department managers, meets monthly to conduct preliminary assessments of and discuss important investment projects. The Company has adopted the statutory auditor system. The Board of Corporate Auditors (“BCA”) consisting of four corporate auditors, including two outside corporate auditors, is an organization that establishes audit policies and audit plans, serves as a mechanism for mutual reporting among the corporate auditors on important matters concerning audits, and engages
24 nISSIn FooDS HolDInGS Co., ltD.
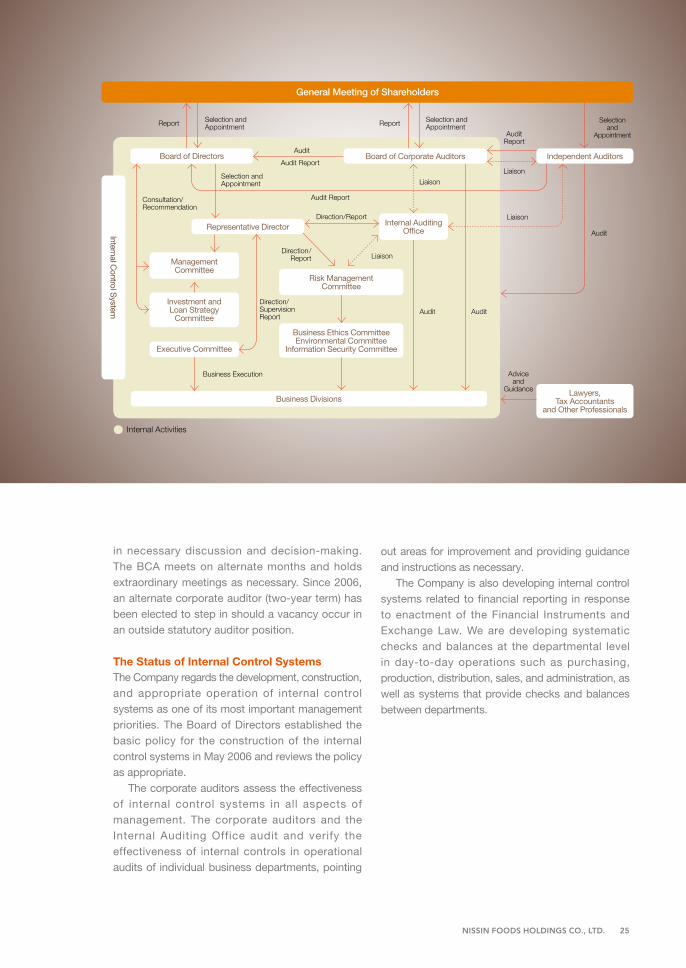
in necessary discussion and decision-making. The BCA meets on alternate months and holds extraordinary meetings as necessary. Since 2006, an alternate corporate auditor (two-year term) has been elected to step in should a vacancy occur in an outside statutory auditor position.
The Status of Internal Control SystemsThe Company regards the development, construction, and appropriate operation of internal control systems as one of its most important management priorities. The Board of Directors established the basic policy for the construction of the internal control systems in May 2006 and reviews the policy as appropriate. The corporate auditors assess the effectiveness of internal control systems in all aspects of management. The corporate auditors and the Internal Auditing Office audit and verify the effectiveness of internal controls in operational audits of individual business departments, pointing
out areas for improvement and providing guidance and instructions as necessary. The Company is also developing internal control systems related to financial reporting in response to enactment of the Financial Instruments and Exchange Law. We are developing systematic checks and balances at the departmental level in day-to-day operations such as purchasing, production, distribution, sales, and administration, as well as systems that provide checks and balances between departments.
25NISSIN FOODS HOLDINGS CO., LTD.
Management Committee
Investment andLoan Strategy
Committee
Business Ethics CommitteeEnvironmental Committee
Information Security Committee
Business Divisions
Direction/Report
Direction/Report
Direction/SupervisionReport
Liaison
Audit
Audit
Audit
Consultation/Recommendation
Internal AuditingOffice
Business Execution
Internal Control S
ystem
Selection and Appointment
Audit
Selectionand
Appointment
Report
Audit Report
Audit Report
Audit Report
Liaison
Liaison
Lawyers, Tax Accountants
and Other Professionals
Adviceand
Guidance
Internal Activities
Liaison
Selection and AppointmentReport
Selection and Appointment
Executive Committee
Risk Management Committee
Board of Directors
General Meeting of Shareholders
Board of Corporate Auditors Independent Auditors
Representative Director

Eizo KobayashiYorihiko Kojima
26 nISSIn FooDS HolDInGS Co., ltD.
President Representative Director
Koki Ando CEO (Chief Executive Officer)
Senior Managing Director Representative Director
Susumu Nakagawa COO (Chief Operating Officer)
President & Representative Director, NISSIN FOOD PRODUCTS CO., LTD.
Chief Representative, China
Managing Directors
Akihide Matsuo President & Representative Director, NISSIN CHILLED FOODS CO., LTD., NISSIN FROZEN FOODS CO., LTD.
Takayuki Naruto CSO (Chief Strategy Officer)
Directors
Taiji Matsumura CSO (Chief Strategy Officer)
Ken Sasahara General Manager for the Americas
Takahisa Yanagida CFO (Chief Financial Officer)
Noritaka Ando CMO (Chief Marketing Officer)
Osamu Tetsubayashi CAO (Chief Administrative Officer)
Takashi Yokogoshi CPO (Chief Production Officer)
Toshihiro Yamada CQO (Chief Quality Officer)
Mitsuru Tanaka CDO (Chief Development Officer)
Yorihiko Kojima* President & CEO, Mitsubishi Corp.
Eizo Kobayashi* President & CEO, ITOCHU Corp.
* Non-executive Director
Standing Corporate Auditors
Shunsaku Makizono
Kazuo Kanamori
Corporate Auditors
Toru Horinouchi
Hiroshi Takano
Executive Officers
Kiyotaka Ando President & Managing Director,
NISSIN FOODS CO., LTD.
Akira Iwai vice General Manager of
Production Headquarters
Tatsuya Ukon General Manager of
General Affairs Division
Kazuhito Kusumoto Chief Representative, Asia
Koji Sakai General Manager of Technology
Management Division
Satoru Sasaki General Manager of Advertisement
Control Division
Hideki Hattori General Manager of Corporate
Communications Division
Yukio Yokoyama General Manager of Financial
Headquarters, Finance Accounting Division
Koki Ando Susumu Nakagawa
Osamu Tetsubayashi Takashi Yokogoshi
Akihide Matsuo Takayuki Naruto
Ken Sasahara Takahisa Yanagida Noritaka Ando
Toshihiro Yamada Mitsuru Tanaka
Board oF direCtorsand oFFiCers (As of June 26, 2009)
Taiji Matsumura

For the year
Net sales
Cost of sales
Gross profit
Selling, general and administrative expenses
Operating income
Other income (expenses)
Income before income taxes and minority interests
Income taxes
Minority interests in earnings of consolidated subsidiaries
Net income
Per share
Net income
Cash dividends
Net assets *1
At year-end
Working capital *2
Property, plant and equipment, net
Total assets
Long-term liabilities
Net assets *3
R&D expenses
Capital expenditures
Value & performance indicators
Operating margin (%) *4
Return on assets (%) *5
Return on equity (%) *6
Inventory turnover (Times) *7
Years ended March 31,
¥ 385,470
195,664
189,806
162,134
27,672
17
27,689
14,279
(181)
13,591
¥ 111.17
50.00
2,310.36
¥ 76,699
93,803
392,695
22,917
288,844
¥ 3,446
10,766
7.2
3.4
4.8
13.4
2008
¥ 316,973
156,877
160,096
131,133
28,963
(1,891)
27,072
10,244
216
16,612
¥ 134.36
30.00
2,091.16
¥ 56,332
75,332
361,105
19,414
258,139
¥ 2,697
3,251
9.1
4.7
6.6
12.9
2005
¥ 321,700
158,209
163,491
131,512
31,979
(2,167)
29,812
14,469
(46)
15,389
¥ 125.09
30.00
2,167.81
¥ 82,404
69,019
366,801
18,975
263,199
¥ 2,727
3,517
9.9
4.2
5.9
12.6
2006
¥ 358,238
175,296
182,942
149,207
33,735
(157)
33,578
14,547
62
18,969
¥ 156.12
50.00
2,304.40
¥ 63,703
93,634
410,407
26,094
288,476
¥ 3,164
6,152
9.4
4.9
7.0
12.9
2007
¥ 362,057
202,304
159,753
136,201
23,552
(180)
23,372
7,385
96
15,891
¥ 129.98
50.00
2,287.21
¥ 69,536
101,132
408,729
34,426
285,569
¥ 3,477
17,572
6.5
4.0
5.7
13.5
2009
Millions of yen (except per share information)
Notes: 1. Net assets per share = (Net assets – minority interests) / number of shares outstanding as of the year end (excluding treasury stocks) 2. Working capital = Total current assets – Total current liabilities 3. Net assets: In compliance with the Corporate Law, from fiscal 2007, the amount of net assets includes the amount of minority interests. 4. Operating margin = Operating income / Net sales 5. Return on assets = Net income / Average total assets 6. Return on equity = Net income / Average total net assets 7. Inventory turnover = Cost of sales / Average total inventory
¥ 320,033
161,979
158,054
134,851
23,203
1,502
24,705
10,437
217
14,051
¥ 113.61
30.00
1,980.14
¥ 62,017
81,243
343,645
16,175
244,439
¥ 2,762
6,766
7.3
4.2
5.9
13.6
2004
FINANCIAL SECTION
NISSIN FOODS HOLDINGS CO., LTD. and Consolidated Subsidiaries
Consolidated Six-Year Summary of Selected Financial Data
27NISSIN FOODS HOLDINGS CO., LTD.
28 NISSIN FOODS HOLDINGS CO., LTD.
NISSIN FOODS HOLDINGS CO., LTD. (the “Company”) and its associated companies altered their corporate structure to
that of a holding company effective October 1, 2008, with the production and sales of instant noodles and other instant
foods as its core business, to further develop its business domain in various food, logistics and other related businesses.
The scope of consolidation for fiscal 2009, the year ended March 31, 2009, covers the Company, 38 consolidated subsid-
iaries (23 in Japan and 15 overseas), and two affiliate companies accounted for by the equity method (together, the “Group”).
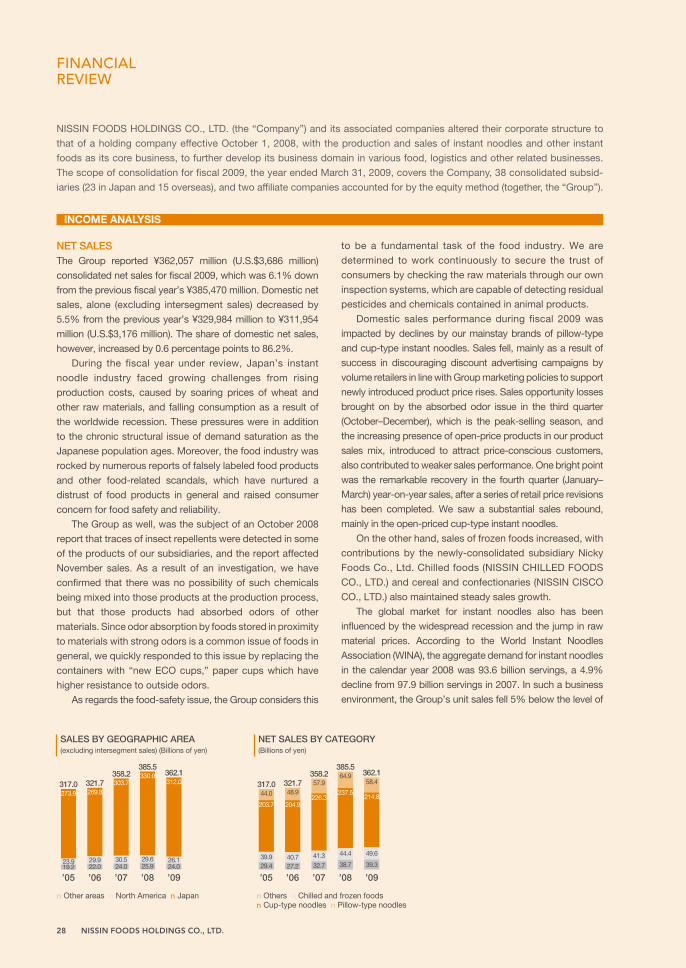
Net SaleSThe Group reported ¥362,057 million (U.S.$3,686 million)
consolidated net sales for fiscal 2009, which was 6.1% down
from the previous fiscal year’s ¥385,470 million. Domestic net
sales, alone (excluding intersegment sales) decreased by
5.5% from the previous year’s ¥329,984 million to ¥311,954
million (U.S.$3,176 million). The share of domestic net sales,
however, increased by 0.6 percentage points to 86.2%.
During the fiscal year under review, Japan’s instant
noodle industry faced growing challenges from rising
production costs, caused by soaring prices of wheat and
other raw materials, and falling consumption as a result of
the worldwide recession. These pressures were in addition
to the chronic structural issue of demand saturation as the
Japanese population ages. Moreover, the food industry was
rocked by numerous reports of falsely labeled food products
and other food-related scandals, which have nurtured a
distrust of food products in general and raised consumer
concern for food safety and reliability.
The Group as well, was the subject of an October 2008
report that traces of insect repellents were detected in some
of the products of our subsidiaries, and the report affected
November sales. As a result of an investigation, we have
confirmed that there was no possibility of such chemicals
being mixed into those products at the production process,
but that those products had absorbed odors of other
materials. Since odor absorption by foods stored in proximity
to materials with strong odors is a common issue of foods in
general, we quickly responded to this issue by replacing the
containers with “new ECO cups,” paper cups which have
higher resistance to outside odors.
As regards the food-safety issue, the Group considers this
to be a fundamental task of the food industry. We are
determined to work continuously to secure the trust of
consumers by checking the raw materials through our own
inspection systems, which are capable of detecting residual
pesticides and chemicals contained in animal products.
Domestic sales performance during fiscal 2009 was
impacted by declines by our mainstay brands of pillow-type
and cup-type instant noodles. Sales fell, mainly as a result of
success in discouraging discount advertising campaigns by
volume retailers in line with Group marketing policies to support
newly introduced product price rises. Sales opportunity losses
brought on by the absorbed odor issue in the third quarter
(October–December), which is the peak-selling season, and
the increasing presence of open-price products in our product
sales mix, introduced to attract price-conscious customers,
also contributed to weaker sales performance. One bright point
was the remarkable recovery in the fourth quarter (January–
March) year-on-year sales, after a series of retail price revisions
has been completed. We saw a substantial sales rebound,
mainly in the open-priced cup-type instant noodles.
On the other hand, sales of frozen foods increased, with
contributions by the newly-consolidated subsidiary Nicky
Foods Co., Ltd. Chilled foods (NISSIN CHILLED FOODS
CO., LTD.) and cereal and confectionaries (NISSIN CISCO
CO., LTD.) also maintained steady sales growth.
The global market for instant noodles also has been
influenced by the widespread recession and the jump in raw
material prices. According to the World Instant Noodles
Association (WINA), the aggregate demand for instant noodles
in the calendar year 2008 was 93.6 billion servings, a 4.9%
decline from 97.9 billion servings in 2007. In such a business
environment, the Group’s unit sales fell 5% below the level of
INCOME ANALYSIS
’05 ’09’08’07’06
317.0
19.223.9
273.9
321.7
22.029.9
269.8
358.2
24.030.5
303.7
362.1
24.026.1
312.0
385.5
25.929.6
330.0
’05 ’06
317.0
29.439.9
44.0
203.7
’07
321.7
27.240.7
48.9
204.9
’08
358.2
32.7
41.3
57.9
226.3
’09
362.1
39.3
49.6
58.4
214.8
385.5
38.7
44.4
64.9
237.5
Net SaleS bY CategorY(Billions of yen)
SaleS bY geographiC area(excluding intersegment sales) (Billions of yen)
n Other areas n North America n Japan n Others n Chilled and frozen foods n Cup-type noodles n Pillow-type noodles
FINANCIAL REVIEW

29NISSIN FOODS HOLDINGS CO., LTD.
the previous fiscal year in the United States as a result of a
retail price revision aimed at profitability improvement.
However, a slight increase of 1% year on year was secured in
Mexico. Although products with high added value saw stable
sales, aggregate sales in the North American market (excluding
intersegment sales) dropped by 11.6% from the previous
fiscal year to ¥26,126 million (U.S.$266 million) due to the
negative effects of foreign-exchange fluctuations. In the
People’s Republic of China (“PRC”) market and the European
market, the numbers of servings sold rose by 2% and 22%,
respectively. However, again due to foreign exchange effects,
the aggregate sales in other markets, including China and
Europe, (excluding intersegment sales) declined by 7.5% in
yen terms from the previous fiscal year to ¥23,977 million
(U.S.$244 million).
Looking at the sales breakdown by business segment
(excluding intersegment sales), the sales of instant noodles
and associated business, the Group’s mainstay business,
amounted to ¥322,837 million (U.S.$3,287 million) and
accounted for 89.2% of total consolidated net sales. Sales of
other businesses were ¥39,220 million (U.S.$399 million) and
accounted for 10.8% of total net sales.
Within instant noodles and associated business, there
were sales campaigns for the classic pillow-type instant
noodle product Chicken Ramen, which was renewed for its
50th anniversary, as well as for limited-edition products that
were released to celebrate the Company’s 50th anniversary.
In addition, sales of the open price MYOJO HYOUBANYA
series from MYOJO FOODS CO., LTD. and products
developed in coordination with retailers both rose, reflecting
heightened price sensitivity of consumers. However, mainly
due to a price-supporting marketing policy, overall sales
volume declined.
As for cup-type instant noodles, our positive marketing
measures included replacement of containers for the Cup
Noodle series, introduction of the microwavable Range Style
products, and rollout of the Cup Noodle Light series, which
offers fewer calories without sacrificing taste. Product renewal
was also carried out for the Nissin-no-Donbei series and Nissin
Yakisoba U.F.O. by replacing conventional curly noodles with
straight noodles, in order to enhance their brand value. These
efforts led to sales growth at convenience stores that continued
even throughout the period of retail price revisions. However,
at volume retailers for which the major sales tactic is bargain
sales, sales volumes for these products declined, as they did
for pillow-type instant noodles. As expected, price-conscious
customers strongly supported the open-price value products,
such as Soup Noodle, which led to a substantial sales
increase. New concept products, like the Range Style Series
of microwavable noodles and rice products, are also growing
steadily, well on the way to becoming standard products.
In overseas markets, although sales have been consistently
strong, especially among existing products in North America,
they were unfavorably affected by foreign exchange fluctua-
tions. (Please refer to Review of Operations on pp. 16–19 for
details of performance by product category.)
CoSt oF SaleS aND SelliNg, geNeral aND aDMiNiStrative expeNSeSDespite declines in net sales, the cost of sales rose by 3.4%
year on year to ¥202,304 million (U.S.$2,059 million), due to
successive higher prices for major raw materials, as well as an
increase in retirement benefit costs. The ratio of cost of sales to
net sales also increased by 5.1 percentage points to 55.9%.
Selling, general and administrative (“SG&A”) expenses, on
the contrary, dropped by 16.0% from the previous fiscal year
to ¥136,201 million (U.S.$1,387 million) with the substantial
decrease in promotional expenses. Accordingly, the ratio of
SG&A expenses to net sales also dropped by 4.4 percentage
points to 37.6%. Among SG&A expenses, advertising rose by
5.2% from the previous fiscal year to ¥12,797 million (U.S.$130
million), with a 0.4 percentage point rise in the ratio to net
sales. This increase was largely attributable to the odor
absorption-related advertising to announce a product recall
and instruct on proper storage. On the other hand, promotional
expenses declined by a significant 34.7% to ¥59,301 million
(U.S.$604 million), for a 7.2 percentage point drop in the ratio
to net sales year on year. Distribution expenses fell by 4.1% to
¥21,191 million (U.S.$216 million), but the ratio to net sales
rose by 0.1 percentage point.
’05 ’06
29.0
9.1
’07
32.0
9.9
’08
33.7
9.4
’09
23.6
6.5
27.7
7.2
’05 ’06 ’07 ’08 ’09
688.7 653.5557.9
357.2430.6
iNtereSt Coverage ratio*(Times)
operatiNg iNCoMe aNDoperatiNg MargiN (Billions of yen)
* Interest coverage ratio = Operating cash flow / Interest payments
n Operating income Operating margin

30 NISSIN FOODS HOLDINGS CO., LTD.
’05 ’06 ’07 ’08 ’09
285.6
5.7
258.1
6.6
263.2
5.9
288.5
7.0
288.8
4.8
’05 ’06 ’07 ’08 ’09
69.5
178.4
56.3
173.3
82.4
205.5
63.7
166.5
76.7
194.8
’05 ’06
361.1
4.7
’07
366.8
4.2
’08
410.4
4.9
’09
408.7392.7
4.03.4
Millions of yen
2009 2008Years ended March 31 Net Sales Ratio Net Sales Ratio
Cost of sales ¥ 202,304 55.9% ¥ 195,664 50.7%SG&A expenses 136,201 37.6 162,134 42.1Promotional expenses 59,301 16.4 90,857 23.6Advertising expenses 12,797 3.5 12,168 3.2Distribution expenses 21,191 5.9 22,093 5.7Other expenses 42,912 11.8 37,016 9.6
COStS ANd ExpENSES, ANd NEt SALES RAtIO
CaSh FlowSCash and cash equivalents as of March 31, 2009 amounted to
¥71,491 million (U.S.$728 million), ¥7,283 million below that of
the previous fiscal year-end. Nearly half of the decline in this
balance, or ¥3,597 million, is due to the negative impact of
foreign currency exchange rates.
Net cash provided by operating activities increased by ¥4,135
million to ¥30,010 million (U.S.$306 million). Major cash in-flow
factors included a ¥6,555 million increase for accrued retirement
benefits to employees, compared to a ¥51 million decrease in the
previous fiscal year. Trade notes and accounts payable registered
a ¥4,808 million increase, instead of a ¥5,180 million decrease in
the previous fiscal year. The amount for decrease in other
payables also declined by ¥4,466 million, while loss on revaluation
of marketable securities, investments in securities and other was
an increase of ¥3,468 million. Major cash out-flow factors, were a
¥4,317 million decrease in income before income taxes and
minority interests, a ¥2,245 million decrease in loss on impairment
of fixed assets, and a ¥1,865 million increase in gain on sales of
marketable securities, investments in securities and other. In
LIQUIDITY AND CAPITAL RESOURCES
ShareholDerS’ equitY aND roe(Billions of yen) / (%)
workiNg Capital aND CurreNt ratio(Billions of yen) / (%)
total aSSetS aND roa(Billions of yen) / (%)
n Total assets ROA n Working capital Current ratio n Shareholders’ equity ROEWorking capital=Total current assets – Total current liabilitiesCurrent ratio=Total current assets / Total current liabilities
operatiNg iNCoMe, other iNCoMe (expeNSeS) aND Net iNCoMeAs the positive effect of the large decline in SG&A expenses
was outweighed by the net sales decrease and the rise in the
cost of sales ratio, consolidated operating income for the
year under review stood at ¥23,552 million (U.S.$240 million),
a 14.9% decline from the previous year. The ratio of operating
income to net sales, as well, dropped by 0.7 percentage
points to 6.5%.
Other income (expenses) for fiscal 2009 resulted in net
expenses of ¥180 million (U.S.$2 million), compared to net
income of ¥17 million recorded in the previous fiscal year.
Major income factors were a ¥1,161 million year-on-year
increase to ¥4,665 million (U.S.$47 million) in interest and
dividend income, a ¥1,731 million increase to ¥1,885 million
(U.S.$20 million) in gain on sales of marketable securities, net,
and a ¥2,245 million decrease to ¥125 million (U.S.$1 million)
in loss on impairment of fixed assets. Major expense factors,
on the other hand, included a ¥3,450 million increase to ¥4,631
million (U.S.$47 million) in loss on devaluation of investments
in securities, and a ¥1,775 million increase to ¥2,177 million
(U.S.$22 million) in foreign currency exchange loss.
As a result, income before income taxes and minority
interests amounted to ¥23,372 million (U.S.$238 million), a
15.6% drop from the previous fiscal year. However, due to a
sizable decrease in income taxes, net income for fiscal 2009
grew by 16.9% to ¥15,891 million (U.S.$162 million). The ratio
of net income to net sales also made a 0.9 percentage point
gain to 4.4%. Net income per share increased by ¥18.81 from
the previous year’s ¥111.17 to ¥129.98 (U.S.$1.32).

31NISSIN FOODS HOLDINGS CO., LTD.
’05 ’06 ’07 ’08 ’09
71.5 71.8 68.7 68.471.9
’05 ’06
2,091.16
’07
2,167.81
’08
2,304.40
’09
2,287.212,310.36
addition, trade notes and accounts receivable resulted in a
¥2,735 million increase, reversing a ¥11,679 million decrease
recorded in the previous fiscal year.
Net cash used in investing activities amounted to ¥31,830
million (U.S.$324 million), an increase of ¥15,229 million from
the previous fiscal year. Major items in this category were a
¥25,794 million increase in payments for purchases of
investments in securities, a ¥8,643 million increase in payments
for purchases of property, plant and equipment and other, and
¥2,199 million recorded as payments for purchases of new
shares of a consolidated subsidiary Nicky Foods Co., Ltd. As
regards cash in-flow items, there was a ¥6,768 million increase
in proceeds from sales and redemption of marketable
securities, and a ¥10,360 million increase in proceeds from
sales and redemption of investments in securities.
Net cash used in financing activities declined by ¥4,961
million from the previous year’s ¥6,827 million to ¥1,866
million (U.S.$19 million). Newly-recorded proceeds from
long-term debt of ¥5,380 million and net decrease in short-
term borrowings ¥991 million lower than in the previous
fiscal year offset the cash out-flow items such as a ¥1,223
million increase in cash dividends paid.
aSSetS, liabilitieS aND Net aSSetSTotal assets as of March 31, 2009 amounted to ¥408,729
million (U.S.$4,161 million), a 4.1% increase as of the previous
fiscal year-end. Return on assets (ROA) edged up by 0.6
percentage points to 4.0%, reflecting the faster growth in net
income versus total assets.
Total current assets stood at ¥158,270 million (U.S.$1,611
million). Despite a ¥9,584 million decrease in marketable
securities, the aggregate balance grew by 0.4% from the previous
fiscal year, mainly due to a ¥3,045 million increase in trade
receivables and a ¥8,581 million increase in other receivables.
Net property, plant and equipment increased by 7.8%
to ¥101,132 million (U.S.$1,030 million) at the previous
fiscal year-end.
Investments and other assets increased to ¥144,547 million
(U.S.$1,472 million), marking a 5.6% rise that was mainly due
to a ¥7,035 million increase in investments in securities and
a ¥4,769 million increase in deferred income taxes.
Total liabilities amounted to ¥123,160 million (U.S.$1,254
million), an 18.6% year-on-year increase. This rise was
attributable mainly to increases in trade payables, short-
term borrowings, long-term debt and accrued retirement
benefits to employees (of ¥5,118 million, ¥2,283 million,
¥5,442 million and ¥6,618 million, respectively).
Total current liabilities increased by 9.6% compared
with the previous fiscal year-end to ¥88,734 million
(U.S.$903 million). As the increase in current liabilities
largely exceeded the increase in current assets, working
capital declined by 9.3% to ¥69,536 million (U.S.$708
million) from the previous year. The current ratio, as well,
dropped from 194.8% to 178.4%.
Total net assets resulted in ¥285,569 million (U.S.$2,907
million), decreasing by 1.1% compared with ¥288,844 million
as of the previous fiscal year-end. Although retained earnings
increased by ¥9,783 million mainly due to net income posted,
net unrealized holding gain on securities and translation
adjustments decreased by ¥4,068 million and ¥8,540 million,
respectively. Accordingly, net assets per share were
¥2,287.21 (U.S.$23.28), a 1.0% decrease from ¥2,310.36 for
the previous fiscal year-end.
Millions of yen
Years ended March 31 2009 2008 2007Net cash provided by operating activities ¥ 30,010 ¥ 25,875 ¥ 26,974Net cash used in investing activities (31,830) (16,601) (4,771)Net cash used in financing activities (1,866) (6,827) (7,421)Cash and cash equivalents at end of the year ¥ 71,491 ¥ 78,774 ¥ 76,695
CASh FLOw hIghLIghtS
Net aSSetS per Share(Yen)
equitY ratio(%)
32 NISSIN FOODS HOLDINGS CO., LTD.
SigNiFiCaNt buSiNeSS agreeMeNtS(1) Joint-venture agreement with
hebei Jinmailang Mianye Co., ltd.
With regard to the Company’s capital participation in Hebei
Hualong F&N Industry Group Co., Ltd., a major manufacturer
of instant noodles and flour in the PRC (hereafter “Hebei
Hualong”), which was undertaken to expand and thereby
reinforce the Company’s instant noodle operations in the
PRC, the Company concluded on May 12, 2004, a joint-venture
agreement with Hebei Jinmailang Mianye Co., Ltd., the parent
company of Hebei Hualong.
Hebei Jinmailang Mianye split Hebei Hualong into two new
companies—Nissin Hualong Foods Co., Ltd. (now renamed
Jinmailang Foods Co., Ltd.) and Hebei Nissin Hualong Paper
Products Co., Ltd. (now renamed Hebei Jinmailang Paper
Products Co., Ltd.). Through capital increases subscribed to
by its Hong Kong-based subsidiary, Nissin Foods Co., Ltd.,
the Company had acquired 14.9% of registered equity in each
newly established company as of March 31, 2005.
The Company plans to eventually acquire an equity stake
equivalent to 33.4% of registered equity in each company.
The investment is expected to reach about ¥20 billion.
(2) tie-up with MareveN FooD holDiNgS liMiteD
In order to expand our international business operations,
the Company concluded on December 26, 2008, a capital
and business tie-up agreement with ANGLESIDE LIMITED
(renamed MAREVEN FOOD HOLDINGS LIMITED as of
April 14, 2009), a holding company of the largest instant
noodle manufacturer in Russia. In accordance with the
provisions in the agreement, the Company plans to
gradually acquire an equity stake in MAREVEN FOOD
HOLDINGS. The anticipated total capital investment is
approximately ¥26.8 billion for the acquisition of 33.5%
of issued shares of MAREVEN FOOD HOLDINGS.
On January 16, 2009, the Company acquired 1,763 shares,
or 14.9% of issued shares, of MAREVEN FOOD HOLDINGS
for a total acquisition cost of ¥9,623 million, through purchase
of outstanding shares and subscription of new shares
allocated to a third party.
Since MAREVEN FOOD HOLDINGS is currently in the
process of group realignment, the Company’s additional
capital investment in MAREVEN FOOD HOLDINGS is
conditional on the completion of its group realignment
process and certain other factors.
riSk iNForMatioNConditions that have the potential to significantly influence the
decisions of investors are presented below. Any conditions
with reference to the future are based on information available
at the time of publication of this annual report. The Company
acknowledges the possibility that these risks can arise and will
make every effort to prevent such risks from appearing and
address resulting situations if such risks do appear.
(1) Food Safety issues
The Company’s basic philosophy is to provide safe foods that
consumers can enjoy without worry. In recent years, a high
incidence of disquieting developments, such as avian
influenza, residual pesticides in foods, falsely labeled food
products and toxic substances mixed in food products, has
threatened to undermine food safety. The needs of consumers
with regard to food safety have become more sophisticated.
To enhance its ability to meet this need, the Company
established the Food Safety Research Institute and continues
to strengthen its quality control system. However, the
Company’s financial position and fiscal performance could be
unfavorably influenced were unusual health-related situations
to arise in the future that were beyond the Company’s
conjecture, or if rumors were to mar the image of the
Company’s products, even though such rumors were based
on incidents not directly affecting the Company’s products.
(2) risk Derived from Changes in Demographic trend
In Japan, the birth rate has stayed low and the population is
aging rapidly. Accordingly, the number of young consumers,
who are the major customers of the Company, has been
decreasing, and therefore the market for our products is
expected to remain unchanged or otherwise decrease over
the long term. In the face of such a business climate, the
Company is making ever-greater efforts to develop new
products that closely meet the needs of each age bracket in
order to maintain and expand our customer base. However, if
the decrease in population accelerated, the overall demand in
the instant noodles market would shrink, negatively affecting
the Company’s financial position and its fiscal performance.
(3) reduced brand value
The Company’s mainstay products, particularly Chicken
Ramen and the Cup Noodle series, have become familiar
household items for most consumers, thanks to years of
accumulated technical expertise and product development
activities. The Company emphasizes the establishment and
protection of its brands. However, new products flood the
instant noodle market every year, and the relative brand
value of the Company’s products could decline if another
company were to achieve a revolutionary breakthrough in
instant noodle development.
(4) risk of product liability
As a food maker, the Company believes its mission is to
provide safe, worry-free products to consumers, and therefore
applies strict quality control standards to its manufacturing
activities. In addition, the Food Safety Research Institute
ADDITIONAL INFORMATION

33NISSIN FOODS HOLDINGS CO., LTD.
studies ways to ensure the safety of raw materials and strives
to reinforce quality control systems at each manufacturing
facility. The Company also endeavors to lessen the potential of
product liability claims to affect its financial position, and
therefore is insured against product liability. However, if an
accident occurs through product liability and a situation arises
wherein the Company must recall certain products, the
insurance carried by the Company may not be sufficient to
cover all claims. A tarnished reputation in society and a
weakened corporate image could erode consumers’ willingness
to buy the Company’s products. This situation could hurt the
Company’s financial position and its fiscal performance.
(5) increases in prices of raw Materials
The primary raw materials used for the Company’s products
are agricultural commodities such as flour and palm oil, and
petroleum-based items for packaging and wrappers. The
prices of these raw materials fluctuate with changing market
conditions. Therefore, the Company’s fiscal performance
could be adversely impacted if political unrest or international
disputes occur in the countries that produce these raw
materials, or if their prices skyrocket because of crop failures
caused by abnormal weather associated with global warming,
a boost in the demand for grain for production of ethanol, or
other reasons.
(6) risk of Natural Disasters
The Company has manufacturing facilities both in Japan and
overseas. If a natural disaster, such as a large-scale earthquake
or flooding from a typhoon, were to occur and manufacturing
facilities incurred damage, the Company’s production
structure as well as its financial position and fiscal performance
could suffer because, for example, an interruption in operations
would reduce output and repairs to facilities and equipment
would raise expenses.
(7) risk related to overseas operations
The Company has 25 factories in 10 countries that produce
food products, including instant noodles, based on the basic
policy of local production and local marketing. Those factories
are run by subsidiaries and affiliates. If political unrest or
international disputes arise in the regions where the Company’s
subsidiaries and affiliates operate, or if issues threaten to
undermine food safety, or if legal controls in certain countries
create a situation that hinders production activities, then the
financial position and fiscal performance of the Company
could suffer.
(8) risk related to information Systems
The Company uses computers to process and store
information on production, sales and administration. The
Company has adopted all conceivable measures to safeguard
these information systems from computer virus-induced
crashes, damage by hackers and the risk of a breach in
information security. However, the Company’s financial
position and fiscal performance could be adversely affected if
the Company’s systems were damaged and/or if data were
leaked outside the organization, due to illegal access to the
systems by unauthorized individuals through technologies
that the Company has not envisioned, or unknown computer
viruses getting through established safeguards.
(9) risk related to retirement benefits accounting
Costs and obligations pertaining to retirement benefits are
determined based on discount rates and other predetermined
criteria used in actuarial calculations, and the expected
rate of return on pension assets. If actual results differ
from predetermined criteria, or if predetermined criteria are
amended, the actuarial difference is charged to the income
of the fiscal year following the one in which the difference
occurred. If a decline in discount rates and/or returns on the
pension assets persist, the Company will have to carry a
higher burden of pension-related costs, and this could hurt
the Company’s financial position and its fiscal performance.
(10) risk of Declining Market values for Marketable Securities
The Company invests in marketable securities to ensure
efficient application of funds and thereby maintain the integrity
of principal. However, the Company’s financial position and
fiscal performance could be adversely affected if worsening
market conditions cause market values to decline or sluggish
performance by equity investments force the Company to
apply the accounting for impairment.
(11) risk related to accounting for impairment of Fixed assets
The Company owns various tangible fixed assets for the
purpose of its business. These fixed assets could face in the
future a substantial decline in their fair value and/or future cash
flows they were to generate, and thus would have the
possibility of impairment loss recognition in conformity with
accounting for impairment of fixed assets. Such circumstances
could negatively affect the Company’s financial position and
its fiscal performance.
(12) reliance on Certain business Clients
The Company relies on specific business clients for sales of
products and procurement of certain raw materials. Reliance
on specific trading companies for sales of products aims at
reducing the effort expended on credit control and minimizing
credit risk through concentration of transactions among highly
creditworthy companies. Reliance on specific vendors for
procurement of certain raw materials also aims at efficient and
stable procurement. However, if the business activities of
these sales agents were to fail, or the Company had difficulty
collecting accounts receivable, or if the supply of raw materials
were suspended and the Company’s production had to be
halted, the Company’s own financial position and its fiscal
performance could be negatively affected.

34 NISSIN FOODS HOLDINGS CO., LTD.
Millions of yenThousands of
U.S. dollars (Note 1)
2009 2008 2009
ASSETS
Current assets:
Cash and deposits (Note 4) ¥ 65,903 ¥ 66,740 $ 670,905
Marketable securities (Notes 4 and 5) 17,647 27,231 179,650
Receivables:
Trade 44,456 41,411 452,570
Other 10,410 1,829 105,976
Less: Allowance for doubtful receivables (466) (560) (4,744)
Inventories (Note 6) 15,226 14,675 155,004
Deferred income taxes (Note12) 4,090 4,861 41,637
Other current assets 1,004 1,446 10,221
Total current assets 158,270 157,633 1,611,219
property, plant and equipment:
Land (Notes 7, 8 and 10) 46,944 43,810 477,899
Buildings and structures (Notes 7 and 10) 82,523 81,218 840,100
Machinery, equipment and vehicles (Note 7) 94,488 91,182 961,906
Leased assets 210 — 2,138
Construction in progress 1,300 1,055 13,234
Other (Note 7) 526 617 5,354
225,991 217,882 2,300,631
Less: Accumulated depreciation (124,859) (124,079) (1,271,088)
Property, plant and equipment, net 101,132 93,803 1,029,543
Intangible fixed assets:
Goodwill 4,328 3,863 44,060
Other (Note 7) 452 458 4,601
Total intangible fixed assets 4,780 4,321 48,661
Investments and other assets:
Investments in securities (Notes 5 and 10) 130,134 123,099 1,324,789
Other investments 6,155 8,370 62,659
Long-term loans 1,139 269 11,595
Deferred income taxes (Note 12) 5,272 503 53,670
Other assets 2,556 4,742 26,021
Less: Allowance for doubtful receivables (709) (45) (7,218)
Total investments and other assets 144,547 136,938 1,471,516
total assets ¥ 408,729 ¥ 392,695 $ 4,160,939
NISSIN FOODS HOLDINGS CO., LTD. and Consolidated Subsidiaries
Consolidated balance SheetsAs of March 31, 2009 and 2008
35NISSIN FOODS HOLDINGS CO., LTD.
Millions of yenThousands of
U.S. dollars (Note 1)
2009 2008 2009
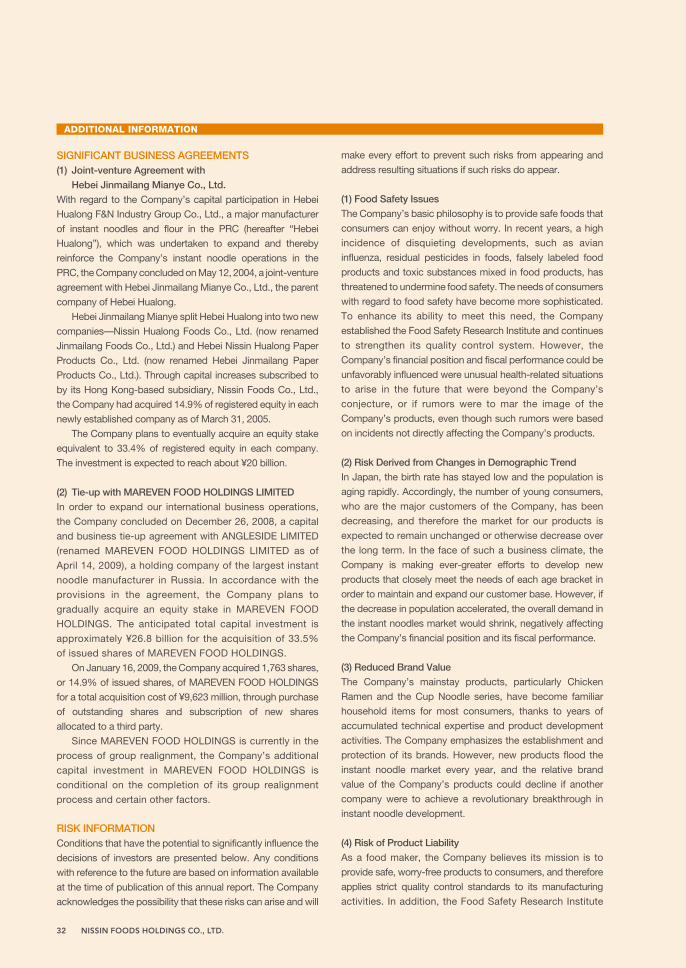
LIABILITIES AND NET ASSETS
Current liabilities:
Short-term borrowings (Note 9) ¥ 4,636 ¥ 2,353 $ 47,195
Payables:
Trade 43,163 38,045 439,408
Other 22,323 24,047 227,252
Current portion of long-term debt (Note 9) 705 — 7,177
Accrued income taxes (Note 12) 7,425 6,822 75,588
Other current liabilities 10,482 9,667 106,709
Total current liabilities 88,734 80,934 903,329
Long-term liabilities:
Long-term debt (Note 9) 5,442 — 55,401
Accrued retirement benefits to employees (Note 11) 15,260 8,642 155,350
Accrued retirement benefits to directors and corporate auditors (Note 2(j)) — 2,349 —
Deferred income taxes (Note 12) 7,110 7,761 72,381
Deferred income taxes on land revaluation (Note 8) 3,511 3,511 35,743
Other long-term liabilities (Note 2(j)) 3,103 654 31,589
Total long-term liabilities 34,426 22,917 350,464
Net assets:
Shareholders’ equity (Note 13)
Common stock:
Authorized-500,000,000 shares; Issued-127,463,685 shares at March 31, 2009 and 2008 25,123 25,123 255,757
Additional paid-in capital 49,755 49,755 506,515
Retained earnings (Note 23(a)) 235,052 225,269 2,392,874
Less: Treasury stock, at cost—5,206,128 shares at March 31, 2009 and 5,202,867 shares at March 31, 2008
(14,355) (14,343) (146,137)
Total shareholders’ equity 295,575 285,804 3,009,009
Valuation, translation adjustments and other:
Net unrealized holding gain (loss) on securities (Note 5) (478) 3,590 (4,866)
Land revaluation reserve (Note 8) (7,533) (7,533) (76,687)
Translation adjustments (7,935) 605 (80,780)
Total valuation, translation adjustments and other (15,946) (3,338) (162,333)
Minority interests 5,940 6,378 60,470
Total net assets 285,569 288,844 2,907,146
total liabilities and net assets ¥ 408,729 ¥ 392,695 $ 4,160,939See accompanying notes to consolidated financial statements.

36 NISSIN FOODS HOLDINGS CO., LTD.
Millions of yenThousands of
U.S. dollars (Note 1)
2009 2008 2007 2009
Net sales ¥ 362,057 ¥ 385,470 ¥ 358,238 $ 3,685,809
Cost of sales (Note 14) 202,304 195,664 175,296 2,059,493
Gross profit 159,753 189,806 182,942 1,626,316
Selling, general and administrative expenses (Note 14) 136,201 162,134 149,207 1,386,552
Operating income 23,552 27,672 33,735 239,764
Other income (expenses):
Interest and dividend income 4,665 3,504 3,112 47,491
Interest expense (84) (60) (48) (855)
Equity in earnings of affiliates 766 1,201 476 7,798
Loss on impairment of fixed assets (Note 7) (125) (2,370) (1,129) (1,273)
Loss on devaluation of investments in securities (4,631) (1,181) (8) (47,144)
Loss on revaluation of investments — — (1,379) —
Product recall expenses (Note 15) — (628) — —
Gain on sales of marketable securities, net (Note 5) 1,885 154 65 19,190
Gain on sales of investments in securities (Note 5) 137 2 573 1,395
Other, net (2,793) (605) (1,819) (28,435)
Income before income taxes and minority interests 23,372 27,689 33,578 237,931
Income taxes (Note 12):
Current 9,223 11,027 11,018 93,892
Deferred (1,838) 3,252 3,529 (18,712)
7,385 14,279 14,547 75,180
Income before minority interests 15,987 13,410 19,031 162,751
Minority Interests in earnings (loss) of consolidated subsidiaries
96 (181) 62 978
Net income ¥ 15,891 ¥ 13,591 ¥ 18,969 $ 161,773See accompanying notes to consolidated financial statements.
NISSIN FOODS HOLDINGS CO., LTD. and Consolidated Subsidiaries
Consolidated Statements of incomeFor the years ended March 31, 2009, 2008 and 2007
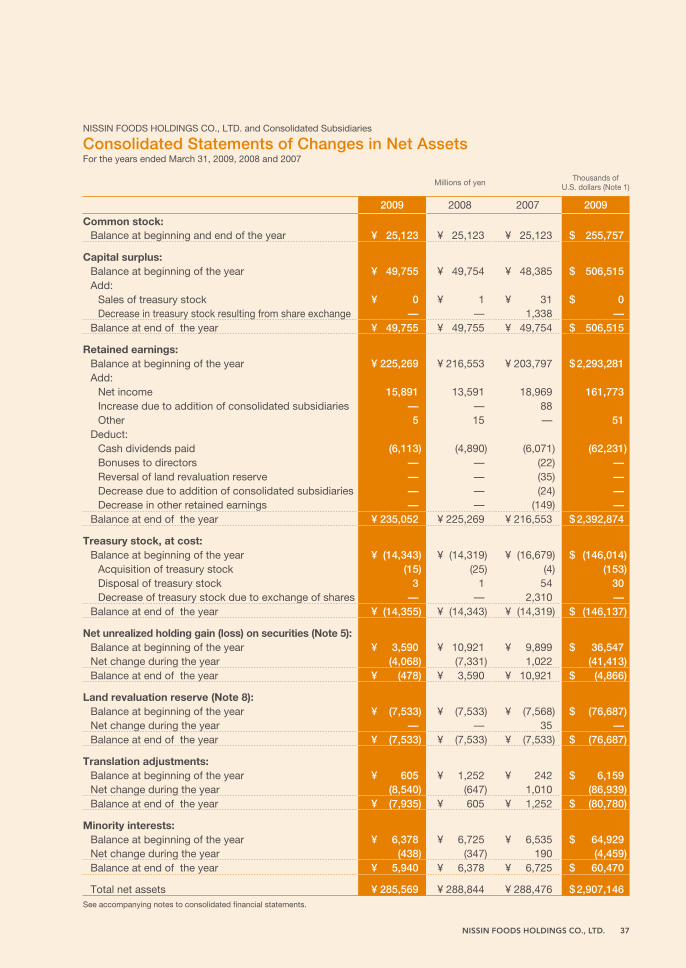
37NISSIN FOODS HOLDINGS CO., LTD.
Millions of yenThousands of
U.S. dollars (Note 1)
2009 2008 2007 2009
Common stock:Balance at beginning and end of the year ¥ 25,123 ¥ 25,123 ¥ 25,123 $ 255,757
Capital surplus:Balance at beginning of the year ¥ 49,755 ¥ 49,754 ¥ 48,385 $ 506,515Add:
Sales of treasury stock ¥ 0 ¥ 1 ¥ 31 $ 0Decrease in treasury stock resulting from share exchange — — 1,338 —
Balance at end of the year ¥ 49,755 ¥ 49,755 ¥ 49,754 $ 506,515
Retained earnings:Balance at beginning of the year ¥ 225,269 ¥ 216,553 ¥ 203,797 $ 2,293,281Add:
Net income 15,891 13,591 18,969 161,773Increase due to addition of consolidated subsidiaries — — 88Other 5 15 — 51
Deduct:Cash dividends paid (6,113) (4,890) (6,071) (62,231)Bonuses to directors — — (22) —Reversal of land revaluation reserve — — (35) —Decrease due to addition of consolidated subsidiaries — — (24) —Decrease in other retained earnings — — (149) —
Balance at end of the year ¥ 235,052 ¥ 225,269 ¥ 216,553 $ 2,392,874
treasury stock, at cost: Balance at beginning of the year ¥ (14,343) ¥ (14,319) ¥ (16,679) $ (146,014)
Acquisition of treasury stock (15) (25) (4) (153)Disposal of treasury stock 3 1 54 30Decrease of treasury stock due to exchange of shares — — 2,310 —
Balance at end of the year ¥ (14,355) ¥ (14,343) ¥ (14,319) $ (146,137)
Net unrealized holding gain (loss) on securities (Note 5): Balance at beginning of the year ¥ 3,590 ¥ 10,921 ¥ 9,899 $ 36,547Net change during the year (4,068) (7,331) 1,022 (41,413)Balance at end of the year ¥ (478) ¥ 3,590 ¥ 10,921 $ (4,866)
Land revaluation reserve (Note 8):Balance at beginning of the year ¥ (7,533) ¥ (7,533) ¥ (7,568) $ (76,687)Net change during the year — — 35 —Balance at end of the year ¥ (7,533) ¥ (7,533) ¥ (7,533) $ (76,687)
translation adjustments:Balance at beginning of the year ¥ 605 ¥ 1,252 ¥ 242 $ 6,159Net change during the year (8,540) (647) 1,010 (86,939)Balance at end of the year ¥ (7,935) ¥ 605 ¥ 1,252 $ (80,780)
Minority interests: Balance at beginning of the year ¥ 6,378 ¥ 6,725 ¥ 6,535 $ 64,929Net change during the year (438) (347) 190 (4,459)Balance at end of the year ¥ 5,940 ¥ 6,378 ¥ 6,725 $ 60,470
Total net assets ¥ 285,569 ¥ 288,844 ¥ 288,476 $ 2,907,146See accompanying notes to consolidated financial statements.
NISSIN FOODS HOLDINGS CO., LTD. and Consolidated Subsidiaries
Consolidated Statements of Changes in Net assetsFor the years ended March 31, 2009, 2008 and 2007

38 NISSIN FOODS HOLDINGS CO., LTD.
Millions of yenThousands of
U.S. dollars (Note 1)
2009 2008 2007 2009Operating activities:
Income before income taxes and minority interests ¥ 23,372 ¥ 27,689 ¥ 33,578 $ 237,931Depreciation and amortization 7,974 7,526 6,188 81,177Loss on impairment of fixed assets 125 2,370 1,129 1,273(Decrease) increase in allowance for doubtful receivables (22) 302 (174) (224)Increase (decrease) in accrued retirement benefits to employees 6,555 (51) (5,534) 66,731(Decrease) increase in accrued retirement benefits to directors and corporate auditors (6) 85 464 (61)
Interest and dividend income (4,665) (3,504) (3,112) (47,491)Interest expense 84 60 48 855Foreign currency exchange loss (gain) 1,454 19 (84) 14,802Equity in earnings of affiliates (766) (1,201) (476) (7,798)Loss on disposal and sales of property, plant and equipment 520 580 358 5,294Gain on sales of marketable securities, investments in securities and other (2,022) (157) (319) (20,585)
Loss on revaluation of marketable securities, investments in securities and other 4,720 1,252 1,847 48,050
(Increase) decrease in trade notes and accounts receivable (2,735) 11,679 (1,746) (27,843)(Increase) decrease in inventories (1,066) 289 (223) (10,852)Increase (decrease) in trade notes and accounts payable 4,808 (5,180) (39) 48,946(Decrease) increase in other payables (672) (5,138) 1,981 (6,841)Bonuses to directors — — (22) —Other, net 2,378 (2,113) 1,189 24,209
Subtotal 40,036 34,507 35,053 407,573Interest and dividends received 3,571 3,541 3,170 36,353Interest paid (84) (60) (44) (855)Income taxes paid (13,513) (12,113) (11,205) (137,564)
Net cash provided by operating activities 30,010 25,875 26,974 305,507
Investing activities:Net decrease (Increase) in time deposits 2,193 (1,010) 738 22,325Payments for purchases of marketable securities (2,000) (2,500) (4,991) (20,360)Proceeds from sales and redemption of marketable securities 12,002 5,234 43,808 122,183Payments for purchases of property, plant and equipment and other (18,216) (9,573) (5,539) (185,442)Proceeds from sales of property, plant and equipment and other 1,061 80 16 10,801Payments for purchases of investment in securities (60,378) (34,584) (27,146) (614,659)Proceeds from sales and redemption of investments in securities 35,839 25,479 12,253 364,848Payments for purchases of new shares of consolidated subsidiaries and other (2,199) — (23,763) (22,386)
Net (increase) decrease in loans receivable (132) 273 (147) (1,345)Net cash used in investing activities (31,830) (16,601) (4,771) (324,035)
Financing activities:Decrease in short-term borrowings, net (467) (1,458) (556) (4,754)Proceeds from long-term borrowings 5,380 — — 54,769Repayment of long-term borrowings (669) (413) (306) (6,811)Redemption of bonds (40) — — (407)Net (increase) decrease in treasury stock (12) (24) 205 (122)Cash dividends paid (6,113) (4,890) (6,070) (62,231)Cash dividends paid to minority shareholders (23) (42) (694) (234)Other, net 78 — — 794
Net cash used in financing activities (1,866) (6,827) (7,421) (18,996)Effect of exchange rate changes on cash and cash equivalents (3,597) (368) 91 (36,618)Net increase (decrease) in cash and cash equivalents (7,283) 2,079 14,873 (74,142)Cash and cash equivalents at beginning of the year 78,774 76,695 61,570 801,934Increase in cash and cash equivalents arising from initial consolidation of subsidiaries — — 252 —
Cash and cash equivalents at end of the year (Note 4) ¥ 71,491 ¥ 78,774 ¥ 76,695 $ 727,792See accompanying notes to consolidated financial statements.
NISSIN FOODS HOLDINGS CO., LTD. and Consolidated Subsidiaries
Consolidated Statements of Cash FlowsFor the years ended March 31, 2009, 2008 and 2007

39NISSIN FOODS HOLDINGS CO., LTD.
NISSIN FOODS HOLDINGS CO., LTD. and Consolidated Subsidiaries
Notes to Consolidated Financial Statements
The accompanying consolidated financial statements of
NISSIN FOODS HOLDINGS CO., LTD. (the “Company”)
and consolidated subsidiaries (collectively, the “Group”)
are prepared on the basis of accounting principles gener-
ally accepted in Japan, which are different in certain
respects as to the application and disclosure requirements
of International Financial Reporting Standards, and are
compiled from the consolidated financial statements pre-
pared by the Company as required by the Financial
Instruments and Exchange Act of Japan.
In preparing the accompanying consolidated financial
statements, certain reclassifications and rearrangements
have been made to the consolidated financial statements
issued domestically in order to present them in a format
which is more familiar to readers outside Japan.
Certain reclassifications of previously reported amounts
have been made to conform the consolidated financial
statements for the year ended March 31, 2007 and 2008 to
the 2009 presentation. Such reclassifications had no effect
on consolidated net income or net assets.
The translation of yen amounts into U.S. dollars is
included solely for the convenience of readers outside Japan
and has been made at ¥98.23 = U.S.$1.00, the exchange
rate prevailing on March 31, 2009. This translation should
not be construed as a representation that yen can be con-
verted into U.S. dollars at the above or any other rate.
1. BASIS OF PREPARATION
(a) principles of Consolidation and Accounting
for Investments in Unconsolidated Subsidiaries
and Affiliates
The accompanying consolidated financial statements
include the accounts of the Company and the significant
companies which it controls directly or indirectly. Companies
over which the Company exercises significant influence in
terms of their operating and financial policies have been
included in the accompanying consolidated financial state-
ments on an equity basis. The assets and liabilities of the
initially consolidated subsidiaries are stated at fair value as
of their respective dates of acquisition.
Effective the year ended March 31, 2009, Nicky Foods Co.,
Ltd. was initially included in the scope of the consolidation
through the acquisition of its shares, and NISSIN FOOD
PRODUCTS CO., LTD. and four other subsidiaries were also
included in the scope of the consolidation due to the corporate
split to newly incorporated subsidiaries related to the change
to a holding company structure effective October 1, 2008.
The balance sheet date of overseas consolidated subsidiar-
ies is December 31. Any significant differences in intercompany
accounts and transactions arising from intervening intercom-
pany transactions during the period from January 1 through
March 31 have been adjusted, if necessary.
The fiscal year ends of NISSIN FOODS ASIA PTE. LTD.
and MYOJO U.S.A. INC., which had been March 31 were
changed to December 31 effective the fiscal year beginning
April 1, 2008. For these subsidiaries, pro forma financial
statements prepared as of March 31 are used in the prepa-
ration of the consolidated financial statements.
The numbers of consolidated subsidiaries and affili-
ates accounted for by the equity method for the years
ended March 31, 2009, 2008 and 2007 were as follows:
2009 2008 2007
Consolidated subsidiaries 38 32 33
Affiliates accounted for by the equity method
2 2 2
(b) Cash and Cash Equivalents
For the purposes of the consolidated statements of cash
flows, cash and cash equivalents comprise cash on hand,
deposits held at call with banks and all highly liquid invest-
ments with an insignificant risk of changes in value and
with maturities of three months or less.
(c) Securities
The accounting standard for financial instruments requires
that securities be classified into three categories: trading,
held-to-maturity or other securities. Trading securities are
carried at fair value and held-to-maturity debt securities are
carried at amortized cost. Marketable securities classified
as other securities are carried at fair value with any changes
in unrealized holding gain or loss, net of the applicable
income taxes, included directly in net assets. Cost of securi-
ties sold is determined by the moving average method.
Non-marketable securities classified as other securities are
carried at cost based on the moving-average method.
(d) Inventories
Finished goods and merchandise are principally stated at
the lower of cost or net selling value, cost being determined
by the average method. Raw materials and supplies are
2. SUMMARY OF SIgNIFICANT ACCOUNTINg POLICIES

40 NISSIN FOODS HOLDINGS CO., LTD.
principally stated at the lower of cost or net selling value,
cost being determined by the last purchase price method.
(e) hedging Activities
Receivables and payables hedged by forward foreign
exchange contracts which meet certain conditions are
translated at the corresponding foreign exchange contract
rates. Interest of the borrowings hedged by interest rate
swap contract which meet certain conditions is calculated
with the corresponding interest rate swap contract rate.
(f) property, plant and Equipment
(except for leased assets)
Depreciation is computed principally by the declining-balance
method over the estimated useful lives of the respective assets
in conformity with the Corporation Tax Law of Japan. Certain
consolidated subsidiaries apply the straight-line method. The
straight-line method is also applied to the head office building
of the Company (in Osaka) and the buildings and structures of
General Research Institute of Food Science and Technology
and Food Safety Research Institute. In addition, the straight-
line method is applied to buildings (except for the attachments
to the buildings) acquired on or after April 1, 1998.
(g) Intangible Assets (except for leased assets)
Intangible assets are amortized by the straight-line
method. Purchased software is amortized by the straight-
line method over a five-year period, the estimated useful
life used by the Group.
(h) Leased Assets
Leased assets under finance lease contracts that do not
transfer ownership to the lessee and were entered into on or
after April 1, 2008 are depreciated in a same manner as
those described in Note 2(f).
Leased assets under finance lease contracts that do not
transfer ownership to the lessee and were entered into on or
before March 31, 2008 are depreciated to a residual value of
zero by the straight-line method using the term of the con-
tract as the useful life (Note 3(b)).
(i) Accrued Retirement Benefits to Employees
Accrued retirement benefits to employees have been provided
principally at an amount calculated based on the retirement
benefit obligation and the fair value of the pension plan assets,
as adjusted for net unrecognized actuarial gain or loss and
unrecognized prior service cost. The estimated benefit is
attributed to each period by the straight-line method over the
estimated years of service of the eligible employees.
Net unrecognized actuarial gain or loss is credited or
charged to income in the year following the year in which the
gain or loss was incurred.
(j) Accrued Retirement Benefits to directors and
Corporate Auditors
At the general meeting of shareholders held on June 27, 2008,
shareholders approved abolishing the seniority-based retire-
ment benefit plan for directors, effective the same day. In
accordance with the resolution that also determined the
amount of the benefit that had been accrued until the time of
elimination of the retirement plan and that is to be paid to direc-
tors and corporate auditors when each of them retired, the
provision of the benefit stated as “accrued retirement benefits
to directors and corporate auditors” on the previous balance
sheet was reclassified as “other long-term liabilities.”
(k) Allowance for doubtful Receivables
The allowance for doubtful receivables is calculated based
on the historical experience with bad debts and an esti-
mate of certain uncollectible amounts determined after an
analysis of specific individual doubtful receivables.
(l) Income taxes
Deferred income taxes are provided for temporary differ-
ences between the balances of assets and liabilities
reported for financial reporting purposes and the corre-
sponding balances for tax reporting purposes.
(m) Amortization of goodwill and Negative goodwill
Goodwill and negative goodwill are amortized by the
straight-line method over a certain period reasonably deter-
mined for each investment on a case-by-case basis, but no
longer than 20 years, or are charged or credited to income
as incurred if the amount is deemed to be immaterial.
(n) distribution of Retained Earnings
Under the Corporation Law of Japan, the distribution of
retained earnings with respect to a given financial period
is made by resolution of the shareholders at a general
meeting held subsequent to the close of the financial
period. The accounts for that period, therefore, do not
reflect such distributions.
(a) Measurement of Inventories
Effective the year ended March 31, 2009, the Company and
its domestic consolidated subsidiaries adopted “Accounting
Standard for Measurement of Inventories” (Accounting
Standards Board of Japan (ASBJ) Statement No. 9, July 5,
2006). The standard requires revaluation of inventories if
3. ChANgES IN METhOD OF ACCOUNTINg

41NISSIN FOODS HOLDINGS CO., LTD.
the book value is less than the net realizable value or the
replacement cost. The effect of this accounting change on
consolidated operating income and income before income
taxes and minority interests was immaterial.
(b) Lease transactions
Formerly, finance lease transactions not involving the
transfer of ownership of leased assets were accounted for
in a manner similar to the accounting treatment for
operating lease transactions. However, effective the year
ended March 31, 2009, the Company and its domestic
consolidated subsidiaries applied “Accounting Standard
for Lease Transactions” (ASBJ Statement No. 13; Business
Accounting Council Committee No. 1, June 17, 1993; revised
March 30, 2007) and “Guidance on Accounting Standard
for Lease Transactions” (ASBJ Guidance No.16; the Japanese
Institute of Certified Public Accountants, Accounting
Committee, January 18, 1994; revised March 30, 2007).
Such transactions are now accounted for as ordinary sale
and purchase transactions.
For reference, the Company continues to account for
finance lease transactions not involving the transfer of
ownership that were contracted on or before March 31,
2008 in a manner similar to the accounting treatment for
ordinary operating lease transactions.
The effect of the change in accounting standard on
consolidated operating income and income before income
taxes and minority interest for the year ended March 31,
2009 was immaterial.
(c) Unification of Accounting policies of
Foreign Subsidiaries
Effective the year ended March 31, 2009, the Company and
its overseas consolidated subsidiaries adopted “Practical
Solution on Unification of Accounting Policies Applied to
Foreign Subsidiaries for Consolidated Financial Statements”
(the Practical Issues Task Force of ASBJ No. 18, May 17,
2006), which requires unification of accounting policies
applied to consolidated overseas subsidiaries. The adop-
tion has no effect of on consolidated operating results for
the year ended March 31, 2009.
(d) Related party transactions
Effective the year ended March 31, 2009, the Group has
adopted “Accounting Standard for Related Party Disclosures”
(ASBJ Statement No. 11 issued on October 17, 2006) and
“Guidance on Accounting Standard for Related Party
Disclosures” (ASBJ Guidance No. 13 issued on October 17,
2006). As a result of the adoption of these accounting stan-
dards related party transactions of the Company and its
consolidated subsidiaries were initially disclosed for the year
ended March 31, 2009.
(e) Change in Useful Lives for depreciation
In accordance with the revision of the Corporate Tax Law
of Japan, effective the year ended March 31, 2009, the
Company and its domestic consolidated subsidiaries
have changed useful life of machinery. The effect of this
accounting change on consolidated operating income
and income before income taxes and minority interests
was immaterial.
(f) Method of depreciation Applicable to tangible Fixed
Assets Acquired on or after April 1, 2007
In accordance with the revision of the Corporate Tax Law
of Japan, effective the fiscal year ended March 31, 2008,
the Company and its domestic consolidated subsidiaries
changed their method of accounting for depreciation of
tangible fixed assets acquired on and after April 1, 2007 to
conform it to the revised Corporate Tax Law of Japan.
As a result of this accounting change, consolidated
operating income and income before income taxes and
minority interests decreased by ¥357 million for the year
ended March 31, 2008 from the corresponding amounts
which would have been recorded under the method
applied in the previous year.
The details of the effects of this accounting change
on segment information are shown in Note 19, “Segment
Information.”
(g) depreciation of Residual Value of tangible Fixed
Assets Acquired on or before March 31, 2007
In accordance with the revision of the Corporate Tax Law
of Japan, effective the fiscal year ended March 31, 2008,
the Company and its domestic consolidated subsidiaries
additionally depreciate the tangible fixed assets that were
acquired on or before March 31, 2007 and that had been
fully depreciated to their respective depreciable limits
allowed by the Corporate Tax Law of Japan prior to the
revision. The additional depreciable amount was depreci-
ated by the straight-line method over a period of 5 years
based on the difference between the residual value stipu-
lated by the Corporate Tax Law of Japan prior to the
revision and memorandum value.
As a result of this accounting change, consolidated
operating income, and income before income taxes and
minority interests decreased by ¥317 million for the year
ended March 31, 2008 from the corresponding amounts
which would have been recorded under the method
applied in the previous year.
The details of the effects of this accounting change
on segment information are shown in Note 19, “Segment
Information.”

42 NISSIN FOODS HOLDINGS CO., LTD.
(a) Information regarding marketable securities classified as other securities at March 31, 2009 and 2008 is summarized as follows:
5. SECURITIES
Millions of yen Thousands of U.S. dollars
March 31, 2009 Acquisition cost
Carrying value
Unrealized gain (loss)
Acquisition cost
Carrying value
Unrealized gain (loss)
Securities whose carrying value exceeds their acquisition cost:I. Equity securities ¥ 18,098 ¥ 25,712 ¥ 7,614 $ 184,241 $ 261,753 $ 77,512II. Bonds
National government 600 603 3 6,108 6,139 31Corporate 10,064 10,087 23 102,453 102,687 234Subtotal ¥ 28,762 ¥ 36,402 ¥ 7,640 $ 292,802 $ 370,579 $ 77,777
Securities whose carrying value does not exceed their acquisition cost:I. Equity securities ¥ 28,679 ¥ 24,542 ¥ (4,137) $ 291,958 $ 249,843 $ (42,115)II. Bonds
National government 300 300 (0) 3,054 3,054 (0)Corporate 50,151 48,393 (1,758) 510,547 492,650 (17,897)Other 6,726 6,169 (557) 68,472 62,802 (5,670)
III. Other 1,715 1,715 (0) 17,458 17,458 (0)Subtotal ¥ 87,571 ¥ 81,119 ¥ (6,452) $ 891,489 $ 825,807 $ (65,682)
Total ¥ 116,333 ¥ 117,521 ¥ 1,188 $ 1,184,291 $ 1,196,386 $ 12,095
Millions of yen
March 31, 2008 Acquisition cost
Carrying value
Unrealized gain (loss)
Securities whose carrying value exceeds their acquisition cost:I. Equity securities ¥ 25,105 ¥ 37,366 ¥ 12,261 II. Bonds
National government 1,298 1,302 4 Corporate 11,692 11,716 24 Other 540 540 0
III. Other 12 20 8 Subtotal ¥ 38,647 ¥ 50,944 ¥ 12,297
Securities whose carrying value does not exceed their acquisition cost:I. Equity securities ¥ 18,364 ¥ 16,531 ¥ (1,833)II. Bonds
National government 10,503 10,500 (3)Corporate 45,667 44,940 (727)Other 7,250 6,733 (517)
III. Other 1,000 781 (219)Subtotal ¥ 82,784 ¥ 79,485 ¥ (3,299)
Total ¥ 121,431 ¥ 130,429 ¥ 8,998
A reconciliation of cash and deposits in the consolidated balance sheets and cash and cash equivalents in the consoli-
dated statements of cash flows at March 31, 2009 and 2008 is as follows:
4. CASh AND CASh EQUIVALENTS
Millions of yen Thousands of U.S. dollars
2009 2008 2009Cash and deposits ¥ 65,903 ¥ 66,740 $ 670,905 Time deposits with maturities exceeding three months (4,711) (5,066) (47,959)Marketable securities redeemable within three months 10,299 17,100 104,846 Cash and cash equivalents ¥ 71,491 ¥ 78,774 $ 727,792

43NISSIN FOODS HOLDINGS CO., LTD.
Millions of yenThousands of U.S. dollars
March 31, 2009 2008 2009Other securities
Unlisted equity securities ¥ 13,926 ¥ 3,335 $ 141,769Jointly-operated designated money trust 10,000 6,500 101,802Preferred equity securities — 5,000 —Other 523 522 5,324
(c) The carrying value of principal non-marketable other securities at March 31, 2009 and 2008 is summarized as follows:
Millions of yen
Due within one year
Due after one year through five years
Due after five years through ten years
Due after ten years
I. BondsNational government ¥ 300 ¥ 603 ¥ — ¥ —Corporate 7,196 14,016 22,486 7,213Other — 6,169 — —
II. Other 10,151 267 106 —Total ¥ 17,647 ¥ 21,055 ¥ 22,592 ¥ 7,213
Thousands of U.S. dollars
Due within one year
Due after one year through five years
Due after five years through ten years
Due after ten years
I. BondsNational government $ 3,054 $ 6,139 $ — $ —Corporate 73,257 142,686 228,912 73,430Other — 62,802 — —
II. Other 103,339 2,718 1,079 —Total $ 179,650 $ 214,345 $ 229,991 $ 73,430
(d) The redemption schedule for securities with maturity dates classified as other securities as of March 31, 2009 is sum-
marized as follows:
Inventories as of March 31, 2009 and 2008 are summarized as follows:
6. INVENTORIES
Millions of yenThousands of U.S. dollars
2009 2008 2009Merchandise and Finished goods ¥ 8,235 ¥ 8,570 $ 83,834Raw materials and supplies 6,991 6,105 71,170Total ¥ 15,226 ¥ 14,675 $ 155,004
Millions of yenThousands of U.S. dollars
March 31, 2009 2008 2007 2009Proceeds from sales ¥ 18,311 ¥ 12,437 ¥ 26,802 $ 186,409Aggregate gain 2,063 156 677 21,002Aggregate loss 41 — 39 417
(b) Sales of investments in securities classified as other securities for the years ended March 31, 2009, 2008 and 2007 are
summarized as follows:

44 NISSIN FOODS HOLDINGS CO., LTD.
Based on the Land Revaluation Law and the Amended Land
Revaluation Law, the Company revalued the land it holds for
use in the course of ongoing operations at March 31, 2002.
The resulting land revaluation difference represents an unre-
alized devaluation of land and has been debited directly, net
of income taxes, under “Land revaluation reserve” in net
assets. There was no effect on the accompanying consoli-
dated statements of income for the years ended March 31,
2009, 2008 and 2007. Deferred tax assets on unrealized loss
on land revaluation were shown in the accounts up to the
year ended March 31, 2005. As a result of an evaluation of
the collectability of deferred tax assets on March 31, 2006,
the amounts recorded in these accounts were reduced and
reclassified to “Land revaluation reserve.” The market value
of the land as of March 31, 2009 and 2008 declined by
¥7,304 million (U.S.$74,356 thousand) and ¥7,137 million,
respectively, compared with the carrying value of the land
revalued as of March 31, 2002.
8. LAND REVALUATION RESERVE
The Group recognized losses on impairment of fixed assets for the years ended March 31, 2009, 2008 and 2007 as follows:
Location Usage Asset type
(March 31, 2009)
MYOJO FOODS CO., LTD. Idle assets Machinery and equipment
AJI-NO-MINGEI FOOD SERVICE CO., LTD. Business assets Buildings, machinery and equipment
(March 31, 2008)
Ritto City, Shiga Prefecture and one other location Idle assets Buildings, machinery and equipment
Nissin Plastics Co., Ltd. Business assets Machinery and equipment
Nissin Foods (U.S.A.) Co., Inc. Business assets Buildings, machinery and equipment
MYOJO FOOD SERVICE CO., LTD. Business assets Buildings, machinery and equipment
(March 31, 2007)
Hanyu City, Saitama Prefecture Business assets Buildings, machinery and equipment
Toride City, Ibaraki Prefecture and two other locations Idle assets Buildings, machinery and equipment
MYOJO FOOD SERVICE CO., LTD. and three other companies
Business assets Buildings, machinery and equipment
7. LOSS ON IMPAIRMENT OF FIxED ASSETS
The Group groups fixed assets by manufacturing unit or
usage. The Group also groups idle fixed assets individually.
Consequently, the Group has written down the carrying
value of operating fixed assets whose profitability declined
and idle fixed assets whose fair value declined to their
respective net recoverable value or memorandum value
and the Group recorded loss on impairment of fixed assets
of ¥125 million (U.S.$1,273 thousand) in the accompanying
consolidated statement of income for the year ended March
31, 2009. The impairment loss for the year ended March 31,
2009 consisted of losses on buildings and structures of ¥42
million (U.S.$428 thousand), machinery, equipment and
vehicles of ¥82 million (U.S.$835 thousand), and other fixed
assets of ¥1 million (U.S.$10 thousand).
Loss on impairment of fixed assets recognized in the
year ended March 31, 2008 was ¥2,370 million. This impair-
ment loss consisted of losses of ¥406 million on buildings
and structures, of ¥1,826 million on machinery, equipment
and vehicles and of ¥138 million on other fixed assets.
Loss on impairment of fixed assets recognized in the
year ended March, 2007 was ¥1,129 million. This impair-
ment loss consisted of losses of ¥504 million on buildings
and structures, of ¥555 million on machinery, equipment
and vehicles, of ¥43 million on land and of ¥27 million on
other fixed assets.
The recoverable value of the fixed assets for the years
ended March 31, 2009, 2008 and 2007 have been mea-
sured using their net selling value based on an appraisal
value determined by specialists and their value in use which
is based on the estimated future cash flows discounted at
5.0%, 5.0% and 3.0%, respectively.

45NISSIN FOODS HOLDINGS CO., LTD.
Assets pledged as collateral for short-term borrowings of ¥2,193 million (U.S.$22,325 thousand) and current portion of long-
term debt of ¥623 million (U.S.$6,342 thousand) on the consolidated balance sheets as of March 31, 2009 and 2008 are
summarized as follows:
10. PLEDgED ASSETS
Millions of yenThousands of U.S. dollars
2009 2008 2009
Land ¥ 665 — $ 6,770Buildings and structures 408 — 4,154Investments in securities 488 — 4,968
Short-term borrowings, which amounted to ¥4,636 million
(U.S.$47,195 thousand) and ¥2,353 million as of March
31, 2009 and 2008, respectively, generally represent notes
payable to banks. Long-term debt (excluding the current
portion thereof), amounted to ¥5,442 million (U.S.$55,401
thousand) as of March 31, 2009.
The average interest rates on short-term borrowings
were 1.78% and 1.84% at March 31, 2009 and 2008,
respectively. The average interest rate on long-term bor-
rowings at March 31, 2009 was 1.78%.
9. ShORT-TERM BORROwINgS AND LONg-TERM DEBT
The aggregate annual maturities of long-term debt subsequent to March 31, 2009 are summarized as follows:
Years ending March 31: Millions of yen Thousands of U.S. dollars
2010 ¥ 705 $ 7,1772011 379 3,8582012 277 2,8202013 275 2,8002014 4,128 42,0242015 and thereafter 383 3,899Total ¥ 6,147 $ 62,578
Long-term debt at March 31, 2009 is as follows:
Millions of yen Thousands of U.S. dollars
Secured long-term borrowings at interest rates ranging from 1.89% to 2.88% ¥ 623 $ 6,342Unsecured long-term borrowings at interest rates ranging from 1.69% to 2.54% 5,446 55,442Lease obligation 78 794
¥ 6,147 $ 62,578Current portion of long-term debt (705) (7,177)
¥ 5,442 $ 55,401
The Company and domestic consolidated subsidiaries
have defined benefit pension plans, i.e., welfare pension
fund plans, tax-qualified pension plans and lump-sum
payment plans, covering substantially all employees who
are entitled to lump-sum or annuity payments, the amounts
of which are determined by reference to their basic rates
of pay, length of service, and the conditions under which
termination occurs. The Company converted its tax quali-
fied pension plans to welfare pension fund plans in 1989.
The following table sets forth the funded and accrued
status of the plans and the amounts recognized in the
accompanying consolidated balance sheets as of March
31, 2009 and 2008 for the Company’s and the consoli-
dated subsidiaries’ defined benefit pension plans:
11. ACCRUED RETIREMENT BENEFITS TO EMPLOYEES

46 NISSIN FOODS HOLDINGS CO., LTD.
Income taxes applicable to the Company and its domestic
consolidated subsidiaries comprise corporate taxes,
inhabitants’ taxes and enterprise taxes which, in the
aggregate, resulted in a statutory tax rate of 40.33% for
the years ended March 31, 2009, 2008 and 2007. Overseas
consolidated subsidiaries are subject to the income taxes
of the respective countries in which they operate.
The effective tax rates for the years ended March 31,
2009, 2008 and 2007 differ from the Company’s statutory
tax rate for the following reasons:
12. INCOME TAxES
2009 2008 2007Statutory tax rate 40.33% 40.33% 40.33%Corporate tax credit (0.83) (1.20) (1.10)Equity in earnings of affiliates (1.32) (1.75) (0.57)Loss on devaluation of investments in securities (5.19) 3.00 —Non-deductible expenses 1.24 — —Accrued retirement benefits to directors and corporate auditors — 3.33 —Tax loss carryforwards recorded by consolidated subsidiaries — 8.17 4.19Difference in consolidated subsidiaries' applicable tax rates (2.23) (2.04) 0.12Other (0.40) 1.73 0.35Effective tax rates 31.60% 51.57% 43.32%
Millions of yenThousands of U.S. dollars
2009 2008 2009(a) Retirement benefit obligation (Note 2) ¥ (45,718) ¥ (44,083) $ (465,418)(b) Plan assets at fair value 23,299 29,902 237,188(c) Unfunded retirement benefit obligation (a+b) (22,419) (14,181) (228,230)(d) Unrecognized actuarial loss (gain) 7,159 5,552 72,880(e) Accrued retirement benefits to employees, net (c+d) (15,260) (8,629) (155,350)(f) Prepaid pension cost 0 13 0(g) Accrued retirement benefits for employees (e-f) ¥ (15,260) ¥ (8,642) $ (155,350)
Notes: 1. The above amounts include the substitutional portion of the employees’ pension fund. 2. Domestic consolidated subsidiaries apply a simplified method to calculate retirement benefit obligation.
Notes: 1. Employees’ contributions to the welfare pension fund have been excluded. 2. The components of retirement benefit costs of certain domestic consolidated subsidiaries, which have been calculated by a simplified method are
included in service cost in the above table.
Millions of yenThousands of U.S. dollars
2009 2008 2007 2009(a) Service cost (Notes 1 and 2) ¥ 2,001 ¥ 2,061 ¥ 1,566 $ 20,370(b) Interest cost 1,002 917 913 10,201(c) Expected return on plan assets (683) (797) (727) (6,953)(d) Amortization of actuarial (gain) loss 5,552 (1,016) (4,641) 56,520Total net periodic pension cost ¥ 7,872 ¥ 1,165 ¥ (2,889) $ 80,138
The components of retirement benefit costs for the years ended March 31, 2009, 2008 and 2007 were as follows:
The assumptions used in accounting for the above plans were a discount rate that was principally 2.5% and an expected
rate of return on plan assets of 2.5% for the years ended March 31, 2009, 2008 and 2007.

47NISSIN FOODS HOLDINGS CO., LTD.
The Corporation Law of Japan (the “Law”), provides that
an amount equal to 10% of the amount to be disbursed as
distributions of capital surplus (other than the capital
reserve) and retained earnings (other than the legal
reserve) be transferred to the capital reserve and the legal
reserve, respectively, until the sum of the capital reserve
and the legal reserve equals 25% of the capital stock
account. Such distributions can be made at any time by
resolution of the shareholders, or by the Board of Directors
if certain conditions are met.
The Company’s legal reserve included in retained earn-
ings at March 31, 2009 and 2008 amounted to ¥6,280
million (U.S.$63,932 thousand).
Under the Law, upon the issuance and sale of new
shares of capital stock, the entire amount of the proceeds
is required to be accounted for as capital stock, although
a company may, by resolution of the Board of Directors,
account for an amount not exceeding one-half of the pro-
ceeds of the sale of new shares as additional paid-in
capital included in capital surplus.
Movements in issued common stock and treasury stock for the years ended March 31, 2009 and 2008 are summarized as follows:
The tax effects of temporary differences which gave rise to significant portions of the deferred tax assets and liabilities at
March 31, 2009 and 2008 are presented below:
13. ShAREhOLDERS’ EQUITY
Millions of yenThousands of U.S. dollars
2009 2008 2009deferred tax assets:
Unrealized losses on securities ¥ 3,720 ¥ 10,480 $ 37,870Accrued retirement benefits to employees 6,166 3,495 62,771Accounts payable 1,817 2,505 18,497Loss on impairment of fixed assets 927 1,229 9,437Accrued retirement benefits to directors and corporate auditors — 935 —Accrued bonuses 1,160 984 11,809Depreciation and amortization 1,180 803 12,013Tax loss carryforwards of consolidated subsidiaries 9,373 10,278 95,419Other 3,606 2,028 36,710
Gross deferred tax assets 27,949 32,737 284,526Less: Valuation allowance (16,637) (23,071) (169,368)Total deferred tax assets 11,312 9,666 115,158deferred tax liabilities:
Deferred capital gain on properties (2,163) (2,287) (22,020)Unrealized holding gain on securities (275) (3,781) (2,800)Revaluation gain recognized upon consolidation (5,847) (5,853) (59,524)Other (775) (142) (7,888)
Total deferred tax liabilities (9,060) (12,063) (92,232)Net deferred tax (liabilities) assets ¥ 2,252 ¥ (2,397) $ 22,926
Number of shares
2009March 31, 2008 Increase Decrease March 31, 2009
Common stock and treasury stock:Common stock 127,463,685 — — 127,463,685Treasury stock 5,202,867 4,511 1,250 5,206,128
Number of shares
2008March 31, 2007 Increase Decrease March 31, 2008
Common stock and treasury stock:Common stock 127,463,685 — — 127,463,685Treasury stock 5,197,203 6,246 582 5,202,867

48 NISSIN FOODS HOLDINGS CO., LTD.
Future minimum lease payments subsequent to March 31, 2009 for finance leases accounted for as operating leases are
summarized as follows:
Year ending March 31, Millions of yen Thousands of U.S. dollars
2010 ¥ 293 $ 2,9832011 and thereafter 377 3,838Total ¥ 670 $ 6,821
Note: The acquisition cost and future minimum lease payments under finance leases presented in the above tables include the imputed interest expense.
Millions of yen Thousands of U.S. dollars
2009 Acquisition cost
Accumulated depreciation/amortization
Net book value
Acquisition cost
Accumulated depreciation/amortization
Net book value
Machinery and vehicles ¥ 1,089 ¥ 762 ¥ 327 $ 11,086 $ 7,757 $ 3,329Equipment 522 298 224 5,314 3,034 2,280Intangible fixed assets and other 229 110 119 2,332 1,120 1,212
Total ¥ 1,840 ¥ 1,170 ¥ 670 $ 18,732 $ 11,911 $ 6,821
Millions of yen
2008 Acquisition cost
Accumulated depreciation/amortization
Net book value
Machinery and vehicles ¥ 1,352 ¥ 803 ¥ 549Equipment 492 223 269Intangible fixed assets and other 152 48 104
Total ¥ 1,996 ¥ 1,074 ¥ 922
Lease assets presented in the accompanying consoli-
dated balance sheets as of March 31, 2009 consisted of
those under finance lease contracts that do not transfer
ownership to the lessee and were entered into on or after
April 1, 2008 principally for vending machines for the
instant noodle business.
The following pro-forma amounts represent the acquisi-
tion cost, accumulated depreciation/amortization and net
book value of the property leased to the Group at March 31,
2009 and 2008, which would have been reflected in the
accompanying consolidated balance sheets if finance
leases without transferring the ownership to the lessee
starting on or before March 31, 2008 which are currently
accounted for as operating leases had been capitalized:
16. LEASES
Costs relating to research and development activities are
charged to income as incurred. Research and development
costs included in cost of sales and selling, general and
administrative expenses totaled ¥3,477 million (U.S.$35,397
thousand), ¥3,446 million and ¥3,164 million for the years
ended March 31, 2009, 2008 and 2007, respectively.
14. RESEARCh AND DEVELOPMENT COSTS
15. OThER INCOME (ExPENSES)
product recall expenses
Product recall expenses for the year ended March 31, 2008 were the expenses incurred in relation to the product recall conducted
by Nissin Foods (U.S.A.) Co., Inc.

49NISSIN FOODS HOLDINGS CO., LTD.
Lease payments relating to finance leases accounted for as
operating leases in the accompanying consolidated financial
statements amounted to ¥347 million (U.S.$3,533 thousand),
¥385 million and ¥367 million, which were approximately
equal to the depreciation/amortization of the leased assets
computed by the straight-line method over the respective
lease terms assuming a nil residual value, for the years ended
March 31, 2009, 2008 and 2007, respectively.
The Group utilizes forward foreign exchange contracts
and interest rate swap contracts to manage risk arising
from adverse fluctuations in foreign currency exchange
rates and interest rates. The Group does not enter into
derivatives contracts for speculative or short-term
trading purposes.
The Group has established certain policies which were
approved at a management meeting of the Company. In
accordance with these policies, the Finance and Accounting
Division of the Company controls and executes these deriv-
atives. An evaluation of hedge effectiveness has been
omitted since the significant conditions of the hedging
instruments and hedged items were the same and the risk
of changes in cash flows was completely avoided.
The Group enters into these derivatives with financial
institutions with high credit ratings to reduce the risk of
credit loss in the event of non-performance by the counter-
parties to the contracts.
Disclosure of fair value information on derivatives of for-
ward foreign exchange contracts has been omitted because
almost all open derivatives positions qualified for hedge
accounting at March 31, 2009 and 2008.
17. DERIVATIVE FINANCIAL INSTRUMENTS
The amounts per share of net assets have been computed
based on the number of shares of common stock outstand-
ing at the year end. Basic net income per share has been
computed based on the net income available for distribution
to shareholders of common stock and the weighted-average
number of shares of common stock outstanding during the
year. Diluted net income per share has not been presented
because there were no potentially dilutive shares at March
31, 2009, 2008 and 2007.
Cash dividends per share represent the cash dividends
proposed by the Board of Directors as applicable to the
respective fiscal years together with the interim cash divi-
dends paid.
18. AMOUNTS PER ShARE
Yen U.S. dollars
2009 2008 2007 2009Net assets ¥ 2,287.21 ¥ 2,310.36 ¥ 2,304.40 $ 23.28Net income:
Basic 129.98 111.17 156.12 1.32Cash dividends applicable to the year 50.00 50.00 50.00 0.51
Amounts per share at March 31, 2009, 2008 and 2007 and for the years then ended were as follows:
At March 31, 2009, the other outstanding derivative positions are as follows:
Thousands of U.S. dollars Millions of yen Thousands of U.S. dollars
2009 Contracts outstanding
Expired beyond one year
Fair valueUnrealized gain
(loss)Fair value
Unrealized gain (loss)
Currency options:
Call options on U.S. dollars, Buy $ 11,500 $ 8,500 ¥ 56 ¥ 56 $ 570 $ 570Put options on U.S. dollars, Sell 16,100 11,900 (85) (85) (865) (865)Total ¥ (29) ¥ (29) $ (295) $ (295)
Notes: 1. Fair values of currency option contracts are valued at the market rates reported by the financial institutions handling these transactions for the Group.
2. Items for which hedge accounting is applied are excluded from the above table disclosure.

50 NISSIN FOODS HOLDINGS CO., LTD.
Thousands of U.S. dollars
Year ended March 31, 2009 Instant noodle and associated business
Other business
Eliminationsor corporate
Consolidated
I. Sales and operating income
Sales to third parties $ 3,286,542 $ 399,267 $ — $ 3,685,809Intersegment sales 30 63,697 (63,727) —
Total 3,286,572 462,964 (63,727) 3,685,809Operating expenses 3,066,120 437,748 (57,823) 3,446,045
Operating income $ 220,452 $ 25,216 $ (5,904) $ 239,764
II. Total assets, depreciation and amortization, loss on impairment of fixed assets and capital investment
Total assets $ 2,236,822 $ 274,366 $ 1,649,751 $ 4,160,939Depreciation and amortization 69,704 8,612 2,861 81,177Loss on impairment of fixed assets 825 448 — 1,273Capital investment 109,030 15,881 53,975 178,886
Notes: 1. Operating expenses under “Eliminations or corporate” that cannot be allocated to any particular segment amounted to ¥6,788 million (U.S.$69,103 thousand) and consisted of mainly payroll cost in the back office division, general expenses and amortization of goodwill.
2. Total assets under “Eliminations or corporate” that cannot be allocated to any particular segment amounted to ¥208,835 million (U.S.$2,125,980 thousand), and consisted of mainly surplus investment fund (including cash and marketable securities), long-term investment fund (including investments in securities) and, assets associated with the back office division and goodwill.
3. As described in Note 21, the Group has changed its corporate organization to a holding company structure, as a result there were decreases in the instant noodle and associated business segment and corresponding increases in the elimination or corporate segment amounting to ¥6,195 million (U.S.$63,066 thousand) for operating expenses, ¥204,507 million (U.S.$2,081,920 thousand) of total assets, ¥280 million (U.S.$2,850 thousand) of depreciation and amortization and ¥5,302 million (U.S.$53,975 thousand) of capital investment, as compared to the corresponding amounts which would have been recorded under the previous method.
The Group classifies its businesses into two segments prin-
cipally based on product types and characteristics: the
instant noodle and associated business and other busi-
ness. The instant noodle and associated business includes
pillow-type instant noodles, cup-type instant noodles,
chilled foods and frozen foods. The other business includes
confectionaries, beverages and the food service business.
The following tables present the business and geographic
segment information and the overseas sales of the Group for
the years ended March 31, 2009, 2008 and 2007:
19. SEgMENT INFORMATION
Millions of yen
Year ended March 31, 2009 Instant noodle and associated business
Other business
Eliminationsor corporate
Consolidated
I. Sales and operating income
Sales to third parties ¥ 322,837 ¥ 39,220 ¥ — ¥ 362,057Intersegment sales 3 6,257 (6,260) —
Total 322,840 45,477 (6,260) 362,057Operating expenses 301,185 43,000 (5,680) 338,505
Operating income ¥ 21,655 ¥ 2,477 ¥ (580) ¥ 23,552
II. Total assets, depreciation and amortization, loss on impairment of fixed assets and capital investment
Total assets ¥ 219,723 ¥ 26,951 ¥ 162,055 ¥ 408,729Depreciation and amortization 6,847 846 281 7,974Loss on impairment of fixed assets 81 44 — 125Capital investment 10,710 1,560 5,302 17,572
(a) information by business Segment

51NISSIN FOODS HOLDINGS CO., LTD.
Millions of yen
Year ended March 31, 2008 Instant noodle and associated business
Other business
Eliminations or corporate
Consolidated
I. Sales and operating income
Sales to third parties ¥ 346,822 ¥ 38,648 ¥ — ¥ 385,470
Intersegment sales — 5,764 (5,764) —
Total 346,822 44,412 (5,764) 385,470 Operating expenses 321,448 41,833 (5,483) 357,798
Operating income ¥ 25,374 ¥ 2,579 ¥ (281) ¥ 27,672
II. Total assets, depreciation and amortization, loss on impairment of fixed assets and capital investment
Total assets ¥ 364,287 ¥ 25,677 ¥ 2,731 ¥ 392,695
Depreciation and amortization 6,732 794 — 7,526
Loss on impairment of fixed assets 2,259 111 — 2,370 Capital investment 9,847 919 — 10,766
Millions of yen
Year ended March 31, 2007 Instant noodle and associated business
Other business
Eliminations or corporate
Consolidated
I. Sales and operating income
Sales to third parties ¥ 325,468 ¥ 32,770 ¥ — ¥ 358,238
Intersegment sales — 6,091 (6,091) —
Total 325,468 38,861 (6,091) 358,238Operating expenses 293,115 36,609 (5,221) 324,503
Operating income ¥ 32,353 ¥ 2,252 ¥ (870) ¥ 33,735
II. Depreciation and amortization, loss on impairment of fixed assets
Depreciation and amortization ¥ 5,338 ¥ 850 ¥ — ¥ 6,188
Loss on impairment of fixed assets 973 156 — 1,129
Notes: 1. Operating expenses under “Eliminations or corporate” that cannot be allocated to any particular segment amounted to ¥492 million, and consisted of mainly amortization of goodwill.
2. Total assets under “Eliminations or corporate” that cannot be allocated to any particular segment amounted to ¥3,863 million, and consisted of mainly goodwill.
3. As a result of accounting change described in Note 3(f), operating expenses of the instant noodle and associated business and the other business increased by ¥341 million and ¥16 million, respectively, and operating income of these businesses decreased by the same amounts for the year ended March 31, 2008 as compared to the corresponding amounts which would have been recorded under the previous method.
4. As a result of accounting change described in Note 3(g), operating expenses of the instant noodle and associated business and the other business increased by ¥264 million and ¥53 million, respectively, and operating income of these businesses decreased by the same amounts for the year ended March 31, 2008 as compared to the corresponding amounts which would have been recorded under the previous method.
Note: Operating expenses under “Eliminations or corporate” that cannot be allocated to any particular segment amounted to ¥503 million, and consisted of mainly amortization of goodwill.

52 NISSIN FOODS HOLDINGS CO., LTD.
Notes: 1. Operating expenses under “Eliminations or corporate” that cannot be allocated to any particular segment amounted to ¥492 million, and consisted of mainly amortization of goodwill.
2. Total assets under “Eliminations or corporate” that cannot be allocated to any particular segment amounted to ¥3,863 million, and consisted of mainly goodwill.
3. As a result of accounting change described in Note 3(f), operating expenses of the Japan segment increase by ¥357 million, and operating income of this segment decreased by the same amount for the year ended March 31, 2008 as compared to the corresponding amounts which would have been recorded under the previous method.
4. As a result of accounting change described in Note 3(g), operating expenses of the Japan segment increased by ¥317 million, and operating income of this segment decreased by the same amount for the year ended March 31, 2008 as compared to the corresponding amounts which would have been recorded under the previous method.
Notes: 1. Classification of the countries or regions is based on geographical proximity. 2. Major countries and regions included in areas other than Japan: (1) North America: The U.S.A. and Mexico (2) Other areas: China, Germany and Hungary 3. Operating expense under “Eliminations or corporate” that cannot be allocated to any particular segment amounted to ¥6,788 million (U.S.$69,103
thousand), consisted of mainly payroll costs in the back office division, general expenses and the amortization of goodwill. 4. Total assets under “Eliminations or corporate” that cannot be allocated to any particular segment amounted to ¥208,835 million (U.S.$2,125,980
thousand), and consisted of mainly surplus investment funds (including cash and marketable securities), long-term investment funds (including investments in securities), assets associated with the back office division and goodwill.
5. As described in Note 21, the Group changed its corporate structure to a holding company structure. As a result of this change, operating expense in the Japan segment was decreased by ¥6,195 million (U.S.$63,066 thousand) and the eliminations and corporate were increased by the same amount for the year ended March 31, 2009, and the assets under the Japan segment decreased by ¥204,507 million (U.S.$2,081,920 thousand) and “Eliminations or corporate” increased by the same amount at March 31, 2009 as compared to the corresponding amounts which would have been recorded under the previous method.
Millions of yen
Year ended March 31, 2008 JapanNorth
AmericaOther areas
Eliminations or corporate
Consolidated
I. Sales and operating income (loss)
Sales to third parties ¥ 329,984 ¥ 29,559 ¥ 25,927 ¥ — ¥ 385,470
Intersegment sales 1,220 — 596 (1,816) —
Total 331,204 29,559 26,523 (1,816) 385,470Operating expenses 302,238 32,185 24,703 (1,328) 357,798
Operating income (loss) ¥ 28,966 ¥ (2,626) ¥ 1,820 ¥ (488) ¥ 27,672
II. Total assets ¥ 361,834 ¥ 12,423 ¥ 33,975 ¥ (15,537) ¥ 392,695
Millions of yen
Year ended March 31, 2009 JapanNorth
AmericaOther areas
Eliminationsor corporate
Consolidated
I. Sales and operating income (loss)
Sales to third parties ¥ 311,954 ¥ 26,126 ¥ 23,977 ¥ — ¥ 362,057Intersegment sales 1,266 14 205 (1,485) —
Total 313,220 26,140 24,182 (1,485) 362,057Operating expenses 289,474 27,622 22,237 (828) 338,505
Operating income (loss) ¥ 23,746 ¥ (1,482) ¥ 1,945 ¥ (657) ¥ 23,552II. Total assets ¥ 179,501 ¥ 10,210 ¥ 29,906 ¥ 189,112 ¥ 408,729
Thousands of U.S. dollars
Year ended March 31, 2009 JapanNorth
AmericaOther areas
Eliminationsor corporate
Consolidated
I. Sales and operating income (loss)
Sales to third parties $ 3,175,751 $ 265,968 $ 244,090 $ — $ 3,685,809Intersegment sales 12,888 143 2,087 (15,118) —
Total 3,188,639 266,111 246,177 (15,118) 3,685,809Operating expenses 2,946,900 281,197 226,377 (8,429) 3,446,045
Operating income (loss) $ 241,739 $ (15,086) $ 19,800 $ (6,689) $ 239,764II. Total assets $ 1,827,354 $ 103,940 $ 304,449 $ 1,925,196 $ 4,160,939
(b) information by geographic Segment

53NISSIN FOODS HOLDINGS CO., LTD.
Millions of yen
Year ended March 31, 2007 JapanNorth
AmericaOther areas
Eliminations or corporate
Consolidated
I. Sales and operating income (loss)
Sales to third parties ¥ 303,718 ¥ 30,505 ¥ 24,015 ¥ — ¥ 358,238
Intersegment sales 1,277 — 656 (1,933) —
Total 304,995 30,505 24,671 (1,933) 358,238Operating expenses 270,749 32,770 22,434 (1,450) 324,503
Operating income (loss) ¥ 34,246 ¥ (2,265) ¥ 2,237 ¥ (483) ¥ 33,735
Note: Operating expenses under “Eliminations or corporate” that cannot be allocated to any particular segment amounted to ¥503 million, and consisted of mainly amortization of goodwill.
(c) overseas Sales
Overseas sales, which include export sales of the Company
and its domestic consolidated subsidiaries and sales
(other than exports to Japan) of the overseas consolidated
subsidiaries, for the years ended March 31, 2009, 2008 and
2007 are summarized as follows:
Millions of yen Thousands of U.S. dollars
Year ended March 31, 2009 North America
Other areas
TotalNorth
AmericaOther areas
Total
Overseas sales ¥ 26,599 ¥ 24,554 ¥ 51,153 $ 270,783 $ 249,964 $ 520,747Consolidated sales — — 362,057 — — 3,685,809Overseas sales as a percentage of consolidated sales
7.3% 6.8% 14.1% 7.3% 6.8% 14.1%
Millions of yen
Year ended March 31, 2008 North America
Other areas
Total
Overseas sales ¥ 29,859 ¥ 26,400 ¥ 56,259Consolidated sales — — 385,470Overseas sales as a percentage of consolidated sales
7.7% 6.9% 14.6%
Millions of yen
Year ended March 31, 2007 North America
Other areas
Total
Overseas sales ¥ 30,831 ¥ 25,075 ¥ 55,906Consolidated sales — — 358,238Overseas sales as a percentage of consolidated sales
8.6% 7.0% 15.6%
Notes: 1. Classification of the countries or regions is based on geographical proximity. 2. Principal countries classified in the above regions: North America: U.S.A. and Mexico Other areas: China, Hungary and Germany 3. Overseas sales represent the sum total of sales to the overseas market outside Japan
by the Company and its consolidated subsidiaries. (Sales between consolidated subsidiaries are not included.)

54 NISSIN FOODS HOLDINGS CO., LTD.
outliNe oF the Corporate Split
Name of newly incorporated subsidiary
NISSIN FOODS CO., LTD.
NISSIN CHILLED FOODS CO., LTD.
NISSIN FROZEN FOODS CO., LTD.
NISSIN BUSINESS SUPPORT CO., LTD.
Business transferred Production and sale of instant noodles
Production and sale of chilled foods
Production and sale of frozen foods
Support of indirect administrative services for the Group
Number of shares issued 100 shares 100 shares 100 shares 100 shares
Common stock ¥5,000 million(U.S.$50,901 thousand)
¥100 million (U.S.$1,018 thousand)
¥100 million(U.S.$1,018 thousand)
¥50 million(U.S.$509 thousand)
Assets transferred ¥66,875 million(U.S.$680,800 thousand)
¥6,331 million(U.S.$64,451 thousand)
¥5,837 million(U.S.$59,422 thousand)
¥1,573 million(U.S.$16,013 thousand)
Liabilities transferred ¥25,106 million(U.S.$255,584 thousand)
¥1,654 million(U.S.$16,838 thousand)
¥924 million(U.S.$9,406 thousand)
¥302 million(U.S.$3,074 thousand)
21. BUSINESS REORgANIZATION
As approved at the annual general meeting of shareholders
of the Company on June 27, 2008 and effective October 1,
2008, the Company has changed its corporate organization
to a holding company structure (with the Company as the
holding company and newly-incorporated subsidiaries under
the Company) in the form of a corporate split and changed
its name to “NISSIN FOODS HOLDINGS CO., LTD.”
Accordingly, the businesses and functions of the
Company were transferred to the newly-incorporated
subsidiaries: the instant noodle business to NISSIN
FOODS CO., LTD., the chilled food business to NISSIN
CHILLED FOODS CO., LTD., the frozen food business to
NISSIN FROZEN FOODS CO., LTD. and administrative
functions, including general administration, accounting,
payrolls and information systems to NISSIN BUSINESS
SUPPORT CO., LTD.
This corporate split was carried out to enforce the
group strategy function, develop each of their business,
promote the synergy with MYOJO FOODS CO., LTD., and
accelerate the development of top management.
This reorganization under the common control was
legally deemed as a subsidiary-type corporate split where
the Company was a transferring company and NISSIN
FOODS CO., LTD., NISSIN CHILLED FOODS CO., LTD.,
NISSIN FROZEN FOODS CO., LTD. and NISSIN BUSINESS
SUPPORT CO., LTD. were receiving companies.
This corporate split is accounted for as a transaction
under common control prescribed in “Accounting
Standard for Business Divestiture” (ASBJ Statement No.
7, December 27, 2005) and “Guidance for Accounting
Standard for Business Combinations and Accounting
Standard for Business Divestitures” (ASBJ Guidance No.
10, December 17, 2005). No goodwill has been generated
from this corporate split.
The Company is a parent company of these receiving com-
panies and the quota of stock was determined by the
arrangements between the Company and these receiving
companies since there was no change in net asset of the
Company after this corporate split.
20. CONTINgENT LIABILITIES
As of March 31, 2009, a subsidiary of the Company is contin-
gently liable for guarantee of borrowings of its unconsolidated
subsidiaries from financial institutions and other of ¥1,075
million (U.S.$10,944 thousand) in aggregate.

55NISSIN FOODS HOLDINGS CO., LTD.
(a) Acquisition of Treasury Stock
(1) On May 20, 2009, the Board of Directors of the
Company resolved to acquire treasury stock to
ensure a capital policy responding to changes in
economic circumstance flexibly.
On the basis of above resolution, the Company
acquired 3,120,300 shares of its own common
stock for ¥8,284 million (U.S.$84,333 thousand) at
May 21, 2009.
(2) On May 27, 2009, the Board of Directors of the
Company resolved to acquire treasury stock to
ensure a capital policy responding to changes in
economic circumstance flexibly.
On the basis of above resolution, the Company
acquired 3,491,600 shares of its own common stock
for ¥10,379 million (U.S.$105,660 thousand) during
the period from May 28, 2009 to June 12, 2009.
23. SUBSEQUENT EVENTS
(b) The following distribution of retained earnings of the Company, which has not been reflected in the accompanying
consolidated financial statements for the year ended March 31, 2009, was approved at a meeting of the shareholders
of the Company held on June 26, 2009:
Millions of yenThousands of U.S. dollars
Cash dividends (¥25 = U.S.$0.25 per share) ¥ 3,057 $ 31,120
22. RELATED PARTY TRANSACTIONS
The Group had concluded lease contracts with two related
parties, whose shares are wholly owned by certain directors
of the Company and their relatives. The amount of lease
payment to these companies for the years ended March 31,
2009 and 2008 were ¥338 million (U.S.$3,441 thousand)
and ¥336 million, respectively, and the outstanding balance
of lease obligations at March 31, 2009 and 2008 were ¥12
million (U.S.$122 thousand) and ¥37 million, respectively.

56 NISSIN FOODS HOLDINGS CO., LTD.

57NISSIN FOODS HOLDINGS CO., LTD.
BUSINESS AREAS OF CONSOLIDATED SUBSIDIARIES AND AFFILIATES (As of March 31, 2009)
Company Capital Business AreaEquity
Ownership (%)
CONSOLIDATED SUBSIDIARIES
NISSIN FOOD PRODUCTS CO., LTD. ¥5,000 million Cup- and pillow-type noodle manufacturing and marketing 100.0
MYOJO FOODS CO., LTD. ¥3,143 million Cup-and pillow-type noodle manufacturing and marketing 100.0
NISSIN CHILLED FOODS CO., LTD. ¥100 million Chilled food manufacturing and marketing 100.0
NISSIN FROZEN FOODS CO., LTD. ¥100 million Frozen food manufacturing and marketing 100.0
NISSIN CISCO CO., LTD. ¥2,600 million confectionary manufacturing and marketing 80.0
NISSIN YORK CO., LTD. ¥870 million Beverage and dairy product manufacturing and marketing 100.0
AJI-NO-MINGEI FOOD SERVICE CO., LTD.*1 ¥365 million Food service 75.8
NISSIN BUSINESS SUPPORT CO., LTD. ¥50 million Intergroup business support 100.0
Sapporo Nissin Co., Ltd. ¥250 million Cup-and pillow-type noodle manufacturing and marketing 100.0 (100.0)
Nissin F.D. Foods Co., Ltd. ¥100 million Freeze-dried food manufacturing and marketing 100.0 (100.0)
Nissin Plastics Co., Ltd. ¥450 million Container manufacturing and marketing 100.0 (100.0)
Kagawa Nissin Food Products Co., Ltd. ¥100 million Ingredient manufacturing and marketing 100.0 (100.0)
Nissin Enterprise Corporation ¥300 million Shipping and warehousing 100.0 (100.0)
Ajinihon Co., Ltd. ¥95 million Soup manufacturing and marketing 46.3 (46.3)
NISHINIHON MYOJO CO., LTD. ¥90 million Cup-and pillow-type noodle manufacturing and marketing 100.0 (100.0)
UNI-STAR CO., LTD. ¥150 million Soup manufacturing and marketing 100.0 (100.0)
MYOJO SUPPLY SERVICE. CO., LTD. ¥90 million Contracted manufacturing 100.0 (100.0)
MYOJO FRESH CO., LTD. ¥400 million Chilled food manufacturing and marketing 100.0 (100.0)
Shikoku Nissin Food Products Co., Ltd. ¥98 million Frozen food manufacturing and marketing 100.0 (100.0)
Takamatsu Nissin Food Products Co., Ltd. ¥80 million Frozen food manufacturing and marketing 100.0 (100.0)
Nicky Foods Co., Ltd. ¥60 million Frozen food manufacturing and marketing 100.0 (100.0)
NISSIN ASSET MANAGEMENT CO., LTD. ¥50 million Real estate and leasing management 100.0
Uji Kaihatsu Development Co., Ltd. ¥100 million Golf course management 94.2 (1.3)
Nissin Foods (U.S.A.) Co., Inc. U.S.$83,500 thousand Cup-and pillow-type noodle manufacturing and marketing 90.0
MYOJO U.S.A., INC. U.S.$5,000 thousand Chilled food manufacturing and marketing 96.0
Nissin Foods de Mexico S.A. de C.V. MXN 149,134 thousand Cup-type noodle manufacturing and marketing 100.0
Nissin Foods Co., Ltd. HK$671,600 thousand Cup-and pillow-type noodle manufacturing and marketing 100.0
Winner Food Products Ltd. HK$29,975 thousandCup-and pillow-type noodle and frozen food manufacturing and marketing
74.0
Miracle Foods Co., Ltd. HK$21,000 thousand Container manufacturing and marketing 100.0 (100.0)
Nissin Foods (China) Holding Co., Ltd. U.S.$40,500 thousand Invests in businesses in the PRC 100.0 (100.0)
Shanghai Nissin Foods Co., Ltd. U.S.$25,000 thousand Cup-and pillow-type noodle manufacturing and marketing 100.0 (100.0)
Guangdong Shunde Nissin Foods Co., Ltd. HK$130,000 thousand Cup-and pillow-type noodle manufacturing and marketing 100.0 (100.0)
Zhuhai Golden Coast Winner Food Products Ltd.
HK$84,000 thousand Cup-and pillow-type noodle manufacturing and marketing 70.5 (70.5)
Guangyougnan Food Products (Shenzhen) Co., Ltd.
HK$11,000 thousand Frozen food manufacturing and marketing 100.0 (100.0)
NISSIN FOODS (ASIA) PTE. LTD.*2 SG$15,179 thousandCup- and pillow-type noodle manufacturing and marketing, and overall management of Asian business
100.0
Indo Nissin Foods Ltd. INR 174,375 thousand Cup-and pillow-type noodle manufacturing and marketing 74.8 (74.8)
Nissin Foods Kft. HUF 1,000,000 thousand Cup-and pillow-type noodle manufacturing and marketing 100.0
Nissin Foods GmbH EUR 25 thousand Cup-and pillow-type noodle marketing 100.0 (99.0)
AFFILIATES ACCOUNTED FOR BY ThE EQUITY METhOD
Nissin-Ajinomoto Alimentos Ltda. BRL 12,688 thousand Cup-and pillow-type noodle manufacturing and marketing 50.0
THAI PRESIDENT FOODS PUBLIC COMPANY LIMITED
THB 180,000 thousand Cup-and pillow- type noodle manufacturing and marketing 20.1
Notes: 1. Name changed from MYOJO FOODSERVICE CO., LTD. on October 1, 2008. 2. Name changed from MYOJO FOODS CO. (S) PTE. LTD. on January 29, 2009. 3. The figures in ( ) of equity ownership show percentage of indirect ownership.
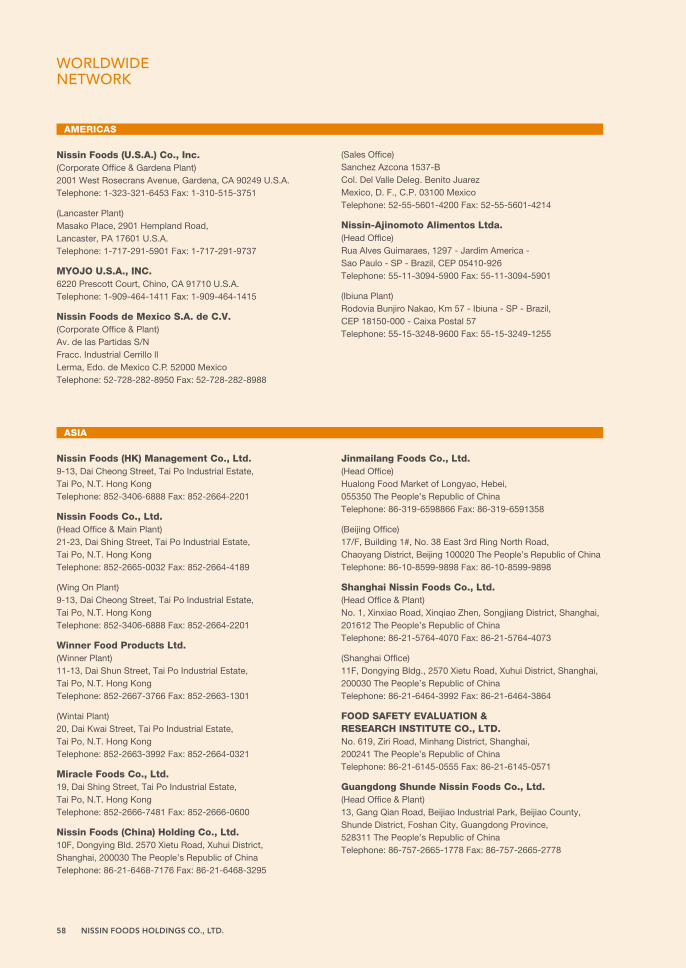
58 NISSIN FOODS HOLDINGS CO., LTD.
Nissin Foods (U.S.A.) Co., Inc. (Corporate Office & Gardena Plant) 2001 West Rosecrans Avenue, Gardena, CA 90249 U.S.A. Telephone: 1-323-321-6453 Fax: 1-310-515-3751
(Lancaster Plant) Masako Place, 2901 Hempland Road, Lancaster, PA 17601 U.S.A. Telephone: 1-717-291-5901 Fax: 1-717-291-9737
MYOJO U.S.A., INC. 6220 Prescott Court, Chino, CA 91710 U.S.A. Telephone: 1-909-464-1411 Fax: 1-909-464-1415
Nissin Foods de Mexico S.A. de C.V. (Corporate Office & Plant) Av. de las Partidas S/N Fracc. Industrial Cerrillo ll Lerma, Edo. de Mexico C.P. 52000 Mexico Telephone: 52-728-282-8950 Fax: 52-728-282-8988
(Sales Office) Sanchez Azcona 1537-B Col. Del Valle Deleg. Benito Juarez Mexico, D. F., C.P. 03100 Mexico Telephone: 52-55-5601-4200 Fax: 52-55-5601-4214
Nissin-Ajinomoto Alimentos Ltda. (Head Office) Rua Alves Guimaraes, 1297 - Jardim America - Sao Paulo - SP - Brazil, CEP 05410-926 Telephone: 55-11-3094-5900 Fax: 55-11-3094-5901
(Ibiuna Plant) Rodovia Bunjiro Nakao, Km 57 - Ibiuna - SP - Brazil, CEP 18150-000 - Caixa Postal 57 Telephone: 55-15-3248-9600 Fax: 55-15-3249-1255
Nissin Foods (hK) Management Co., Ltd. 9-13, Dai Cheong Street, Tai Po Industrial Estate, Tai Po, N.T. Hong Kong Telephone: 852-3406-6888 Fax: 852-2664-2201
Nissin Foods Co., Ltd. (Head Office & Main Plant) 21-23, Dai Shing Street, Tai Po Industrial Estate, Tai Po, N.T. Hong Kong Telephone: 852-2665-0032 Fax: 852-2664-4189
(Wing On Plant) 9-13, Dai Cheong Street, Tai Po Industrial Estate, Tai Po, N.T. Hong Kong Telephone: 852-3406-6888 Fax: 852-2664-2201
winner Food Products Ltd. (Winner Plant) 11-13, Dai Shun Street, Tai Po Industrial Estate, Tai Po, N.T. Hong Kong Telephone: 852-2667-3766 Fax: 852-2663-1301
(Wintai Plant) 20, Dai Kwai Street, Tai Po Industrial Estate, Tai Po, N.T. Hong Kong Telephone: 852-2663-3992 Fax: 852-2664-0321
Miracle Foods Co., Ltd. 19, Dai Shing Street, Tai Po Industrial Estate, Tai Po, N.T. Hong Kong Telephone: 852-2666-7481 Fax: 852-2666-0600
Nissin Foods (China) holding Co., Ltd. 10F, Dongying Bld. 2570 Xietu Road, Xuhui District, Shanghai, 200030 The People’s Republic of China Telephone: 86-21-6468-7176 Fax: 86-21-6468-3295
Jinmailang Foods Co., Ltd. (Head Office) Hualong Food Market of Longyao, Hebei, 055350 The People’s Republic of China Telephone: 86-319-6598866 Fax: 86-319-6591358
(Beijing Office) 17/F, Building 1#, No. 38 East 3rd Ring North Road, Chaoyang District, Beijing 100020 The People’s Republic of China Telephone: 86-10-8599-9898 Fax: 86-10-8599-9898
Shanghai Nissin Foods Co., Ltd. (Head Office & Plant) No. 1, Xinxiao Road, Xinqiao Zhen, Songjiang District, Shanghai, 201612 The People’s Republic of China Telephone: 86-21-5764-4070 Fax: 86-21-5764-4073
(Shanghai Office) 11F, Dongying Bldg., 2570 Xietu Road, Xuhui District, Shanghai, 200030 The People’s Republic of China Telephone: 86-21-6464-3992 Fax: 86-21-6464-3864
FOOD SAFETY EVALUATION & RESEARCh INSTITUTE CO., LTD. No. 619, Ziri Road, Minhang District, Shanghai, 200241 The People’s Republic of China Telephone: 86-21-6145-0555 Fax: 86-21-6145-0571
guangdong Shunde Nissin Foods Co., Ltd. (Head Office & Plant) 13, Gang Qian Road, Beijiao Industrial Park, Beijiao County, Shunde District, Foshan City, Guangdong Province, 528311 The People’s Republic of China Telephone: 86-757-2665-1778 Fax: 86-757-2665-2778
AMERICAS
ASIA
WORLDWIDE NETWORK

59NISSIN FOODS HOLDINGS CO., LTD.
(Guangzhou Office) 7th Floor, Golden Lake Building, No. 2, Dong Hu West Road, Guangzhou, 510100 The People’s Republic of China Telephone: 86-20-8378-1723 Fax: 86-20-8385-6181
Zhuhai golden Coast winner Food Products Ltd. Anjizhong Road 65, Sanzao jinwan, Zhuhai Guangdong China Telephone: 86-756-3900500 Fax: 86-756-3900599
guangyougnan Food Products (Shenzhen) Co., Ltd. 3rd Floor, No. 8, Road 5, Qingshuihe, Shenzhen, Guangdong Province, The People’s Republic of China Telephone: 86-755-2587-4371 Fax: 86-755-2587-8599
NISSIN FOODS (ASIA) PTE. LTD. (Head Office) 16, Chin Bee Road, Jurong Town, Singapore 619826 Telephone: 65-6-2652447 Fax: 65-6-2652753
(Sales Office) 31 Jurong Port Road #02-11M, Jurong Logistics Hub, Singapore 619115 Telephone: 65-6-2681309 Fax: 65-6-2682758
Nissin-Universal Robina Corporation (Head Office) 4th Floor, CFC Administration Building, E. Rodriguez Jr. Ave., Bagong Ilog, Pasig City, 1600 Philippines Telephone: 63-2-671-7176 Fax: 63-2-671-3978
(Cavite Plant) Block 7, Lot 8, First Cavite Industrial Estate, Bo. Langkaan, Dasmariñas Cavite, 4140 Philippines Telephone: 63-46-402-0662 Fax: 63-46-402-0824
Indo Nissin Foods Ltd. (Head Office) 3rd Floor, Centenary Building, 28, M.G. Road, Bangalore 560 001, India Telephone: 91-80-2532-7900 Fax: 91-80-2559-9087
(Delhi Plant) 91 Kms, Delhi-Jaipur Road, Village Deodhai, Tehsil Bawal, District Rewari-123401 Haryana, India Telephone: 91-1284-264032 Fax: 91-1284-264032
(Bangalore Plant) 18-A-2, Road No. 2, Jigani Industrial Area, Anekal Taluk, Bangalore District-562106 Karnataka State India Telephone: 91-80-27825280 Fax: 91-80-27825279
Accelerated Freeze Drying Co., Ltd. (Head Office) Amalgam House, Bristow Road, Willingdon Island, Cochin-682 003, Kerala, India Telephone: 91-484-2668680 Fax: 91-484-2668130
(Cochin Plant) EP/IV/513, Ezhupunna P.O. Alleppey District-688 548, Kerala, India Telephone: 91-478-2872012 Fax: 91-478-2873016
(Bangalore Plant) Plot No. 18-A1, Jigani Industrial Area, Anekal Taluk, Bangalore-562 106 Karnataka, India Telephone: 91-8078-25282 Fax: 91-8078-25283
PT. NISSINMAS Jl. Jababeka Raya Blok N/1, Cikarang Bekasi, 17530 Indonesia Telephone: 62-21-893-4130 Fax: 62-21-893-4129
Nissin Foods (Thailand) Co., Ltd. (Head Office & Plant) 631 Moo 11, Sukapiban 8, Sriracha Chonburi 20280, Thailand Telephone: 66-38-481-351 Fax: 66-38-481-353
(Bangkok Office) 802 Bangkok Tower, 2170 New Petchburi Road, Bangkok 10320, Thailand Telephone: 66-2-308-0360 Fax: 66-2-308-0363
ThAI PRESIDENT FOODS PUBLIC COMPANY LIMITED 304 TF Buildings, Srinakarin Rd., Huamark, Bangkapi, Bangkok 10240, Thailand Telephone: 66-2-374-4730 Fax: 66-2-374-7743
Nissin Foods Kft. H-6000 Kecskemet, Buzakalasz ut20., Hungary Telephone:36-76-485-702 Fax:36-76-485-704
Nissin Foods gmbh Am Hohenstein 3-5 65779 Kelkheim, Germany Telephone: 49-6195-6927 Fax: 49-6195-910019
LLC Mareven Food Central (Head Office) Business Park “Greenwood” Building 17, Putilkovo, 69th km of MKAD, Krasnogorskiy District, Moscow 143441 Russia Telephone: 7-495-730-1186 Fax: 7-495-730-1186
(Serpukhov Plant) 31, Severnoye Shosse, Ivanovskoye, Serpukhovsky Rayon, Moskovskaya Oblast, 142204, Russia Telephone: 7-496-735-5205/5548 Fax: 7-496-735-5097
EUROPE

60 NISSIN FOODS HOLDINGS CO., LTD.
NISSIN FOOdS hOLdINgS CO., Ltd.
head Office 28-1, 6-chome, Shinjuku, Shinjuku-ku
Tokyo 160-8524, Japan
Telephone: 81-3-3205-5111
Fax: 81-3-3205-5059
Osaka head Office 1-1, 4-chome, Nishinakajima, Yodogawa-ku
Osaka 532-8524, Japan
Telephone: 81-6-6305-7711
Fax: 81-6-6304-1288
Web Site: http://www.nissinfoods-holdings.co.jp
Research Institutes Central Research Institute,
Food Safety Research Institute
(As of March 31, 2009)
1948 Chukososha Co., Ltd. established.
1958Chicken Ramen, the world’s first instant noodle product, introduced; Company name changed to Nissin Food Products Co., Ltd.
1963Listed on the Second Section of the Tokyo and Osaka Stock Exchanges.
1970Nissin Foods (U.S.A.) Co., Inc., the Company’s first overseas operation, established in Gardena, California.
1971 Cup Noodle introduced; Kanto Plant begins operation.
1972Listed on the First Section of the Tokyo, Osaka and Nagoya Stock Exchanges.
1973 Shiga Plant and General Research Center begin operation.
1975Shimonoseki Plant begins operation;Nissin-Ajinomoto Alimentos Ltda. established in São Paulo, Brazil.
1977Construction of new headquarters completed;main office moved to its present location in Yodogawa-ku, Osaka.
1984 Nissin Foods Co., Ltd. established in Hong Kong.
1988Construction of Tokyo Head Office building completed; Central Research Institute begins operation.
1990 Capital participation in Yoke Co., Ltd. (now NISSIN YORK CO., LTD.).
1991Capital participation in Cisco Co., Ltd. (now NISSIN CISCO CO., LTD.). Bangalore Plant of Indo Nissin Foods Ltd. begins operation.
1992 Long-life fresh noodles developed; Nissin Rao introduced.
1993Nissin Foods GmbH established in Germany;PT. NISSINMAS begins operation.
1994 Nissin Foods (Thailand) Co., Ltd. begins operation.
1995 Nissin Spa-O introduced.
1996Guangdong Shunde Nissin Foods Co., Ltd., Nissin-Universal Robina Corporation, Shizuoka Plant, and Shanghai Nissin Foods Co., Ltd. begin operation.
1997Nissin’s “hungry?” series wins the International Advertising Festival (CANNES LIONS).
1999Share unit (minimum trading unit) reduced from 1,000 shares to 100 shares.The Momofuku Ando Instant Ramen Museum in Ikeda City, Osaka Prefecture, the world’s first instant noodle museum, opened.
2001Consolidated net sales exceeded ¥300 billion for the first time; contracted as official supplier to the 2002 FIFA World CupTM.
2002Food Safety Research Institute established;Nissin GooTa series introduced.
2003Aggregate sales of Cup Noodle brand since launch in 1971 top 20 billion servings.
2004Capital alliance with Hebei Hualong F&N Industry Group Co., Ltd., gives Nissin Food Group the No. 1 global share.
2005Nissin Foods marks a world first with its Space Ram, developed for the space shuttle Discovery.
2006 Aggregate sales of Cup Noodle brand 25 billion servings in the world.
2007MYOJO FOODS becomes a wholly owned subsidiary of Nissin Foods; Nissin Shanghai Food Safety Research Institute begins operation.
2008The Group completes transformation to a pure holding company effective October 1, 2008.
2009Capital alliance with ANGLESIDE LIMITED (currently, MAREVEN FOOD HOLDINGS LIMITED), a Russian instant noodle holding company.
hISTORY
CORPORATE DATA

distributioN oF owNersHiP AmoNg sHAreHolders
investor inForMation (nissin Foods holdings Co., ltd.)As of March 31, 2009 (U.S.$1=¥98.23)
Date of Establishment September 1948
Number of Employees 7,408 (consolidated basis)
350 (parent company)
Common Stock Authorized: 500,000,000 shares
Issued: 127,463,685 shares
Number of Shareholders: 22,185
(Excluding owners of odd-lot shares)
Paid-in Capital ¥25,123 million ($256 million)
Stock Listings Tokyo and Osaka stock exchanges
Ticker Code 2897
Independent Auditors Ernst & Young ShinNihon LLC
Transfer Agent Mizuho Trust & Banking Co., Ltd.
2-1, Yaesu 1-chome, Chuo-ku, Tokyo, Japan
PriNCiPAl sHAreHolders
NameNumber of
Shares Held(Thousands)
Percentage of Total SharesOutstanding
Morgan Stanley & Company Inc. 12,476 9.79%Ando Foundation 7,904 6.20Mitsubishi Corp. 7,800 6.12ITOCHU Corporation 7,800 6.12Japan Trustee Services Bank, Ltd. (Trust Account 4G) 4,471 3.51
Ando International Y.K. 4,100 3.22Mizuho Corporate Bank, Ltd. 4,000 3.14Japan Trustee Services Bank, Ltd. (Trust Account) 3,808 2.99The Bank of Tokyo-Mitsubishi UFJ, Ltd. 3,650 2.86The Master Trust Bank of Japan, Ltd. (Trust Account) 2,849 2.24Total 58,861 46.18
Note: In addition to the above, the Company holds 5,206,100 shares of treasury stock.
L Financial Institutions 28.17%
L Other Corporations 38.65%
L Foreign Corporations 20.23%
L Individuals and Other 12.75%
L Securities Companies 0.20%
2005 2006 2007 2008 2009
EPS (Earnings Per Share) (Yen) ¥ 134.46 ¥ 125.09 ¥ 156.12 ¥ 111.17 ¥ 129.98BPS (Book-value Per Share) (Yen) ¥ 2,091.16 ¥ 2,167.81 ¥ 2,304.40 ¥ 2,310.36 ¥ 2,287.21 PER (Price Earnings Ratio) (Times) 20.9 29.1 27.7 30.2 22.3PBR (Price Book-value Ratio) (Times) 1.3 1.3 1.9 1.5 1.3 Dividend (Yen) ¥ 30.00 ¥ 30.00 ¥ 50.00 ¥ 50.00 ¥ 50.00Payout Ratio (%) 22.31 23.98 32.03 44.98 38.47
Notes: 1. From the fiscal year ended March 31, 2003, number of issued shares excludes the numbers of treasury stocks at term-end. 2. PER and PBR are calculated based on the stock price at year-end.
Per sHAre dAtA (NissiN Foods HoldiNgs Co., ltd. ANd CoNsolidAted subsidiAries)
For further information, please contact:
Corporate Communications Division (Head Office)
Tel: 81-3-3205-5252 Fax: 81-3-3205-5259
Regularly updated IR information in English is also
available on NISSIN FOODS HOLDINGS web site at
http://www.nissinfoods-holdings.co.jp/english/
0
5,000
10,000
20,000
15,000
0
1,000
3,000
5,000 (Thousands of share)(Yen)
2,000
4,000
42008
5 6 7 8 9 10 11 12 12009
2 3 4 5 6
Share Price (Left)
Trading Volume (Right)
FurtHer iNFormAtioN sHAre PriCe rANge ANd trAdiNg Volume oN tse
Years ended March 31,
61nISSIn FooDS HolDInGS Co., ltD.

28-1, 6-chome, Shinjuku, Shinjuku-ku, Tokyo 160-8524, Japan
Telephone : 81-3-3205-5111Fax : 81-3-3205-5059
http://www.nissinfoods-holdings.co.jp
Printed in Japan