year ended period movement for personal use only time: 9 · our safety performance is at an...
TRANSCRIPT

TASSAL GROUP LIMITED ABN 15 106 067 270
APPENDIX 4E PRELIMINARY FINAL REPORT
for the Year ended 30 June 2014 (previous corresponding period: Year ended 30 June 2013
RESULTS FOR ANNOUNCEMENT TO MARKET
Year ended 30 June
2014
Year ended 30 June
2013
Period Movement
up / (down)
Period Movement
up / (down)
$’000 $’000 $’000 %
Revenue (from all sources) 266,331 272,805 (6,474) (2.37) Profit after income tax expense 41,061 33,457 7,604 22.73 Net profit after income tax
expense attributable to members 41,061 33,457 7,604 22.73
Dividends
Amount per
security
Franked amount per
security
Final dividend: - Current reporting period* 6.00¢ 3.00¢ - Previous corresponding period 5.00¢ 0.00¢
Interim dividend: - Current reporting period 5.50¢ 2.75¢ - Previous corresponding period 4.50¢ 0.00¢
Record date for determining entitlements to the Final Dividend 12 September 2014
Date of payment of Final Dividend 29 September 2014
* The financial effect of the Final Dividend in respect of the current reporting period will be recognised in the next reporting period because it has been declared subsequent to 30 June 2014.
NTA Backing
Current Period
Previous Corresponding
Period
Net tangible asset backing per ordinary security $2.07 $1.89
This report is based on accounts which have been audited. This report, and the accounts upon which it is based, use the same accounting policies.
Annual General Meeting
Place: Buckingham Room, Stamford Plaza, 111 Little Collins Street, Melbourne, Victoria Date: Wednesday 29 October 2014
Time: 9.30am F
or p
erso
nal u
se o
nly

TASSAL GROUP LIMITED
ACN 106 067 270
Annual Financial Report
for the year ended
30 June 2014
For
per
sona
l use
onl
y
CONTENTS Tassal Group Limited and Controlled Entities
2
COMPANY DIRECTORY 3
CHAIRMAN’S AND CHIEF EXECUTIVE OFFICER’S REPORT 4 - 15
CORPORATE GOVERNANCE STATEMENT 16 - 24
DIRECTORS’ REPORT 25 - 43
AUDITOR’S INDEPENDENCE DECLARATION 44
TABLE OF CONTENTS 45
INCOME STATEMENT 46
STATEMENT OF COMPREHENSIVE INCOME 47
STATEMENT OF FINANCIAL POSITION 48
STATEMENT OF CHANGES IN EQUITY 49
STATEMENT OF CASH FLOWS 50
NOTES TO THE FINANCIAL STATEMENTS 51 - 92
DIRECTORS’ DECLARATION 93
INDEPENDENT AUDITOR’S REPORT 94
ADDITIONAL SECURITIES EXCHANGE INFORMATION 95
For
per
sona
l use
onl
y

COMPANY DIRECTORY Tassal Group Limited and Controlled Entities
3
DIRECTORS
Allan McCallum, Dip.Ag Science, FAICD (Chairman)
Trevor Gerber, B.Acc CA (SA)
John Watson, AM, MAICD
Christopher Leon, BScEng, MEngSci, FAICD
Mark Ryan, B.Com, CA, MAICD, FAIM (Managing Director)
Michael Carroll, BAgSc, MBA, FAICD
CHIEF EXECUTIVE OFFICER
Mark Ryan, B.Com, CA, MAICD, FAIM
COMPANY SECRETARY
Monika Maedler, BEc, LLB, FCIS
REGISTERED OFFICE*
Level 9 1 Franklin Wharf Hobart Tasmania 7000 Telephone (03) 6244 9099 Facsimile (03) 6244 9002 E-mail [email protected] Website www.tassal.com.au ABN 15 106 067 270 (*Also principal administration office)
AUDITORS
Deloitte Touche Tohmatsu Level 8 22 Elizabeth Street Hobart Tasmania 7000
BANKERS
Westpac Banking Corporation Level 10 360 Collins Street Melbourne Victoria 3000 BankWest Level 6 600 Bourke Street Melbourne Victoria 3000
STOCK EXCHANGE LISTING
Tassal Group Limited is listed on the Australian Securities Exchange. The Home Exchange is Melbourne, Victoria. ASX Code: TGR
SHARE REGISTRY
Register of Securities is held at the following address: Computershare Investor Services Pty Limited Yarra Falls 452 Johnston Street Abbotsford Victoria 3067 Enquiries (within Australia) 1300 850 505 Enquiries (outside Australia) 61 3 9415 4000 Investor Enquiries Facsimile 61 3 9473 2555 Website www.computershare.com
EXECUTIVE DIRECTORY
Mark Ryan Managing Director and Chief Executive Officer
Peter Bennett Head of Processing Andrew Creswell Chief Financial Officer Ben Daley Head of Logistics, Planning and
IT Caroline Hounsell Senior Manager Marketing David Kiemele Head of Farming Kaylene Little Head of People, Culture and QA Monika Maedler General Counsel and Company
Secretary Ian Miles Head of Safety Justin O’Connor Head of Engineering and Risk Linda Sams Head of Sustainability Dale Williams Head of Sales and Marketing
For
per
sona
l use
onl
y
CHAIRMAN’S AND CHIEF EXECUTIVE OFFICER’S REPORT Tassal Group Limited and Controlled Entities
4
Results and Performance Overview
It is with much sadness that we reflect on the enormity of the fatality of Ian Thompson which occurred in December 2013.. The unfortunate loss of Ian needs to be acknowledged for the magnitude of the impact to his family and workmates and stands as a poignant reminder to everyone of the importance of a sustained and relentless focus on “Zero Harm - Everyone, Everywhere”. This challenging event has resulted in a strengthening of resilience towards Tassal’s safety culture - at all levels and with everyone within the organisation. Our focus and heart remains on supporting Ian’s family and workmates. The overarching strategic focus for Tassal is to deliver sustainable long term returns to shareholders as the leader in salmon in Australia, selling a highly recognised ethical valued brand and product to Australian consumers and retailers – while operating in a zero harm environment. To achieve this, the company is targeting a statutory Return on Assets (earnings before interest and tax to total assets) of 15%.
In providing this overview of Tassal’s financial and operational results for the 12 months ended 30 June 2014 (FY2014), the Directors believe that the Company is continuing to perform in line with its Strategic Plan. Tassal is focussed on both progressing towards more acceptable return levels from its sales initiatives and assets, equity and capital employed – together with ensuring that it has in place a capital investment programme that allows it to over time maximise domestic market per capita consumption. Tassal has made significant progress towards achieving its Strategic Plan goal of generating more acceptable return levels: • invested substantial capital ($166.560 million) over the last 5 years to make Tassal’s business more sustainable,
scalable and move closer to global best practice from an operational, financial and strategic perspective • focused on increasing profitability growth and $/kg returns through sales initiatives and operating efficiencies • sustainably generating more $/kg from sales – underpinning improved returns • receiving customer support through the tough supply period due to a hot summer in 2012/13, reflecting the
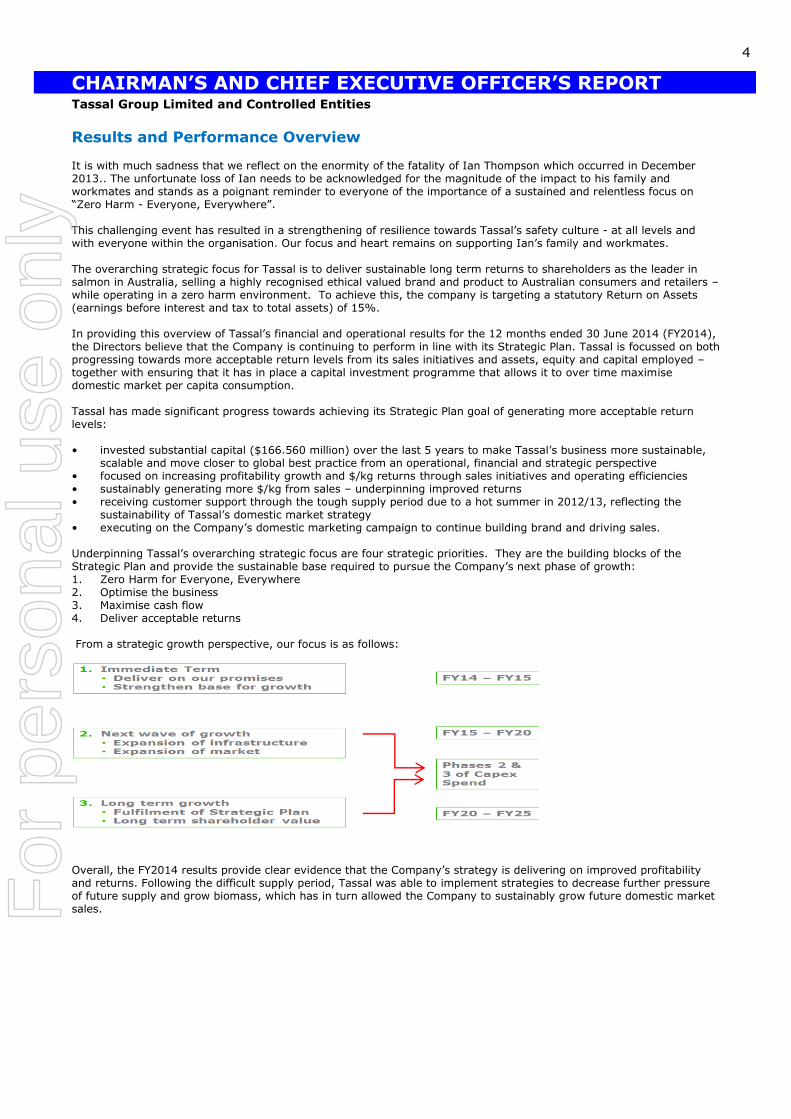
sustainability of Tassal’s domestic market strategy • executing on the Company’s domestic marketing campaign to continue building brand and driving sales. Underpinning Tassal’s overarching strategic focus are four strategic priorities. They are the building blocks of the Strategic Plan and provide the sustainable base required to pursue the Company’s next phase of growth: 1. Zero Harm for Everyone, Everywhere 2. Optimise the business 3. Maximise cash flow 4. Deliver acceptable returns From a strategic growth perspective, our focus is as follows:
Overall, the FY2014 results provide clear evidence that the Company’s strategy is delivering on improved profitability and returns. Following the difficult supply period, Tassal was able to implement strategies to decrease further pressure of future supply and grow biomass, which has in turn allowed the Company to sustainably grow future domestic market sales. F
or p
erso
nal u
se o
nly
CHAIRMAN’S AND CHIEF EXECUTIVE OFFICER’S REPORT Tassal Group Limited and Controlled Entities
5
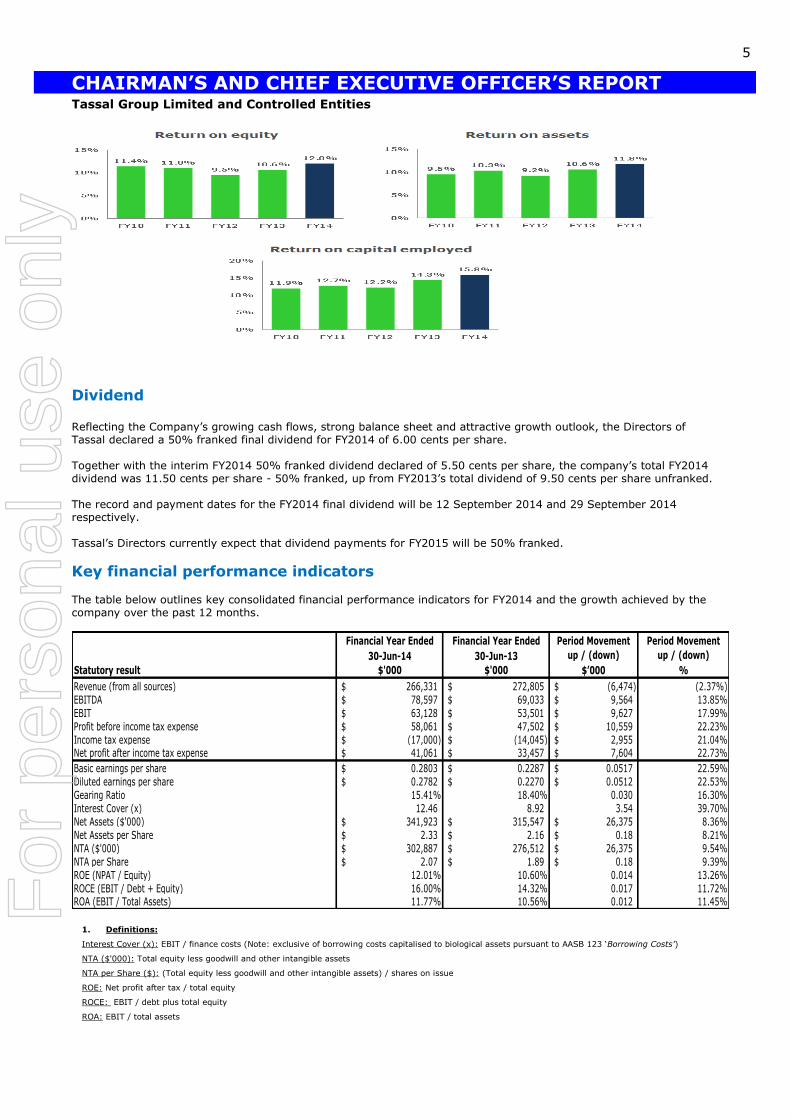
Dividend
Reflecting the Company’s growing cash flows, strong balance sheet and attractive growth outlook, the Directors of Tassal declared a 50% franked final dividend for FY2014 of 6.00 cents per share. Together with the interim FY2014 50% franked dividend declared of 5.50 cents per share, the company’s total FY2014 dividend was 11.50 cents per share - 50% franked, up from FY2013’s total dividend of 9.50 cents per share unfranked. The record and payment dates for the FY2014 final dividend will be 12 September 2014 and 29 September 2014 respectively. Tassal’s Directors currently expect that dividend payments for FY2015 will be 50% franked.
Key financial performance indicators The table below outlines key consolidated financial performance indicators for FY2014 and the growth achieved by the company over the past 12 months.
Financial Year Ended Financial Year Ended Period Movement Period Movement
30-Jun-14 30-Jun-13 up / (down) up / (down)
Statutory result $'000 $'000 $’000 %
Revenue (from all sources) 266,331$ 272,805$ (6,474)$ (2.37%)EBITDA 78,597$ 69,033$ 9,564$ 13.85%
EBIT 63,128$ 53,501$ 9,627$ 17.99%Profit before income tax expense 58,061$ 47,502$ 10,559$ 22.23%Income tax expense (17,000)$ (14,045)$ 2,955$ 21.04%Net profit after income tax expense 41,061$ 33,457$ 7,604$ 22.73%
Basic earnings per share 0.2803$ 0.2287$ 0.0517$ 22.59%
Diluted earnings per share 0.2782$ 0.2270$ 0.0512$ 22.53%Gearing Ratio 15.41% 18.40% 0.030 16.30%Interest Cover (x) 12.46 8.92 3.54 39.70%Net Assets ($'000) 341,923$ 315,547$ 26,375$ 8.36%
Net Assets per Share 2.33$ 2.16$ 0.18$ 8.21%NTA ($'000) 302,887$ 276,512$ 26,375$ 9.54%NTA per Share 2.07$ 1.89$ 0.18$ 9.39%ROE (NPAT / Equity) 12.01% 10.60% 0.014 13.26%
ROCE (EBIT / Debt + Equity) 16.00% 14.32% 0.017 11.72%ROA (EBIT / Total Assets) 11.77% 10.56% 0.012 11.45%
1. Definitions:
Interest Cover (x): EBIT / finance costs (Note: exclusive of borrowing costs capitalised to biological assets pursuant to AASB 123 ‘Borrowing Costs’)
NTA ($'000): Total equity less goodwill and other intangible assets
NTA per Share ($): (Total equity less goodwill and other intangible assets) / shares on issue
ROE: Net profit after tax / total equity
ROCE: EBIT / debt plus total equity
ROA: EBIT / total assets
For
per
sona
l use
onl
y
CHAIRMAN’S AND CHIEF EXECUTIVE OFFICER’S REPORT Tassal Group Limited and Controlled Entities
6
The table below reconciles the reported and operational results for FY2014 and FY2013.
Full Year ended 30 June 2014
Statutory
Profit $'000
Non
Recurring
Items $'000
Underlying
Profit $'000
AASB 141
Impact $'000
Operational
Result $'000
Revenue (from all sources) 266,331$ -$ 266,331$ -$ 266,331$
EBITDA 78,597$ -$ 78,597$ (15,052)$ 63,545$
EBIT 63,128$ -$ 63,128$ (15,052)$ 48,076$
Profit before income tax expense 58,061$ -$ 58,061$ (15,052)$ 43,009$
Income tax expense (17,000)$ -$ (17,000)$ 4,516$ (12,484)$
Net profit after income tax expense 41,061$ -$ 41,061$ (10,536)$ 30,525$
Full Year ended 30 June 2013
Statutory
Profit $'000
Non
Recurring
Items $'000
Underlying
Profit $'000
AASB 141
Impact $'000
Operational
Result $'000
Revenue (from all sources) 272,805$ -$ 272,805$ -$ 272,805$
EBITDA 69,033$ -$ 69,033$ (9,787)$ 59,246$
EBIT 53,501$ -$ 53,501$ (9,787)$ 43,714$
Profit before income tax expense 47,502$ -$ 47,502$ (9,787)$ 37,715$
Income tax expense (14,045)$ -$ (14,045)$ 2,936$ (11,109)$
Net profit after income tax expense 33,457$ -$ 33,457$ (6,851)$ 26,606$
Overview
In providing an overview of the financial and operational results, the Directors believe that over FY2014 Tassal performed in line with its Strategic Plan, with the following overarching comments highlighting this position. Operating and Financial Results Tassal’s operational and financial performance has been assessed against the company’s four strategic priorities.
1. Zero Harm
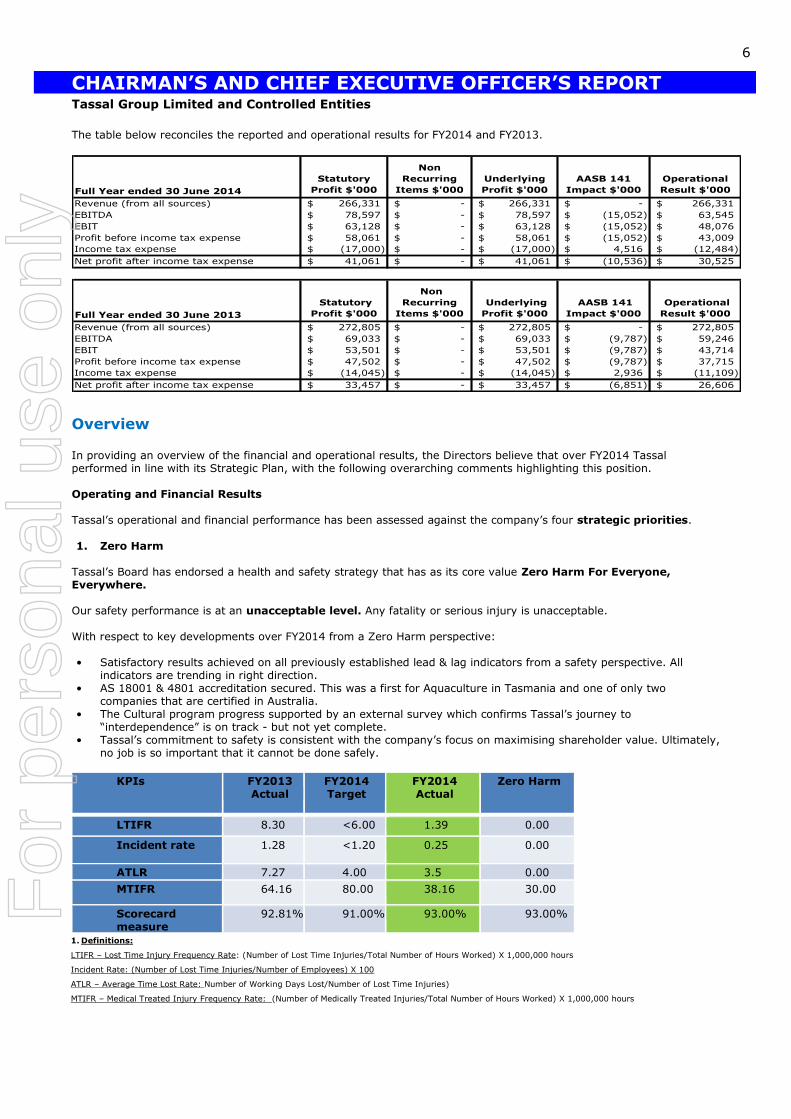
Tassal’s Board has endorsed a health and safety strategy that has as its core value Zero Harm For Everyone, Everywhere. Our safety performance is at an unacceptable level. Any fatality or serious injury is unacceptable. With respect to key developments over FY2014 from a Zero Harm perspective: • Satisfactory results achieved on all previously established lead & lag indicators from a safety perspective. All
indicators are trending in right direction. • AS 18001 & 4801 accreditation secured. This was a first for Aquaculture in Tasmania and one of only two
companies that are certified in Australia. • The Cultural program progress supported by an external survey which confirms Tassal’s journey to
“interdependence” is on track - but not yet complete. • Tassal’s commitment to safety is consistent with the company’s focus on maximising shareholder value. Ultimately,
no job is so important that it cannot be done safely.
KPIs FY2013 Actual
FY2014 Target
FY2014 Actual
Zero Harm
LTIFR 8.30 <6.00 1.39 0.00
Incident rate 1.28 <1.20 0.25 0.00
ATLR 7.27 4.00 3.5 0.00
MTIFR 64.16 80.00 38.16 30.00
Scorecard measure
92.81% 91.00% 93.00% 93.00%
1. Definitions:
LTIFR – Lost Time Injury Frequency Rate: (Number of Lost Time Injuries/Total Number of Hours Worked) X 1,000,000 hours
Incident Rate: (Number of Lost Time Injuries/Number of Employees) X 100
ATLR – Average Time Lost Rate: Number of Working Days Lost/Number of Lost Time Injuries)
MTIFR – Medical Treated Injury Frequency Rate: (Number of Medically Treated Injuries/Total Number of Hours Worked) X 1,000,000 hours
For
per
sona
l use
onl
y
CHAIRMAN’S AND CHIEF EXECUTIVE OFFICER’S REPORT Tassal Group Limited and Controlled Entities
7
2. Optimise the business From an FY2014 operating results perspective, Tassal’s performance reflected the Company’s continued focus on delivering its overall Strategic Plan priorities and targets. The Company is sustainably generating more $/kg from its sales initiatives with returns also improving. This is due to the Company’s historic reliance on lower margin export and contract growing sales being removed and replaced by domestic sales. The sustainability of the Company’s domestic market strategy was evident with customer support experienced through a tough supply period where higher costs of production and lower supply were experienced due to the negative effects of the hot Summer 2012/13 conditions. Tassal’s marketing campaign continues to build brand and drive sales in the core domestic wholesale and retail markets. It is important that we continue to drive domestic per capita consumption to maximise the opportunities in the domestic market.
Overall, with the tough supply position, FY2014 operating revenue was largely flat at $260.777 million and volume was down 12.2% to 19,268 hog equivalent tonnes. Core market domestic revenue (i.e. retail and wholesale sales markets) was slightly down 2.0% to $260.428 million. With respect to the core domestic sales market, retail market sales was the largest driver of revenue, with sales volume up 3.9% and revenue up 11.3%; whereas wholesale market sales were limited by the fish supply available with volume down 40.5% and revenue down 30.0%. The key FY2014 operating results highlights were: • EBITDA up 7.3% to $63.545 million (FY2013: $59.246 million); • EBIT up 10.0% to $48.076 million (FY2013: $43.714 million); and • NPAT up 14.7% to $30.525 million (FY2013: $26.606 million).
Overall, supply has been constrained for FY2014 due to the effects of the hot Summer 2012/13 period. In response to this, the Company repositioned its fish input and feed diet strategies to allow supply growth to be underpinned in FY2015 onwards. This will allow Tassal to focus on growing domestic per capita consumption through its marketing campaign and ultimately return to a more balanced supply mix across both domestic wholesale and retail sales channels.
3. Maximise cash flow
Tassal continues to generate strong cash flows, with the focus on maximising operating cash flow from the business, together with maximising the use of assets and ensuring a responsible capital spend. Tassal is an agricultural stock and accordingly, the Directors are focussed on ensuring sufficient headroom in facilities to allow Tassal to absorb / mitigate the agricultural risk and consider growth opportunities. The key financial highlights for FY2014 were:
Gearing ratio, as represented by net debt to equity, decreased to 15.4% (30 June 2013: 18.4%); and Funding ratio, as represented by net debt + receivable purchase facility to equity, decreased to 29.1% (30
June 2013: 33.2%).
The Company’s cash flow also improved further over FY2014:
Operating cash flow was up 1.8% to $50.626 million Investing cash flow increased by 49.6% – up to $29.842 million Financing cash flow decreased by 8.1% - down to $28.126 million
The strong cash flows, balance sheet and outlook supported the Directors decision to increase the final FY2014 dividend by 20.0% to 6.00 cps 50% franked (FY2013: final dividend 5.00cps unfranked).
4. Deliver acceptable returns
The overarching strategic focus for Tassal is to deliver sustainable long term shareholder returns. This focus ensures the efficient use of Tassal’s underlying asset basis for earnings growth, and the primary target is a statutory Return on Assets of 15%.
For
per
sona
l use
onl
y

CHAIRMAN’S AND CHIEF EXECUTIVE OFFICER’S REPORT Tassal Group Limited and Controlled Entities
8
The Board believes that the Company has been successful in mitigating (where possible) the risk of Tassal at both the sales/marketing and fish growing ends of its business, albeit Tassal is still an agricultural stock and further risk mitigation in the hatching and growing ends of the business is warranted. Through a Long Term Incentive (LTI) plan, the Tassal Executive Team is incentivised on delivering the following targets by FY2015:
• Statutory Return on Assets (EBIT to total assets) of 15% to 17%; and • Compounding earnings per share average annual growth rate of 10% to 20% over the three year period.
Tassal has made significant progress towards achieving more acceptable return levels:
• The key FY2014 statutory results highlights were:
o EBITDA up 13.8% to $78.597 million (FY2013: $69.033 million);
o EBIT up 18.0% to $63.128 million (FY2013: $53.501 million); and o NPAT up 22.73% to $41.061 million (FY2013: $33.457 million).
• reinvested substantial capital to make Tassal’s business more sustainable, scalable and move closer to global
best practice from an operational, financial and strategic perspective
• repositioned the business away from lower margin export (volatile) and contract growing business towards domestic market sales
• increased net assets by $26.376 million to $341.923 million over FY2014, which was an 8.4% increase from the position at 30 June 2013.
The Directors believe that it is important to acknowledge the following fundamentals as they apply to Tassal: Tassal’s strategy is to maximise shareholder value by growing Australian per capita salmon consumption to
ensure the optimal balance between sales and marketing and production and processing. This balancing of Tassal’s fish biomass is considered critical to ensure that short and long term strategic, operational and financial growth is maximised to enable sustainable earnings growth;
While Tassal has had an evolving sales strategy, the core of this strategy has not changed. Management’s core
focus is to continue to grow domestic per capita salmon consumption; Like other aquaculture and agriculture businesses, salmon farming is a capital intensive industry. Salmon
farming is a rolling process and in a steady state of production there will be at least three concurrent Year Class generations at different points in their lifecycle, together with a minimum level of capital expenditure required. With Tassal in a growth mode executing its Strategic Plan, funding has been required not only for the growth of the current production of fish and replacement capital expenditure, but also to fund expansionary fish production and capital expenditure on infrastructure assets;
Given the production lifecycle of fish, there is a fundamental gap in the capital expenditure, working capital and
profit cycles. Accordingly, it is important to apply Accounting Standard AASB 141 ‘Agriculture’ in understanding Tassal’s financial results and to ensure consistency in financial comparison and measurement with global aquaculture companies; and
Tassal has robust risk mitigation strategies in place to manage risks in an operational and financial context,
however it is still faced with agricultural risk. Risk mitigation, particularly around operational risk in the marine environment is a continuous focus at Tassal, with mitigation planning focussed on both the consequence and likelihood of risks. The key risks are as follows: o Summer remains a challenging period in terms of fish growth and survival, particularly with Tassal’s South
East Tasmanian sea sites. To further risk mitigate summer water temperatures, the focus has been to implement a harvest strategy in South East Tasmania that allows us to harvest fish at a quicker rate and therefore maximise survival of fish and accordingly, maximise fish biomass;
o Amoebic Gill Disease (AGD) remains a significant issue. The introduction of the harvest strategy, together with additional fish now grown in Macquarie Harbour (where there is no AGD) and with 100% of the fish now from the Selective Breeding Program (SBP) – all these measures will greatly assist in mitigating this risk. Specifically the SBP is designed to breed a more robust Salmon and remove the requirement of one bath per fish growing cycle; and
o Seals remain a significant challenge, and are an extremely important environmental and social issue for
Tassal and our stakeholders. Seal interactions are increasing year on year. Australian and New Zealand fur seals are protected wildlife and are the natural and rightful inhabitants of the marine environment. Seals are attracted to salmon farms because of food availability and commonly directly interact with our farms by chewing through nets, jumping over handrails and entering the sea pens. Managing seal
For
per
sona
l use
onl
y
CHAIRMAN’S AND CHIEF EXECUTIVE OFFICER’S REPORT Tassal Group Limited and Controlled Entities
9
interactions is a complex, costly and ever changing challenge with no easy answer. We continue to monitor seals and seal interactions extremely closely as effective management of this issue is a matter of critical importance to Tassal, as seal interactions have the potential to impact on employee safety, environmental management practices and fish welfare.
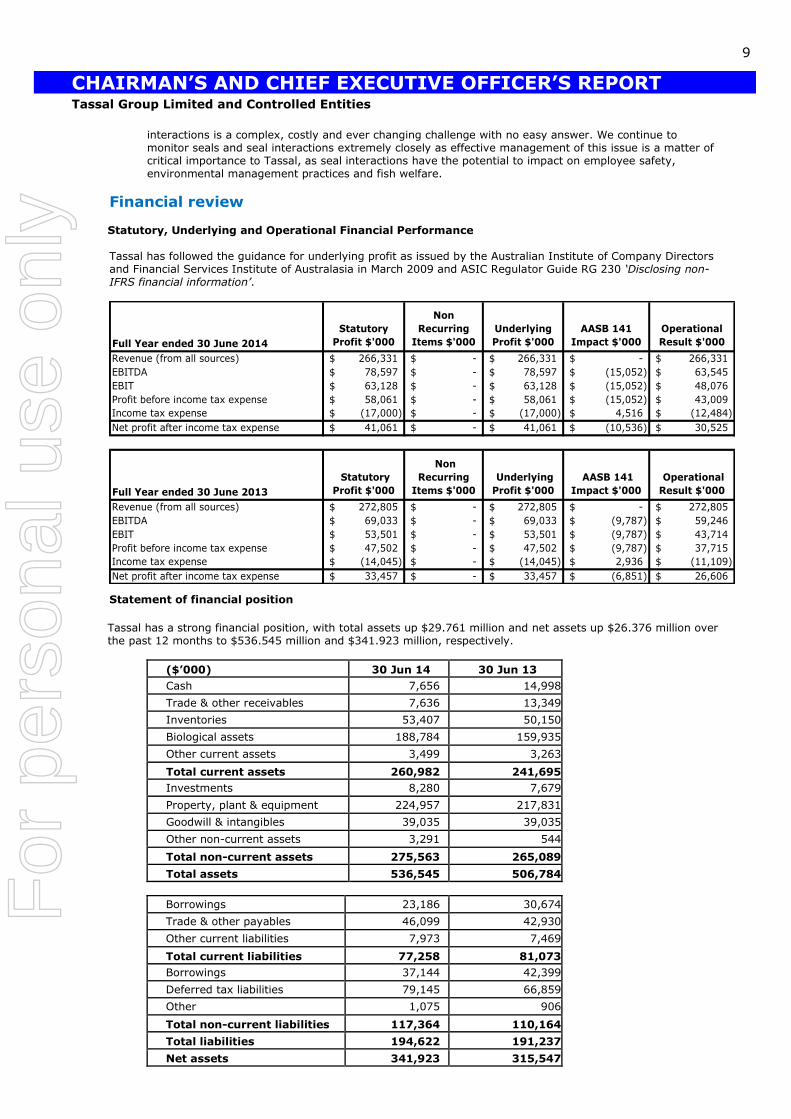
Financial review Statutory, Underlying and Operational Financial Performance Tassal has followed the guidance for underlying profit as issued by the Australian Institute of Company Directors and Financial Services Institute of Australasia in March 2009 and ASIC Regulator Guide RG 230 ‘Disclosing non-IFRS financial information’.
Full Year ended 30 June 2014
Statutory
Profit $'000
Non
Recurring
Items $'000
Underlying
Profit $'000
AASB 141
Impact $'000
Operational
Result $'000
Revenue (from all sources) 266,331$ -$ 266,331$ -$ 266,331$
EBITDA 78,597$ -$ 78,597$ (15,052)$ 63,545$
EBIT 63,128$ -$ 63,128$ (15,052)$ 48,076$
Profit before income tax expense 58,061$ -$ 58,061$ (15,052)$ 43,009$
Income tax expense (17,000)$ -$ (17,000)$ 4,516$ (12,484)$
Net profit after income tax expense 41,061$ -$ 41,061$ (10,536)$ 30,525$
Full Year ended 30 June 2013
Statutory
Profit $'000
Non
Recurring
Items $'000
Underlying
Profit $'000
AASB 141
Impact $'000
Operational
Result $'000
Revenue (from all sources) 272,805$ -$ 272,805$ -$ 272,805$
EBITDA 69,033$ -$ 69,033$ (9,787)$ 59,246$
EBIT 53,501$ -$ 53,501$ (9,787)$ 43,714$
Profit before income tax expense 47,502$ -$ 47,502$ (9,787)$ 37,715$
Income tax expense (14,045)$ -$ (14,045)$ 2,936$ (11,109)$
Net profit after income tax expense 33,457$ -$ 33,457$ (6,851)$ 26,606$
Statement of financial position
Tassal has a strong financial position, with total assets up $29.761 million and net assets up $26.376 million over the past 12 months to $536.545 million and $341.923 million, respectively.
($’000) 30 Jun 14 30 Jun 13
Cash 7,656 14,998
Trade & other receivables 7,636 13,349
Inventories 53,407 50,150
Biological assets 188,784 159,935
Other current assets 3,499 3,263
Total current assets 260,982 241,695
Investments 8,280 7,679
Property, plant & equipment 224,957 217,831
Goodwill & intangibles 39,035 39,035
Other non-current assets 3,291 544
Total non-current assets 275,563 265,089
Total assets 536,545 506,784
Borrowings 23,186 30,674
Trade & other payables 46,099 42,930
Other current liabilities 7,973 7,469
Total current liabilities 77,258 81,073
Borrowings 37,144 42,399
Deferred tax liabilities 79,145 66,859
Other 1,075 906
Total non-current liabilities 117,364 110,164
Total liabilities 194,622 191,237
Net assets 341,923 315,547
For
per
sona
l use
onl
y

CHAIRMAN’S AND CHIEF EXECUTIVE OFFICER’S REPORT Tassal Group Limited and Controlled Entities
10
Marginal increase in inventories at $3.257 million to $53.407 million (30 June 2013: $50.150 million), to
ensure that stock holding levels are reflective of the sales growth anticipated for FY2015. Total stock, which includes inventories and biological assets (i.e. live fish) increased by $32.106 million to
$242.191 million for FY2014 (30 June 2013: $210.085 million).
Property, plant and equipment increased by $7.126 million to $224.957 million. Borrowings (net of cash and cash equivalents) reduced by $5.401 million to $52.674 million (30 June
2013: $58.075 million) given the company’s strong cash generation:
o Gearing ratio at 15.4%;
o Funding ratio at 29.1%; and o During FY2014, Tassal had in place:
extended core working capital debt funding jointly from Westpac Banking Corporation
(Westpac) and Bank of Western Australia Ltd (BankWest) for $42 million – with tenor out to 31 March 2017;
operational working capital facilities with Westpac; and
asset purchase debt lines with Westpac, BankWest and National Australia Bank Limited.
o During the financial year, Westpac continued to provide an Uncommitted Trade Finance Facility (Receivables Purchase Facility) under which it may purchase receivables from Tassal at a discount. This facility has been provided by Westpac to Tassal since 30 June 2006 and it is utilised by Tassal as a primary source of working capital. The maximum available at any time under this facility was $70.000 million during FY2014. All receivables sold to Westpac are insured by Tassal with a 10% deductible per insurance claim in the event of debtor default, representing Tassal’s maximum exposure under the facility. Westpac retains 10% of any receivable purchased as a security deposit until it has received payment for the full face value of the receivable purchased. The Receivables Purchase Facility is uncommitted and revolving. Uncommitted means that Tassal is not obliged to make offers or pay commitment fees and Westpac is not obliged to accept offers of Receivables. It should be noted that since its inception with Tassal, Westpac has accepted all offers for sale of receivables that Tassal has proposed.
o The funded value of Tassal’s Receivables Purchase Facility was $46.832 million at 30 June 2014 (30 June 2013: $46.797 million). The receivables sold by Tassal into this facility are not recognised as an asset as the contractual rights to cash flows from these receivables have expired on acceptance of the sale with Westpac. Further, the amount funded under this facility is also not recognised as a liability. Tassal does recognise the security deposit as cash, and at 30 June 2014 $5.069 million was held.
Cash flow
($’000) FY2014 FY2013
Operating cash flow 50,626 49,718
Investing cash flow (29,842) (19,945)
Financing cash flow (28,126) (30,605)
Net increase / (decrease) in cash and cash equivalents
(7,342) (832)
Overall, net cash provided by operating activities was strong but flat at $50.626 million (FY2013: $49.718
million) reflecting the flat revenue generation for FY2014. Operating cashflow underpinned the increase of biological assets by $28.849 million.
Net cash used in investing activities increased by 49.6% to $29.842 million (FY2013: $19.945 million)
which underpins Tassal’s growth platform for FY2015. Net cash used for financing activities was $28.126 million, with net repayment of borrowings of $12.743
million and dividends paid of $15.383 million.
For
per
sona
l use
onl
y

CHAIRMAN’S AND CHIEF EXECUTIVE OFFICER’S REPORT Tassal Group Limited and Controlled Entities
11
Outlook for the Full Year to 30 June 2015 At the core of Tassal’s growth is the aim of growing domestic per capita salmon consumption – together with optimising the supply and demand. The Company has also built a world class sustainable production platform from which to further grow its market position, revenue and earnings – both total $ and $/kg. Overall, improved statutory and operating earnings are forecast for FY2015. The company will be focused on
maintaining and growing high value domestic market segments and reducing growing costs (through increased
biomass at Macquarie Harbour) to further grow higher domestic $ sales/kg returns. For underlying financial
growth to continue from FY2015, the company will focus on future strategic expansionary programs and reducing
operating costs (i.e. cost of growing, cost of processing, cost of supply and logistics etc.)
Specifically, the outlook for Tassal for FY2015 is as follows:
• Delivering acceptable returns – with the target a statutory return on assets of 15%:
o maintain pricing (and increasing where possible)
o continue to increase domestic market per capita consumption (through investment in marketing and
promotion, new product initiatives, support of major customers)
o reduce production costs (through increased biomass at Macquarie Harbour and performance of the SBP)
• Increasing production - Tassal has repositioned Smolt Input (Project Sweet Spot) and feed diet strategies to
underpin supply growth in FY15 and onwards
• Improving operational costs – Tassal is forecast to move closer to global best practice from operational
perspective - cost of growing, cost of processing, cost of supply and logistics
• Increasing infrastructure – Tassal has commenced the next round of expansionary investment to allow supply growth to be balanced with demand. Known as Phase 3 – this expansionary capital spend to FY2020 is focused on hatcheries and lease optimisation. Investments by Tassal in lease optimisation and a new hatchery expansion are fundamental in Tassal delivering on its Board approved Strategic Plan 2025 and delivering on a target statutory return on assets of 15% as a minimum
o total FY2015 Board approved capex spend of $37 million.
o maintenance capex now around $20m
o build of new hatchery infrastructure over FY2015 and FY2016 to produce an additional 4 million to 5
million smolt
o Triabunna Fish By-Products Processing Facility – which is supported by a $3.85m Federal Government
Grant
• Tassal will continue to mitigate agricultural risk through New Harvest Strategy, Smolt Input (Project Sweet
Spot) and SBP
• Tassal will also continue to implement further sustainability and environmental initiatives
For
per
sona
l use
onl
y

CHAIRMAN’S AND CHIEF EXECUTIVE OFFICER’S REPORT Tassal Group Limited and Controlled Entities
12
Priorities for the year ahead
Tassal’s over-arching priority is to deliver on the underlying operational and financial metrics of the Company’s Strategic Plan. The Company believes that it has in place the financial and operating platform to be able to do this, together with a favourable supply / demand dynamic in the domestic market. To achieve the Strategic Plan, Tassal has in place the following strategic priorities for FY2015:
Sustainability Tassal believes that part of its role is as a custodian of the environment – particularly the marine environment.
For its third Sustainability Report – the 2013 Report - Tassal was benchmarked as the world’s top salmon farming company in corporate, social and environmental reporting. Tassal had improved one place from last year after being ranked second against the same international benchmarks by seafoodintelligence.com, an independent international seafood market intelligence news and information service. Tassal has now also achieved Aquaculture Stewardship Council (ASC) certification for two of its farm sites at 30 June 2014. Focus for FY2015 is to achieve ASC certification for the balance of its farms. The ASC certification is supported by the earlier achieved Best Aquaculture Practice (BAP) certification for its marine sties and wet processing. Tassal has maintained its industry leading position in implementing a sustainability focus throughout the company. Key to this focus is meaningful communication with all stakeholders, including customers. Tassal’s goal is to develop significant environmental and social initiatives led by stakeholder input. It is not enough for Tassal to be profitable. Investors, customers, consumers and the public expect Tassal to be socially and environmentally responsible. Tassal understands that community and environmental values are important. Tassal clearly understands that we can and do make a difference. Through the partnership with WWF Tassal is still aiming to be the leader in sustainable aquaculture production in Australia with all our products meeting best practice environmentally responsible standards. Tassal is a signatory to the WWF Global Seafood Charter, which sets out clear principles and objectives to safeguard valuable marine eco-systems, ensuring the long term viability of seafood supplies.
For
per
sona
l use
onl
y
CHAIRMAN’S AND CHIEF EXECUTIVE OFFICER’S REPORT Tassal Group Limited and Controlled Entities
13
Overall, Tassal is mitigating risk via a focus on sustainability by: implementing best practice infrastructure and fish health capacity; focusing on impact mitigation and stakeholder engagement; forming collaborative, forward focussed research partnerships; and implementing and resourcing compliance, communication, stakeholder, and seal management plans –
together with transparency in reporting. The Board of Directors are accountable for the development, establishment and review of appropriate policy in these areas. The Board requires a best practice approach in these areas and has implemented appropriate management objectives and structures, and a regular reporting process to ensure that this objective is achieved. The Board considers Tassal to be a sustainable aquaculture company from an environmental, operational and financial perspective. This belief is underpinned through the WWF partnership.
Workplace Health & Safety (WHS) Tassal is committed to providing a healthy and safe workplace. Our aspirational vision is “No Injuries”. With respect to the achievements for FY14 from a Zero Harm perspective:
• Satisfactory results achieved on all previously established lead & lag indicators from a safety perspective. All
indicators are trending in right direction • AS 18001 & 4801 accreditation secured. This was a first for Aquaculture in Tasmania and one of only two
companies that are certified in Australia.
• The Cultural program progress supported by an external survey which confirms Tassal’s journey to “interdependence” is on track - but not yet complete.
• Tassal’s commitment to safety is consistent with the company’s focus on maximising shareholder value.
Ultimately, no job is so important that it cannot be done safely. This commitment extends to the delivery of a healthy and safe product to all Tassal customers and consumers and is underpinned by the Company’s food safety and hygiene related accreditations. These include ISO 9001:2000, HACCP, Halal, Kosher and other accreditations to meet the food safety and hygiene requirements of our major retail customers.
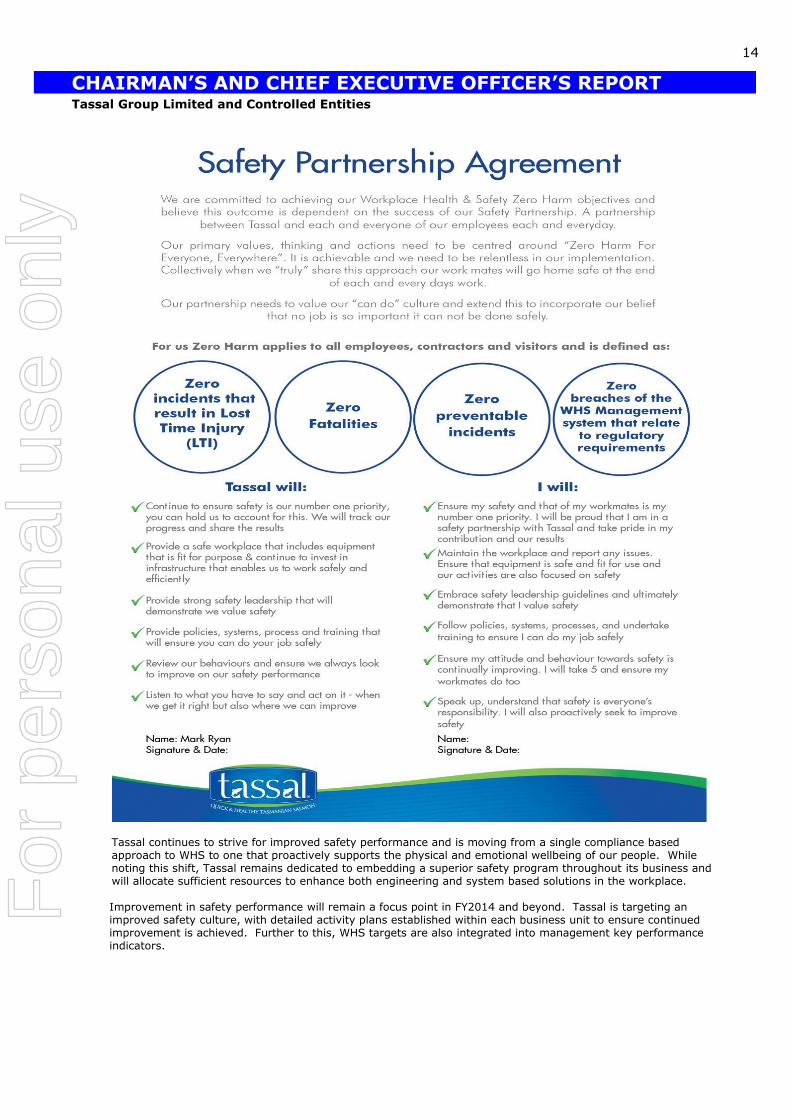
Each and every Tassal employee has a responsibility to themselves, their colleagues, their families and their community to ensure that they work safely. To this end, we have entered into a safety partnership agreement with each of our employees as set out below:
For
per
sona
l use
onl
y
CHAIRMAN’S AND CHIEF EXECUTIVE OFFICER’S REPORT Tassal Group Limited and Controlled Entities
14
Tassal continues to strive for improved safety performance and is moving from a single compliance based approach to WHS to one that proactively supports the physical and emotional wellbeing of our people. While noting this shift, Tassal remains dedicated to embedding a superior safety program throughout its business and will allocate sufficient resources to enhance both engineering and system based solutions in the workplace. Improvement in safety performance will remain a focus point in FY2014 and beyond. Tassal is targeting an improved safety culture, with detailed activity plans established within each business unit to ensure continued improvement is achieved. Further to this, WHS targets are also integrated into management key performance indicators.
For
per
sona
l use
onl
y
CHAIRMAN’S AND CHIEF EXECUTIVE OFFICER’S REPORT Tassal Group Limited and Controlled Entities
15
Support
On behalf of the Board, once again, we thank our employees, customers, suppliers and shareholders who have continually believed in and supported Tassal’s vision and strategy. We would also like to thank our departing non-executive directors, Rudi Tsai and Ng Joo Thieng for their contributions. During FY2014 we identified the need to add an additional independent non-executive director to our Board, and were delighted to welcome Michael Carroll to the Board.
A. D. McCallum Chairman
M. A. Ryan Managing Director & Chief Executive Officer Hobart, this 19th day of August 2014
For
per
sona
l use
onl
y

CORPORATE GOVERNANCE STATEMENT Tassal Group Limited and Controlled Entities
16
Tassal is committed to maintaining high standards of corporate governance appropriate to its size and operations to effectively manage
risk, improve the Company’s performance and enhance corporate responsibility. The Board of Directors of Tassal (the Board), working
with senior management, is responsible for the corporate governance of Tassal and its controlled entities. The Board carries out its
responsibilities within a framework of corporate governance policies and practice documents which outline the commitment to act
ethically, openly, fairly, and diligently when promoting the interests of shareholders, employees and customers and broader community
interests.
Unless explicitly stated otherwise, the Directors believe Tassal complies with the core principles and underlying recommendations of ASX
Corporate Governance Council’s “Corporate Governance Principles and Recommendations”.
The Corporate Governance Statement is provided in tabular format to specifically align the response of the Board clearly to each specific
recommendation. The table also lists the relevant codes, policies or charters that underpin Corporate Governance practices at Tassal.
All these documents (unless indicated) are available for public inspection on Tassal’s website (Investor Relations Section),
www.tassal.com.au
Reference material Compliance
Principle 1 Lay solid foundations for management and oversight
Establish and disclose the respective roles and responsibilities
of Board and management.
Yes
Recommendation
1.1
Establish and disclose the functions reserved to the Board and
those delegated to Senior Executives.
Yes
Tassal Board
Response
The Board has adopted a Board Charter which clearly outlines
the role and functions of the Board, has developed separate
role statements for the Chairman and Chief Executive Officer
and implemented a policy prescribing the delegated and
reserved powers of the Board and that delegated to Senior
Executives.
Board Charter
Statement of Delegated
Authority
Role of the Chairman
Role of the CEO
Recommendation
1.2
Disclose the process for performance evaluation of Senior
Executives.
Yes
Tassal Board
Response
The Chief Executive Officer’s compensation arrangements and
performance is reviewed, monitored and evaluated by the
Board and Remuneration and Nominations Committee on an
annual basis.
The compensation arrangements and performance of the direct
reports to the Chief Executive Officer (the Senior Executives)
is reviewed, monitored and evaluated by the Chief Executive
Officer.
The Chief Executive Officer provides the Remuneration and
Nominations Committee with an overview of individual Senior
Executive performance and compensation recommendations
for Committee assessment and review.
Performance evaluations have been undertaken for the Chief
Executive Officer and Senior Executives during the current financial year.
Remuneration Report –
section 20 of the
Directors’ Report
Board Charter
Remuneration Policy
Remuneration and
Nominations Committee
Charter
Recommendation
1.3
Provide the information set out in Guide to reporting on
Principle 1.
Yes
An explanation of any departure from Recommendation
1.1, 1.2 or 1.3.
Tassal Board
Response
There has been no departure from Recommendation 1.1, 1.2
or 1.3
Whether a performance evaluation for Senior Executives
has taken place in the reporting period and whether it
was in accordance with the process disclosed.
Tassal Board
Response
A performance evaluation for the Chief Executive Officer and
Senior Executives has taken place in the reporting period, in
accordance with the process disclosed.
Remuneration Policy
For
per
sona
l use
onl
y

CORPORATE GOVERNANCE STATEMENT cont. Tassal Group Limited and Controlled Entities
17
Principle 2 Structure the Board to add value
Have a Board of an effective composition, size and
commitment to adequately discharge its responsibilities and
duties.
Yes
Recommendation
2.1
A majority of the Board should be independent directors. Yes
Tassal Board
Response
The Directors considered by the Board to constitute
independent directors are identified, along with their period in
office, in the Directors’ Report.
The Company presently has five non-executive Directors, all of whom, including the Chairman, are considered by the Board to
be independent in terms of the ASX CGC’s definition of an
independent director. The Chief Executive Officer is an
Executive Director of the Company.
Board Charter
Policy – Independence of
Directors
Refer section 1 of the Directors’ Report for
details of Director’s length
of service
Refer section 16 of the
Directors’ Report for
names of Directors
considered to be
independent
Recommendation
2.2
The Chairman should be an independent Director. Yes
Tassal Board
Response
The Chairman, Mr Allan McCallum, is an independent Director. Board Charter
Role of the Chairman
Recommendation
2.3
The roles of the Chairman and Chief Executive Officer should
not be exercised by the same individual.
Yes
Tassal Board
Response
Mr Mark Ryan is the Company’s Chief Executive Officer and
Managing Director.
In line with the Board Charter, the roles of Chairman and Chief
Executive Officer are separated.
Board policy is that the Chief Executive Officer cannot become
Chairman.
Board Charter
Role of the Chairman
Role of the CEO
Recommendation
2.4
The Board should establish a nomination committee. Yes
Tassal Board
Response
The Board has established a Remuneration and Nominations
Committee. The Committee’s charter sets out its roles,
responsibilities, membership, meeting process, Board reporting
requirements and performance evaluation requirements.
The Committee is structured so that it consists of at least three
non-executive Directors, a majority of whom must be
independent.
Remuneration and
Nominations Committee
Charter
Recommendation 2.5
Disclose the process for performance evaluation of the Board, its Committees and individual Directors.
Yes
Tassal Board Response
The Board Charter requires that each year the Board will conduct an evaluation of its performance that:
compares the performance of the Board with the
requirements of its Charter;
sets forth goals and objectives of the Board for the
upcoming year; and
effects any improvement to the Board Charter deemed
necessary or desirable.
The respective Board Committee Charters also require the
Committees to evaluate their performance and composition at least annually to determine whether the relevant Committee is
functioning effectively by reference to current best practice.
This evaluation is presented to the Board for review.
Formal performance evaluations have been satisfactorily
undertaken for the Board, Audit and Risk Committee and
Remuneration and Nominations Committee during the current
financial year in accordance with disclosed Tassal policy.
Remuneration Report – section 20 of the
Directors’ Report
Board Charter
Remuneration Policy
Remuneration and
Nominations Committee
Charter
Audit and Risk Committee
Charter
Recommendation
2.6
Provide the information set out in Guide to reporting on
Principle 2:
Yes
For
per
sona
l use
onl
y

CORPORATE GOVERNANCE STATEMENT cont. Tassal Group Limited and Controlled Entities
18
Principle 2 continued Structure the Board to add value
Have a Board of an effective composition, size and
commitment to adequately discharge its responsibilities and
duties.
Yes
The skills, experience and expertise relevant to the
position of Director held by each Director in office at the
date of the annual report.
Tassal Board
Response
All Directors have a strong understanding of Tassal’s business.
The Board considers the Directors’ diverse range of skills and
experience is appropriate to discharge its responsibilities and
duties.
Refer sections 16 and 17
of the Directors’ Report
The names of the Directors considered by the Board to
constitute independent Directors and Tassal’s materiality thresholds.
Tassal Board
Response
See Tassal Board response to recommendation 2.1.
Tassal’s independence criteria guidelines for determining the
independence of Directors are detailed in the Policy on
Independence of Directors.
Refer sections 16 and 17
of the Directors’ Report
Policy – Independence of
Directors
The existence of any relationships affecting independent
status and an explanation of why the Board considers a
Director to be independent, notwithstanding the
existence of those relationships.
Tassal Board
Response
All of the current non-executive Directors are considered to be
independent and there are no relationships in existence
affecting that status.
A statement as to whether there is a procedure agreed
by the Board for Directors to take independent
professional advice at the expense of the company.
Tassal Board
Response
Directors are entitled to seek independent professional advice
at Tassal’s expense, subject to the approval of the Chairman, or in his absence, the Board.
Board Charter
Director’s Deed of Indemnity and Right of
Access to Documents –
this document is not
publicly available
A statement as to the mix of skills and diversity which
the Board is looking to achieve in its membership
Tassal Board
Response
It is noted that all placements are merit based. The mix of
skills and diversity the Board is looking to achieve is an
appropriate one having regard to the future needs of Tassal’s
business.
Board Charter
Remuneration and
Nominations Committee
Charter
Policy for the Selection
and Appointment of
Directors
Diversity Policy
The period of office held by each Director in office at the
date of this Annual Report.
Tassal Board
Response
This information is provided in the Directors’ Report. Refer section 1 of the
Directors’ Report
The names of members of the Remuneration and
Nominations Committee and their attendance at
meetings of the Committee.
Tassal Board
Response
This information is provided in the Directors’ Report. Refer sections 16 and 18
of the Director’s Report
Whether a performance evaluation for the Board and its
Committees has taken place in the reporting period and
whether it was in accordance with the process disclosed.
For
per
sona
l use
onl
y

CORPORATE GOVERNANCE STATEMENT cont. Tassal Group Limited and Controlled Entities
19
Principle 2 continued Structure the Board to add value
Have a Board of an effective composition, size and
commitment to adequately discharge its responsibilities and
duties.
Yes
Tassal Board
Response
See Tassal Board response to recommendation 2.5. Board Charter
Remuneration and
Nominations Committee
Charter
Audit and Risk Committee
Charter
Principle 3 Promote ethical and responsible decision-making
Actively promote ethical and responsible decision-making.
Yes
Recommendation 3.1
Establish and disclose a summary of a code of conduct as to:
the practices necessary to maintain confidence in
Tassal’s integrity;
the practices necessary to take into account their legal
obligations and the reasonable expectations of their
stakeholders; and
the responsibility and accountability of individuals for
reporting and investigating reports of unethical
practices.
Yes
Tassal Board
Response
The Directors have adopted a Code of Conduct to provide clear
guidelines for the ethical behavioural standards expected of
the Company’s Directors, Senior Executives and all employees.
The Code of Conduct sets ethical standards for Tassal’s
Directors and employees, all of whom are expected to pursue
the highest standards of ethical conduct in the interests of
shareholders, customers, suppliers, the wider community and
the environment.
Ethical conduct relates to standards of behaviour characterised
not only by complying with the law and the various Tassal
policies which are referred to in the Code of Conduct, but also
by acting fairly, honestly and with integrity.
The Code addresses, among other things:
ethical conduct and expected behaviours based on the
principles of fairness, honesty and integrity;
compliance with the law;
confidentiality and inside information;
disclosure of interests;
trading in Tassal securities;
integrity of records;
protection of Tassal assets;
personal transactions;
improper payments, gifts, entertainment and travel;
political contributions; and
whistleblower protection.
Code of Conduct
Recommendation
3.2
Establish a policy concerning diversity and disclose the policy
or a summary of the policy.
Yes
Tassal Board
Response
The Directors have adopted a Diversity Policy which includes
requirements for the Board to establish measurable objectives
for achieving gender diversity and for the Board to assess
annually both the objectives and progress in achieving them.
Diversity Policy
Recommendation
3.3
Disclose the measurable objectives for achieving gender
diversity and progress towards achieving them.
Yes
For
per
sona
l use
onl
y

CORPORATE GOVERNANCE STATEMENT cont. Tassal Group Limited and Controlled Entities
20
Principle 3 continued Promote ethical and responsible decision-making
Actively promote ethical and responsible decision-making.
Yes
Tassal Board
Response
In 2011 the Board adopted the Company’s Diversity Policy.
The Remuneration and Nominations Committee of the Board of
Directors has responsibility for oversight of the Policy. The
Committee has established the following measurable objectives
concerning the strategies, initiatives and programmes to
achieve gender diversity in order to create an environment
conducive to the appointment of well-qualified Board, senior
management and other employees to maximise the achievement of Tassal’s corporate goals.
Measurable objectives:
(i) Annual review of following policies and procedures has
been conducted to ensure Equal Employment
Opportunity (EEO) is part of the process and no barriers
to diversity within policies or procedure;
a. Recruitment Policy
b. Recruitment and Promotions Procedure
c. Harassment, Bullying and Discrimination Policy
(ii) The Company has a policy to ensure principles of
diversity are considered such as flexibility of position
design, and equity in consideration for selection.
(iii) Inclusion of company diversity data within annual
sustainability report.
(iv) Continue to participate in career forums, school networks
etc to reinforce positive messages to both genders
concerning careers within Tassal.
(v) Continue with the IMPACT program (the Company’s
leadership program) which focuses on leadership and change management. Women are strongly encouraged
to participate in this program.
(vi) Continued recruitment practices with aim for mix of
males and females shortlisted for Senior Executive roles
(but no change to approach on competency/skills).
The Company continues with selection criteria which are
competency based, but which also recognise diversity. Further
the Company does not intend to set a quota or a target level
for female employees as the expectation is that the long term trend for the proportion of females will be one of steady
increase.
The Committee will also monitor the representation of women
on the Board by ensuring that appropriately qualified women
are considered for any Board appointments.
Diversity outcomes recognised during the 2013/2014 were
female representation within Executive Group was
33.3%
female representation within Leadership Group was
21.7%
female participation in the impact project was 23.4%
The Committee will undertake an annual review of the
Diversity Policy and the progress towards delivering these
measurable objectives.
Diversity Policy
Sustainability Report
Recommendation
3.4
Disclose the proportion of women in the whole organisation,
women in Senior Executive positions and women on the Board.
Yes
Tassal Board
Response
The proportion of women at the relevant levels as at 30 June
2014 is:
the Board – 0%
Senior Executives – 25.7%
whole organisation – 30%
Recommendation
3.5
Provide the information set out in the Guide to reporting on
Principle 3.
Yes
Tassal Board Tassal’s Code of Conduct and Diversity Policy available
for public inspection on the Company’s website
For
per
sona
l use
onl
y

CORPORATE GOVERNANCE STATEMENT cont. Tassal Group Limited and Controlled Entities
21
Response (Investors – Corporate Governance Policies Section),
www.tassal.com.au
Principle 4 Safeguard integrity in financial reporting
Have a structure to independently verify and safeguard the
integrity of the company’s financial reporting.
Yes
Recommendation
4.1
The Board should establish an Audit Committee. Yes
Tassal Board
Response
The Board has established an Audit and Risk Committee. Audit and Risk Committee
Charter
Recommendation
4.2
Structure the Audit Committee so that it consists of:
only non-executive Directors;
a majority of independent Directors;
an independent Chairman who is not Chairman of the Board; and
at least three members.
Yes
Tassal Board
Response
Tassal’s Audit and Risk Committee is structured in compliance
with this best practice recommendation.
All Committee members are independent Directors.
Audit and Risk Committee
Charter
Refer section 16 of the
Directors’ Report for
names of Committee
members and their
independence status
Recommendation
4.3
The Audit Committee should have a formal charter. Yes
Tassal Board Response
The Audit and Risk Committee has a formal charter which sets out its roles, responsibilities, membership, meeting process,
Board reporting requirements and performance evaluation
requirements.
Audit and Risk Committee Charter
Recommendation
4.4
Provide the information set out in Guide to Reporting on
Principle 4:
Yes
Details of the names and qualifications of those
appointed to the Audit Committee.
The number of meetings of the Audit Committee and
names of the attendees.
Tassal Board
Response
This information is provided in the Directors’ Report. Refer sections 16, 17 and
18 of the Directors’
Report
Procedures for the selection and appointment of the
external auditor, and for the rotation of external audit
engagement partners.
Tassal Board
Response
The external auditor, Deloitte Touche Tohmatsu (retained
following a scheduled formal tender process conducted during
the financial year ended 30 June 2009), under the scrutiny of the Audit and Risk Committee, presently conducts the
statutory audits in return for reasonable fees.
The Committee has specific responsibility for recommending
the appointment or dismissal of external auditors and
monitoring any non-audit work carried out by the external
audit firm. The procedures for appointment of an external
auditor are outlined in the charter.
Guidelines on External Auditor Selection, Evaluation and
Rotation (this document is not publicly available); and
Guidelines on Provision of Audit and Other (Non-Audit)
Services by the External Auditor (this document is not
publicly available).
No Director has any association, past or present, with Tassal’s
external auditor.
Audit and Risk Committee
Charter
For
per
sona
l use
onl
y

CORPORATE GOVERNANCE STATEMENT cont. Tassal Group Limited and Controlled Entities
22
Principle 5 Make timely and balanced disclosure
Promote timely and balanced disclosure of all material matters
concerning the Company.
Yes
Recommendation
5.1
Establish written policies designed to ensure compliance with
ASX Listing Rule disclosure requirements and to ensure
accountability at a senior management level for that
compliance and disclose those polices or a summary of those
policies.
Yes
Tassal Board
Response
The Board has adopted a Continuous Disclosure Policy to
ensure Tassal complies with its disclosure obligations under
ASX Listing Rules and the Corporations Act and to attribute accountability at a Senior Executive level for that compliance.
Continuous Disclosure
Policy
Recommendation 5.2
Provide the information set out in Guide to Reporting on Principle 5.
Yes
Tassal Board
Response
Tassal’s Continuous Disclosure Policy is available for public
inspection on the Company’s website (Investors – Corporate
Governance Policies Section), www.tassal.com.au
Principle 6 Respect the rights of shareholders
Respect the rights of shareholders and facilitate the effective
exercise of those rights.
Yes
Recommendation
6.1
Design and disclose a communications policy to promote
effective communication with shareholders and encourage
participation at general meetings and disclose those polices or
a summary of those policies.
Yes
Tassal Board
Response
Tassal places considerable importance on effective
communication with its shareholders, market participants,
customers, employees, suppliers, financiers, creditors other
stakeholders and the wider community. Accordingly the Board has adopted a Communications Policy which requires
communication with shareholders in an open, regular and
timely manner so that the market has sufficient information to
make informed investment decisions on the operations and
results of the Company.
The Company’s website (www.tassal.com.au) is the primary
means for shareholders to access communications and it has
been designed to enable information to be accessed in a clear
and readily accessible manner.
The Board encourages full participation of shareholders at the Annual General Meeting to ensure a high level of accountability
and understanding of Tassal’s strategy and goals and has
developed guidelines for the format and content of Notices of
Meetings.
Communications Policy
Guidelines for Notices of
Meetings
Recommendation
6.2
Provide the information set out in Guide to Reporting on
Principle 6.
Yes
Tassal Board
Response
Tassal’s Communications Policy is available for public
inspection on the Company’s website (Investors – Corporate
Governance Policies Section), www.tassal.com.au
Principle 7 Recognise and manage risk
Establish a sound system of risk oversight and management
and internal control.
Yes
Recommendation
7.1
Companies should establish policies for the oversight and
management of material business risks and disclose a
summary of those policies.
Yes
Tassal Board
Response
The Company has established polices for the oversight and
management of material business risks, which are formalised in its “Procedures for the Oversight and Management of
Material Business Risks” which is available on the Company’s
website (Investors – Corporate Governance Policies Section),
www.tassal.com.au
Procedures for the
Oversight and Management of Material
Business Risks
For
per
sona
l use
onl
y

CORPORATE GOVERNANCE STATEMENT cont. Tassal Group Limited and Controlled Entities
23
Principle 7 continued Recognise and manage risk
Establish a sound system of risk oversight and management
and internal control.
Yes
Recommendation
7.2
The Board should require management to design and
implement the risk management and internal control system to
manage Tassal’s material business risks and report to it on
whether those risks are being managed effectively.
The Board should disclose that management has reported to it
as to the effectiveness of Tassal’s management of its material
business risks.
Yes
Tassal Board Response
Management has designed and implemented a comprehensive risk management and internal control system to manage
Tassal’s material business risks through the establishment and
formalisation of Tassal’s “Risk Map and Mitigation Plan”. The
Plan identifies and quantifies material business risks across
Tassal and highlights management action plans and timelines
for risk mitigation.
As part of this system, Management has reported to the Board
and to the Audit and Risk Committee during the financial year
as to the effectiveness of Tassal’s management of its material
business risks.
Procedures for the Oversight and
Management of Material
Business Risks
Audit and Risk Committee
Charter
Board Charter
Recommendation 7.3
Disclose whether the Board has received assurance from the Chief Executive Officer (or equivalent) and the Chief Financial
Officer (or equivalent) that the declaration provided in
accordance with section 295A of the Corporations Act is
founded on a sound system of risk management and internal
control and that the system is operating effectively in all
material respects in relation to financial reporting risks.
Yes
Tassal Board
Response
The Chief Executive Officer and Chief Financial Officer have
respectively provided such assurance to the Board.
Audit and Risk Committee
Charter
Refer section 11 of the
Directors’ Report
Recommendation
7.4
Provide the information indicated in Guide to Reporting on
Principle 7:
Yes
Statement whether the Board has received the report
from management under Recommendation 7.2.
Tassal Board
Response
The Board has received the report from management under
Recommendation 7.2.
Statement whether the Board has received assurance
from the Chief Executive Officer (or equivalent) and the Chief Financial Officer (or equivalent) under
Recommendation 7.3.
Tassal Board
Response
The Board has received assurance from the Chief Executive
Officer and the Chief Financial Officer under Recommendation
7.3.
Principle 8 Remunerate fairly and responsibly
Ensure that the level and composition of remuneration is
sufficient and reasonable and that its relationship to
performance is clear.
Yes
Recommendation
8.1
The Board should establish a Remuneration Committee. Yes
Tassal Board
Response
The Board has established a Remuneration and Nominations
Committee. The Committee’s charter sets out its roles,
responsibilities, membership and meeting process.
The Committee is structured so that it consists of at least three non-executive Directors, all of whom must be independent.
Remuneration Report –
section 20 of the
Directors’ Report
Remuneration and Nominations Committee
Charter
Recommendation
8.2
The Remuneration Committee should
consist of a majority of independent directors
be chaired by an independent Chair
have at least three members
Yes
For
per
sona
l use
onl
y

CORPORATE GOVERNANCE STATEMENT cont. Tassal Group Limited and Controlled Entities
24
Principle 8 continued Remunerate fairly and responsibly
Ensure that the level and composition of remuneration is
sufficient and reasonable and that its relationship to
performance is clear.
Yes
Tassal Board
Response
The Committee consists of three independent non-executive
directors.
Remuneration and
Nominations Committee
Charter
Refer sections 16 and 18
of the Directors’ Report
Recommendation
8.3
Clearly distinguish the structure of non-executive directors’
remuneration from that of executive directors and senior executives.
Yes
Tassal Board Response
Non-executive Directors receive a cash fee for service and have no entitlement to any performance-based remuneration
or participation in any share-based incentive schemes. This
policy reflects the differences in the role of the non-executive
Directors, which is to provide oversight and guide strategy,
and of management, which is to operate the business and
execute Tassal’s strategy.
The remuneration packages of the Chief Executive Officer and
Senior Executives may include a Short-term Incentive
component that is linked to the overall financial and operational performance of Tassal and based on the
achievement of specific Tassal and individual / team goals.
The Chief Executive Officer and Senior Executives may also be
invited to participate in the Company’s Long-term Incentive
Plan. The long-term benefits of the Long-term Incentive Plan
are conditional upon Tassal achieving certain performance
criteria.
Details of Tassal’s remuneration policies are set out in the
Remuneration Report.
Remuneration Report – section 20 of the
Directors’ Report
Recommendation
8.4
Provide the information set out in Guide to Reporting on
Principle 8.
Yes
The names of the members of the Remuneration
Committee and their attendance at meetings of the Committee.
Tassal Board
Response
This information is provided in the Directors’ Report. Refer sections 16 and 18
of the Directors’ Report
The existence and terms of any schemes for retirement
benefits, other than statutory superannuation, for non-
executive Directors.
Tassal Board
Response
Non-executive Directors are not entitled to retain a retirement
benefit beyond the statutory superannuation obligations.
Remuneration Report –
section 20 of the
Directors’ Report
For
per
sona
l use
onl
y

DIRECTORS’ REPORT Tassal Group Limited and Controlled Entities
25
The Directors present their report together with the Annual Financial Report of Tassal Group Limited (the Company) and the consolidated Annual Financial Report of the consolidated entity, being the Company and its controlled entities (the Group), for the year ended 30 June 2014.
1. DIRECTORS
At the date of this report, the Directors of the Company who held office at any time during or since the end of the financial year are:
Name:
Mr Allan McCallum (Director since 7 October 2003)
(Chairman since 27 June 2005)
Mr Mark Ryan – Chief Executive Officer
(Director since 21 December 2005)
Mr Trevor Gerber
(Director since 4 April 2012)
Mr Rudi Tsai (Resigned 17 February 2014)
Mr John Watson (Director since 7 October 2003) Mr Christopher Leon (Director since 31 October 2012) Mr Ng Joo Thieng (Appointed 17 February 2014 resigned 25 July 2014)
Mr Ng Joo Siang (Alternate Director for Mr Ng Joo Thieng) (Appointed 16 April 2014 resigned 25 July 2014)
Mr Michael Carroll (Director since 4 June 2014)
2. PRINCIPAL ACTIVITIES
During the year the principal activities of the consolidated entity were the hatching, farming, processing, sales and marketing of Atlantic salmon.
There were no significant changes in the nature
of the activities of the consolidated entity during the year.
3. DIVIDENDS
During and since the end of the 2013 financial year the following dividends have been paid or declared:
On 20 August 2013, the Directors declared a final unfranked dividend of 5.00 cents per ordinary share amounting to $7.325 million in respect of the financial year ended 30 June 2013. The record date for determining entitlements to this dividend was 13 September 2013. The final dividend was paid on 27 September 2013.
On 13 February 2014 the Directors declared
an interim 50% franked dividend of 5.5 cents per ordinary share amounting to $8.058 million in respect of the half year ended 31 December 2013. The record date for determining entitlements to this dividend
was 14 March 2014 with a payment date of 28 March 2014.
On 19 August 2014, the Directors declared a final 50% franked dividend of 6.00 cents per ordinary share amounting to $8.790 million in respect of the financial year ended 30 June 2014. The record date for determining entitlements to this dividend is 12
September 2014. The final dividend will be paid on 29 September 2014.
The final dividend for the year ended 30 June 2014 has not been recognised in this Annual Financial Report because it was declared subsequent to 30 June 2014.
4. REVIEW OF OPERATIONS
The consolidated net profit after tax for the financial year was $41.061 million. (For the financial year ended 30 June 2013: $33.457 million).
The consolidated entity’s revenue was $260.777 million compared with $266.298 million for the financial year to 30 June 2013.
Earnings before interest and tax (EBIT) was $63.128 million compared with $53.501 million for the financial year to 30 June 2013.
Cash flow from operating activities was significantly utilised to underpin the growth of fish inventory and infrastructure investment which, in turn, will underpin future profitability.
Earnings per share (EPS) on a weighted average basis was 28.03 cents per share compared with 22.87 cents per share for the financial year to 30 June 2013.
Further details on review of operations and likely future developments are outlined in the Chairman’s and CEO’s Report on pages 4 to 15 of this Annual Report.
5. CHANGES IN STATE OF AFFAIRS
In the opinion of the Directors, there were no significant changes in the state of affairs of the consolidated entity that occurred during the financial year under review not otherwise disclosed in this Directors’ Report or the Annual Report.
6. FUTURE DEVELOPMENTS
Likely developments in the consolidated entity’s operations have been commented on in a general nature in the Annual Financial Report. In particular, reference should be made to the joint Chairman’s and CEO’s Report. In the opinion of the Directors further information about likely developments in the operations of the consolidated entity and the expected results from those operations in future financial years has not been included because disclosure of the information would be likely to result in unreasonable prejudice to the consolidated entity.
For
per
sona
l use
onl
y
DIRECTORS’ REPORT cont. Tassal Group Limited and Controlled Entities
26
7. DIRECTORS, DIRECTORS’
MEETINGS AND DIRECTORS’
SHAREHOLDINGS
The names of the Directors who held office during the financial year and details of current Directors’ qualifications, Directors’ interests in the Company, experience and special responsibilities and directorships of other listed entities are set out in sections 16 and 17 of this Directors’ Report.
Details of Directors’ meetings and meetings of Committees of Directors including attendances are set out in section 18 of this Directors’ Report.
8. EVENTS SUBSEQUENT TO BALANCE
DATE
Except for the dividend declared after year end (refer to section 3 of Directors Report and also to note 2 to the financial statements), there has not arisen in the interval between the end of the financial year and the date of this report any item, transaction or event of a material and unusual nature likely, in the opinion of the Directors, to affect significantly the operations of the consolidated entity, the results of those operations, or the state of affairs of the consolidated entity, in future financial years.
9. INDEMNIFICATION OF OFFICERS
AND AUDITORS
During the financial year, the Company paid a premium in respect of a contract insuring the Directors of the Company (as named above), the Company Secretary, and all officers of the Company against a liability incurred as such a
Director, Secretary or officer to the extent permitted by the Corporations Act 2001. The contract of insurance prohibits disclosure of the nature of the liability and the amount of the premium.
The Company has not otherwise, during or since the financial year, indemnified or agreed to indemnify an officer or auditor of the Company or of any related body corporate against a liability incurred as such an officer or auditor.
10. ENVIRONMENTAL REGULATION
The consolidated entity’s operations are subject to Commonwealth and State regulations governing marine and hatchery operations, processing, land tenure and use, environmental requirements, including site specific environmental licences, permits, and statutory authorisations, workplace health and safety and trade and export.
The consolidated entity’s management regularly and routinely monitor compliance with the relevant environmental regulations and compliance is regularly reported to the Board.
The consolidated entity has well established procedures to monitor and manage compliance with existing environmental regulations and new regulations as they come into force.
The consolidated entity employs a Head of Sustainability whose role is to ensure compliance with the regulatory framework and implement processes of continuous improvement with respect to environmental management.
Further details with respect to the consolidated entity’s sustainability credentials and environmental management policies are outlined in the Chairman’s and CEO’s Report on pages 4 - 15 of the Annual Report.
The Directors believe that all regulations have been materially met during the period covered by this Annual Report and are not aware of any significant environmental incidents arising from the operations of the consolidated entity during the financial year.
11. CORPORATE GOVERNANCE
In recognising the need for the highest standards of corporate behaviour and accountability, the Directors support the principles of good corporate governance.
The consolidated entity’s statement on the main corporate governance practices in place during the year is set out on pages 16 to 24 of this Annual Report.
The Chief Executive Officer and Chief Financial Officer have declared, in writing to the Board, that the Company’s Annual Report is founded on a sound system of risk management and internal compliance and control which implements the policies adopted by the Board.
The Company’s Head of Risk has also provided a letter of assurance confirming that:
the Company’s risk management system is supported by a well-structured framework and policy, which is established based on the guidelines from AS/NZS ISO 31000:2009 Risk Management and ASX Corporate Governance Principles and Recommendations;
appropriate and adequate risk management and control monitoring and reporting mechanisms are in place; and
the Company’s risk management and internal compliance and risk related control systems are operating efficiently and effectively in all material respects.
12. AUDITOR’S INDEPENDENCE
DECLARATION
There were no former partners or directors of Deloitte Touche Tohmatsu, the Company’s auditor, who are or were at any time during the financial year an officer of the Company.
The auditor’s independence declaration made under section 307C of the Corporations Act 2001 is set out on page 44 and forms part of this Directors’ Report.
13. NON-AUDIT SERVICES
During the year Deloitte Touche Tohmatsu, the Company’s auditor, has performed certain “non-
For
per
sona
l use
onl
y
DIRECTORS’ REPORT cont. Tassal Group Limited and Controlled Entities
27
audit services” for the consolidated entity in addition to their statutory duties.
The Board has considered the non-audit services provided during the year by the auditor and in accordance with written advice endorsed by unanimous resolution of the Audit and Risk Committee, is satisfied that the provision of those non-audit services during the year by the auditor is compatible with, and did not compromise, the auditor independence requirements of the Corporations Act 2001 for the following reasons:
Non-audit services were subject to the
corporate governance procedures adopted by the Company and have been reviewed to ensure they do not impact the integrity and objectivity of the auditor; and
The non-audit services provided do not undermine the general principles relating to auditor independence as set out in Code of Conduct APES 110 Code of Ethics for Professional Accountants issued by the Accounting Professional and Ethical Standards Board, including reviewing or auditing the auditor’s own work, acting in a management or decision making capacity for the Company, acting as an advocate for the Company or jointly sharing economic risks and rewards.
Details of the amounts paid to Deloitte Touche Tohmatsu for audit and non-audit services provided during the year are set out in note 6 to the financial statements.
14. PROCEEDINGS ON BEHALF OF THE
COMPANY
There were no proceedings brought or intervened in on behalf of the Company with leave under section 237 of the Corporations Act 2001.
15. SHARE OPTIONS AND
PERFORMANCE RIGHTS
There were no options granted to Directors or any of the Senior Executives during or since the end of the financial year.
No options were exercised during or since the end of the financial year.
During the year 471,270 (2013: 655,740) performance rights were granted to the Chief Executive Officer and other members of the Company’s Executive Group pursuant to the Company’s Long-term Incentive Plan.
390,086 (2013: 202,625) performance rights vested on 30 June 2014.
Refer to section 20 (g) (ii) of the Directors’ Report for further details.
For
per
sona
l use
onl
y

DIRECTORS’ REPORT cont. Tassal Group Limited and Controlled Entities
28
16. INFORMATION ON DIRECTORS
Director Qualifications and experience Special responsibilities
Particulars of Directors’ interests in ordinary
shares, options and
performance rights over
ordinary shares in the Company
ALLAN McCALLUM
(Chairman) Dip. Ag Science, FAICD
Allan is a Non-Executive Director of Medical Developments International
Limited.
Allan is a member of the Rabobank Advisory Board.
Allan is a former Chairman of Vicgrain Limited and CRF Group Ltd and Deputy Chairman of Graincorp Limited. He was also a Non-Executive Director of
Incitec Pivot Limited for 16 years.
Allan has extensive experience in the agribusiness sector across production, processing, logistics and marketing.
Chairman of the Board
of Directors
Independent Non-executive Director
Chairman of the Remuneration and
Nominations
Committee
290,809 Ordinary Shares
TREVOR GERBER
B.Acc, CA(SA)
Trevor is a Non-Executive Director of Sydney Airport Holdings Limited, CFS Retail Property Trust Group and Leighton Holdings Limited.
Trevor has been a professional director since 2000 and prior to that worked for Westfield Holdings Limited for 14 years as Group Treasurer and subsequently as Director of Funds Management responsible for Westfield Trust and Westfield
America Trust.
Independent Non-executive Director
Member of the Audit and Risk Committee
Member of the Remuneration and
Nominations
Committee
Nil Shares
RUDI TSAI
MSIA, BS AEM
(Resigned 17 February 2014)
Rudi was, for his time as a Non-excecutive Director of the Company, the director of Strategic Development with the Pacific Andes Group. Prior to Pacific
Andes, he was in investment banking with over 20 years of experience in corporate finance advisory and capital raising and held senior management
positions with Fubon Financial, DBS Bank, JP Morgan and Schroders.
Rudi holds a Master of Science in Industrial Administration and a Bachelor of Science in Applied Economics and Management. He was a Responsible Officer
licenced by the Hong Kong Securities and Futures Commission to engage in
regulated activities in securities and corporate finance.
Non-independent Non-executive Director
Nil Shares
JOHN WATSON AM, MAICD
John has had extensive experience in the food production and processing industries as a producer and Non-executive Director. In his time as a Non-
executive Director, John has been on many boards of listed and unlisted
companies in Australia and New Zealand and has served on numerous advisory
boards to State and Commonwealth governments.
John was a Non-executive Director and Chairman of Incitec Pivot Limited from December 1997 to 30 June 2012.
Independent Non-executive Director
Chairman of the Audit and Risk Committee
Member of the Remuneration and
Nominations
Committee
148,230 Ordinary Shares
CHRISTOPHER (CHRIS)
LEON
BscEng, MEngSci, FAICD
Chris is a past CEO/MD of Cement Australia and Pivot Ltd, York International
Australia Pty Ltd and Thai Industrial Gases PLC.
Chris is a seasoned Director with 2 decades of experience as a Board member of private, public unlisted and public listed companies. He has a wide range of
experience in Agribusiness, Logistics, Manufacturing and Mining.
He is currently a Non-Executive Director of Queensland Sugar Limited and International House Foundation Limited
Independent Non-
executive Director
Member of the Audit and Risk Committee
30,000 Ordinary Shares
NG JOO THIENG
(Resigned 25 July 2014)
Joo Thieng has a principal role within The Pacific Andes Group and brings to the Board extensive experience in the seafood industry
Non-independent Non-executive Director
Nil shares
NG JOO SIANG
(Alternate Director)
(Resigned 25 July 2014)
Joo Siang is the Managing Director of The Pacific Andes Group and brings to the Board extensive experience in the seafood industry.
Joo Siang is an alternate director for Mr Ng Joo Thieng.
Non-independent Non-executive Director
Nil shares
MICHAEL CARROLL
NAgSc, MBA, FACID Michael has worked for a range of food and agricultural businesses in a board, advisory and executive capacity. He is a chairman of Queensland Sugar
Limited and Sunny Queen Pty Ltd, a director of Rural Funds Management Ltd,
Select Harvests Limited, Rural Finance Corporation of Victoria and the Geoffrey Gardiner Dairy Foundation Ltd.
Former board positions include Warrnambool Cheese and Butter, the Australian Farm Institute and Meat & livestock Australia. Executive experience includes
establishing and leading National Australia Bank’s Agribusiness division, a
senior role in NAB’s Investments and Advisory unit and marketing roles with international animal health and crop care companies.
Independent Non-executive Director
Member of the Audit and Risk Committee
Nil shares
MARK RYAN (Managing Director and
Chief Executive Officer)
B.Com, CA, MAICD, FAIM
Mark is the Managing Director and Chief Executive Officer of Tassal Group Limited. He has held the role of Chief Executive Officer since November 2003.
Mark holds a Bachelor of Commerce and is a Chartered Accountant. Mark is a
Director of AFL Tasmania, Salmon Enterprises of Tasmania Pty Ltd (Industry
hatchery), Juicy Isle Pty Limited, Institute for Marine and Antarctic Science (IMAS) as well as a number of other industry related associations.
Mark has extensive experience in the finance and turnaround management sector, with experience gained through PriceWaterhouseCoopers, Arthur
Andersen and KordaMentha. Mark was previously a partner with KordaMentha.
Managing Director and Chief Executive Officer
250,610 Ordinary Shares
336,509 Performance Rights
The particulars of Directors' interests in ordinary shares, options and performance rights over ordinary shares disclosed above are as at the date of this
Directors' Report and as notified by Directors to Australian Stock Exchange Limited in accordance with the S205G(1) of the Corporations Act 2001.
For
per
sona
l use
onl
y
DIRECTORS’ REPORT cont. Tassal Group Limited and Controlled Entities
29
17. DIRECTORSHIPS OF OTHER LISTED COMPANIES
Directorships of other listed companies held by the Directors in the three years immediately before the end of the
financial year are as follows:
Director Company
Period of Directorship (last 3
years)
A. McCallum Medical Developments International Limited Throughout
Incitec Pivot Limited Throughout until 19 December 2013
T. Gerber
Sydney Airport Holdings Limited
Valad Property Group
CFS Retail Property Trust Group
Leighton Holdings Limited
Throughout
Throughout until 26
August 2011
As from April 2014
As from 11 June 2014
M. Ryan - None held
R. Tsai - None held
J. Watson Incitec Pivot Limited Throughout to 30 June 2012
C. Leon - None Held
Ng J.Thieng - None Held
Ng J. Siang - None Held
M. Carroll Rural Funds Group (Director of Rural Funds Management, the responsible entity for Rural Funds Group)
Select Harvests Limited
Warrnambool Cheese & Butter Factory Co. Hold. Ltd
As from 23 October 2010
As from 23 March 2009
From 6 August 2009 to 9 May 2014
18. DIRECTORS’ MEETINGS
The following table sets out the number of Directors’ meetings (including meetings of Committees of Directors) held during the financial year and the number of meetings attended by each Director (while they were a Director or Committee Member). During the financial year, 10 Board meetings, 4 Remuneration and Nominations Committee meetings and 4 Audit and Risk Committee meetings were held.
Board of Directors
meetings Audit and Risk
Committee meetings
Remuneration and Nominations
Committee meetings
Director Number
held Number attended
Number held
Number attended
Number held
Number attended
T. Gerber 10 10 4 4 4 4
A. McCallum 10 10 * * 4 4
M. Ryan 10 10 * * * *
R. Tsai 6 4 * * * *
J. Watson 10 9 4 4 4 4
C. Leon 10 10 4 4 * *
Ng J. Thieng 4 1 * * * *
Ng J. Siang (Alternate) 2 0 * * * *
M. Carroll (Appointed 4 June
2014) 1 1 * * * *
(* not a committee member)
19. COMPANY SECRETARY
Monika Sylvia Maedler BEc, LLB, FCIS Ms Maedler is a senior legal executive with experience across a number of organisations including Kodak (Australasia) Pty Ltd, Philip Morris Ltd, SPC Ardmona Ltd and Adecco Group Australia and New Zealand.
For
per
sona
l use
onl
y

DIRECTORS’ REPORT cont. Tassal Group Limited and Controlled Entities
30
20. REMUNERATION REPORT - AUDITED
(a) Introduction
This Remuneration Report outlines the Company’s overall reward strategy for the year ended 30 June 2014 and provides detailed information on the remuneration arrangements in this period for the Directors of the Company including the Managing Director and Chief Executive Officer, other Key Management Personnel and other employees. Key Management Personnel have the authority and responsibility for planning, directing and controlling the activities of the Company for the year ended 30 June 2014.
The Remuneration Report forms part of the Directors’ Report and has been prepared in accordance with the requirements of the Corporations Act 2001 and its Regulations.
Tassal’s Remuneration Policy may be amended from time to time and is reviewed at least once a year. This may result in changes being made to the Policy for the year ending 30 June 2015.
(b) Remuneration Philosophy
The Remuneration and Nominations Committee is responsible for making recommendations to the Board on remuneration policies and packages applicable to Directors, the Managing Director and Chief Executive Officer and the Senior Executives. The primary objectives of the Remuneration Policy are to provide a competitive, flexible and benchmarked structure that reflects market best practice, is tailored to the specific circumstances of the Company and which reflects the person’s duties and responsibilities so as to attract, motivate and retain people of the appropriate quality.
Remuneration levels are competitively set to attract appropriately qualified and experienced Directors and executives. The Remuneration and Nominations Committee obtains market data on remuneration quantum. The remuneration packages of the Managing Director and Chief Executive Officer and Senior Executives may include a short-term incentive component that is linked to the overall financial and operational performance of the Company and based on the achievement of specific Company and individual / team goals. The Managing Director and Chief Executive Officer and the Senior Executives may also be invited to participate in the Company’s Long-term Incentive Plan (LTI Plan). The long-term benefits of the LTI Plan are conditional upon the Company achieving certain performance criteria, details of which are outlined below.
(c) Remuneration Structure
In accordance with best practice corporate governance, the structure of non-executive Director remuneration is separate and distinct from executive remuneration.
(d) Relationship Between the Remuneration Policy and Company Performance
The Consolidated entity’s key operations performance indicators in the financial year ended 30 June 2014 and the previous four financial years are summarised below.
Revenue (from all sources) 266,331$ 272,805$ 262,683$ 225,635$ 216,775$
Net proft before tax 58,061$ 47,502$ 38,705$ 40,580$ 34,568$
Net profit after tax 41,061$ 33,457$ 28,087$ 30,280$ 28,009$
30-June-2014 30-June-2013 30-June-2012 30-June-2011 30-June-2010
Share price:
Share price at the start of the year 2.45$ 1.33$ 1.41$ 1.41$ 1.94$
Share price at the end of the year 3.86$ 2.45$ 1.33$ 1.41$ 1.41$
Dividend per share:
Interim dividend 0.0550$ 0.0450$ 0.0400$ N/A 0.0400$
Final dividend 0.0600$ 0.0500$ 0.0400$ 0.0200$ 0.0200$
0.1150$ 0.0950$ 0.0800$ 0.0200$ 0.0600$
Earnings per share:
Basic 0.2803$ 0.2287$ 0.1920$ 0.2078$ 0.1996$
Diluted 0.2782$ 0.2270$ 0.1911$ 0.2070$ 0.1993$
The consolidated entity ultimately assesses its performance from increases in earnings and shareholder value. The performance measures for both the Company’s Short-term Incentive Plan (STI Plan) and LTI
For
per
sona
l use
onl
y

DIRECTORS’ REPORT cont. Tassal Group Limited and Controlled Entities
31
Plan have been tailored to align at-risk remuneration and performance hurdle thresholds to the delivery of financial and operational objectives and sustained shareholder value growth.
Over the past 5 years the consolidated entity has achieved the following compound annual growth rates:
Revenue (from all sources) - 6.31%
Net profit after tax - 6.42%
Basic earnings per share - 4.77%
(e) Components of Compensation – Non-executive Directors
The Board seeks to set aggregate remuneration at a level which provides the Company with the ability to attract and retain Directors of the highest calibre, whilst incurring a cost which is acceptable to shareholders.
The Constitution and the ASX Listing Rules specify that the aggregate remuneration of non-executive Directors shall be determined from time to time by a general meeting. Currently, the aggregate remuneration threshold is set at $600,000 as approved by shareholders at the AGM on 2 November 2007.
Legislated superannuation contributions made in respect of non-executive Directors are included in determining this shareholder approved maximum aggregate annual pool limit.
The amount of aggregate remuneration sought to be approved by shareholders and the manner in which it is apportioned amongst Directors is reviewed annually. The Board reviews its fees to ensure the Company’s non-executive Directors are fairly remunerated for their services, recognising the level of skill and experience required to fulfil the role, and to have in place a fee scale which enables the Company to attract and retain talented non-executive Directors. In conducting a review, the Board may take advice from an external independent remuneration consultant. The process involves benchmarking against a group of peer companies.
Non-executive Directors receive a cash fee for service and have no entitlement to any performance-based remuneration or participation in any share-based incentive schemes. This policy reflects the differences in the role of the non-executive Directors, which is to provide oversight and guide strategy, and the role of management, which is to operate the business and execute the Company’s strategy. Non-executive Directors are not subject to a minimum shareholding requirement, but are encouraged to acquire a number of shares whose value is at least equal to their annual fees as a Director of the Company.
Each non-executive Director receives a fee for being a Director of the Company. An additional fee is also paid for being a member of the Board’s Remuneration and Nominations Committee and Audit and Risk Committee. The payment of an additional fee recognises the additional time commitment required by Directors who serve on those committees.
Fees payable to the non-executive Directors of the Company for the 2014 financial year (inclusive of legislated superannuation contributions) were as follows:
Base
Remuneration and Nominations Committee
Audit and Risk
Committee
Chairman of the Board $179,378 N/A N/A
Each other non-executive Director $79,852 $6,566 $9,529
The Chairman of the Audit and Risk Committee received an additional $9,529 for chairing that Committee. (f) Components of Compensation – Chief Executive Officer and Other Senior Executives
(i) Structure
The Company aims to reward the Chief Executive Officer and Senior Executives with a level and mix of remuneration commensurate with their position and responsibilities within the Group, and so as to:
reward them for Company, business unit and individual performance against targets set by reference to appropriate benchmarks and key performance indicators;
align their interests with those of shareholders; and
ensure total remuneration is competitive by market standards.
Remuneration consists of both fixed and variable remuneration components. The variable remuneration component consists of the STI Plan and the LTI Plan.
The proportion of fixed remuneration and variable remuneration (potential short-term and long-term incentives) is established for the Chief Executive Officer by the Board and for each Senior Executive by the Board following recommendations from the Chief Executive Officer and the Remuneration and Nominations Committee.
For
per
sona
l use
onl
y

DIRECTORS’ REPORT cont. Tassal Group Limited and Controlled Entities
32
The Chief Executive Officer’s and Senior Executives’ remuneration packages are all respectively subject to Board approval.
(ii) Fixed annual remuneration
Remuneration levels are reviewed annually to ensure that they are appropriate for the responsibility, qualifications and experience of the Chief Executive Officer and each Senior Executive and are competitive with the market.
The Chief Executive Officer and Senior Executives have the option to receive their fixed annual remuneration in cash and a limited range of prescribed fringe benefits such as a motor vehicle and car parking. The total employment cost of any remuneration package, including fringe benefits tax, is taken into account in determining an employee’s fixed annual remuneration.
(iii) Variable remuneration – STI Plan
The objective of the STI Plan is to link the achievement of the annual operational targets with the remuneration received by the executives charged with meeting those targets. The total potential
STI available is set at a level so as to provide sufficient incentive to the executive to achieve the operational targets such that the cost to the Company is reasonable in the circumstances.
Actual STI payments granted to the Chief Executive Officer and each Senior Executive depend on the extent to which specific operational targets, set at the beginning of the year, are met. The operational targets may include a weighted combination of:
meeting a pre-determined growth target in consolidated entity net profit after tax over the prior year;
meeting strategic objectives; and
assessed personal effort and contribution.
The Remuneration and Nominations Committee consider the performance against targets, and determine the amount, if any, to be allocated to the Chief Executive Officer and each Senior Executive. STI payments are delivered as a cash bonus.
The target STI % range for the Chief Executive Officer and named Senior Executives and other Key Management Personnel in respect of the financial year ended 30 June 2014 is detailed below.
Executive
STI range
calculated on fixed
annual remuneration*
M. Ryan 15%- 60%
P. Bennett 7.5% - 30%
A. Creswell 7.5% - 30%
M. Maedler 7.5% - 30%
D. Kiemele 7.5% - 30%
K. Little 7.5% - 30%
J. O’Connor 7.5% - 30%
L. Sams 7.5% - 30%
D. Williams 7.5% - 30%
B. Daley 7.5% - 30%
C. Hounsell 7.5% - 30%
I. Miles 3.75% - 15%
* Fixed annual remuneration is comprised of base salary, superannuation and benefits provided through salary sacrificing arrangements.
Tassal’s STI for FY2014 was directly linked to the Company’s operating net profit after tax (NPAT) performance on the following basis:
For
per
sona
l use
onl
y

DIRECTORS’ REPORT cont. Tassal Group Limited and Controlled Entities
33
30 June 2014 30 June 2013
NPAT (i)
Threshold
$’000
% of STI
Triggered
%
NPAT (i)
Threshold
$’000
% of STI
Triggered
%
<$27,600 Nil <$24,500 Nil
$27,600 25% $24,500 25%
$27,600 - $33,200 25% - 100% $24,500 - $29,500 25% - 100%
>$33,200 100% >$29,500 100%
(i) (Derivation of NPAT for the purposes of calculating the STI payment is determined excluding the impact of applying AASB 141 ‘Agriculture’).
The Chief Executive Officer and Senior Executives received 74.52% (2013: 63.26%) of their respective FY2014 maximum STI entitlements.
The Board considers the FY2014 NPAT thresholds represented significant and challenging targets having regard to the challenging market conditions faced by the Company in FY2014.
(iv) Variable remuneration – LTI Plan
The LTI Plan has been designed to link employee reward with key performance indicators that drive sustainable growth in shareholder value over the long term. The objectives of the LTI Plan are to:
align the Chief Executive Officer’s and Senior Executives’ interests with those of shareholders;
help provide a long term focus; and
retain high calibre senior employees by providing an attractive equity-based incentive that builds an ownership of the Company mindset.
Under the LTI Plan, the Chief Executive Officer and Senior Executives are granted performance rights which will only vest on the achievement of certain performance hurdles and service conditions. An offer may be made under the LTI Plan to the Chief Executive Officer and Senior Executives each financial year and is based on individual performance as assessed by the annual appraisal process. If a Senior Executive does not sustain a consistent level of high performance they will not be nominated for LTI Plan participation. The Remuneration and Nominations Committee reviews all nominated Senior Executives, with participation subject to final Board
approval. In accordance with the ASX Listing Rules approval from shareholders is obtained before participation in the LTI Plan commences for the Chief Executive Officer.
Each grant of performance rights is subject to specific performance hurdles. The extent to which the performance hurdles have been met will be assessed by the Board at the expiry of a three year performance period.
The Board has retained the discretion to vary the performance hurdles and criteria for each offer under the LTI Plan. Once the Board has prescribed the performance hurdles for a specific offer under the LTI Plan, those performance hurdles cannot be varied in respect of that offer.
If a change of control occurs during a performance period, the pro-rated number of performance rights held by a participant (calculated according to the part of the performance period elapsed prior to the change of control) is determined and to the extent the performance hurdles have been met those pro-rated performance rights will vest.
Performance rights granted for the financial year ended 30 June 2014:
The performance hurdles for the grants of performance rights to the Chief Executive Officer and Senior Executives in the financial year ended 30 June 2014 are based on the Company’s Earnings per Share (EPS) growth over the performance period of the three years from 30 June 2013 (being the Base Year) to 30 June 2016 (the Performance Period), and on the Company’s Return on Assets (ROA) performance for the financial year ended 30 June 2016. Each performance condition is summarised as follows:
Earnings Per Share Hurdle (EPS) (Applies to 50% of performance rights granted in the financial year ended 30 June 2014).
“EPS” means earnings per share for a financial year which is calculated as statutory reported net profit after tax divided by the weighted average number of Shares on issue in the Company in respect of that financial year.
The EPS hurdle requires that the Company’s EPS growth over the Performance Period must be greater than the target set by the Board. The EPS target growth rate is linked to the Company’s Strategic Plan. The EPS hurdle was chosen as it provides evidence of the Company’s growth in earnings. The hurdle is as follows:
For
per
sona
l use
onl
y
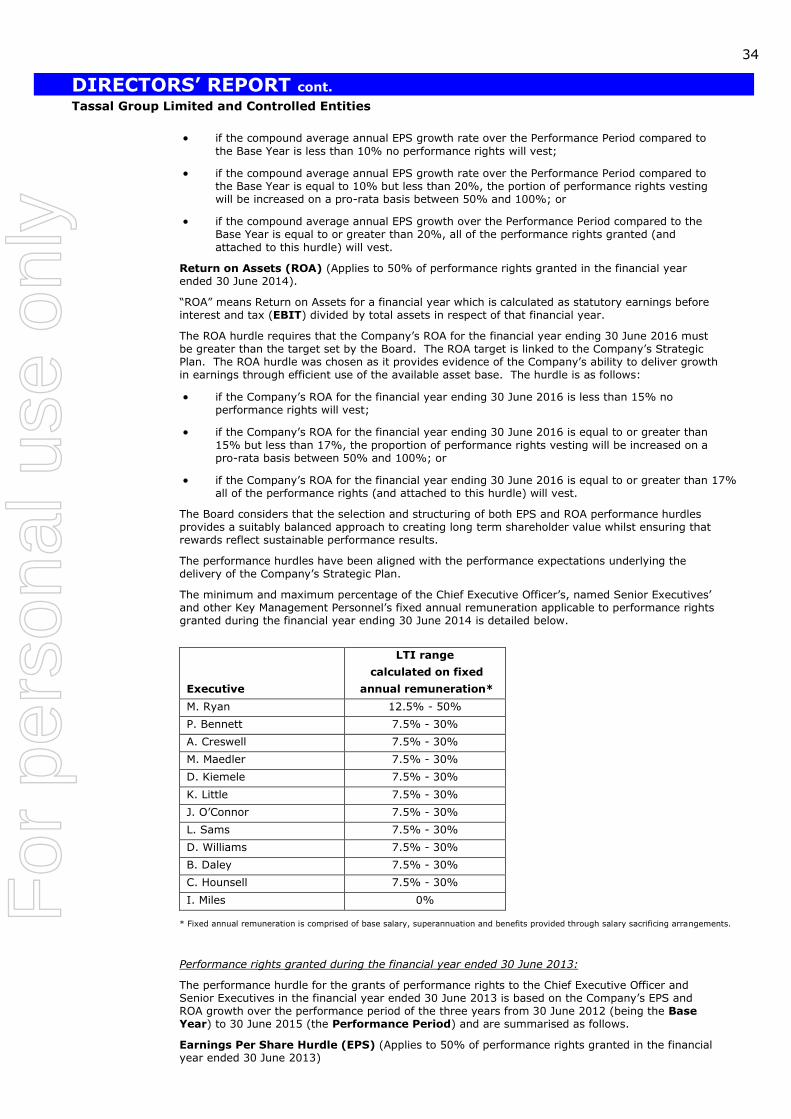
DIRECTORS’ REPORT cont. Tassal Group Limited and Controlled Entities
34
if the compound average annual EPS growth rate over the Performance Period compared to
the Base Year is less than 10% no performance rights will vest;
if the compound average annual EPS growth rate over the Performance Period compared to the Base Year is equal to 10% but less than 20%, the portion of performance rights vesting will be increased on a pro-rata basis between 50% and 100%; or
if the compound average annual EPS growth over the Performance Period compared to the Base Year is equal to or greater than 20%, all of the performance rights granted (and
attached to this hurdle) will vest.
Return on Assets (ROA) (Applies to 50% of performance rights granted in the financial year ended 30 June 2014).
“ROA” means Return on Assets for a financial year which is calculated as statutory earnings before interest and tax (EBIT) divided by total assets in respect of that financial year.
The ROA hurdle requires that the Company’s ROA for the financial year ending 30 June 2016 must be greater than the target set by the Board. The ROA target is linked to the Company’s Strategic Plan. The ROA hurdle was chosen as it provides evidence of the Company’s ability to deliver growth in earnings through efficient use of the available asset base. The hurdle is as follows:
if the Company’s ROA for the financial year ending 30 June 2016 is less than 15% no performance rights will vest;
if the Company’s ROA for the financial year ending 30 June 2016 is equal to or greater than
15% but less than 17%, the proportion of performance rights vesting will be increased on a pro-rata basis between 50% and 100%; or
if the Company’s ROA for the financial year ending 30 June 2016 is equal to or greater than 17% all of the performance rights (and attached to this hurdle) will vest.
The Board considers that the selection and structuring of both EPS and ROA performance hurdles provides a suitably balanced approach to creating long term shareholder value whilst ensuring that rewards reflect sustainable performance results.
The performance hurdles have been aligned with the performance expectations underlying the delivery of the Company’s Strategic Plan.
The minimum and maximum percentage of the Chief Executive Officer’s, named Senior Executives’ and other Key Management Personnel’s fixed annual remuneration applicable to performance rights granted during the financial year ending 30 June 2014 is detailed below.
Executive
LTI range
calculated on fixed
annual remuneration*
M. Ryan 12.5% - 50%
P. Bennett 7.5% - 30%
A. Creswell 7.5% - 30%
M. Maedler 7.5% - 30%
D. Kiemele 7.5% - 30%
K. Little 7.5% - 30%
J. O’Connor 7.5% - 30%
L. Sams 7.5% - 30%
D. Williams 7.5% - 30%
B. Daley 7.5% - 30%
C. Hounsell 7.5% - 30%
I. Miles 0%
* Fixed annual remuneration is comprised of base salary, superannuation and benefits provided through salary sacrificing arrangements.
Performance rights granted during the financial year ended 30 June 2013:
The performance hurdle for the grants of performance rights to the Chief Executive Officer and Senior Executives in the financial year ended 30 June 2013 is based on the Company’s EPS and ROA growth over the performance period of the three years from 30 June 2012 (being the Base Year) to 30 June 2015 (the Performance Period) and are summarised as follows.
Earnings Per Share Hurdle (EPS) (Applies to 50% of performance rights granted in the financial year ended 30 June 2013)
For
per
sona
l use
onl
y

DIRECTORS’ REPORT cont. Tassal Group Limited and Controlled Entities
35
“EPS” means earnings per share for a financial year which is calculated as statutory reported net profit after tax divided by the weighted average number of Shares on issue in the Company in respect of that financial year.
The EPS hurdle requires that the Company’s EPS growth over the Performance Period must be greater than the target set by the Board. The EPS target growth rate is linked to the Company’s Strategic Plan. The EPS hurdle was chosen as it provides evidence of the Company’s growth in earnings. The hurdle is as follows:
if the compound average annual EPS growth rate over the Performance Period compared to
the Base Year is less than 10% no performance rights will vest;
if the compound average annual EPS growth rate over the Performance Period compared to the Base Year is equal to 10% but less than 20%, the portion of performance rights vesting will be increased on a pro-rata basis between 50% and 100%; or
if the compound average annual EPS growth over the Performance Period compared to the
Base Year is equal to or greater than 20%, all of the performance rights granted (and attached to this hurdle) will vest.
Return on Assets (ROA) (Applies to 50% of performance rights granted in the financial year ended 30 June 2013).
“ROA” means Return on Assets for a financial year which is calculated as statutory earnings before interest and tax (EBIT) divided by total assets in respect of that financial year.
The ROA hurdle requires that the Company’s ROA for the financial year ending 30 June 2015 must be greater than the target set by the Board. The ROA target is linked to the Company’s Strategic Plan. The ROA hurdle was chosen as it provides evidence of the Company’s ability to deliver growth in earnings through efficient use of the available asset base. The hurdle is as follows:
if the Company’s ROA for the financial year ending 30 June 2015 is less than 15% no performance rights will vest;
if the Company’s ROA for the financial year ending 30 June 2015 is equal to or greater than
15% but less than 17%, the proportion of performance rights vesting will be increased on a pro-rata basis between 50% and 100%; or
if the Company’s ROA for the financial year ending 30 June 2015 is equal to or greater than 17% all of the performance rights (and attached to this hurdle) will vest.
The Board considers that the selection and structuring of both EPS and ROA performance hurdles provides a suitably balanced approach to creating long term shareholder value whilst ensuring that rewards reflect sustainable performance results.
The performance hurdles have been aligned with the performance expectations underlying the delivery of the Company’s Strategic Plan.
The minimum and maximum percentage of the Chief Executive Officer’s, named Senior Executives’ and other Key Management Personnel’s fixed annual remuneration applicable to performance rights granted during the financial year ending 30 June 2013 is detailed below.
Executive
LTI range
calculated on fixed
annual remuneration*
M. Ryan 12.5% - 50%
P. Bennett 7.5% - 30%
A. Creswell 7.5% - 30%
M. Maedler 7.5% - 30%
D. Kiemele 7.5% - 30%
K. Little 7.5% - 30%
J. O’Connor 7.5% - 30%
L. Sams 7.5% - 30%
D. Williams 7.5% - 30%
B. Daley 7.5% - 30%
C. Hounsell 3.75% - 15%
I. Miles 0%
* Fixed annual remuneration is comprised of base salary, superannuation and benefits provided through salary sacrificing arrangements.
Performance rights to be granted for the financial year ended 30 June 2015:
For
per
sona
l use
onl
y

DIRECTORS’ REPORT cont. Tassal Group Limited and Controlled Entities
36
Since the end of the financial year, the Board has approved the following LTI Plan dual performance hurdle structure for performance rights to be granted during the financial year ending 30 June 2015.
The performance hurdles for the grants of performance rights to the Chief Executive Officer and Senior Executives in the financial year ending 30 June 2015 will be based on the Company’s EPS (Earnings per Share) growth over the performance period of the three years from 30 June 2014 (being the Base Year) to 30 June 2017 (the Performance Period), and on the Company’s ROA (Return on Assets) performance for the financial year ending 30 June 2017. Each performance condition is summarised as follows:
Earnings Per Share Hurdle (EPS) (Applies to 50% of performance rights granted in the financial year ending 30 June 2015).
“EPS” means earnings per share for a financial year which is calculated as statutory reported net profit after tax divided by the weighted average number of Shares on issue in the Company in
respect of that financial year.
The EPS hurdle requires that the Company’s EPS growth over the Performance Period must be greater than the target set by the Board. The EPS target growth rate is linked to the Company’s Strategic Plan. The EPS hurdle was chosen as it provides evidence of the Company’s growth in earnings. The hurdle is as follows:
if the compound average annual EPS growth rate over the Performance Period compared to the Base Year is less than 10% no performance rights will vest;
if the compound average annual EPS growth rate over the Performance Period compared to the Base Year is equal to 10% but less than 20%, the portion of performance rights vesting will be increased on a pro-rata basis between 50% and 100%; or
if the compound average annual EPS growth over the Performance Period compared to the
Base Year is equal or greater than 20%, all of the performance rights granted (and attached to this hurdle) will vest.
Return on Assets (ROA) (Applies to 50% of performance rights granted in the financial year ending 30 June 2015).
“ROA” means Return on Assets for a financial year which is calculated as statutory earnings before interest and tax (EBIT) divided by total assets in respect of that financial year.
The ROA hurdle requires that the Company’s ROA for the financial year ending 30 June 2017 must be greater than the target set by the Board. The ROA target is linked to the Company’s Strategic Plan. The ROA hurdle was chosen as it provides evidence of the Company’s ability to deliver growth in earnings through efficient use of the available asset base. The hurdle is as follows:
if the Company’s ROA for the financial year ending 30 June 2017 is less than 15% no
performance rights will vest;
if the Company’s ROA for the financial year ending 30 June 2017 is equal to 15% but less than 17%, the proportion of performance rights vesting will be increased on a pro-rata basis between 50% and 100%; or
if the Company’s ROA for the financial year ending 30 June 2017 is equal to or greater than 17% all of the performance rights (and attached to this hurdle) will vest.
The Board considers that the selection and structuring of both EPS and ROA performance hurdles provides a suitably balanced approach to creating long term shareholder value whilst ensuring that rewards reflect sustainable performance results.
The performance hurdles have been aligned with the performance expectations underlying the delivery of the Company’s Strategic Plan.
The minimum and maximum percentage of the Chief Executive Officer’s, named Senior Executives’ and other Key Management Personnel’s fixed annual remuneration applicable to performance rights to be granted during the financial year ending 30 June 2015 is detailed below.
Executive
LTI range
calculated on fixed
annual remuneration*
For
per
sona
l use
onl
y

DIRECTORS’ REPORT cont. Tassal Group Limited and Controlled Entities
37
M. Ryan 12.5% - 50%
P. Bennett 7.5% - 30%
A. Creswell 7.5% - 30%
M. Maedler 7.5% - 30%
D. Kiemele 7.5% - 30%
K. Little 7.5% - 30%
J. O’Connor 7.5% - 30%
L. Sams 7.5% - 30%
D. Williams 7.5% - 30%
B. Daley 7.5% - 30%
C. Hounsell 7.5% - 30%
I. Miles 7.5% - 30%
* Fixed annual remuneration is comprised of base salary, superannuation and benefits provided through salary sacrificing arrangements.
(v) Contract for services – Chief Executive Officer
The structure of the Chief Executive Officer’s compensation is in accordance with his employment agreement. The Chief Executive Officer’s employment agreement is for an indefinite term. The Company may terminate the agreement by providing six months’ notice and the Chief Executive
Officer may terminate the agreement by providing six months’ notice to the Company. There are no termination benefits beyond statutory leave and superannuation obligations associated with the Chief Executive Officer’s termination in accordance with these notice requirements or in circumstances where notice is not required pursuant to his employment agreement.
(vi) Contract for services – Senior Executives
The terms on which the majority of Senior Executives are engaged provide for termination by either the Executive or the Company on six months’ notice. There are no termination benefits beyond statutory leave and superannuation obligations associated with these notice requirements.
(g) Key Management Personnel Compensation
(i) Identity of Key Management Personnel
The following were Key Management Personnel of the consolidated entity at any time during the financial year and unless otherwise indicated were Key Management Personnel for the entire period.
Directors:
Name Title
A. McCallum Chairman, Non-executive Director
M. Ryan Chief Executive Officer and Managing Director
T. Gerber Non-executive Director
R. Tsai1 Non-executive Director
J. Watson
C. Leon
J. Thieng Ng2
J. Siang Ng3
M. Carroll4
Non-executive Director
Non-executive Director
Non-executive Director
Alternate Non-executive Director
Non-executive Director
Notes: 1. To 17 February 2014
2. From 17 February 2014
3. From 16 April 2014
4. From 4 June 2014
Other Key Management Personnel:
Name
Title
For
per
sona
l use
onl
y
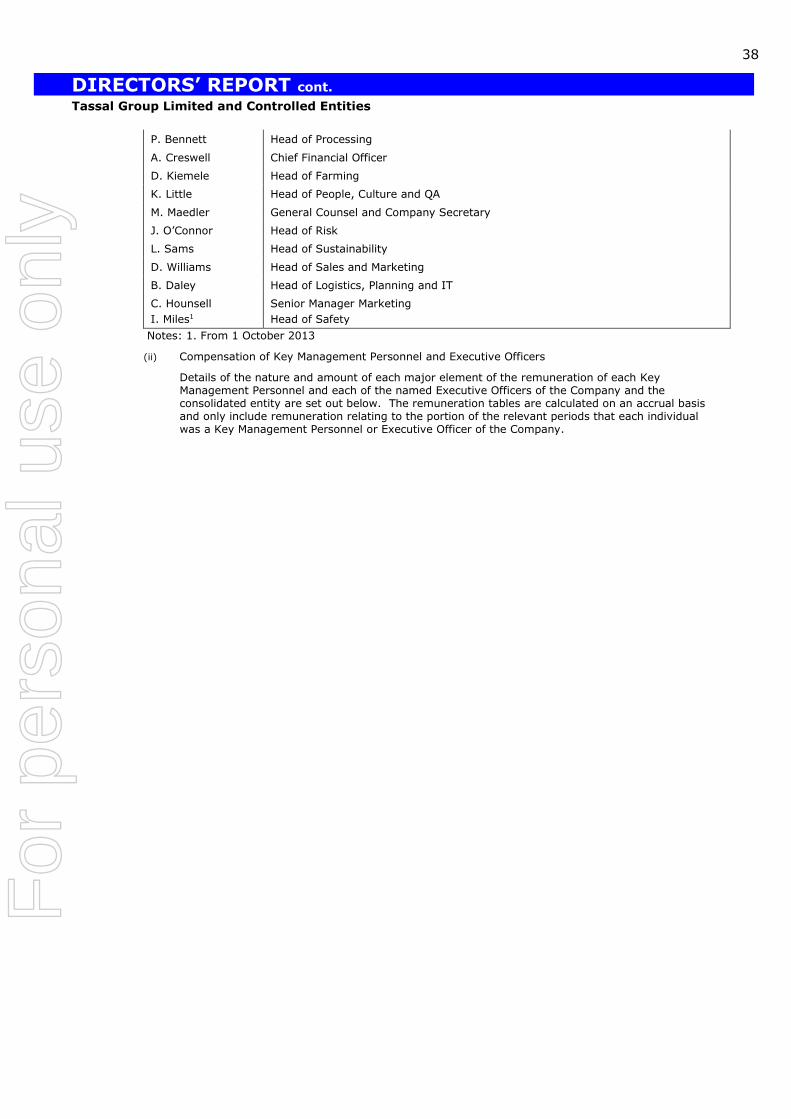
DIRECTORS’ REPORT cont. Tassal Group Limited and Controlled Entities
38
P. Bennett Head of Processing
A. Creswell Chief Financial Officer
D. Kiemele Head of Farming
K. Little Head of People, Culture and QA
M. Maedler General Counsel and Company Secretary
J. O’Connor Head of Risk
L. Sams Head of Sustainability
D. Williams Head of Sales and Marketing
B. Daley Head of Logistics, Planning and IT
C. Hounsell
I. Miles1
Senior Manager Marketing
Head of Safety
Notes: 1. From 1 October 2013
(ii) Compensation of Key Management Personnel and Executive Officers
Details of the nature and amount of each major element of the remuneration of each Key Management Personnel and each of the named Executive Officers of the Company and the consolidated entity are set out below. The remuneration tables are calculated on an accrual basis and only include remuneration relating to the portion of the relevant periods that each individual was a Key Management Personnel or Executive Officer of the Company.
For
per
sona
l use
onl
y
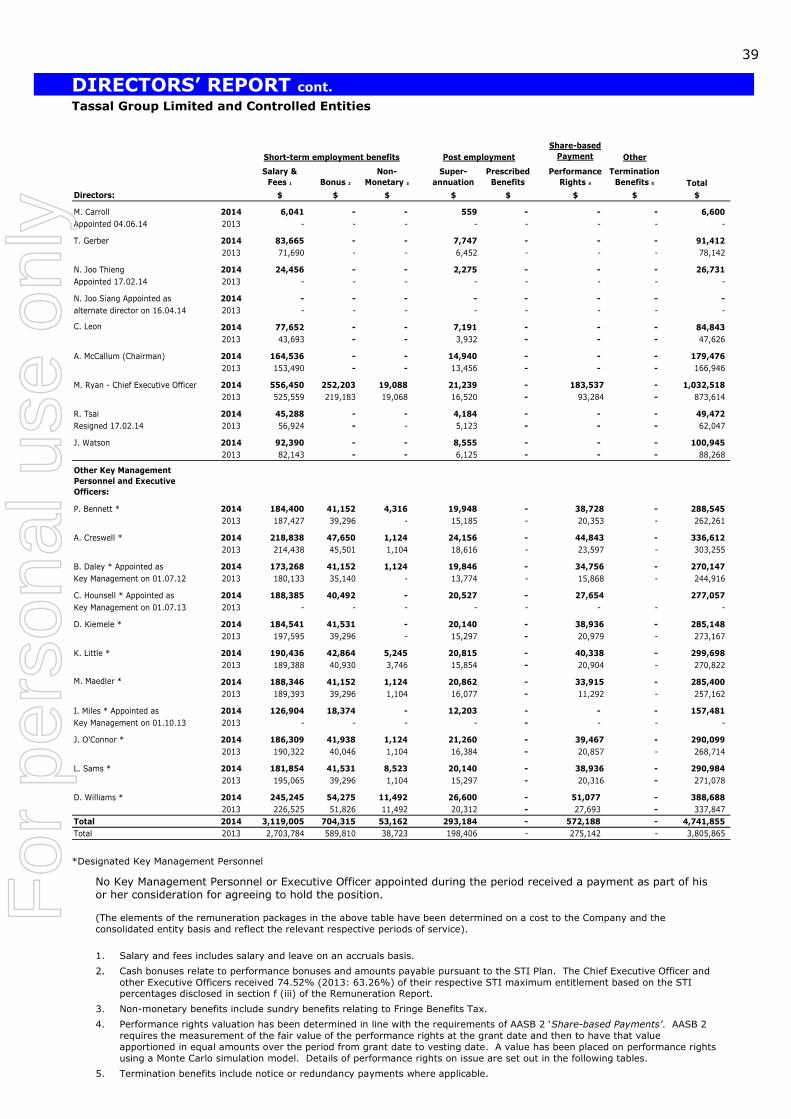
DIRECTORS’ REPORT cont. Tassal Group Limited and Controlled Entities
39
Share-based
Payment Other
Salary &
Fees 1 Bonus 2
Non-
Monetary 3
Super-
annuation
Prescribed
Benefits
Performance
Rights 4
Termination
Benefits 5 Total
Directors: $ $ $ $ $ $ $ $
M. Carroll 2014 6,041 - - 559 - - - 6,600
Appointed 04.06.14 2013 - - - - - - - -
T. Gerber 2014 83,665 - - 7,747 - - - 91,412
2013 71,690 - - 6,452 - - - 78,142
N. Joo Thieng 2014 24,456 - - 2,275 - - - 26,731
Appointed 17.02.14 2013 - - - - - - - -
N. Joo Siang Appointed as 2014 - - - - - - - -
alternate director on 16.04.14 2013 - - - - - - - -
C. Leon 2014 77,652 - - 7,191 - - - 84,843
2013 43,693 - - 3,932 - - - 47,626
A. McCallum (Chairman) 2014 164,536 - - 14,940 - - - 179,476
2013 153,490 - - 13,456 - - - 166,946
M. Ryan - Chief Executive Officer 2014 556,450 252,203 19,088 21,239 - 183,537 - 1,032,518
2013 525,559 219,183 19,068 16,520 - 93,284 - 873,614
R. Tsai 2014 45,288 - - 4,184 - - - 49,472
Resigned 17.02.14 2013 56,924 - - 5,123 - - - 62,047
J. Watson 2014 92,390 - - 8,555 - - - 100,945
2013 82,143 - - 6,125 - - - 88,268
Other Key Management
Personnel and Executive
Officers:
P. Bennett * 2014 184,400 41,152 4,316 19,948 - 38,728 - 288,545
2013 187,427 39,296 - 15,185 - 20,353 - 262,261
A. Creswell * 2014 218,838 47,650 1,124 24,156 - 44,843 - 336,612
2013 214,438 45,501 1,104 18,616 - 23,597 - 303,255
B. Daley * Appointed as 2014 173,268 41,152 1,124 19,846 - 34,756 - 270,147
Key Management on 01.07.12 2013 180,133 35,140 - 13,774 - 15,868 - 244,916
C. Hounsell * Appointed as 2014 188,385 40,492 - 20,527 - 27,654 277,057
Key Management on 01.07.13 2013 - - - - - - - -
D. Kiemele * 2014 184,541 41,531 - 20,140 - 38,936 - 285,148
2013 197,595 39,296 - 15,297 - 20,979 - 273,167
K. Little * 2014 190,436 42,864 5,245 20,815 - 40,338 - 299,698
2013 189,388 40,930 3,746 15,854 - 20,904 - 270,822
M. Maedler * 2014 188,346 41,152 1,124 20,862 - 33,915 - 285,400
2013 189,393 39,296 1,104 16,077 - 11,292 - 257,162
I. Miles * Appointed as 2014 126,904 18,374 - 12,203 - - - 157,481
Key Management on 01.10.13 2013 - - - - - - - -
J. O'Connor * 2014 186,309 41,938 1,124 21,260 - 39,467 - 290,099
2013 190,322 40,046 1,104 16,384 - 20,857 - 268,714
L. Sams * 2014 181,854 41,531 8,523 20,140 - 38,936 - 290,984
2013 195,065 39,296 1,104 15,297 - 20,316 - 271,078
D. Williams * 2014 245,245 54,275 11,492 26,600 - 51,077 - 388,688
2013 226,525 51,826 11,492 20,312 - 27,693 - 337,847
Total 2014 3,119,005 704,315 53,162 293,184 - 572,188 - 4,741,855
Total 2013 2,703,784 589,810 38,723 198,406 - 275,142 - 3,805,865
Short-term employment benefits Post employment
*Designated Key Management Personnel
No Key Management Personnel or Executive Officer appointed during the period received a payment as part of his or her consideration for agreeing to hold the position.
(The elements of the remuneration packages in the above table have been determined on a cost to the Company and the
consolidated entity basis and reflect the relevant respective periods of service).
1. Salary and fees includes salary and leave on an accruals basis.
2. Cash bonuses relate to performance bonuses and amounts payable pursuant to the STI Plan. The Chief Executive Officer and
other Executive Officers received 74.52% (2013: 63.26%) of their respective STI maximum entitlement based on the STI percentages disclosed in section f (iii) of the Remuneration Report.
3. Non-monetary benefits include sundry benefits relating to Fringe Benefits Tax.
4. Performance rights valuation has been determined in line with the requirements of AASB 2 ‘Share-based Payments’. AASB 2
requires the measurement of the fair value of the performance rights at the grant date and then to have that value
apportioned in equal amounts over the period from grant date to vesting date. A value has been placed on performance rights
using a Monte Carlo simulation model. Details of performance rights on issue are set out in the following tables.
5. Termination benefits include notice or redundancy payments where applicable.
For
per
sona
l use
onl
y

DIRECTORS’ REPORT cont. Tassal Group Limited and Controlled Entities
40
Analysis of LTI performance rights granted as remuneration
Details of the vesting profile of the performance rights granted as remuneration to the Chief Executive Officer and each of the named Executive Officers are summarised below:
Performance rights granted during the financial year ended 30 June 2014
Value yet to vest
Number Granted
Grant date
Vesting date
Vested during
the year
number
Vested during
the
year %
Forfeited during
the year
number
Forfeited during the
year
%
Minimum(1) $
Maximum (2) $
Director:
M. Ryan 137,028 20 Nov 2013 30 Jun 2016 - - - - Nil 371,029
Executive Officers:
P. Bennett 28,524 20 Nov 2013 30 Jun 2016 - - - - Nil 77,235
A. Creswell 33,028 20 Nov 2013 30 Jun 2016 - - - - Nil 89,429
B. Daley 28,524 20 Nov 2013 30 Jun 2016 - - - - Nil 77,235
C. Hounsell 28,066 20 Nov 2013 30 Jun 2016 - - - - Nil 75,995
D. Kiemele 28,787 20 Nov 2013 30 Jun 2016 - - - - Nil 77,945
K. Little 29,710 20 Nov 2013 30 Jun 2016 - - - - Nil 80,446
M. Maedler 28,524 20 Nov 2013 30 Jun 2016 - - - - Nil 77,235
J. O’Connor 29,069 20 Nov 2013 30 Jun 2016 - - - - Nil 78,709
L. Sams 28,787 20 Nov 2013 30 Jun 2016 - - - - Nil 77,945
D. Williams 37,620 20 Nov 2013 30 Jun 2016 - - - - Nil 101,862
(1) The minimum value of performance rights yet to vest is nil as the performance criteria may not be met and consequently the right may not vest.
(2) The maximum value of performance rights yet to vest represents an estimate of the maximum possible value of the performance rights to be
recognised based on the fair value at grant date of $2.708.
Performance rights granted during the financial year ended 30 June 2013
Value yet to vest
Number
Granted
Grant date
Vesting
date
Vested
during
the year number
Vested
during
the year %
Forfeited
during
the year number
Forfeited
during the
year %
Minimum
(1)
$
Maximum
(2)
$
Director:
M. Ryan 199,481 14 Dec 2012 30 Jun 2015 - - - - Nil 219,640
Executive
Officers:
P. Bennett 42,917 14 Dec 2012 30 Jun 2015 - - - - Nil 47,254
A. Creswell 49,693 14 Dec 2012 30 Jun 2015 - - - - Nil 54,715
B. Daley 38,377 14 Dec 2012 30 Jun 2015 - Nil 42,255
C. Hounsell 20,499 14 Dec 2012 30 Jun 2015 - - - - Nil 22,570
D. Kiemele 42,917 14 Dec 2012 30 Jun 2015 - - - - Nil 47,254
K. Little 44,701 14 Dec 2012 30 Jun 2015 - - - - Nil 49,218
M. Maedler 42,917 14 Dec 2012 30 Jun 2015 - - - - Nil 47,254
J. O’Connor 43,736 14 Dec 2012 30 Jun 2015 - - - - Nil 48,156
L. Sams 42,917 14 Dec 2012 30 Jun 2015 - - - - Nil 47,254
D. Williams 56,601 14 Dec 2012 30 Jun 2015 - - - - Nil 62,321
(1) The minimum value of performance rights yet to vest is nil as the performance criteria may not be met and consequently the right may not vest.
(2) The maximum value of performance rights yet to vest represents an estimate of the maximum possible value of the performance rights to be
recognised based on the fair value at grant date of $1.101.
For
per
sona
l use
onl
y

DIRECTORS’ REPORT cont. Tassal Group Limited and Controlled Entities
41
Performance rights granted during the financial year ended 30 June 2012
Number
Granted
Grant date
Vesting
date
Vested
during the
year
number1,5
Vested
during
the year
%
Forfeited
during
the year
Number2
Forfeited
during
the year
%
Value vested
during the
year 3
$
Value
forfeited
during the
year4
$
Director:
M. Ryan 178,412 25 Nov 2011 30 Jun 2014 136,016 76.24% 42,396 23.76% 186,855 58,242
Executive
Officers:
P. Bennett 38,384 25 Nov 2011 30 Jun 2014 29,263 76.24% 9,121 23.76% 40,201 12,530
A. Creswell 44,444 25 Nov 2011 30 Jun 2014 33,883 76.24% 10,561 23.76% 46,547 14,509
B. Daley 16,234 25 Nov 2011 30 Jun 2014 12,376 76.24% 3,858 23.76% 17,002 5,300
D. Kiemele 38,384 25 Nov 2011 30 Jun 2014 29,263 76.24% 9,121 23.76% 40,201 12,530
K. Little 39,980 25 Nov 2011 30 Jun 2014 30,480 76.24% 9,500 23.76% 41,872 13,051
J. O’Connor 39,117 25 Nov 2011 30 Jun 2014 29,822 76.24% 9,296 23.76% 40,968 12,769
L. Sams 38,384 25 Nov 2011 30 Jun 2014 29,263 76.24% 9,121 23.76% 40,201 12,530
D. Williams 50,623 25 Nov 2011 30 Jun 2014 38,593 76.24% 12,029 23.76% 53,019 16,526
(1) The number vested in the year represents the allotment from the maximum number of performance rights available to vest due to performance
criteria being achieved.
(2) The number forfeited in the year represents the reduction from the maximum number of performance rights available to vest due to performance
criteria not being achieved.
(3) The value of performance rights vested based on the fair value at grant date of $1.374.
(4) The value of performance rights forfeited as the performance criteria were not met and consequently the right did not vest, based on the fair value at
grant date of $1.374.
(5) An equivalent number of fully paid ordinary shares in respect of the performance rights granted during the year ended 30 June 2012 and which vested on 30 June 2014 will be issued pursuant to the Company’s Long-term incentive plan.
Equity Holdings
(Fully paid ordinary shares of Tassal Group Limited)
The following tables show details and movements in equity holdings of fully paid ordinary shares during the respective current and prior reporting periods of each member of the Key Management Personnel of the consolidated entity.
Balance at Balance at
appointment On exercise resignation Balance
Balance as date (if of performance On Exercise Net other date Balance as held
2014: at 01.07.13 applicable) rights of options change (if applicable) at 30.06.14 nominally
No. No. No. No. No. No. No. No.
Directors:
M. Carroll (appointed 04.06.14) - - - - - - - -
T. Gerber 50,000 - - - (50,000) - - -
N. Joo Thieng (appointed 17.02.14) - - - - - - - -
N. Joo Siang (appointed as alternate
director on 16.04.14) - - - - - - - -
C. Leon 20,000 - - - 10,000 - 30,000 -
A. McCallum 290,809 - - - - - 290,809 -
M. Ryan 1 170,338 - 80,272 - - - 250,610 -
R. Tsai (resigned 17.02.14) - - - - - - - -
J. Watson 148,230 - - - - - 148,230 -
Other Key Management Personnel:
P. Bennett - - 16,264 - - - 16,264 -
A. Creswell 29,202 - 18,724 - (29,202) - 18,724 -
B. Daley - - - - - - - -
C. Hounsell (appointed as key management
on 01.07.13) - - - - - - - -
D. Kiemele - - 14,043 - (2,800) - 11,243 -
K. Little - - 17,988 - (17,988) - - -
M. Maedler - - - - - - - -
I. Miles (appointed as key management on
01.10.13) - - - - - - - -
J. O'Connor - - 16,164 - - - 16,164 -
L. Sams - - 16,393 - (16,393) - - -
D. Williams 50,614 - 22,777 - - - 73,391 -
Total 759,193 - 202,625 - (106,383) - 855,435 -
1 Details of Mark Ryan’s share based remuneration arrangements are separately disclosed in the Remuneration Report and note 5 (c).
For
per
sona
l use
onl
y

DIRECTORS’ REPORT cont. Tassal Group Limited and Controlled Entities
42
Balance at Balance at
appointment On exercise resignation Balance
Balance as date (if of performance On Exercise Net other date Balance as held
2013: at 01.07.12 applicable) rights of options change (if applicable) at 30.06.13 nominally
No. No. No. No. No. No. No. No.
Directors:
T. Gerber 50,000 - - - - - 50,000 -
C. Leon (appointed 31.10.12) - - - - 20,000 - 20,000 -
A. McCallum 283,510 - - - 7,299 - 290,809 -
M. Ryan 1 170,338 - - - - - 170,338 -
R. Tsai - - - - - - - -
J. Watson 148,230 - - - - - 148,230 -
Other Key Management Personnel:
P. Bennett - - - - - - - -
A. Creswell 29,202 - - - - - 29,202 -
B. Daley (appointed as key
management on 01.07.12) - - - - - - - -
D. Kiemele - - - - - - - -
K. Little - - - - - - - -
M. Maedler - - - - - - - -
J. O'Connor - - - - - - - -
L. Sams - - - - - - - -
D. Williams 50,614 - - - - - 50,614 -
Total 731,894 - - - 27,299 - 759,193 -
1 Details of Mark Ryan’s share based remuneration arrangements are separately disclosed in the Remuneration Report and note 5 (c).
Long-term Incentive Plan – Performance Rights
The following table shows details and movements in equity holdings of performance rights granted pursuant to the Company’s Long-term Incentive Plan during the current and prior reporting periods of each member of the Key Management Personnel of the consolidated entity:
Balance at
appointment Balance
Balance as date Net other Balance as held
2014: at 01.07.13 (if applicable) Granted Vested Lapsed change at 30.06.14 nominally
No. No. No. No. No. No. No. No.
Directors:
M. Carroll (appointed 04.06.14) - - - - - - - -
T. Gerber - - - - - - - -
N. Joo Thieng (appointed 17.02.14) - - - - - - - -
N. Joo Siang (appointed as alternate
director on 16.04.14) - - - - - - - -
C. Leon - - - - - - - -
A. McCallum - - - - - - - -
M. Ryan 1 377,893 - 137,028 (136,016) (42,396) - 336,509 -
R. Tsai (resigned 17.02.14) - - - - - - - -
J. Watson - - - - - - - -
Other Key Management Personnel:
P. Bennett 81,301 - 28,524 (29,263) (9,121) - 71,441 -
A. Creswell 94,137 - 33,028 (33,883) (10,561) - 82,721 -
B. Daley 54,611 - 28,524 (12,376) (3,858) - 66,901 -
C. Hounsell (appointed as key management
on 01.07.13) 20,499 20,499 28,066 - - - 48,565 -
D. Kiemele 81,302 - 28,787 (29,263) (9,121) - 71,705 -
K. Little 84,681 - 29,710 (30,480) (9,500) - 74,411 -
M. Maedler 42,917 - 28,524 - - - 71,441 -
I. Miles (appointed as key management on
01.10.13) - - - - - - - -
J. O'Connor 82,853 - 29,069 (29,822) (9,296) - 72,804 -
L. Sams 81,301 - 28,787 (29,263) (9,121) - 71,704 -
D. Williams 107,223 - 37,620 (38,593) (12,029) - 94,221 -
Total 1,108,718 20,499 437,667 (368,959) (115,003) - 1,062,423 -
1 Details of Mark Ryan’s share based remuneration arrangements are separately disclosed in the Remuneration Report and note 5 (c).
For
per
sona
l use
onl
y

DIRECTORS’ REPORT cont. Tassal Group Limited and Controlled Entities
43
Balance at
appointment Balance
Balance as date Net other Balance as held
2013: at 01.07.12 (if applicable) Granted Vested Lapsed change at 30.06.13 nominally
No. No. No. No. No. No. No. No.
Directors:
T. Gerber - - - - - - - -
C. Leon (appointed 31.10.12) - - - - - - - -
A. McCallum - - - - - - - -
M. Ryan 1 338,955 - 199,481 (80,272) (80,272) - 377,893 -
R. Tsai - - - - - - - -
J. Watson - - - - - - - -
Other Key Management Personnel:
P. Bennett 70,913 - 42,917 (16,265) (16,265) - 81,301 -
A. Creswell 81,892 - 49,693 (18,724) (18,724) - 94,137 -
B. Daley (appointed as key
management on 01.07.12) 16,234 16,234 38,377 - - - 54,611 -
D. Kiemele 66,470 - 42,917 (14,043) (14,043) - 81,302 -
K. Little 75,956 - 44,701 (17,988) (17,988) - 84,681 -
M. Maedler - - 42,917 - - - 42,917 -
J. O'Connor 71,446 - 43,736 (16,165) (16,165) - 82,853 -
L. Sams 71,170 - 42,917 (16,393) (16,393) - 81,301 -
D. Williams 96,176 - 56,601 (22,777) (22,777) - 107,223 -
Total 889,212 16,234 604,257 (202,625) (202,625) - 1,088,219 -
1 Details of Mr Ryan’s share-based remuneration arrangements are separately disclosed in the Remuneration Report and note 5 (c).
All performance rights granted to Key Management Personnel were granted in accordance with the provisions of the Company’s Long-term Incentive Plan. Refer to the Remuneration Report and note 5 to the financial statements, for further details.
21. ROUNDING OFF OF AMOUNTS
The Company is of a kind referred to in ASIC Class Order 98/0100 dated 10 July 1998 and in accordance with that Class Order, amounts in the Annual Financial Report and the Directors’ Report have been rounded off to the nearest thousand dollars, unless otherwise indicated.
Signed in accordance with a resolution of Directors made pursuant to section 298(2) of the Corporations Act 2001.
On behalf of the Directors
A.D. McCallum Chairman Hobart this 19th day of August 2014
For
per
sona
l use
onl
y

AUDITOR’S INDEPENDENCE DECLARATION Tassal Group Limited and Controlled Entities
44
19 August 2014
Dear Board Members
Tassal Group Limited
In accordance with section 307C of the Corporations Act 2001, I am pleased to provide the following declaration of
independence to the directors of Tassal Group Limited.
As lead audit partner for the audit of the financial statements of Tassal Group Limited for the financial year ended
30 June 2014, I declare that to the best of my knowledge and belief, there have been no contraventions of:
(i) the auditor independence requirements of the Corporations Act 2001 in relation to the audit; and
(ii) any applicable code of professional conduct in relation to the audit.
Yours sincerely
DELOITTE TOUCHE TOHMATSU
Carl Harris
Partner
Chartered Accountants
Liability limited by a scheme approved under Professional Standards Legislation Member of Deloitte Touche Tohmatsu Limited
Deloitte Touche Tohmatsu
ABN 74 490 121 060
Level 8
22 Elizabeth Street
Hobart TAS 7000
GPO Box 777
Hobart TAS 7001 Australia
Tel: +61 3 6237 7000
Fax: +61 3 6237 7001
www.deloitte.com.au The Board of Directors
Tassal Group Limited
2 Salamanca Square
Battery Point Tasmania 7004
For
per
sona
l use
onl
y

INCOME STATEMENT for the year ended 30 June 2014 Tassal Group Limited and Controlled Entities
45
Income Statement 46
Statement of Comprehensive Income 47
Statement of Financial Position 48
Statement of Changes in Equity 49
Statement of Cash Flows 50
Notes to the Financial Statements 51 – 92
Directors’ Declaration 93
Independent Auditor’s Report 94
Additional Securities Exchange Information 95
For
per
sona
l use
onl
y

INCOME STATEMENT for the year ended 30 June 2014 Tassal Group Limited and Controlled Entities
46
Note Consolidated
2014 Consolidated
2013
$’000 $’000
Revenue 3(a) 260,777 266,298
Other income 3(b) 4,953 5,776
Fair value adjustment of biological assets 12,939 12,256
Fair value adjustment of biological assets at point of harvest 2,113 (2,469)
Share of profits / (losses) of associates accounted for using the equity method 12 601 731
Changes in inventories of finished goods and work in progress 1,144 (7,611)
Raw materials and consumables used
(137,561) (139,174)
Employee benefits expense 3(c) (50,414) (48,499)
Depreciation and amortisation expense 3(c) (15,469) (15,532)
Finance costs 3(c) (5,067) (5,999)
Other expenses (15,955) (18,275)
Profit before income tax expense 58,061 47,502
Income tax expense 4 (17,000) (14,045)
Net profit for the period attributable to members of the Company 41,061 33,457
Note Cents per
share Cents per
share
2014 2013
Earnings per ordinary share:
Basic (cents per share) 29 28.03 22.87
Diluted (cents per share) 29 27.82 22.70
Notes to the financial statements are included on pages 51 to 92.
For
per
sona
l use
onl
y

STATEMENT OF COMPREHENSIVE INCOME for the year ended 30 June 2014 Tassal Group Limited and Controlled Entities
47
Note
Consolidated
2014
Consolidated
2013
$’000 $’000
Profit for the period 41,061 33,457
Other comprehensive income
Items that will not be reclassified subsequently to profit or loss:
Gain / (loss) on revaluation of property 14 - (970)
Income tax relating to items that will not be reclassified subsequently - 291
Items that may be reclassified subsequently to profit or loss:
Gain / (loss) on cash flow hedges 27(a) (56) (204)
Income tax relating to items that may be reclassified subsequently 17 61
Other comprehensive income for the period (net of tax) (39) (822)
Total comprehensive income for the period attributed to owners of the parent 41,022 32,635
Notes to the financial statements are included on pages 51 to 92.
For
per
sona
l use
onl
y
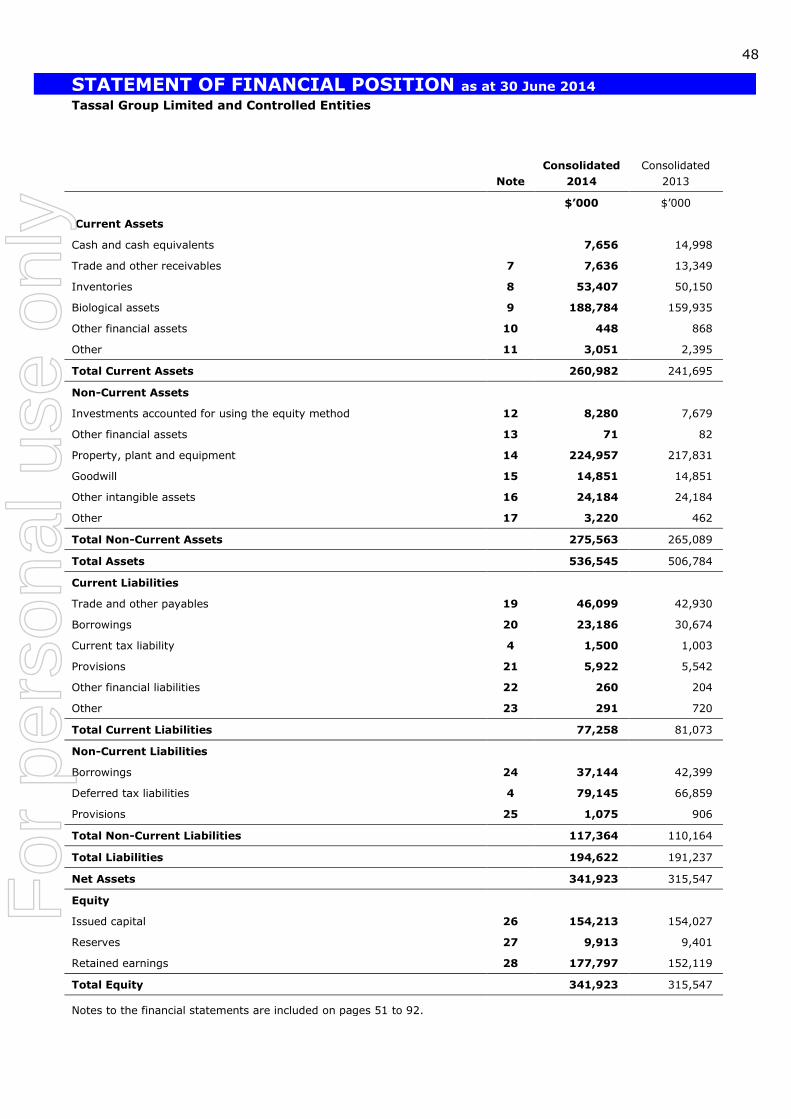
STATEMENT OF FINANCIAL POSITION as at 30 June 2014 Tassal Group Limited and Controlled Entities
48
Note
Consolidated
2014
Consolidated
2013
$’000 $’000
Current Assets
Cash and cash equivalents 7,656 14,998
Trade and other receivables 7 7,636 13,349
Inventories 8 53,407 50,150
Biological assets 9 188,784 159,935
Other financial assets 10 448 868
Other 11 3,051 2,395
Total Current Assets 260,982 241,695
Non-Current Assets
Investments accounted for using the equity method 12 8,280 7,679
Other financial assets 13 71 82
Property, plant and equipment 14 224,957 217,831
Goodwill 15 14,851 14,851
Other intangible assets 16 24,184 24,184
Other 17 3,220 462
Total Non-Current Assets 275,563 265,089
Total Assets 536,545 506,784
Current Liabilities
Trade and other payables 19 46,099 42,930
Borrowings 20 23,186 30,674
Current tax liability 4 1,500 1,003
Provisions 21 5,922 5,542
Other financial liabilities 22 260 204
Other 23 291 720
Total Current Liabilities 77,258 81,073
Non-Current Liabilities
Borrowings 24 37,144 42,399
Deferred tax liabilities 4 79,145 66,859
Provisions 25 1,075 906
Total Non-Current Liabilities 117,364 110,164
Total Liabilities 194,622 191,237
Net Assets 341,923 315,547
Equity
Issued capital 26 154,213 154,027
Reserves 27 9,913 9,401
Retained earnings 28 177,797 152,119
Total Equity 341,923 315,547
Notes to the financial statements are included on pages 51 to 92.
For
per
sona
l use
onl
y

STATEMENT OF CHANGES IN EQUITY for the year ended 30 June 2014 Tassal Group Limited and Controlled Entities
49
Consolidated
Issued capital
Asset
revaluationreserve
Hedging reserve
Equity-
settled employee benefits reserve
Retained earnings
Total
attributable to equity holders of the entity
$’000 $’000 $’000 $’000 $’000 $’000
Balance as at 1 July 2012 154,027 9,294 - 639 131,098 295,058
Profit for the period - - - - 33,457 33,457
Gain / (loss) on revaluation of property (net of any related tax)
-
(679)
-
-
-
(679)
Gain / (loss) on cash flow hedges (net of any related tax)
-
-
(143)
-
-
(143)
Total comprehensive income for the period
-
(679)
(143)
-
33,457
32,635
Payment of dividends - - - - (12,436) (12,436)
Issue of shares pursuant to
Executive Long Term Incentive Plan
- - - - - -
Recognition of share-based payments
- - - 290 - 290
Balance as at 30 June 2013 154,027 8,615 (143) 929 152,119 315,547
Balance as at 1 July 2013 154,027 8,615 (143) 929 152,119 315,547
Profit for the period - - - - 41,061 41,061
Gain / (loss) on revaluation of property (net of any related tax)
-
-
-
-
-
-
Gain / (loss) on cash flow hedges (net of any related tax)
-
-
(39)
-
-
(39)
Total comprehensive income for the period
-
-
(39)
-
41,061
41,022
Payment of dividends - - - - (15,383) (15,383)
Issue of shares pursuant to
Executive Long Term Incentive Plan
186
-
-
(186)
-
-
Recognition of share-based payments
- - - 737 - 737
Balance as at 30 June 2014 154,213 8,615 (182) 1,480 177,797 341,923
Notes to the financial statements are included on pages 51 to 92.
For
per
sona
l use
onl
y

STATEMENT OF CASH FLOWS for the year ended 30 June 2014 Tassal Group Limited and Controlled Entities
50
Note
Consolidated
2014
Consolidated
2013
$’000 $’000
Cash Flows from Operating Activities
Receipts from customers 296,813 291,569
Receipts from government grants - 1,040
Payments to suppliers and employees (238,571) (237,509)
Interest received 295 231
Interest and other costs of finance paid (5,153) (5,613)
Income taxes paid (2,758) -
Net cash (used in) / provided by operating activities 38(b)
50,626
49,718
Cash Flows from Investing Activities
Payment for property, plant and equipment (29,842) (19,946)
Proceeds from sale of property, plant and equipment - 1
Net cash (used in)/provided by investing activities (29,842) (19,945)
Cash Flows from Financing Activities
Proceeds from borrowings 13,794 12,245
Repayment of borrowings (26,537) (30,414)
Dividends paid to members of the parent entity (15,383) (12,436)
Net cash (used in)/ provided by financing activities (28,126) (30,605)
Net increase / (decrease) in cash and cash equivalents (7,342) (832)
Cash and cash equivalents at the beginning of the financial year 14,998 15,830
Cash and cash equivalents at the end of the financial year 38(a) 7,656 14,998
Notes to the financial statements are included on pages 51 to 92.
For
per
sona
l use
onl
y

NOTES TO THE FINANCIAL STATEMENTS for the year ended 30 June 2014 Tassal Group Limited and Controlled Entities
51
NOTE CONTENTS
1. Summary of Accounting Policies
2. Subsequent Events
3. Profit for the Year Before Tax
4. Income Taxes
5. Key Management Personnel Compensation
6. Remuneration of Auditors
7. Current Trade and Other Receivables
8. Current Inventories
9. Biological Assets
10. Other Current Financial Assets
11. Other Current Assets
12. Investments Accounted for Using the Equity Method
13. Other Non-current Financial Assets
14. Property, Plant and Equipment
15. Goodwill
16. Other Intangible Assets
17. Other Non-current Assets
18. Assets Pledged as Security
19. Current Trade and Other Payables
20. Current Borrowings
21. Current Provisions
22. Other Current Financial Liabilities
23. Other Current Liabilities
24. Non-current Borrowings
25. Non-current Provisions
26. Issued Capital
27. Reserves
28. Retained Earnings
29. Earnings Per Share (EPS)
30. Dividends
31. Commitments for Expenditure
32. Leases
33. Contingent Liabilities and Contingent Assets
34. Investments in Controlled Entities
35. Segment Information
36. Seasonality
37. Related Party Disclosures
38. Notes to the Statement of Cash Flows
39. Financial Instruments
40. Parent Entity Information
For
per
sona
l use
onl
y

NOTES TO THE FINANCIAL STATEMENTS for the year ended 30 June 2014 cont. Tassal Group Limited and Controlled Entities
52
1. SUMMARY OF ACCOUNTING POLICIES
Statement of Compliance
The Annual Financial Report is a general purpose financial report and has been prepared in accordance with the Corporations Act 2001, Accounting Standards and Interpretations, and complies with other requirements of the law. For the purposes of preparing the consolidated financial statements, the consolidated entity is a for-profit entity. Accounting Standards include Australian equivalents to International Financial Reporting Standards (A-IFRS). Compliance with A-IFRS ensures that the financial statements and notes of the consolidated entity comply with International Financial Reporting Standards (IFRS).
The Annual Financial Report was authorised for issue by the Directors on 19 August 2014.
Basis of Preparation
The Annual Financial Report has been prepared on the basis of historic cost except for biological assets which are measured at net market value, and, if relevant for the revaluation of certain non-current assets and financial instruments, and except where stated, does not take into account changing money values or current valuations of non-current assets. Cost is based on the fair values of the consideration given in exchange for assets.
All amounts are presented in Australian Dollars, unless otherwise noted.
Fair value is the price that would be received to sell an
asset or paid to transfer a liability in an orderly transaction between market participants at the measurement date, regardless of whether that price is directly observable or estimated using another valuation technique. In estimating the fair value of an asset or a liability, the Group takes into account the characteristics of the asset or liability if market participants would take those characteristics into account when pricing the asset or liability at the measurement date. Fair value for measurement and/or disclosure purposes in these consolidated financial statements is determined on such a basis, except for share-based payment transactions that are within the scope of AASB 2, leasing transactions that are within the scope of AASB 117, and measurements that have some similarities to fair value but are not fair value, such as net realisable value in AASB 2 or value in use in AASB 136.
In addition, for financial reporting purposes, fair value measurements are categorised into Level 1, 2 or 3 based on the degree to which the inputs to the fair value measurements are observable and the significance of the inputs to the fair value measurement in its entirety, which are described as follows:
• Level 1 inputs are quoted prices (unadjusted) in active markets for identical assets or liabilities that the entity can access at the measurement date;
• Level 2 inputs are inputs, other than quoted prices included within Level 1, that are observable for the asset or liability, either directly or indirectly; and
• Level 3 inputs are unobservable inputs for the asset or liability.
The Company is a company of the kind referred to in ASIC Class Order 98/0100, dated 10 July 1998, and in accordance with that Class Order amounts in the Annual Financial Report are rounded to the nearest thousand dollars, unless otherwise indicated.
Critical Accounting Judgements and Key Sources of Estimation Uncertainty
In the application of the consolidated entity’s accounting policies, management is required to make judgments, estimates and assumptions about carrying values of assets and liabilities that are not readily apparent from other sources.
The estimates and associated assumptions are based on historical experience and various other factors, including expectations of future events, that are believed to be reasonable under the circumstances, the results of which form the basis of making the judgments. Actual results may differ from these estimates.
The estimates and underlying assumptions are reviewed on an ongoing basis. Revisions to accounting estimates are recognised in the period in which the estimate is revised if the revision affects only that period, or in the period of the revision and future periods if the revision affects both current and future periods.
Judgments made by management in the application of consolidated entity’s accounting policies that have significant effects on the Annual Financial Report and estimates with a significant risk of material adjustments in the next year are disclosed, where applicable, in the relevant notes to the financial statements. They include the following: Goodwill (refer to note 15) Brand names (refer to note 16) Biological assets (refer to note 9)
Some of the Group’s assets and liabilities are measured at fair value for financial reporting purposes. In estimating the fair value of an asset or a liability, the Group uses market-observable data to the extent it is available. Where Level 1 inputs are not available, the Group engages third party qualified valuers to perform the valuation. Information about the valuation techniques and inputs in determining the fair value of various assets and liabilities are disclosed in notes 9, 14, and 39.
Accounting policies are selected and applied in a manner which ensures that the resulting financial information satisfies the concepts of relevance and reliability, thereby ensuring that the substance of the underlying transactions or other events is reported.
The accounting policies set out below have been applied in preparing the financial statements for the year ended 30 June 2014, and the comparative information presented in these financial statements.
Application of New and Revised Accounting Standards (i) Standards and Interpretations affecting
amounts reported in the current period (and
/ or prior periods)
The following new and revised Standards and Interpretations have been adopted in the current period and have affected the amounts reported in these financial statements.
For
per
sona
l use
onl
y

NOTES TO THE FINANCIAL STATEMENTS for the year ended 30 June 2014 cont. Tassal Group Limited and Controlled Entities
53
AASB 2011-4 ‘Amendments to Australian Accounting Standards to Remove Individual Key Management Personnel Disclosure Requirements’ This standard removes the individual key management personnel disclosure requirements in AASB 124 ‘Related Parry Disclosures’. As a result the Group only discloses the key management personnel compensation in total and for each of the categories required in AASB 124. In the current year, the individual key management personnel disclosure previously required by AASB 124 (note 37 in the 30 June 2013 financial statements) is now disclosed in the remuneration report due to an amendment to Corporations Regulations 2001 issued in June 2013. AASB 2012-5 ‘Amendments to Australian Accounting Standards arising from Annual Improvements 2009-2011 Cycle’
The Annual Improvements to AASBs 2009-2011 have made a number of amendments to AASBs. The amendments that are relevant to the Group are the amendments to AASB 101 regarding when a statement of financial position as at the beginning of the preceding period (third statement of financial position) and the related notes are required to be presented. The amendments specify that a third statement of financial position is required when a) an entity applies an accounting policy retrospectively, or makes a retrospective restatement or reclassification of items in its financial statements, and b) the retrospective application, restatement or reclassification has a material effect on the information in the third statement of financial position. The amendments specify that related notes are not required to accompany the third statement of financial position. AASB CF 2013-1 ‘Amendments to the Australian Conceptual Framework’ and AASB 2013-9 ‘Amendments to Australian Accounting Standards – Conceptual Framework, Materiality and Financial Instruments’ (Part A Conceptual Framework) This amendment has incorporated IASB’s Chapters 1 and 3 Conceptual Framework for Financial Reporting as an Appendix to the Australian Framework for the Preparation and Presentation of Financial Statements. As a result the Australian Conceptual Framework now supersedes the objective and qualitative characteristics of financial statements, as well as the guidance previously available in the Statement of Accounting Concepts SAC 2 ‘Objective of General Purpose Financial Reporting’. The adoption of this amending standard does not have any material impact on the consolidated financial statements. New and Revised Standards on consolidation, joint arrangements, associates and disclosures In August 2011, a package of five standards on consolidation, joint arrangements, associates and disclosures was issued comprising AASB 10
‘Consolidated Financial Statements’, AASB 11 ‘Joint Arrangements’, AASB 12 ‘Disclosure of Interests in Other Entities’, AASB 127 (as revised in 2011) ‘Separate Financial Statements’ and AASB 128 (as revised in 2011) ‘Investments in Associates and Joint Ventures’. Subsequent to the issue of these standards, amendments to AASB 10, AASB 11 and AASB 12 were issued to clarify
certain transitional guidance on the first-time application of the standards. In the current year, the Group has applied for the first time AASB 10, AASB 12 and AASB 128 (as revised in 2011) together with the amendments to AASB 10 and AASB 12 regarding the transitional guidance. AASB 11 (as revised in 2011) is not applicable to the Group. The impact of the application of these standards is set out below. AASB 10 ‘Consolidated Financial Statements’ and AASB 2011-7 ‘Amendments to Australian Accounting Standards arising from the consolidation and Joint Arrangements standards’ AASB 10 replaces the parts of AASB 127 ‘Consolidated and Separate Financial Statements’ that deal with consolidated financial statements and Interpretation 112 ‘Consolidation –Special
Purpose Entities’. AASB 10 changes the definition of control such that an investor controls an investee when a) it has power over an investee, b) it is exposed, or has rights, to variable returns from its involvement with the investee, and c) has the ability to use its power to affect its returns. All three of these criteria must be met for an investor to have control over an investee. Previously, control was defined as the power to govern the financial and operating policies of an entity so as to obtain benefits from its activities. Additional guidance has been included in AASB 10 to explain when an investor has control over an investee. This is relevant to the Group’s ownership of Salmon Enterprises of Tasmania Pty Ltd (Saltas). The Board has concluded that despite the ownership interest and voting rights held by the consolidated entity, the consolidated entity does not control Saltas. AASB 12 ‘Disclosure of Interests in Other Entities’ and AASB 2011-7 ‘Amendments to Australian Accounting Standards arising from the consolidation and Joint Arrangements standards’ AASB 12 is a new disclosure standard and is applicable to entities that have interests in subsidiaries, joint arrangements, associates and/or unconsolidated structured entities. In general, the application of AASB 12 has resulted in more extensive disclosures in the consolidated financial statements (please see note 12 for details). AASB 13 ‘Fair Value Measurement’ and AASB 2011-8 ‘Amendments to Australian Accounting Standards arising from AASB 13’ The Group has applied AASB 13 for the first time in the current year. AASB 13 establishes a single source of guidance for fair value measurements and disclosures about fair value measurements. The scope of AASB 13 is broad; the fair value measurement requirements of AASB 13 apply to both financial instrument items and non-financial instrument items for which other AASBs require or permit fair value measurements and disclosures
about fair value measurements, except for share-based payment transactions that are within the scope of AASB 2 ‘Share-based Payment’, leasing transactions that are within the scope of AASB 117 ‘Leases’, and measurements that have some similarities to fair value but are not fair value (e.g. net realisable value for the purposes of measuring inventories or value in use for impairment assessment purposes).
For
per
sona
l use
onl
y
NOTES TO THE FINANCIAL STATEMENTS for the year ended 30 June 2014 cont. Tassal Group Limited and Controlled Entities
54
AASB 13 defines fair value as the price that would be received to sell an asset or paid to transfer a liability in an orderly transaction in the principal (or most advantageous) market at the measurement date under current market conditions. Fair value under AASB 13 is an exit price regardless of whether that price is directly observable or estimated using another valuation technique. Also, AASB 13 includes extensive disclosure requirements. AASB 13 requires prospective application from 1 July 2013. In addition, specific transitional provisions were given to entities such that they need not apply the disclosure requirements set out in the Standard in comparative information provided for periods before the initial application of the Standard. In accordance with these
transitional provisions, the Group has not made any new disclosures required by AASB 13 for the 2013 comparative period (please see notes 9, 14, and 39 for the 2014 disclosures). Other than the additional disclosures, the application of AASB 13 does not have any material impact on the amounts recognised in the consolidated financial statements. AASB 119 ‘Employee Benefits (2011)’ and AASB 2011-10 ‘Amendments to Australian Accounting Standards arising from AASB 119 (2011)’ This is an amended version of AASB 119 ‘Employee Benefits’ with revised requirements for pensions and other post-retirement benefits, termination benefits and other changes.
(ii) Standards and Interpretations in issue not
yet adopted
At the date of authorisation of the financial statements, the Standards and Interpretations listed below were in issue but not yet effective. The impact of these standards and interpretations has not yet been assessed. AASB 9 ‘Financial Instruments’ and the relevant amending standards Effective for annual reporting periods beginning on or after 1 January 2018 and expected to be initially applied in the financial year ending 30 June 2019.
AASB 1031 ‘Materiality’ (2013) Effective for annual reporting periods beginning on or after 1 January 2014 and expected to be initially applied in the financial year ending 30 June 2015. AASB 2013-4 ‘Amendments to Australian Accounting Standards – Novation of Derivatives and Continuation of Hedge Accounting’ Effective for annual reporting periods beginning on or after 1 January 2014 and expected to be initially applied in the financial year ending 30 June 2015. AASB 2013-9 ‘Amendments to Australian Accounting Standards – Conceptual Framework, Materiality and Financial Instruments’ Effective for annual reporting periods beginning on or after 1 January 2014 and expected to be initially applied in the financial year ending 30 June 2015
Clarification of Acceptable Methods of Depreciation and Amortisation (Amendments to IAS 16 and IAS 38). Effective for annual reporting periods beginning on or after 1 January 2016 and expected to be initially applied in the financial year ending 30 June 2017. IFRS 15 ‘Revenue from Contracts with Customers’ Effective for annual reporting periods beginning on or after 1 January 2017 and expected to be initially applied in the financial year ending 30 June 2018.
Significant Accounting Policies
The following significant accounting policies have been adopted in the preparation and presentation of the
Annual Financial Report:
(a) Basis of Consolidation
The consolidated financial statements are prepared by combining the financial statements of all the entities that comprise the consolidated entity, being the Company (the parent entity) and its subsidiaries as defined in Accounting Standard AASB 10 ‘Consolidated Financial Statements’ (the Group). Control is achieved when the company:
• has power over the investee;
• is exposed, or has rights, to variable returns from its involvement with the investee; and
• has the ability to use its power to affect its returns.
Consistent accounting policies are employed in the preparation and presentation of the consolidated financial statements.
On acquisition, the assets, liabilities and contingent liabilities of a subsidiary are measured at their fair values at the date of acquisition. Any excess of the cost of acquisition over the fair values of the identifiable net assets acquired is recognised as goodwill. If, after reassessment, the fair values of the identifiable net assets acquired exceeds the cost of acquisition, the difference is credited to profit or loss in the period of acquisition.
The interest of minority shareholders is stated at the minority’s proportion of the fair values of the assets and liabilities recognised.
The consolidated financial statements include the information and results of each subsidiary from the date on which the Company obtains control and until such time as the Company ceases to control such entities. In preparing the consolidated financial statements, all intercompany balances and transactions, and unrealised profits arising within the consolidated entity are eliminated in full.
(b) Borrowings
Borrowings are recorded initially at fair value, net of transaction costs.
Subsequent to initial recognition, borrowings are measured at amortised cost with any difference
between the initial recognised amount and the
For
per
sona
l use
onl
y

NOTES TO THE FINANCIAL STATEMENTS for the year ended 30 June 2014 cont. Tassal Group Limited and Controlled Entities
55
redemption value being recognised in profit and loss over the period of the borrowing using the effective interest rate method.
(c) Borrowing Costs
Borrowing costs directly attributable to the acquisition, construction or production of qualifying assets, which are assets that necessarily take a substantial period of time to get ready for their intended use or sale, are added to the cost of those assets, until such time as the assets are substantially ready for their intended use or sale. Investment income earned on the temporary investment of specific borrowings pending their expenditure on qualifying assets is deducted from the borrowing costs eligible for capitalisation.
All other borrowing costs are recognised in profit or loss in the period in which they are incurred.
(d) Cash and Cash Equivalents
Cash and cash equivalents comprise cash on hand, cash in banks and investments in money market instruments, net of outstanding bank overdrafts. Bank overdrafts are shown within borrowings in current liabilities in the statement of financial position.
(e) Derivative Financial Instruments
The consolidated entity uses derivative financial instruments, principally foreign exchange and interest rate related, to reduce their exposure to movements in foreign exchange rate and interest rate movements. Further details of derivative financial instruments are disclosed in note 39 to the financial statements.
The consolidated entity has adopted certain principles in relation to derivative financial instruments:
it does not trade in a derivative that is not used in the hedging of an underlying business exposure of the consolidated entity; and
derivatives acquired must be able to be recorded on the consolidated entity’s treasury management systems, which contain appropriate internal controls.
The Company and consolidated entity follow the same credit policies, legal processes, monitoring of market and operational risks in the area of derivative financial instruments, as they do in relation to financial assets and liabilities on the statement of financial position, where internal controls operate.
On a continuing basis, the consolidated entity monitors its future exposures and on some occasions hedges all or part of these exposures. The transactions which may be covered are future foreign exchange requirements and interest rate positions.
These exposures are then monitored and may be modified from time to time. The foreign exchange hedge instruments are transacted on a commitment basis and hedge operational transactions the consolidated entity expects to occur in this time frame. Interest rate derivative instruments can be for periods up to 3 – 5 years
as the critical terms of the instruments are matched to the life of the borrowings.
Derivatives are initially recognised at fair value on the date a derivative contract is entered into and are subsequently re-measured to their fair value at each reporting date. The resulting gain or loss is recognised in profit or loss immediately unless the derivative is designated and effective as a hedging instrument, in which event, the timing of the recognition in profit or loss depends on the nature of the hedge relationship.
The consolidated entity designates certain derivatives as either hedges of the fair value of recognised assets or liabilities or firm commitments (fair value hedges) or hedges of highly probable forecast transactions (cash flow hedges).
Fair value hedge
Changes in the fair value of derivatives that are
designated and qualify as fair value hedges are recorded in profit or loss immediately, together with any changes in the fair value of the hedged asset or liability that is attributable to the hedged risk.
Hedge accounting is discontinued when the hedge instrument expires or is sold, terminated, exercised, or no longer qualifies for hedge accounting. The adjustment to the carrying amount of the hedged item arising from the hedged risk is amortised to profit or loss from that date.
Cash flow hedge
The effective portion of changes in the fair value of derivatives that are designated and qualify as cash flow hedges are deferred in equity. The gain or loss relating to the ineffective portion is recognised immediately in profit or loss as part of other expenses or other income.
Amounts deferred in equity are recycled in profit or loss in the periods when the hedged item is recognised in profit or loss. However, when the forecast transaction that is hedged results in the recognition of a non-financial asset or a non-financial liability, the gains and losses previously deferred in equity are transferred from equity and included in the initial measurement of the cost of the asset or liability.
Hedge accounting is discontinued when the hedging instrument expires or is sold, terminated, or exercised, or no longer qualifies for hedge accounting. At that time, any cumulative gain or loss deferred in equity at that time remains in equity and is recognised when the forecast transaction is ultimately recognised in profit or loss. When a forecast transaction is no longer expected to occur, the cumulative gain or loss that was deferred in equity is recognised immediately in profit or loss.
(f) Employee Benefits
Provision is made for benefits accruing to employees in respect of wages and salaries, annual leave and long service leave when it is probable that settlement will be required and they are capable of being measured reliably.
Provisions made in respect of employee benefits expected to be settled within 12 months, are
For
per
sona
l use
onl
y

NOTES TO THE FINANCIAL STATEMENTS for the year ended 30 June 2014 cont. Tassal Group Limited and Controlled Entities
56
measured at their nominal values using the remuneration rate expected to apply at the time of settlement.
Provisions made in respect of employee benefits which are not expected to be settled within 12 months are measured as the present value of the estimated future cash outflows to be made by the consolidated entity in respect of services provided by employees up to reporting date.
Contributions to defined contribution superannuation plans are expensed when incurred.
(g) Financial Assets
Investments are recognised and derecognised on trade date where purchase or sale of an investment is under a contract whose terms require delivery of the investment within the timeframe established by the market concerned, and are initially measured at fair value, net of
transaction costs.
Subsequent to initial recognition, investments in subsidiaries are measured at cost in the parent accounts. Subsequent to initial recognition, investments in associates are accounted for under the equity method in the consolidated financial statements and the cost method in the Company financial statements.
Other financial assets are classified into the following specified categories: financial assets ‘at fair value through profit or loss’, ‘held-to-maturity’ investments and ‘loans and receivables’. The classification depends on the nature and purpose of the financial assets and is determined at the time of initial recognition.
Held-to-maturity investments
Bills of exchange and debentures are recorded at amortised cost using the effective interest method less impairment, with revenue recognised on an effective yield basis.
The effective interest method is a method of calculating the amortised cost of a financial asset and of allocating interest income over the relevant period. The effective interest rate is the rate that exactly discounts estimated future cash receipts through the expected life of the financial asset, or, where appropriate, a shorter period.
Loans and receivables
Trade receivables, loans, and other receivables are recorded at amortised cost using the effective interest method less impairment.
Impairment of financial assets
Financial assets, other than those at fair value through profit or loss, are assessed for indicators of impairment at each balance date. Financial assets are impaired where there is objective evidence that as a result of one or more events that occurred after the initial recognition of the financial asset the estimated future cash flows of the investment have been impacted.
Derecognition of financial assets
The Group derecognises a financial asset only when the contractual rights to the cash flows from the asset expire, or it transfers the financial asset and substantially all the risks and rewards
of ownership of the asset to another entity. If the Group neither transfers nor retains substantially all the risks and rewards of ownership and continues to control the transferred asset, the Group recognises its retained interest in the asset and an associated liability for amounts it may have to pay. If the Group retains substantially all the risks and rewards of ownership of a transferred financial asset, the Group continues to recognise the financial asset and also recognises a collateralised borrowing for the proceeds received.
(h) Financial Instruments Issued by the Consolidated Entity
Debt and equity instruments
Debt and equity instruments are classified as either liabilities or as equity in accordance with the substance of the contractual arrangement.
An equity instrument is any contract that evidences a residual interest in the assets of an entity after deducting all of its liabilities. Equity instruments issued by the Company are recorded at the proceeds received, net of direct issue costs.
Financial guarantee contract liabilities
Financial guarantee contract liabilities are measured initially at their fair values and subsequently at the higher of the amount recognised as a provision and the amount initially recognised less cumulative amortisation in accordance with the revenue recognition policies described in note 1(v).
Financial liabilities
Financial liabilities are classified as either financial liabilities “at fair value through the profit or loss” or other financial liabilities.
Transaction costs on the issue of equity instruments
Transaction costs arising on the issue of equity instruments are recognised directly in equity as a reduction of the proceeds of the equity instruments to which the costs relate. Transaction costs are the costs that are incurred directly in connection with the issue of those equity instruments and which would not have been incurred had those instruments not been issued.
Interest and dividends
Interest and dividends are classified as expenses or as distributions of profit consistent with the statement of financial position classification of the related debt or equity instruments or component parts of compound instruments.
(i) Foreign Currency
Foreign currency transactions
All foreign currency transactions during the period are brought to account using the exchange rate in effect at the date of the transaction. Foreign currency monetary items at reporting date are translated at the exchange rate existing at reporting date. Non-monetary assets and liabilities carried at fair value that are denominated in foreign currencies are translated
For
per
sona
l use
onl
y

NOTES TO THE FINANCIAL STATEMENTS for the year ended 30 June 2014 cont. Tassal Group Limited and Controlled Entities
57
at the rates prevailing at the date when the fair value was determined.
Exchange differences are recognised in profit or loss in the period in which they arise except that:
exchange differences which relate to assets under construction for future productive use are included in the cost of those assets where they are regarded as an adjustment to interest costs on foreign currency borrowings; and
exchange differences on transactions entered into in order to hedge certain foreign currency risks (refer to note 1(e)).
(j) Goods and Service Tax
Revenues, expenses and assets are recognised net of the amount of goods and services tax (GST), except:
where the amount of GST incurred is not
recoverable from the taxation authority, it is recognised as part of the cost of acquisition of an asset or as part of an item of expense; or
for receivables and payables which are recognised inclusive of GST.
The net amount of GST recoverable from, or payable to, the taxation authority is included as part of receivables or payables.
Cash flows are included in the statement of cash flows on a gross basis. The GST component of cash flows arising from investing and financing activities which is recoverable from, or payable to, the taxation authority is classified as operating cash flows.
(k) Goodwill
Goodwill acquired in a business combination is initially measured at its cost, being the excess of the cost of the business combination over the acquirer’s interest in the net fair value of the identifiable assets, liabilities and contingent liabilities recognised. Goodwill is subsequently measured at its cost less any impairment losses.
For the purpose of impairment testing, goodwill is allocated to each of the Group’s cash generating units (CGUs) (or groups of CGUs) expected to benefit from the synergies of the business combination. CGUs (or groups of CGUs) to which goodwill has been allocated are tested for impairment annually, or more frequently if events or changes in circumstances indicated that goodwill might be impaired.
If the recoverable amount of the CGU (or group of CGUs) is less than the carrying amount of the CGU (or groups of CGUs), the impairment loss is allocated first to reduce the carrying amount of any goodwill allocated to the CGU (or groups of CGUs) and then to the other assets in the CGU (or groups of CGUs). An impairment loss recognised for goodwill is recognised immediately in profit or loss and is not reversed in a subsequent period.
On disposal of an operation within a CGU, the attributable amount of goodwill is included in the determination of the profit or loss on disposal of
the operation.
(l) Government Grants
Government grants are assistance by the government in the form of transfers of resources to the consolidated entity in return for past or future compliance with certain conditions relating to the operating activities of the entity. Government grants include government assistance where there are no conditions specifically relating to the operating activities of the consolidated entity other than the requirement to operate in certain regions or industry sectors.
Government grants are not recognised until there is reasonable assurance that the consolidated entity will comply with the conditions attaching to them and the grants will be received.
Government grants whose primary condition is that the consolidated entity should purchase,
construct or otherwise acquire long-term assets are recognised as deferred income in the statement of financial position and recognised as income on a systematic and rational basis over the useful lives of the related assets.
Other government grants are recognised as income over the periods necessary to match them with the related costs which they are intended to compensate, on a systematic basis. Government grants that are receivable as compensation for expenses or losses already incurred or for the purpose of giving immediate financial support to the consolidated entity with no future related costs are recognised as income of the period in which it becomes receivable.
(m) Impairment of Long-lived Assets Excluding Goodwill
At each reporting date, the consolidated entity reviews the carrying amounts of its assets to determine whether there is any indication that those assets have suffered an impairment loss. If any such indication exists, the recoverable amount of the asset is estimated in order to determine the extent of the impairment loss (if any). Where the asset does not generate cash flows that are independent from other assets, the consolidated entity estimates the recoverable amount of the cash-generating unit to which the asset belongs.
Intangible assets with indefinite useful lives and intangible assets not yet available for use are tested for impairment annually and whenever there is an indication that the asset may be impaired.
Recoverable amount is the higher of fair value less costs to sell and value in use. In assessing value in use, the estimated future cash flows are discounted to their present value using a pre-tax discount rate that reflects current market assessments of the time value of money and the risks specific to the asset for which the estimates of future cash flows have not been adjusted.
If the recoverable amount of an asset (or cash-generating unit) is estimated to be less than its carrying amount, the carrying amount of the
asset (cash-generating unit) is reduced to its recoverable amount. An impairment loss is recognised in profit or loss immediately unless the relevant asset is carried at fair value, in
For
per
sona
l use
onl
y

NOTES TO THE FINANCIAL STATEMENTS for the year ended 30 June 2014 cont. Tassal Group Limited and Controlled Entities
58
which case the impairment loss is treated as a revaluation decrease. Refer also note 1(t).
Where an impairment loss subsequently reverses, the carrying amount of the asset (cash-generating unit) is increased to the revised estimate of its recoverable amount, but only to the extent that the increased carrying amount does not exceed the carrying amount that would have been determined had no impairment loss been recognised for the asset (cash-generating unit) in prior years. A reversal of an impairment loss is recognised in profit or loss immediately unless the relevant asset is carried at fair value, in which case the impairment loss is treated as a revaluation decrease. Refer also note 1(t).
(n) Income Tax
Current tax
Current tax is calculated by reference to the
amount of income taxes payable or recoverable in respect of the taxable profit or tax loss for the period. It is calculated using tax rates and tax laws that have been enacted or substantively enacted by reporting date. Current tax for current and prior periods is recognised as a liability (or asset) to the extent that it is unpaid (or refundable).
Deferred tax
Deferred tax is accounted for using the comprehensive balance sheet liability method in respect of temporary differences arising from differences between the carrying amount of assets and liabilities in the financial statements and the corresponding tax base of those items. The tax base of an asset or liability is the amount attributed to that asset or liability for tax purposes.
In principle, deferred tax liabilities are recognised for all taxable temporary differences. Deferred tax assets are recognised to the extent that it is probable that sufficient taxable amounts will be available against which deductible temporary differences or unused tax losses and tax offsets can be utilised. However, deferred tax assets and liabilities are not recognised if the temporary differences giving rise to them arise from the initial recognition of assets and liabilities (other than as a result of a business combination) which affects neither taxable income nor accounting profit. Furthermore, a deferred tax liability is not recognised in relation to taxable temporary differences arising from goodwill.
Deferred tax liabilities are recognised for taxable temporary differences arising on investments in subsidiaries, branches, associates and joint ventures except where the consolidated entity is able to control the reversal of the temporary differences and it is probable that the temporary differences will not reverse in the foreseeable future. Deferred tax assets arising from deductible temporary differences associated with these investments and interests are only recognised to the extent that it is probable that
there will be sufficient taxable profits against which to utilise the benefits of the temporary differences and they are expected to reverse in the foreseeable future.
Deferred tax assets and liabilities are measured at the tax rates that are expected to apply to the period(s) when the asset and liability giving rise to them are realised or settled, based on tax rates (and tax laws) that have been enacted or substantively enacted by reporting date. The measurement of deferred tax liabilities and assets reflects the tax consequences that would follow from the manner in which the consolidated entity expects, at the reporting date, to recover or settle the carrying amount of its assets and liabilities.
Deferred tax assets and liabilities are offset when they relate to income taxes levied by the same taxation authority and the Company/consolidated entity intends to settle its current tax assets and liabilities on a net basis.
Current and deferred tax for the period
Current and deferred tax is recognised as an expense or income in the income statement, except when it relates to items credited or debited directly to equity, in which case the deferred tax is also recognised directly in equity, or where it arises from the initial accounting for a business combination, in which case it is taken into account in the determination of goodwill or excess.
Tax consolidation
The Company and all its wholly-owned Australian resident entities are part of a tax-consolidated group under Australian taxation law. Tassal Group Limited is the head entity in the tax-consolidated group.
Tax expense/income, deferred tax liabilities and deferred tax assets arising from temporary differences of the members of the tax-consolidated group are recognised in the separate financial statements of the members of the tax-consolidated group using the ‘separate taxpayer within group’ approach. Current tax liabilities and assets and deferred tax assets arising from unused tax losses and tax credits of the members of the tax-consolidated group are recognised by the Company (as head entity in the tax-consolidated group).
Due to the existence of a tax funding arrangement between the entities in the tax-consolidated group, amounts are recognised as payable to or receivable by the Company and each member of the group in relation to the tax contribution amounts paid or payable between the parent entity and the other members of the tax-consolidated group in accordance with the arrangement. Further information about the tax funding arrangement is detailed in note 4 to the financial statements. Where the tax contribution amount recognised by each member of the tax-consolidated group for a particular period is different to the aggregate of the current tax credits in respect of that period, the difference is recognised as a contribution from (or distribution to) equity participants.
(o) Intangible Assets
Research and development costs
Expenditure on research activities is recognised as an expense in the period in which it is
For
per
sona
l use
onl
y

NOTES TO THE FINANCIAL STATEMENTS for the year ended 30 June 2014 cont. Tassal Group Limited and Controlled Entities
59
incurred. Where no internally-generated intangible asset can be recognised, development expenditure is recognised as an expense in the period as incurred.
An intangible asset arising from development (or from the development phase of an internal project) is recognised if, and only if, all of the following are demonstrated:
the technical feasibility of completing the intangible asset so that it will be available for use or sale;
the intention to complete the intangible asset and use or sell it;
the ability to use or sell the intangible asset;
how the intangible asset will generate probable future economic benefits;
the availability of adequate technical, financial and other resources to complete
the development and to use or sell the intangible asset; and
the ability to measure reliably the expenditure attributable to the intangible asset during its development.
The amount initially recognised for internally-generated intangible assets is the sum of the expenditure incurred from the date when the intangible assets first meets the recognition criteria listed above.
Subsequent to initial recognition, internally-generated intangible assets are reported at cost less accumulated amortisation and accumulated impairment losses, on the same basis as intangible assets acquired separately.
Brand names
Brand names recognised by the Company have an indefinite useful life and are not amortised. Each period, the useful life of this asset is reviewed to determine whether events and circumstances continue to support an indefinite useful life assessment for the asset. Such assets are tested for impairment in accordance with the policy stated in note 1(m).
Intangible assets acquired in a business combination
Intangible assets acquired in a business combination are identified and recognised separately from goodwill where they satisfy the definition of an intangible asset and their fair values can be measured reliably.
Subsequent to initial recognition, intangible assets acquired in a business combination are reported at cost less accumulated amortisation and accumulated impairment losses, on the same basis as intangible assets acquired separately.
(p) Inventories Agricultural produce harvested from an entity’s biological assets shall be measured at its fair value less costs to sell at the point of harvest. Such measurement is the cost at that date when applying AASB 102 ‘Inventories’.
Other inventories are valued at the lower of cost and net realisable value. Costs, including an appropriate portion of fixed and variable overhead expenses, are assigned to inventory on hand by the method most appropriate to each particular class of inventory, with the majority being valued on a first in first out or weighted average cost basis. Net realisable value represents the estimated selling price less all estimated costs of completion and costs necessary to make the sale.
(q) Leased Assets
Leases are classified as finance leases whenever the terms of the lease transfer substantially all the risks and rewards of ownership to the lessee. All other leases are classified as operating leases.
Consolidated entity as lessee
Assets held under finance leases are initially
recognised at their fair value or, if lower, at amounts equal to the present value of the minimum lease payments, each determined at the inception of the lease. The corresponding liability to the lessor is included in the statement of financial position as a finance lease obligation.
Lease payments are apportioned between finance charges and reduction of the lease obligation so as to achieve a constant rate of interest on the remaining balance of the liability. Finance charges are charged directly against income, unless they are directly attributable to qualifying assets, in which case they are capitalised in accordance with the consolidated entity’s general policy on borrowing costs. Refer to note 1(c).
Finance leased assets are amortised on a straight line basis over the estimated useful life of the asset.
Operating lease payments are recognised as an expense on a straight-line basis over the lease term, except where another systematic basis is more representative of the time pattern in which economic benefits from the leased asset are consumed.
Lease incentives
In the event that lease incentives are received to enter into operating leases, such incentives are recognised as a liability. The aggregate benefits of incentives are recognised as a reduction of rental expense on a straight-line basis, except where another systematic basis is more representative of the time pattern in which economic benefits from the leased asset are consumed.
(r) Payables
Trade payables and other accounts payable are recognised when the consolidated entity becomes obliged to make future payments resulting from the purchase of goods and services.
(s) Property, Plant and Equipment
Land and buildings are measured at fair value. Fair value is determined on the basis of an independent valuation prepared by external
experts and in conformance with Australian
For
per
sona
l use
onl
y

NOTES TO THE FINANCIAL STATEMENTS for the year ended 30 June 2014 cont. Tassal Group Limited and Controlled Entities
60
Valuation Standards. The fair values are recognised in the financial statements of the consolidated entity, and are reviewed at the end of each reporting period to ensure that the carrying value of land and buildings is not materially different from their fair values.
On 19 June 2013, an independent valuation of the consolidated entity’s freehold land and freehold and leasehold buildings was performed by Mr M J Page [B.Bus.(Property)AAPI, CPV] to determine the fair value of land and buildings. Specialised land and buildings have been valued based on the depreciated replacement cost method. The valuation conforms to Australian Valuation Standards.
Any revaluation increase arising on the revaluation of land and buildings is credited to a revaluation reserve, except to the extent that it reverses a revaluation decrease for the same
asset previously recognised as an expense in profit or loss, in which case the increase is credited to the income statement to the extent of the decrease previously charged. A decrease in carrying amount arising on the revaluation of land and buildings is charged as an expense in profit or loss to the extent that it exceeds the balance, if any, held in the revaluation reserve relating to a previous revaluation of that asset.
Depreciation on revalued buildings is charged to profit or loss. On the subsequent sale or retirement of a revalued property, the attributable revaluation surplus remaining in the revaluation reserve, net of any related taxes, is transferred directly to retained earnings.
Plant and equipment and equipment under finance lease are stated at cost less accumulated depreciation and impairment. Cost includes expenditure that is directly attributable to the acquisition of the item. In the event that settlement of all or part of the purchase consideration is deferred, cost is determined by discounting the amounts payable in the future to their present value as at the date of acquisition.
Depreciation is provided on property, plant and equipment, including freehold buildings but excluding land. Depreciation is calculated on a straight line basis so as to write off the net cost or other re-valued amount of each asset over its expected useful life to its estimated residual value. The estimated useful lives, residual values and depreciation method is reviewed at the end of each annual reporting period, with the effect of any change recognised on a prospective basis.
Assets held under finance leases are depreciated over their expected useful lives on the same basis as owned assets or, where shorter, the term of the relevant lease.
The gain or loss arising on disposal or retirement of an item of property, plant and equipment is determined as the difference between the sales proceeds and the carrying amount of the asset and is recognised in profit or loss.
The following estimated useful lives are used in the calculation of depreciation:
Buildings 25 – 50 years
Plant and equipment 2 – 20 years
Equipment under finance lease 2 – 20 years
(t) Provisions
Provisions are recognised when the consolidated entity has a present obligation (legal or constructive) as a result of a past event, it is probable that the consolidated entity will be required to settle the obligation, and a reliable estimate can be made of the amount of the obligation.
The amount recognised as a provision is the best estimate of the consideration required to settle the present obligation at reporting date, taking into account the risks and uncertainties surrounding the obligation. Where a provision is measured using the cash flows estimated to settle the present obligation, its carrying amount is the present value of those cash flows.
When some or all of the economic benefits
required to settle a provision are expected to be recovered from a third party, the receivable is recognised as an asset if it is virtually certain that recovery will be received and the amount of the receivable can be measured reliably.
Onerous Contracts
Present obligations arising under onerous contracts are recognised and measured as a provision. An onerous contract is considered to exist where the consolidated entity has a contract under which the unavoidable costs of meeting the obligations under the contract exceed the economic benefits expected to be received under it.
Restructurings
A restructuring provision is recognised when the consolidated entity has developed a detailed formal plan for the restructuring and has raised a valid expectation in those affected that it will carry out the restructuring by starting to implement the plan or announcing its main features to those affected by it. The measurement of a restructuring provision includes only the direct expenditures arising from the restructuring, which are those amounts that are both necessarily entailed by the restructuring and not associated with the ongoing activities of the entity.
Dividends
A provision is recognised for dividends when they have been approved at the reporting date.
(u) Revenue Recognition
Sale of goods
Revenue from the sale of goods is recognised when all the following conditions are satisfied:
the consolidated entity has transferred to the buyer the significant risks and rewards of ownership of the goods;
the consolidated entity retains neither continuing managerial involvement to the degree usually associated with ownership nor effective control over the goods sold;
the amount of revenue can be measured reliably;
For
per
sona
l use
onl
y

NOTES TO THE FINANCIAL STATEMENTS for the year ended 30 June 2014 cont. Tassal Group Limited and Controlled Entities
61
it is probable that the economic benefits associated with the transaction will flow to the entity; and
the costs incurred or to be incurred in respect of the transaction can be measured reliably.
Dividend and interest revenue
Dividend revenue from investments is recognised when the shareholder’s right to receive payment has been established.
Interest revenue is accrued on a time basis, by reference to the principal outstanding and at the effective interest rate applicable, which is the rate that exactly discounts estimated future cash receipts through the expected life of the financial asset to that asset’s net carrying amount.
(v) Share-based Payments
Equity-settled share-based payments with employees are measured at the fair value of the
equity instrument at the grant date. Fair value is measured by use of a Monte Carlo simulation model, taking into account the terms and conditions upon which the equity-settled share-based payment were granted. The expected life used in the model has been adjusted, based on management’s best estimate, for the effects of non-transferability, exercise restrictions, and behavioral considerations. Further details on how the fair value of equity-settled share-based transactions has been determined can be found in note 5 (c) (i) to the financial statements.
The fair value determined at the grant date of the equity-settled share-based payments is expensed on a straight-line basis over the vesting period, based on the consolidated entity’s estimate of shares that will eventually vest.
At each reporting date, the Group revises its estimates of the number of equity instruments expected to vest. The impact of the revision of the original estimates, if any, is recognised in profit or loss over the remaining vesting period, with corresponding adjustment to the equity-settled employee benefits reserve.
(w) Biological Assets – Live Finfish
Live finfish assets are valued at fair value less estimated point of sale costs. This fair value is the amount which could be expected to be received from the disposal of the asset in an active and liquid market less the costs expected to be incurred in realising the proceeds of such disposal. The net increment / (decrement) in the fair value of finfish is recognised as income / (expense) in the reporting period.
Where an active and liquid market is not available, fair value is determined using the present value of expected net cash flows from the asset discounted at a current market-determined rate. The net cash flows are reduced for harvesting costs and freight costs to market. Further the expected net cash flows take into account the expected weight of the fish at harvest, expected costs and sale prices, and incorporates expected possible variations in the
net cash flows.
The change in estimated fair value is recognised
in the income statement and is classified separately.
Fair value has been determined in accordance with Directors’ valuation.
Historic cost is used as an estimate of fair value where little or no biological transformation has taken place.
(x) Financial Risk Management Strategies Relating to Agricultural Activities
The consolidated entity has a comprehensive risk management strategy in place to monitor and oversee its agricultural activities. The policy framework is broad, with risk management addressed via marine and hatchery site geographical diversification, conservative finfish husbandry practices, experienced management with international expertise and extensive investment in infrastructure improvements and automation.
(y) Business Combinations
Acquisitions of subsidiaries and businesses are accounted for using the purchase method. The cost of the business combination is measured as the aggregate of the fair values (at the date of exchange) of assets given, liabilities incurred or assumed, and equity instruments issued by the consolidated entity in exchange for control of the acquiree, plus any costs directly attributable to the business combination. The acquiree’s identifiable assets, liabilities and contingent liabilities that meet the conditions for recognition under AASB 3 ‘Business Combinations’ are recognised at their fair values at the acquisition date, except for non-current assets (or disposal groups) that are classified as held for sale in accordance with AASB 5 ‘Non-current Assets Held for Sale and Discontinued Operations’, which are recognised and measured at fair value less costs to sell.
Goodwill arising on acquisition is recognised as an asset and initially measured at cost, being the excess of the cost of the business combination over the consolidated entity’s interest in the net fair value of the identifiable assets, liabilities and contingent liabilities recognised. If, after reassessment, the consolidated entity’s interest in the net fair value of the acquiree’s identifiable assets, liabilities and contingent liabilities exceeds the cost of the business combination, the excess is recognised immediately in profit or loss.
If relevant, the interest of minority shareholders in the acquiree is initially measured at the minority’s proportion of the net fair value of the assets, liabilities and contingent liabilities recognised.
(z) Investments in Associates
An associate is an entity over which the Group has significant influence and that is neither a subsidiary nor an interest in a joint venture. Significant influence is the power to participate in the financial and operating policy decisions of the investee but is not control or joint control over those policies.
The result and assets and liabilities of associates are incorporated in these financial statements using the equity method of accounting, except
For
per
sona
l use
onl
y

NOTES TO THE FINANCIAL STATEMENTS for the year ended 30 June 2014 cont. Tassal Group Limited and Controlled Entities
62
when the investment is classified as held for sale, in which case it is accounted for in accordance with AASB 5 ‘Non-current Assets Held for Sale and Discontinued Operations’. Under the equity method, investments in associates are carried in the consolidated statement of financial position at cost as adjusted for post-acquisition changes in the Group’s share of the net assets of the associate, less any impairment in the value of individual investments.
Losses of an associate in excess of the Group’s interest in that associate (which includes any long-term interests that, in substance, form part of the Group’s net investment in the associate) are recognised only to the extent that the Group has incurred legal or constructive obligations or made payments on behalf of the associate.
Any excess of the cost of acquisition over the
Group’s share of the net fair value of the identifiable assets, liabilities and contingent liabilities of the associate recognised at the date of the acquisition is recognised as goodwill. The goodwill is included within the carrying amount of the investment and is assessed for impairment as part of that investment. Any excess of the Group’s share of the net fair value of the identifiable assets, liabilities and contingent liabilities over the cost of the acquisition, after reassessment, is recognised immediately in profit or loss. Where a Group entity transacts with an associate of the Group, profits and losses are eliminated to the extent of the Group’s interest in the relevant associate.
2. SUBSEQUENT EVENTS
Final Dividend Declared
On 19 August 2014, the Directors declared a final dividend of $8.790 million (6.00 cents per ordinary share) in respect of the financial year ended 30 June 2014. The final dividend will be 50% franked. The record date for determining entitlements to this final dividend is 12 September 2014. The final dividend will be paid on 29 September 2014.
The final dividend has not been recognised in this Annual Financial Report because the final
dividend was declared subsequent to 30 June 2014.
For
per
sona
l use
onl
y

NOTES TO THE FINANCIAL STATEMENTS for the year ended 30 June 2014 cont. Tassal Group Limited and Controlled Entities
63
Note
Consolidated
2014
Consolidated
2013
$’000 $’000
3.
PROFIT FOR THE YEAR BEFORE TAX
Profit from operations before income tax expense includes the following items of revenue and expense:
(a) Revenue
Revenue from the sale of goods 260,472 266,048
Rental revenue 10 19
Interest revenue 295 231
Total revenue 260,777 266,298
(b) Other income
Gain / (loss) on disposal of property, plant and equipment 1 8
Government grants received 2,064 2,738
Other 2,888 3,030
Total other income 4,953 5,776
For
per
sona
l use
onl
y

NOTES TO THE FINANCIAL STATEMENTS for the year ended 30 June 2014 cont. Tassal Group Limited and Controlled Entities
64
Consolidated
2014
Consolidated
2013
$’000 $’000
3.
PROFIT FOR THE YEAR BEFORE TAX (CONT.)
(c) Expenses
Depreciation of non-current assets 15,439 15,502
Amortisation of non-current assets 30 30
Total depreciation and amortisation 15,469 15,532
Interest - other entities 3,070 3,765
Finance lease charges 1,997 2,234
Total finance costs (i) 5,067 5,999
Notes:
(i) Additional finance costs of $0.955 million were included in the cost of
qualifying assets during the current year (2013: $0.985 million).
(ii) The weighted average capitalisation rate on funds borrowed generally is
4.717% (2013: 4.978%).
Employee benefits expense:
Share-based payments:
Equity settled share-based payments 737 290
Post employment benefits 3,660 3,373
Other employee benefits 46,017 44,836
Total employee benefits expense 50,414 48,499
Net bad and doubtful debts – other entities 94 61
Write-downs of inventories to net realisable value 899 643
Operating lease rental expenses 7,475 5,510
Research and development costs immediately expensed 308 332
For
per
sona
l use
onl
y
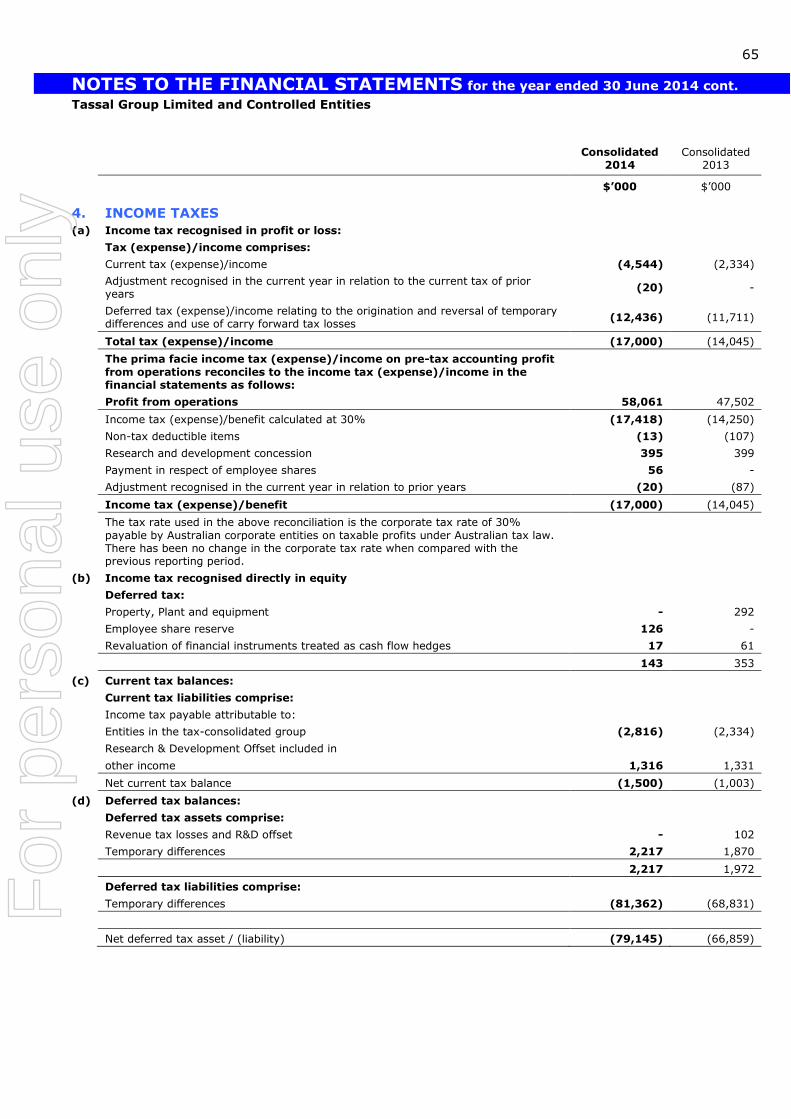
NOTES TO THE FINANCIAL STATEMENTS for the year ended 30 June 2014 cont. Tassal Group Limited and Controlled Entities
65
Consolidated
2014 Consolidated
2013
$’000 $’000
4. INCOME TAXES
(a) Income tax recognised in profit or loss:
Tax (expense)/income comprises:
Current tax (expense)/income (4,544) (2,334)
Adjustment recognised in the current year in relation to the current tax of prior years
(20) -
Deferred tax (expense)/income relating to the origination and reversal of temporary differences and use of carry forward tax losses
(12,436) (11,711)
Total tax (expense)/income (17,000) (14,045)
The prima facie income tax (expense)/income on pre-tax accounting profit
from operations reconciles to the income tax (expense)/income in the financial statements as follows:
Profit from operations 58,061 47,502
Income tax (expense)/benefit calculated at 30% (17,418) (14,250)
Non-tax deductible items (13) (107)
Research and development concession 395 399
Payment in respect of employee shares 56 -
Adjustment recognised in the current year in relation to prior years (20) (87)
Income tax (expense)/benefit (17,000) (14,045)
The tax rate used in the above reconciliation is the corporate tax rate of 30%
payable by Australian corporate entities on taxable profits under Australian tax law. There has been no change in the corporate tax rate when compared with the previous reporting period.
(b) Income tax recognised directly in equity
Deferred tax:
Property, Plant and equipment - 292
Employee share reserve 126 -
Revaluation of financial instruments treated as cash flow hedges 17 61
143 353
(c) Current tax balances:
Current tax liabilities comprise:
Income tax payable attributable to:
Entities in the tax-consolidated group (2,816) (2,334)
Research & Development Offset included in
other income 1,316 1,331
Net current tax balance (1,500) (1,003)
(d) Deferred tax balances:
Deferred tax assets comprise:
Revenue tax losses and R&D offset - 102
Temporary differences 2,217 1,870
2,217 1,972
Deferred tax liabilities comprise:
Temporary differences (81,362) (68,831)
Net deferred tax asset / (liability) (79,145) (66,859)
For
per
sona
l use
onl
y

NOTES TO THE FINANCIAL STATEMENTS for the year ended 30 June 2014 cont. Tassal Group Limited and Controlled Entities
66
4. INCOME TAXES (CONT.)
(d)
Deferred tax balances: (cont.)
Taxable and deductible temporary differences arise from the following:
Consolidated
Opening
balance Charged to
income
Charged to
equity Closing
balance
$’000 $’000 $’000 $’000
2014
Gross deferred tax liabilities:
Biological assets (47,400) (8,801) - (56,201)
Inventories (7,064) (1,745) - (8,809)
Property, plant and equipment (13,546) (1,894) - (15,440)
Investment in associates (462) (180) - (642)
Other financial assets (359) 89 - (270)
(68,831) (12,531) - (81,362)
Gross deferred tax assets:
Provisions 1,649 98 - 1,747
Other intangible assets 45 (9) - 36
Deferred income 2 (2) - -
Share issue expenses deductible over 5 years 15 44 - 59
Trade and other payables 98 73 - 171
Cash flow hedges 61 - 17 78
Other - - 126 126
1,870 204 143 2,217
(66,961) (12,327) 143 (79,145)
Reduction arising from:
Revenue tax losses and R&D offset 102 (102) - -
Net deferred tax asset/(liability) (66,859) (12,429) 143 (79,145)
2013
Gross deferred tax liabilities:
Biological assets (42,560) (4,840) - (47,400)
Inventories (8,297) 1,233 - (7,064)
Property, plant and equipment (11,453) (2,385) 292 (13,546)
Investment in associates (511) 49 - (462)
Other intangible assets (64) 64 - -
Other financial assets (1) (358) - (359)
(62,886) (6,237) 292 (68,831)
Gross deferred tax assets:
Provisions 1,534 115 - 1,649
Accruals 100 (100) - -
Other intangible assets - 45 - 45
Deferred income 345 (343) - 2
Share issue expenses deductible over 5 years 28 (13) - 15
Trade and other payables 64 34 - 98
Cash flow hedges - - 61 61
Investments in associates and jointly controlled
entities
269 (269) - -
2,340 (531) 61 1,870
(60,546) (6,768) 353 (66,961)
Reduction arising from:
Revenue tax losses and R&D offset 5,045 (4,943) - 102
Net deferred tax asset/(liability) (55,501) (11,711) 353 (66,859)
For
per
sona
l use
onl
y
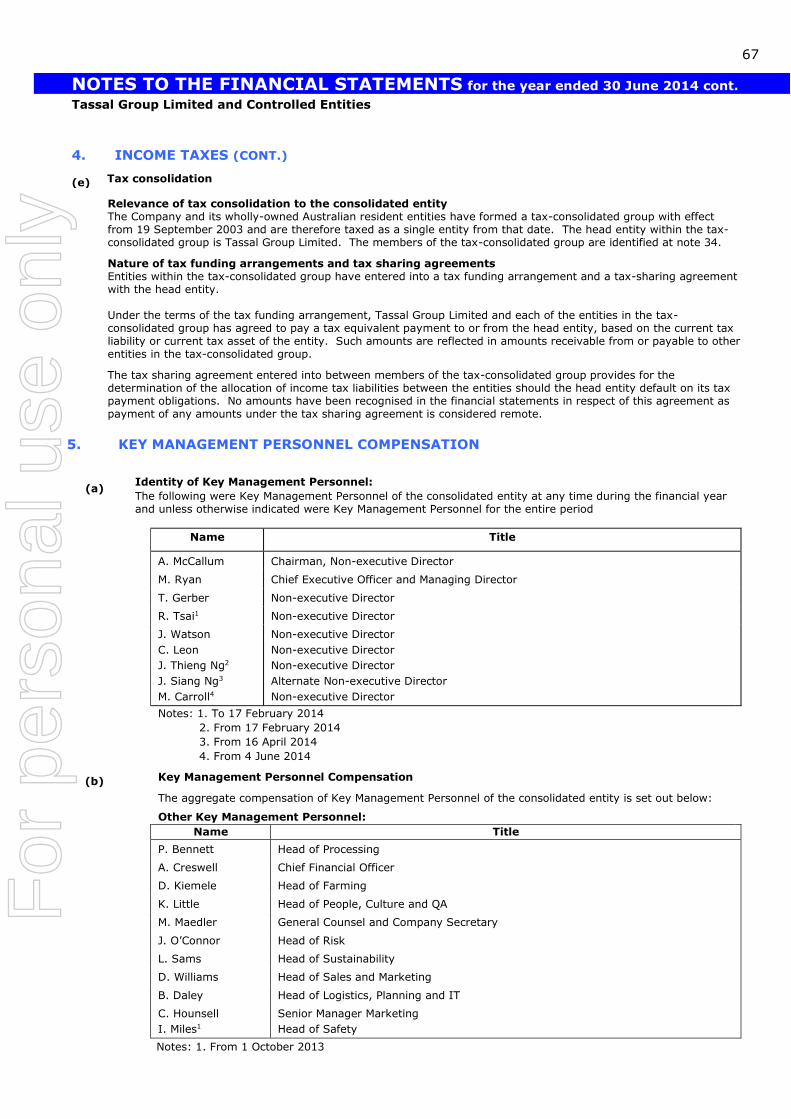
NOTES TO THE FINANCIAL STATEMENTS for the year ended 30 June 2014 cont. Tassal Group Limited and Controlled Entities
67
4. INCOME TAXES (CONT.) (e) Tax consolidation
Relevance of tax consolidation to the consolidated entity The Company and its wholly-owned Australian resident entities have formed a tax-consolidated group with effect from 19 September 2003 and are therefore taxed as a single entity from that date. The head entity within the tax-consolidated group is Tassal Group Limited. The members of the tax-consolidated group are identified at note 34.
Nature of tax funding arrangements and tax sharing agreements Entities within the tax-consolidated group have entered into a tax funding arrangement and a tax-sharing agreement with the head entity. Under the terms of the tax funding arrangement, Tassal Group Limited and each of the entities in the tax-consolidated group has agreed to pay a tax equivalent payment to or from the head entity, based on the current tax liability or current tax asset of the entity. Such amounts are reflected in amounts receivable from or payable to other entities in the tax-consolidated group.
The tax sharing agreement entered into between members of the tax-consolidated group provides for the determination of the allocation of income tax liabilities between the entities should the head entity default on its tax payment obligations. No amounts have been recognised in the financial statements in respect of this agreement as payment of any amounts under the tax sharing agreement is considered remote.
5. KEY MANAGEMENT PERSONNEL COMPENSATION
(a)
(b)
Identity of Key Management Personnel:
The following were Key Management Personnel of the consolidated entity at any time during the financial year and unless otherwise indicated were Key Management Personnel for the entire period
Name Title
A. McCallum Chairman, Non-executive Director
M. Ryan Chief Executive Officer and Managing Director
T. Gerber Non-executive Director
R. Tsai1 Non-executive Director
J. Watson
C. Leon
J. Thieng Ng2
J. Siang Ng3
M. Carroll4
Non-executive Director
Non-executive Director
Non-executive Director
Alternate Non-executive Director
Non-executive Director
Notes: 1. To 17 February 2014
2. From 17 February 2014
3. From 16 April 2014
4. From 4 June 2014
Key Management Personnel Compensation
The aggregate compensation of Key Management Personnel of the consolidated entity is set out below:
Other Key Management Personnel:
Name Title
P. Bennett Head of Processing
A. Creswell Chief Financial Officer
D. Kiemele Head of Farming
K. Little Head of People, Culture and QA
M. Maedler General Counsel and Company Secretary
J. O’Connor Head of Risk
L. Sams Head of Sustainability
D. Williams Head of Sales and Marketing
B. Daley Head of Logistics, Planning and IT
C. Hounsell
I. Miles1
Senior Manager Marketing
Head of Safety
Notes: 1. From 1 October 2013
For
per
sona
l use
onl
y

NOTES TO THE FINANCIAL STATEMENTS for the year ended 30 June 2014 cont. Tassal Group Limited and Controlled Entities
68
5. KEY MANAGEMENT PERSONNEL COMPENSATION (CONT.)
Consolidated 2014
Consolidated 2013
$ $
Short-term employee benefits 3,876,483 3,332,317
Post-employment benefits 293,184 198,406
Share-based payment 572,188 275,142
4,741,855 3,805,865
Details of the consolidated entity’s Key Management Personnel compensation policy and details of Key Management Personnel compensation are discussed in section 20 of the Directors’ Report.
(c) Share-based Remuneration
(i) Long-term Incentive Plan The Company established a Long-term Incentive Plan during the financial year ended 30 June 2007. Employees receiving awards under the Long-term Incentive Plan are those of an Executive level
(including the Managing Director and Chief Executive Officer).
Under the Company’s Long-term Incentive Plan, participants are granted performance rights to ordinary shares, subject to the Company meeting specified performance criteria during the performance period. If these performance criteria are satisfied, ordinary shares will be issued at the end of the performance period. The number of ordinary shares that a participant will ultimately receive will depend on the extent to which the performance criteria are met by the Company. If specified minimum performance hurdles are not met no ordinary shares will be issued in respect of the performance rights.
An employee granted performance rights is not legally entitled to shares in the Company before the performance rights allocated under the Plan vest. A performance right to ordinary shares does not entitle a participant under the Plan to voting rights, participation in new issues of securities or to receive dividends. In the event that shares are issued under the Plan at the end of the performance period pursuant to the performance rights, those shares will rank equally with existing ordinary shares, including entitlement to voting rights. Once shares have vested they remain in a holding lock until the earlier of the employee leaving the consolidated entity, the seventh anniversary of the date the performance rights were awarded or the Board approving an application for their release.
Set out below is a summary of performance rights granted to participants under the Plan (Consolidated and Parent Entity):
Grant date
Vesting date
Balance at
start of year
(Number)
Granted
during the
year
(Number)
Vested
during the
year
(Number)
Lapsed during
the year
(Number)
Balance at end
of year
(Number)
25 Nov 2011 30 Jun 2014 511,674 - 390,086 121,588 -
14 Dec 2012 30 Jun 2015 655,740 - - - 655,740
20 Nov 2013 30 Jun 2016 - 471,270 - - 471,270
1,167,414 471,270 390,086 121,588 1,127,010
Details of the performance rights holdings of the respective Key Management Personnel, including details of performance rights granted, vested or lapsed during the year are disclosed in the Director’s report.
The independently assessed fair value at grant date of performance rights granted under the Long-term Incentive Plan during the financial years ended 30 June 2012, 30 June 2013 and 30 June 2014 and applicable to participants was:
Performance condition Value at grant date
$ Performance rights issued during the financial year ended 30 June 2012: Earnings per share (‘EPS’) 235,479 Total shareholder return (‘TSR’) 310,220
545,699
Performance rights issued during the financial year ended 30 June 2013: Earnings per share (‘EPS’) 359,198 Return on assets (‘ROA’) 158,390
517,588
Performance rights issued during the financial year ended 30 June 2014: Earnings per share (‘EPS’) 631,646 Return on assets (‘ROA’) 489,685
1,121,331
2,184,618
For
per
sona
l use
onl
y

NOTES TO THE FINANCIAL STATEMENTS for the year ended 30 June 2014 cont. Tassal Group Limited and Controlled Entities
69
5. KEY MANAGEMENT PERSONNEL COMPENSATION (CONT.)
The above performance rights valuations have been determined in line with the requirements of AASB 2 ‘Share-based Payments’. AASB 2 requires the measurement of the fair value of the performance rights at the grant date and then to have that value apportioned in equal amounts over the period from grant date to vesting date.
(i) Long-term Incentive Plan (cont.)
The expense recognised in relation to performance rights applicable to Key Management Personnel for the financial year ended 30 June 2014 is $572,188 (2013: $275,142).
50% of the performance rights granted to Key Management Personnel during the financial year ended 30 June 2013 attach respectively to each of the EPS and ROA performance hurdles. 50% of the performance rights granted to Key Management Personnel during the financial year ended 30 June 2014 attach respectively to each of the EPS and ROA performance hurdles.
The fair value of the performance rights is based on the share price at grant date of $3.020 (2013:$1.375) adjusted for the present value of expected dividends over the vesting Performance Period.
(ii) Share Options
There were no options granted to Key Management Personnel during or since the end of the financial year.
6. REMUNERATION OF AUDITORS
Consolidated 2014
Consolidated 2013
$ $
Audit or review of the financial reports 199,238 185,000
Non-audit services (i) 6,825 4,725
206,063 189,725
Notes:
(i) The “non-audit services” principally refers to advice
regarding the consolidated entity’s selective breeding
program (SBP) and the acquittal of various grants
received. Non-audit services are any services
provided, excluding audits required by the Corporations Act 2001.
All amounts shown above are exclusive of GST.
The parent entity’s audit fees were paid for by Tassal
Operations Pty Ltd, a wholly-owned subsidiary.
Refer to the Directors’ Report for details on
compliance with the auditor’s independence
requirements of the Corporations Act 2001.
The auditor of Tassal Group Limited is Deloitte
Touche Tohmatsu.
Consolidated
2014 Consolidated
2013
$’000 $’000
7. CURRENT TRADE AND OTHER RECEIVABLES
Trade receivables (i) 3,731 8,865
Allowance for doubtful debts - (23)
3,731 8,842
Goods and services tax (GST) receivable 1,670 1,571
Other receivables 2,235 2,936
7,636 13,349
For
per
sona
l use
onl
y

NOTES TO THE FINANCIAL STATEMENTS for the year ended 30 June 2014 cont. Tassal Group Limited and Controlled Entities
70
7. CURRENT TRADE AND OTHER RECEIVABLES (CONT.)
Notes:
(i) The average credit period on sales of goods
is 30 days from the previous month’s
statement date. No interest is charged on the trade receivables for the first 60 days
from the date of the invoice. Thereafter,
interest may be charged at 2% per month on
the outstanding balance. An allowance has
been made for estimated irrecoverable
amounts from the sale of goods, determined
by reference to past default experience.
During the current financial year the
allowance for doubtful debts decreased by $0.023 million (2013: decreased by $0.067
million). This movement was recognised in
the profit or loss for the current financial
year.
Included in the Group’s trade receivable
balance are debtors with a carrying amount
of $1.056 million (2013: $2.104 million)
which are past due at the reporting date for
which the Group has not provided as there
has not been a significant change in credit quality and the amounts are still considered
recoverable.
(ii) Transfer of Financial Assets:
During the financial year, Westpac Banking
Corporation (‘Westpac’) continued to provide
an Uncommitted Trade Finance Facility
(‘Receivables Purchase Facility’) under which
it may purchase receivables from the
Company at a discount. This facility has been provided by Westpac to the Company
since 30 June 2006 and is utilised by the
Company as a primary source of working
capital. The maximum available at any time
under the facility was $70.000 million during
the financial year. All receivables sold to
Westpac are insured by the Company with a
10% deductible per insurance claim in the
event of a debtor default, representing the
Company’s maximum exposure under the facility. Westpac retains 10% of any
receivable purchased as a security deposit
until it has received payment for the full face
value of the receivable purchased. The
Receivables Purchase Facility is uncommitted
and revolving. Uncommitted means that the
Company is not obliged to make offers or
pay commitment fees and Westpac is not
obliged to accept offers of receivables. It should be noted that since it’s inception with
the Company, Westpac has accepted all
offers for sale of receivables that the
Company has proposed.
The funded value of the Company’s
Receivables Purchase Facility was $46.832
million as at 30 June 2014 (2013: $46.797
million). The receivables sold by the
Company into this facility are de-recognised
as an asset as the contractual rights to cash flows from these receivables have expired on
acceptance of the sale with Westpac.
Further, the amount funded under this
facility is also not recognised as a liability.
The Company does recognise the security
deposit as cash. The security deposit held as
at 30 June 2014 was $5.069 million (2013:
$4.963 million).
For
per
sona
l use
onl
y

NOTES TO THE FINANCIAL STATEMENTS for the year ended 30 June 2014 cont. Tassal Group Limited and Controlled Entities
71
7. CURRENT TRADE AND OTHER RECEIVABLES (CONT.)
Ageing of past due but not impaired Consolidated
2014 Consolidated
2013
$’000 $’000
90 – 120 days 435 698
120+ days 621 1,406
Total 1,056 2,104
Movement in allowance for doubtful debts
Balance at the beginning of the year (23) (90)
Doubtful debts recognised (94) (61)
Amounts written off as uncollectible 117 128
Balance at the end of the year - (23)
In determining the recoverability of a trade receivable, the Group considers any change in the credit quality of the trade receivable from the date credit was initially granted up to the reporting date. The concentration of credit risk is limited due to the customer base being large and unrelated. Accordingly, the Directors believe that there is no further credit provision required in excess of the allowance for doubtful debts.
Ageing of impaired receivables
$’000 $’000
120+ days - 23
- 23
8. CURRENT INVENTORIES
Raw materials 9,311 8,570
Finished goods(i) 44,096 41,580
53,407 50,150
(i) Includes fair value adjustment of biological assets at point of harvest $14.175 million
(2013: $12.062 million)
9. BIOLOGICAL ASSETS
Livestock at fair value(i)
Opening balance 159,935 145,411
Gain or loss arising from changes in fair value less estimated point of sale costs
206,557
196,268
Increases due to purchases 10,255 9,596
Decreases due to harvest (187,963) (191,340)
Closing balance(ii) 188,784 159,935
(i) Tassal Operations Pty Ltd grows fish from juveniles through to harvest (approximately
16 months). Total weight of live finfish at the end of the year was 16,257 tonnes
(2013: 13,189 tonnes).
(ii) Includes fair value adjustment of biological assets $63.870 million (2013: $50.931
million)
Fair Value of biological assets
The fair value of biological assets have been determined in accordance with generally accepted pricing models based on a discounted cash flow analysis
For
per
sona
l use
onl
y
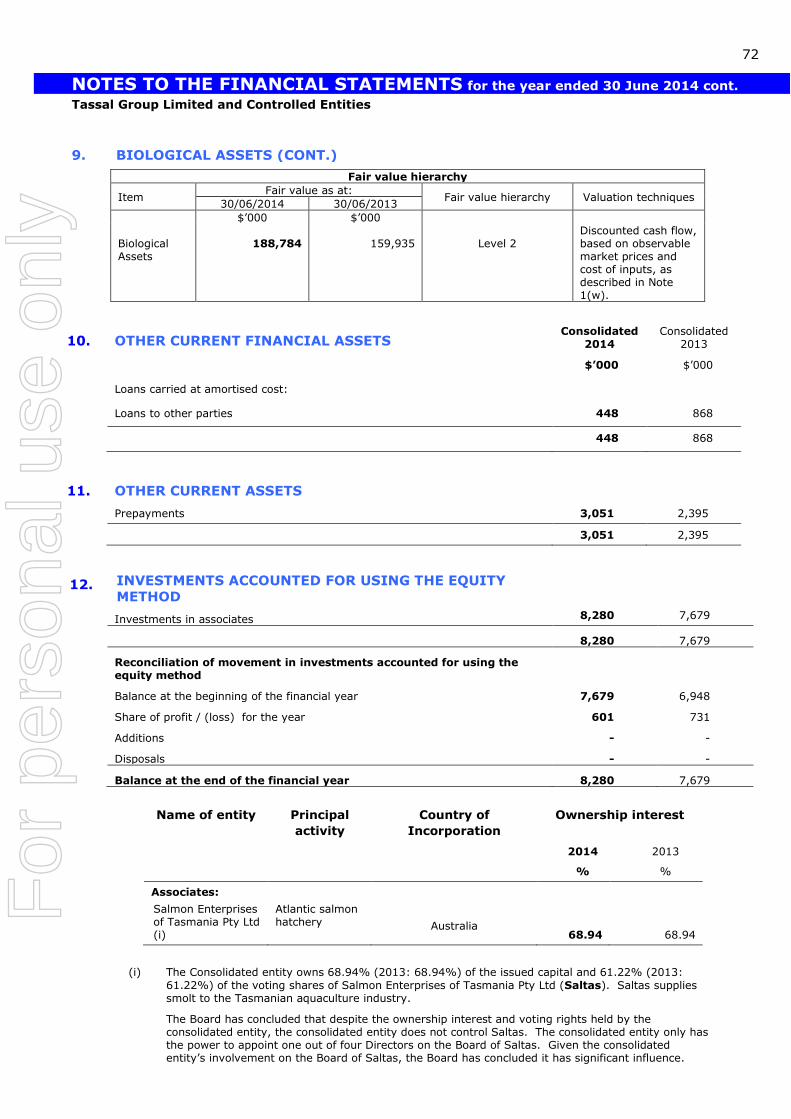
NOTES TO THE FINANCIAL STATEMENTS for the year ended 30 June 2014 cont. Tassal Group Limited and Controlled Entities
72
9. BIOLOGICAL ASSETS (CONT.)
Fair value hierarchy
Item Fair value as at:
Fair value hierarchy Valuation techniques 30/06/2014 30/06/2013
$’000 $’000 Biological Assets
188,784
159,935
Level 2
Discounted cash flow, based on observable market prices and cost of inputs, as described in Note 1(w).
10. OTHER CURRENT FINANCIAL ASSETS Consolidated
2014 Consolidated
2013
$’000 $’000
Loans carried at amortised cost:
Loans to other parties 448 868
448 868
11. OTHER CURRENT ASSETS
Prepayments 3,051 2,395
3,051 2,395
12. INVESTMENTS ACCOUNTED FOR USING THE EQUITY
METHOD
Investments in associates 8,280 7,679
8,280 7,679
Reconciliation of movement in investments accounted for using the equity method
Balance at the beginning of the financial year 7,679 6,948
Share of profit / (loss) for the year 601 731
Additions - -
Disposals - -
Balance at the end of the financial year 8,280 7,679
Name of entity Principal
activity
Country of
Incorporation
Ownership interest
2014
%
2013
%
Associates:
Salmon Enterprises of Tasmania Pty Ltd (i)
Atlantic salmon hatchery
Australia
68.94
68.94
(i) The Consolidated entity owns 68.94% (2013: 68.94%) of the issued capital and 61.22% (2013:
61.22%) of the voting shares of Salmon Enterprises of Tasmania Pty Ltd (Saltas). Saltas supplies smolt to the Tasmanian aquaculture industry.
The Board has concluded that despite the ownership interest and voting rights held by the consolidated entity, the consolidated entity does not control Saltas. The consolidated entity only has the power to appoint one out of four Directors on the Board of Saltas. Given the consolidated entity’s involvement on the Board of Saltas, the Board has concluded it has significant influence.
For
per
sona
l use
onl
y

NOTES TO THE FINANCIAL STATEMENTS for the year ended 30 June 2014 cont. Tassal Group Limited and Controlled Entities
73
12.
INVESTMENTS ACCOUNTED FOR USING THE EQUITY
METHOD (CONT.) Summarised financial information of associates: (i) Consolidated
2014 Consolidated
2013
$’000 $’000
Current assets 9,294 9,415
Non-current assets 30,795 26,924
40,089 36,339
Current liabilities (5,329) (7,329)
Non-current liabilities (11,028) (6,132)
(16,357) (13,461)
Net assets 23,732 22,878
Revenue 8,991 8,826
Net profit / (loss) (1,027) 1,129
Share of associates’ profit / (loss):
Share of profit / (loss) before income tax 858 1,309
Income tax (expense)/benefit (257) (578)
Share of associates’ profit / (loss) – current period 601 731
(i) Profit and loss resulting from upstream and downstream transactions between an
investor and an associate are recognised in the investor’s financial statements only to the
extent of unrelated investors’ interest in the associate.
13. OTHER NON-CURRENT FINANCIAL ASSETS
Shares in other entities at cost 43 43
Loans to other parties 28 39
71 82
For
per
sona
l use
onl
y

NOTES TO THE FINANCIAL STATEMENTS for the year ended 30 June 2014 cont. Tassal Group Limited and Controlled Entities
74
14. PROPERTY, PLANT AND EQUIPMENT Consolidated: 2014
Freehold
land at fair
value $'000
Buildings at
fair value
$'000
Plant and
equipment at
cost $'000
Capital
works in
progress at
cost $'000 Total $'000
Gross carrying amount
Balance at 30 June 2013 4,570 43,954 221,417 28,432 298,373
Additions - 1,752 25,062 - 26,814
Disposals - - (125) - (125)
Work-In-Progress Additions 26,204 26,204
Transfers to asset categories - - - (26,814) (26,814)
Net revaluation increment / (decrement) - - - - -
Balance at 30 June 2014 4,570 45,706 246,354 27,822 324,452
Accumulated depreciation
Balance at 30 June 2013 - (975) (79,566) - (80,541)
Depreciation expense - (2,416) (16,663) - (19,079)
Disposals - - 125 - 125
Transfers to asset categories - - - - -
Net adjustments from revaluations - - - - -
Balance at 30 June 2014 - (3,391) (96,104) - (99,495)
Net book value
Balance at 30 June 2013 4,570 42,979 141,851 28,432 217,831
Balance at 30 June 2014 4,570 42,315 150,250 27,822 224,957
Consolidated: 2013
Freehold
land at fair
value $'000
Buildings at
fair value
$'000
Plant and
equipment at
cost $'000
Capital
works in
progress at
cost $'000 Total $'000
Gross carrying amount
Balance at 30 June 2012 5,070 43,585 196,455 35,897 281,007
Additions - 6,759 25,105 - 31,864
Disposals - - (143) - (143)
Work-In-Progress Additions 24,399 24,399
Transfers to asset categories - - - (31,864) (31,864)
Net revaluation increment / (decrement) (500) (6,391) - - (6,891)
Balance at 30 June 2013 4,570 43,954 221,417 28,432 298,373
Accumulated depreciation
Balance at 30 June 2012 - (4,512) (64,389) - (68,901)
Depreciation expense - (2,383) (15,318) - (17,702)
Disposals - - 141 - 141
Transfers to asset categories - - - - -
Net adjustments from revaluations - 5,921 - - 5,921
Balance at 30 June 2013 - (975) (79,566) - (80,541)
Net book value
Balance at 30 June 2012 5,070 39,073 132,067 35,897 212,106
Balance at 30 June 2013 4,570 42,979 141,851 28,432 217,831 The Group’s freehold land and buildings are stated at their revalued amounts, being the fair value at the date of revaluation, less any subsequent accumulated depreciation and subsequent accumulated impairment losses. The fair value measurements of the Group’s freehold land and buildings as at 19 June 2013 were performed by Mr M.J.Page [B.Bus.(Property)AAPI CPV], independent valuer not related to the Group. The valuation was based on comparable and observable market prices adjusted for property-specific factors, and conforms to Australian Valuations Standards. The Directors have assessed the value of the Group’s freehold land and buildings at 30 June 2014 and determined based on their review of market prices and property-specific factors, that the valuation as at 19 June 2013 remains current.
Fair value of land and Buildings
Details of the Group’s freehold land and buildings and information about the fair value hierarchy as at 30 June 2014 are as follows:
Level 1 $’000
Level 2 $’000
Level 3 $’000
Fair value as at 30 June 2014
Freehold land Buildings
- -
- -
4,570 42,315
4,570 42,315
For
per
sona
l use
onl
y

NOTES TO THE FINANCIAL STATEMENTS for the year ended 30 June 2014 cont. Tassal Group Limited and Controlled Entities
75
Consolidated
2014 Consolidated
2013 $’000 $’000
15. GOODWILL
Gross carrying amount
Balance at the beginning of financial year 14,851 14,851
Additional amounts recognised from business
combinations occurring during the period
-
-
Balance at the end of financial year 14,851 14,851
Accumulated impairment losses
Balance at the beginning of financial year - -
Impairment losses for the year - -
Balance at the end of the financial year - -
Net book value
Balance at the beginning of the financial year 14,851 14,851
Balance at the end of the financial year 14,851 14,851
Impairment test for goodwill
Goodwill relates to the consolidated entity’s
acquisition of the wholly-owned controlled entity, Aquatas Pty Ltd. The recoverable amount of goodwill is determined based on the value-in-use calculation. This calculation uses a discounted cash flow projection using a pre-tax discount rate of 12.17% (2013: 12.17%). The calculation is based on management approved cash flows and financial projections to 2019, and a further five year forecast to 2024, of the continued and incremental cash flow synergies to be derived from the acquisition of Aquatas Pty Ltd. The forecast period has been selected as this approximates a sufficient number of finfish growth cycles which deliver the related synergies underpinning the projected cash flows to be generated. The recoverable amount calculated exceeds the carrying value of goodwill. The cash flows beyond a five-year period have been extrapolated using a 0% per annum growth rate.
For
per
sona
l use
onl
y

NOTES TO THE FINANCIAL STATEMENTS for the year ended 30 June 2014 cont. Tassal Group Limited and Controlled Entities
76
16. OTHER INTANGIBLE ASSETS
Consolidated 2014
Consolidated 2013
$’000 $’000 Gross carrying amount
Balance at the beginning of financial year 24,184 24,184
Additional amounts recognised from acquisition of Superior Gold Brand -
-
Balance at the end of financial year 24,184 24,184
Accumulated impairment losses
Balance at the beginning of financial year - -
Impairment losses for the year - -
Balance at the end of financial year - -
Net book value
Balance at the beginning of financial year 24,184 24,184
Balance at the end of financial year 24,184 24,184
Impairment test and useful life assessment for other intangible assets The carrying value of other intangible assets relating to the Superior Gold brand as at 30 June 2014 is $24.184 million (2013: $24.184 million). Management have assessed that the brand has an indefinite useful life. There is no foreseeable limited life for the brand and management has no intentions of ceasing use of the brand such that the life would be limited. The Brand will continue to be actively promoted and supported in the markets where Superior Gold branded products are sold. The recoverable amount of other intangible assets is determined based on the value-in-use calculation. This calculation uses a discounted cash flow projection using a pre-tax discount rate of 12.17% (2013: 12.17%). The calculation is based on management approved cash flows and financial projections expected to be derived from the contribution of Superior Gold branded product sales for the financial year ended 30 June 2014, and projections over a further forecast period to 2024. The forecast period has been selected as this approximates a sufficient number of sales cycles for the projected cash flows to be generated and over
which the benefits of continued marketing and brand support initiatives are expected to be derived. The recoverable amount calculated exceeds the carrying value of the Superior Gold brand. The cash flows beyond a five-year period have been extrapolated using a 0% per annum growth rate.
For
per
sona
l use
onl
y

NOTES TO THE FINANCIAL STATEMENTS for the year ended 30 June 2014 cont. Tassal Group Limited and Controlled Entities
77
17. OTHER NON-CURRENT ASSETS
Consolidated 2014
Consolidated 2013
$’000 $’000
Marine farming lease – at cost 827 827 - -
Accumulated amortisation (i) (395) (365) - -
Selective breeding program contribution asset (ii) 2,788 -
3,220 462 - -
(i) Amortisation expense is included in the line item “depreciation and amortisation” in the
income statement.
(ii) The Selective Breeding Program (SBP) is controlled by Salmon Enterprises of Tasmania
Pty Ltd (Saltas). The success of the SBP and accordingly, the broodstock and resultant
progeny is fundamental to the sustainability of Tassal Group Ltd. The Group has
created a newly categorised asset, the “selective breeding program contribution asset” on its balance sheet for $2.788 million that represents payments to the SBP to date. Of
this total, $2.495 million was previously disclosed as a component of the finfish
biological asset. The impact on current period profit before tax as a result of the new
accounting policy is an increase of $0.71 million. If the existing accounting policy had
been maintained, $1.78 million would have been held on the balance sheet as part of
the finfish biological asset with the remaining $0.71 million included in cost of goods
sold as a period expense as a result of the harvest and sale of the biological asset.
All future investments in the SBP shall be capitalised to the SBP contribution asset in accordance with the policy. As the SBP eggs and smolt are progressively received by
the Group, the capitalised value will transfer from the SBP contribution asset back to
the finfish biological asset and be subsequently released to profit and loss as the
livestock is harvested and sold. It is anticipated that the value of this asset should
build to around $5.00 million to $6.00 million based on future expected contributions to
the SBP program.
18. ASSETS PLEDGED AS SECURITY
In accordance with the security arrangements of liabilities, as disclosed in notes 20 and 24 to the financial statements, all current and non-current assets of the consolidated entity, except goodwill and deferred tax assets, have been pledged as security. The consolidated entity does not hold title to the equipment under finance lease pledged as security.
19. CURRENT TRADE AND OTHER PAYABLES
Trade payables (i) 36,156 34,533
Other creditors and accruals 9,559 8,301
Goods and services tax (GST) payable 384 96
46,099 42,930
(i) The average credit period on purchases of goods is 60
days. No interest is generally charged on trade payables
for the first 60 days from the date of the invoice. Thereafter, interest may be charged at varying rates per
annum on the outstanding balance. The consolidated
entity has financial risk management policies in place to
ensure that all payables are paid within the credit
timeframe.
For
per
sona
l use
onl
y

NOTES TO THE FINANCIAL STATEMENTS for the year ended 30 June 2014 cont. Tassal Group Limited and Controlled Entities
78
20. CURRENT BORROWINGS
Consolidated
2014 Consolidated
2013
Secured:
At amortised cost
$’000 $’000
Bank overdrafts (i) - -
Finance lease liabilities (ii) 10,789 13,323
Bank loans (iii) 12,394 17,348
23,183 30,671
Unsecured:
At amortised cost
Other loans 3 3
23,186 30,674
(i) Secured by registered mortgages over the consolidated entity’s
assets and undertakings, freehold land and buildings and shares in
other related parties, the current market value of which exceeds the
value of the mortgages.
(ii) Secured by assets leased.
(iii) Secured by assets, the value of which exceeds the loan liability.
21. CURRENT PROVISIONS
Current provisions comprise:
Employee benefits (refer to note 25) 5,922 5,542
5,922 5,542
(i) The current provision for employee entitlements includes $0.820
million (2013: $0.690 million) of annual leave and vested long
service leave entitlements accrued but not expected to be taken
within twelve months.
22. OTHER CURRENT FINANCIAL LIABILITIES
Interest rate swap contracts 260 204
260 204
23. OTHER CURRENT LIABILITIES
Deferred government grants 291 720
291 720
24. NON-CURRENT BORROWINGS
Secured:
At amortised cost:
Cash advance (i) 24,690 29,807
Finance lease liabilities (ii) 12,450 12,585
37,140 42,392
Unsecured:
At amortised cost:
Other loans 4 7
37,144 42,399
(i) Secured by registered mortgages over the consolidated entity’s
assets and undertakings, freehold land and buildings and shares
in other related parties, the current market value of which
exceeds the value of the mortgages.
(ii) Secured by assets leased.
For
per
sona
l use
onl
y

NOTES TO THE FINANCIAL STATEMENTS for the year ended 30 June 2014 cont. Tassal Group Limited and Controlled Entities
79
25. NON-CURRENT PROVISIONS
Consolidated
2014 Consolidated
2013
$’000 $’000
Employee benefits 1,075 906
The aggregate employee benefit liability recognised and included in the financial statements is as follows:
Provision for employee benefits
Current (refer to note 21) 5,922 5,542
Non-current 1,075 906
6,997 6,448
Consolidated 2014 2013
26. ISSUED CAPITAL
Note Number $’000 Number $’000
(a) Ordinary share capital (fully paid): Ordinary shares 146,507,029 154,213 146,304,404 154,027
Changes to the Corporations Law abolished the authorised capital and par value concepts in relation to share capital from 1 July 1998. Therefore,
the Company does not have a limited amount of authorised capital and issued shares do not have a par value.
(b) Movements in ordinary share capital
Balance as at the beginning of the financial year 146,304,404 154,027 146,304,404 154,027
Issue of shares pursuant to Executive Long Term Incentive Plan (i) 202,625 186 - -
Balance as at the end of the financial year 146,507,029 154,213 146,304,404 154,027
Holders of ordinary shares are entitled to receive dividends as declared from time to time and are entitled to one vote per share at shareholders’ meetings. (i) Shares issued pursuant to the Company’s Executive Long Term Incentive Plan On 5 September 2013, 202,625 ordinary shares were issued pursuant to the Company’s Long Term Incentive Plan at an issue price of $0.9177 per share. There was no exercise price paid on this conversion.
(ii) 390,086 fully paid ordinary shares in respect of the performance rights granted during the year ended 30 June 2012 and which vested on 30 June 2014 will be issued pursuant to the Company’s Long -term Incentive Plan.
For
per
sona
l use
onl
y
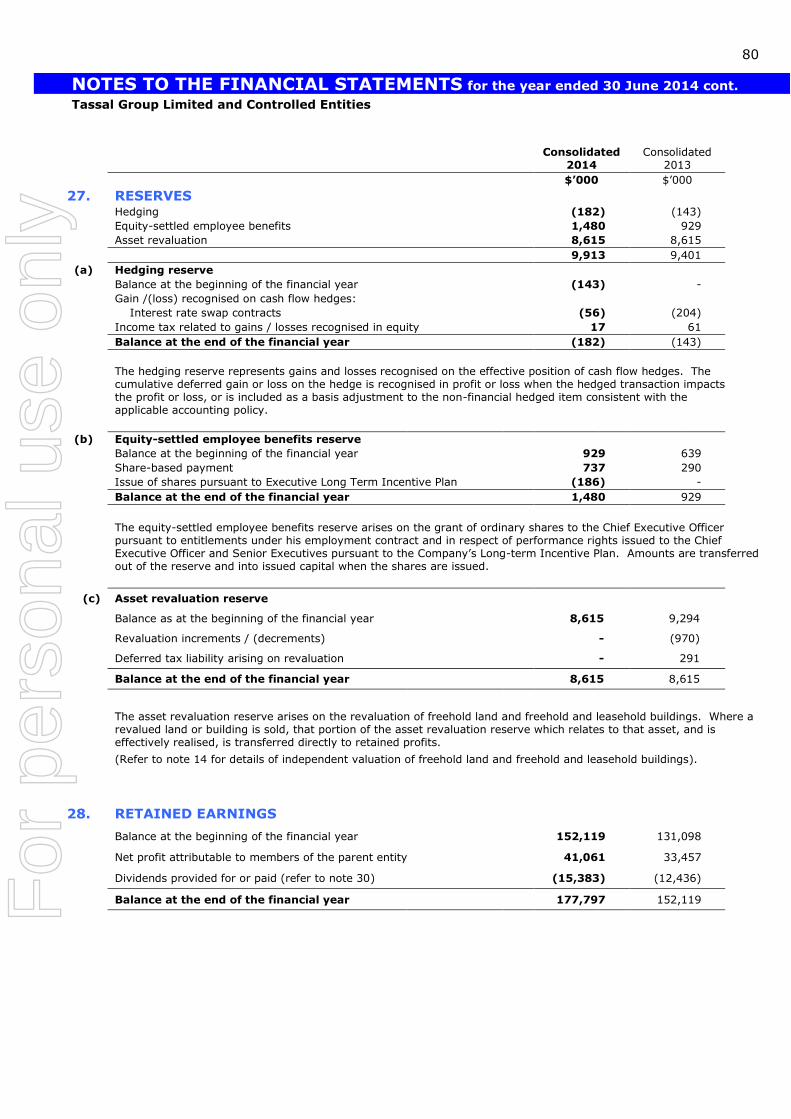
NOTES TO THE FINANCIAL STATEMENTS for the year ended 30 June 2014 cont. Tassal Group Limited and Controlled Entities
80
Consolidated
2014 Consolidated
2013
$’000 $’000
27. RESERVES
Hedging (182) (143)
Equity-settled employee benefits 1,480 929
Asset revaluation 8,615 8,615
9,913 9,401
(a) Hedging reserve
Balance at the beginning of the financial year (143) -
Gain /(loss) recognised on cash flow hedges:
Interest rate swap contracts (56) (204)
Income tax related to gains / losses recognised in equity 17 61
Balance at the end of the financial year (182) (143)
The hedging reserve represents gains and losses recognised on the effective position of cash flow hedges. The cumulative deferred gain or loss on the hedge is recognised in profit or loss when the hedged transaction impacts the profit or loss, or is included as a basis adjustment to the non-financial hedged item consistent with the applicable accounting policy.
(b) Equity-settled employee benefits reserve
Balance at the beginning of the financial year 929 639
Share-based payment 737 290
Issue of shares pursuant to Executive Long Term Incentive Plan (186) -
Balance at the end of the financial year 1,480 929
The equity-settled employee benefits reserve arises on the grant of ordinary shares to the Chief Executive Officer pursuant to entitlements under his employment contract and in respect of performance rights issued to the Chief Executive Officer and Senior Executives pursuant to the Company’s Long-term Incentive Plan. Amounts are transferred out of the reserve and into issued capital when the shares are issued.
(c) Asset revaluation reserve
Balance as at the beginning of the financial year 8,615 9,294
Revaluation increments / (decrements) - (970)
Deferred tax liability arising on revaluation - 291
Balance at the end of the financial year 8,615 8,615
The asset revaluation reserve arises on the revaluation of freehold land and freehold and leasehold buildings. Where a revalued land or building is sold, that portion of the asset revaluation reserve which relates to that asset, and is effectively realised, is transferred directly to retained profits.
(Refer to note 14 for details of independent valuation of freehold land and freehold and leasehold buildings).
28. RETAINED EARNINGS
Balance at the beginning of the financial year 152,119 131,098
Net profit attributable to members of the parent entity 41,061 33,457
Dividends provided for or paid (refer to note 30) (15,383) (12,436)
Balance at the end of the financial year 177,797 152,119
For
per
sona
l use
onl
y

NOTES TO THE FINANCIAL STATEMENTS for the year ended 30 June 2014 cont. Tassal Group Limited and Controlled Entities
81
29. EARNINGS PER SHARE (EPS)
Consolidated 2014 Consolidated 2013
(Cents per share) (Cents per share)
Earnings per ordinary share
Basic (cents per share) (i) 28.03 22.87
Diluted (cents per share) (ii) 27.82 22.70
(i) Basic earnings per share is calculated by dividing the net
profit for the reporting period by the weighted average
number of ordinary shares of the Company.
(ii) Diluted earnings per share is calculated by dividing the
net profit for the reporting period by the weighted
average number of ordinary shares outstanding
including dilutive potential ordinary shares.
2014 2013
No. ‘000 No. '000
Weighted average number of ordinary shares used as the denominator in the calculation of EPS
Number for basic EPS 146,470 146,304
Shares deemed to be issued for no consideration in respect of performance rights issued pursuant to Long-term Incentive Plan 1,140 1,069
Number for diluted EPS 147,610 147,373
2014 2013
$’000 $’000
Earnings used as the numerator in the calculation of EPS (i)
Earnings for basic EPS 41,061 33,457
Earnings for diluted EPS 41,061 33,457
(i) Earnings used in the calculation of basic and diluted
earnings per share is as per net profit in the income
statement.
For
per
sona
l use
onl
y

NOTES TO THE FINANCIAL STATEMENTS for the year ended 30 June 2014 cont. Tassal Group Limited and Controlled Entities
82
Year Ended
30 June 2014
Year Ended
30 June 2013
Cents per
share $’000 Cents per
share $’000
30. DIVIDENDS
(a) Recognised amounts Fully paid ordinary shares Interim dividend in respect of current financial year 5.50 8,058 4.50 6,584 Final dividend paid in respect of prior financial year 5.00 7,325 4.00 5,852
10.50 15,383 8.50 12,436
(b) Unrecognised amounts
Fully paid ordinary shares
Final dividend in respect of current financial year 6.00 8,790 5.00 7,325
On 19 August 2014, the Directors declared a final
dividend of $8.790 million (6.00 cents per ordinary share) in respect of the financial year ended 30 June 2014. The final dividend will be 50% franked. The record date for determining entitlements to this dividend is 12 September 2014. The final dividend will be paid on 29 September 2014.
The final dividend in respect of ordinary shares for the year ended 30 June 2014 has not been recognised in these financial statements because the final dividend was declared subsequent to 30 June 2014. No portion of the final dividend declared for the financial year ended 30 June 2014 constitutes Conduit Foreign Income.
Consolidated 2014
Consolidated 2013
$’000 $’000
31. COMMITMENTS FOR EXPENDITURE (i)
Capital expenditure commitments
Plant and equipment
Not longer than 1 year 14,081 15,136
Longer than 1 year and not longer than 5 years - -
Longer than 5 years - -
14,081 15,136
(i) Finance lease liabilities and non-cancellable operating lease commitments are disclosed in note 32 to the financial statements.
For
per
sona
l use
onl
y
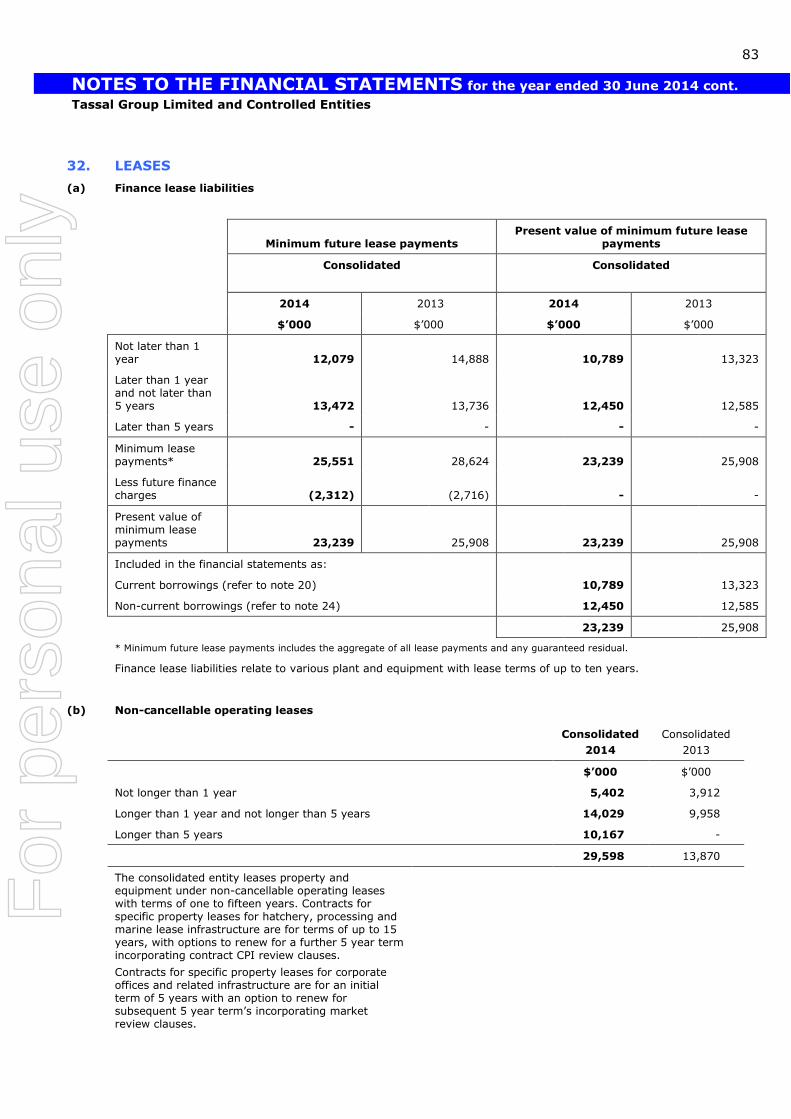
NOTES TO THE FINANCIAL STATEMENTS for the year ended 30 June 2014 cont. Tassal Group Limited and Controlled Entities
83
32. LEASES
(a) Finance lease liabilities
Minimum future lease payments
Present value of minimum future lease payments
Consolidated
Consolidated
2014 2013 2014 2013
$’000 $’000 $’000 $’000
Not later than 1 year
12,079
14,888
10,789
13,323
Later than 1 year and not later than 5 years 13,472 13,736 12,450 12,585
Later than 5 years - - - -
Minimum lease payments* 25,551 28,624 23,239 25,908
Less future finance charges (2,312) (2,716) - -
Present value of minimum lease payments 23,239 25,908 23,239 25,908
Included in the financial statements as:
Current borrowings (refer to note 20) 10,789 13,323 14,454
Non-current borrowings (refer to note 24) 12,450 12,585 16,286
23,239 25,908 30,740
* Minimum future lease payments includes the aggregate of all lease payments and any guaranteed residual.
Finance lease liabilities relate to various plant and equipment with lease terms of up to ten years.
(b) Non-cancellable operating leases
Consolidated
2014
Consolidated
2013
$’000 $’000
Not longer than 1 year 5,402 3,912
Longer than 1 year and not longer than 5 years 14,029 9,958
Longer than 5 years 10,167 -
29,598 13,870
The consolidated entity leases property and equipment under non-cancellable operating leases with terms of one to fifteen years. Contracts for specific property leases for hatchery, processing and marine lease infrastructure are for terms of up to 15 years, with options to renew for a further 5 year term incorporating contract CPI review clauses.
Contracts for specific property leases for corporate offices and related infrastructure are for an initial term of 5 years with an option to renew for subsequent 5 year term’s incorporating market review clauses.
For
per
sona
l use
onl
y

NOTES TO THE FINANCIAL STATEMENTS for the year ended 30 June 2014 cont. Tassal Group Limited and Controlled Entities
84
33. CONTINGENT LIABILITIES AND
CONTINGENT ASSETS
There are no contingent liabilities or contingent assets at the date of this Annual Financial Report.
34. INVESTMENTS IN CONTROLLED
ENTITIES
Details of controlled entities are reflected below:
Name of entity Country of incorporation
Ownership interest
2014 2013
Parent entity:
Tassal Group Limited (i) Australia
Controlled entities: (ii)
Tassal Operations Pty Ltd (iii), (v) Australia 100% 100%
Aquatas Pty Ltd (iv), (v) Australia 100% 100%
Notes:
(i) Tassal Group Limited is the head entity within the tax-consolidated group and also the ultimate parent entity.
(ii) These companies are members of the tax-consolidated group.
(iii) Tassal Operations Pty Ltd was established as a wholly-owned subsidiary on 19 September 2003.
(iv) Aquatas Pty Ltd was acquired on 18 March 2005 pursuant to a Merger Agreement with Webster Limited.
(v) On 28th June 2006 these wholly-owned subsidiaries entered into a deed of cross guarantee with Tassal Group Limited for the purpose of
obtaining for these wholly-owned subsidiaries the benefit of relief from complying with certain accounting and audit requirements of the
Corporations Act (including the requirements to prepare and lodge an audited financial report) granted by ASIC by an order made under sub-section 340(1) of the Corporations Act on 27th June 2006. The order made by ASIC relieves these wholly-owned subsidiaries from
complying with the same provisions of the Corporations Act as they would be relieved from complying with if they satisfied the conditions
set out in ASIC Class Order 98/1418.
35. SEGMENT INFORMATION
AASB 8 ‘Operating Segments’ requires operating segments to be identified on the basis of internal reports about components of the Group that are regularly reviewed by the chief operating decision maker in order to allocate resources to the segment and to assess its performance. Tassal’s system of internal reporting to key management personnel is such that there is only
one reportable segment as defined in AASB 8, this being the sale of finfish.
36. SEASONALITY
The consolidated entity’s principal activities, being principally the hatching, farming, processing, sales and marketing of Atlantic Salmon are not generally subject to material or significant seasonal fluctuations.
37. RELATED PARTY DISCLOSURES
Identity of related parties
The following persons and entities are regarded as related parties:
(i) Controlled entities:
Tassal Operations Pty Ltd
Aquatas Pty Ltd
(Refer to note 34 for details of equity interests in the above controlled companies).
(ii) Associates:
Salmon Enterprises of Tasmania Pty Ltd
(Refer to note 12 for details of equity interests in the above associates).
(iii) Key Management Personnel:
Directors and other Key Management Personnel also include close members of the families of Directors and other Key Management Personnel.
For
per
sona
l use
onl
y
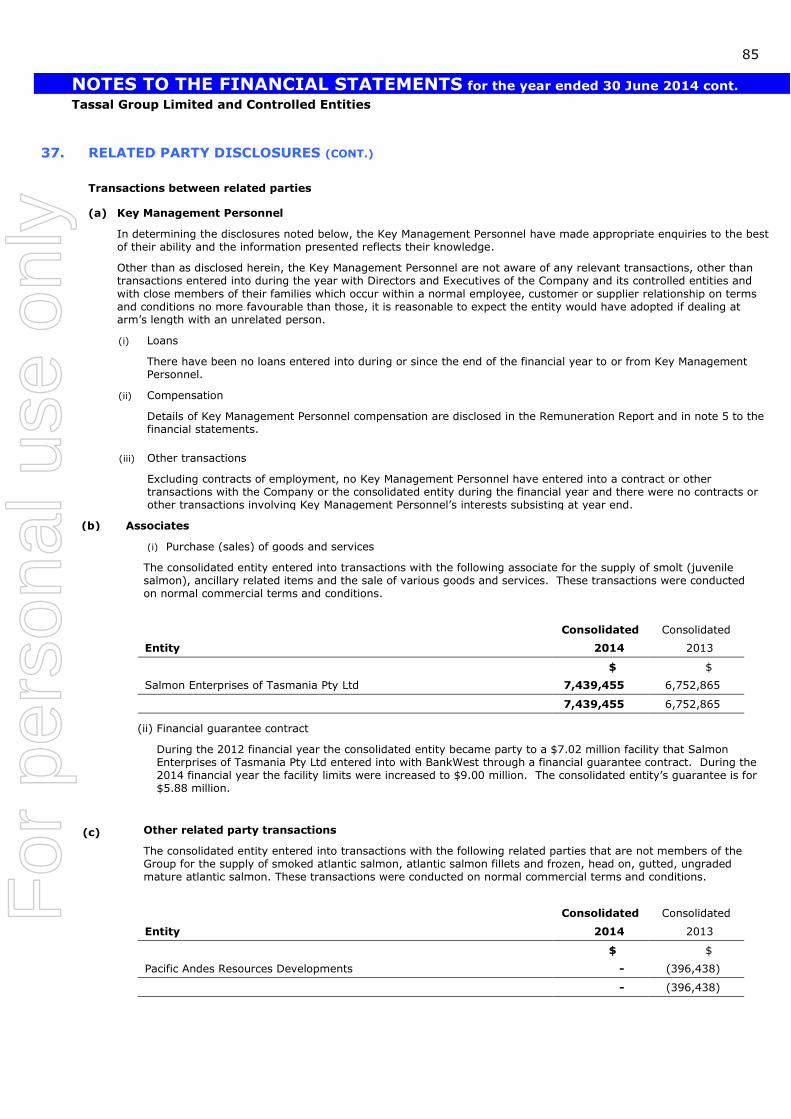
NOTES TO THE FINANCIAL STATEMENTS for the year ended 30 June 2014 cont. Tassal Group Limited and Controlled Entities
85
37. RELATED PARTY DISCLOSURES (CONT.)
Transactions between related parties
(a) Key Management Personnel
In determining the disclosures noted below, the Key Management Personnel have made appropriate enquiries to the best of their ability and the information presented reflects their knowledge.
Other than as disclosed herein, the Key Management Personnel are not aware of any relevant transactions, other than transactions entered into during the year with Directors and Executives of the Company and its controlled entities and
with close members of their families which occur within a normal employee, customer or supplier relationship on terms and conditions no more favourable than those, it is reasonable to expect the entity would have adopted if dealing at arm’s length with an unrelated person.
(i) Loans
There have been no loans entered into during or since the end of the financial year to or from Key Management Personnel.
(ii) Compensation
Details of Key Management Personnel compensation are disclosed in the Remuneration Report and in note 5 to the financial statements.
(iii) Other transactions
Excluding contracts of employment, no Key Management Personnel have entered into a contract or other transactions with the Company or the consolidated entity during the financial year and there were no contracts or other transactions involving Key Management Personnel’s interests subsisting at year end.
(b) Associates
(i) Purchase (sales) of goods and services
(ii) The consolidated entity entered into transactions with the following associate for the supply of smolt (juvenile salmon), ancillary related items and the sale of various goods and services. These transactions were conducted on normal commercial terms and conditions.
(iii)
Consolidated Consolidated
Entity 2014 2013
$ $
Salmon Enterprises of Tasmania Pty Ltd 7,439,455 6,752,865
7,439,455 6,752,865
(iv) (ii) Financial guarantee contract
During the 2012 financial year the consolidated entity became party to a $7.02 million facility that Salmon Enterprises of Tasmania Pty Ltd entered into with BankWest through a financial guarantee contract. During the 2014 financial year the facility limits were increased to $9.00 million. The consolidated entity’s guarantee is for $5.88 million.
(i) ((
(c)
(
Other related party transactions
The consolidated entity entered into transactions with the following related parties that are not members of the Group for the supply of smoked atlantic salmon, atlantic salmon fillets and frozen, head on, gutted, ungraded mature atlantic salmon. These transactions were conducted on normal commercial terms and conditions.
Consolidated Consolidated
Entity 2014 2013
$ $
Pacific Andes Resources Developments - (396,438)
- (396,438)
(i)
For
per
sona
l use
onl
y

NOTES TO THE FINANCIAL STATEMENTS for the year ended 30 June 2014 cont. Tassal Group Limited and Controlled Entities
86
38. NOTES TO THE STATEMENT OF CASH FLOWS
Consolidated 2014
Consolidated 2013
$’000 $’000
(a) For the purposes of the Statement of Cash Flows, cash and cash equivalents includes cash on hand and in banks and short-term deposits at call, net of outstanding bank overdrafts. Cash and cash equivalents as at the end of the financial year as shown in the Statement of Cash Flows is reconciled to the related items in the Statement of Financial Position as follows:
Cash and cash equivalents 7,656 14,998
Bank overdrafts - -
7,656 14,998
(b) Reconciliation of profit for the period to net
cash flows from operating activities:
Profit for the period 41,061 33,457
Depreciation and amortisation of non-current assets 15,469 15,532
Depreciation – impact of allocation to cost of live and processed fish inventories 3,639 2,199
Net (increment)/decrement in biological assets (12,939) (12,256)
Net (increment)/decrement in biological assets at point of harvest (2,113) 2,469
Increase / (decrease) in deferred tax balances 12,286 11,358
Increase / (decrease) in current tax liability 497 1,003
Share of associates’ and jointly controlled entities’ profits (601) (731)
Equity settled share-based payment 737 290
(Increase) / decrease in assets:
Inventories (i) (1,144) 7,612
Biological assets (i) (15,910) (2,268)
Trade and other receivables 5,713 (4,672)
Prepayments (3,444) (1,019)
Other current financial assets 420 (357)
Other non-current financial assets 11 10
Increase / (decrease) in liabilities:
Current trade and other payables 6,807 (1,053)
Other current financial liabilities 16 62
Other current liabilities (429) (3,340)
Current provisions 381 1,270
Non-current provisions 169 152
Net cash provided by operating activities 50,626 49,718
(i) Changes in inventories and biological assets are shown net of the profit impact of
AASB 141 ‘Agriculture’.
For
per
sona
l use
onl
y

NOTES TO THE FINANCIAL STATEMENTS for the year ended 30 June 2014 cont. Tassal Group Limited and Controlled Entities
87
38. NOTES TO THE STATEMENT OF CASH FLOWS (CONT.)
Consolidated
2014
Consolidated
2013
$’000 $’000
(c) Financing facilities
Secured revolving bank overdraft facility subject to annual review and payable at call
- Amount used - -
- Amount unused 12,000 5,500
12,000 5,500
Secured facilities with various maturity dates
- Amount used 24,690 29,807
- Amount unused 17,310 18,193
42,000 48,000
Revolving lease finance facilities subject to annual review with individual lease terms no greater than 10 years
- Amount used 35,278 42,805
- Amount unused 15,722 26,195
51,000 69,000
39. FINANCIAL INSTRUMENTS
(a) Significant accounting policies
Details of the significant accounting policies and methods adopted, including the criteria for recognition, the basis of
measurement and the basis on which income and expenses are recognised, in respect of each class of financial asset, financial liability and equity instrument are disclosed in note 1 to the financial statements.
(b) Financial risk management objectives and derivative financial instruments
The Group’s activities expose it to a variety of financial risks which include operational control risk, market risk (including currency risk, fair value interest rate risk and price risk), credit risk, liquidity risk and cash flow interest rate risk. The Group’s overall risk management program focuses on the unpredictability of the financial markets and seeks to minimise potential adverse effects on the financial performance of the Group.
The consolidated entity enters into a variety of derivative financial instruments to manage its exposure to interest rate and foreign exchange rate risk, including:
forward foreign exchange contracts to hedge the exchange rate risk arising on the purchase and sale of imported and exported supply of salmon; and
interest rate swaps to mitigate the risk of rising interest rates.
The use of financial derivatives is governed by the consolidated entity’s policies approved by the Board of Directors,
which provide written principles on the use of financial derivatives.
The consolidated entity does not enter into or trade financial instruments, including derivative instruments, for speculative purposes.
The Group uses different methods to mitigate different types of risk to which it is exposed. These methods include sensitivity analysis in the case of interest rate and foreign exchange risk and aging analysis for credit risk.
There has not been any material change to the objectives, policies and processes for managing financial risk during the year or in the prior year.
(c) Capital risk management
The consolidated entity manages its capital to ensure that the Group will be able to continue as a going concern while maximising the return to stakeholders through the optimisation of the debt and equity balance.
The capital structure of the consolidated entity consists of debt, which includes the borrowings disclosed in notes 20 and 24, cash and cash equivalents and equity attributable to equity holders of the parent, comprising issued capital, reserves and retained earnings as disclosed in notes 26, 27 and 28 respectively.
Operating cash flows are significantly used to maintain and expand the consolidated entity’s biological asset and property plant and equipment asset base, as well as to make the routine outflows of tax, dividends and timely repayment of maturing debt. The consolidated entity’s policy is to use a mixture of equity and debt funded instruments in order to meet anticipated requirements.
For
per
sona
l use
onl
y

NOTES TO THE FINANCIAL STATEMENTS for the year ended 30 June 2014 cont. Tassal Group Limited and Controlled Entities
88
39. FINANCIAL INSTRUMENTS (CONT.)
Gearing ratio
The Board of Directors review the capital structure on a regular basis and in conjunction with the Group’s formulation of its annual operating plan and strategic plan updates. The Group balances its overall capital structure through the payment of dividends, new shares and borrowings.
The gearing ratio at year end was as follows:
Net debt to equity ratio
Consolidated
2014 $’000
2013
$’000
Financial assets
Debt (i) 60,330 73,073
Cash and cash equivalents (7,656) (14,998)
Net debt 52,674 58,075
Equity (ii) 341,923 315,547
Net debt to equity ratio 15.41% 18.40%
(i) Debt is defined as long and short term borrowings as detailed in notes 20 and 24.
(ii) Equity includes all capital and reserves.
(d) Market risk management
Market risk is the risk of loss arising from adverse movements in observable market instruments such as foreign exchange and interest rates.
The Group enters into a variety of derivative financial instruments to manage its exposure to interest rates and foreign currency risk, including
forward foreign exchange contracts to hedge the exchange risk arising from purchases and sales in foreign currencies [refer note 39 (e)]; and
interest rate swaps, options and collars to partially mitigate the risk of rising interest rates [refer note 39 (f)].
(e) Foreign currency risk management
The consolidated entity undertakes certain transactions denominated in foreign currencies, hence exposures to exchange rate fluctuations arise. Exchange rate exposures are managed within approved policy parameters utilising forward foreign exchange contracts.
Forward foreign exchange contracts
The consolidated entity regularly assesses the need to enter into forward exchange contracts where it agrees to buy
and sell specified amounts of foreign currencies in the future at a pre-determined exchange rate. The objective is to match the contracts with anticipated future cash flows from purchases and sales in foreign currencies, to protect the consolidated entity against the possibility of loss from future exchange rate fluctuations. The forward exchange contracts are usually for no longer than two months.
The consolidated entity enters into forward exchange contracts to hedge all foreign currency plant and equipment
purchase in excess of 250,000 Australian Dollars and regularly assesses the need to hedge foreign exchange sales on a committed basis.
For
per
sona
l use
onl
y

NOTES TO THE FINANCIAL STATEMENTS for the year ended 30 June 2014 cont. Tassal Group Limited and Controlled Entities
89
39. FINANCIAL INSTRUMENTS (CONT.)
(f) Interest rate risk management
The consolidated entity is exposed to interest rate risk as it borrows funds at both fixed and floating interest rates. The risk is managed by the consolidated entity by maintaining an appropriate mix between fixed and floating rate borrowings. Hedging activities are evaluated regularly to align with interest rate views and defined risk appetite; ensuring optimal hedging strategies are applied, by either positioning the statement of financial position or protecting interest expense through different interest rate cycles.
Pursuant to the consolidated entity’s Treasury Policy, the consolidated entity may use interest rate swap
contracts to manage interest rate exposure. Under these contracts, the consolidated entity agrees to exchange the difference between fixed and floating interest amounts calculated on agreed notional principal amounts. Such contracts enable the consolidated entity to mitigate the risk of rising interest rates and debt held.
The following table details the notional principal amounts and remaining terms of interest rate swap contracts outstanding at the end of the reporting period.
Average contracted fixed
interest rate Consolidated notional principal
value Fair value
2014 2013 2014 2013 2014 2013
% % $’000 $’000 $’000 $’000 1 to 3 years 3.39 3.39% 20,000 20,000 (260) (204)
20,000 20,000 (260) (204)
The interest rate swaps and the interest payments on the loan occur simultaneously and the amount accumulated in equity is reclassified to profit or loss over the period that the floating rate interest payments on debt affect profit or loss. Interest rate sensitivity analysis The sensitivity analyses in the following table have been determined based on the exposure to interest rates for both derivative and non-derivative instruments at the reporting date and the stipulated change taking place at the beginning of the financial year and held constant throughout the reporting period. The following table details the consolidated entity’s sensitivity to a 1% increase and decrease in interest rates against the relevant exposures. A positive number indicates an increase in profit or loss where interest rates increase. For a reduction in interest rates against the respective exposures, there would be an equal and opposite impact on the profit or loss and the balances below would be reversed.
Interest rate risk
Consolidated
2014
$’000
2013
$’000
Financial Assets
Cash and cash equivalents 77 150
Total Profit / (Loss) 77 150
(g) Liquidity risk management
Liquidity risk refers to the risk that the consolidated entity or the Company will not be able to meet its financial obligations as they fall due. The consolidated entity and the Company undertake the following activities to ensure that there will be sufficient funds available to meet obligations: prepare budgeted annual and monthly cash flows; measurement and tracking of actual cash flows on a daily basis with comparison to budget on a monthly basis; matching the maturity profile of financial assets and liabilities; and delivering funding flexibility through maintenance of a committed borrowing facility in excess of budgeted usage
levels. Included in note 38 (c) is a summary of additional undrawn facilities that the Group has at its disposal to further reduce liquidity risk.
Liquidity and interest rate tables
The following tables detail the consolidated entity and Company’s expected maturity for its financial assets and contractual maturity for financial liabilities.
For
per
sona
l use
onl
y

NOTES TO THE FINANCIAL STATEMENTS for the year ended 30 June 2014 cont. Tassal Group Limited and Controlled Entities
90
39. FINANCIAL INSTRUMENTS (CONT.)
Fair value hierarchy
Item Fair value as at: Fair value
hierarchy Valuation techniques
30/06/2014 30/06/2013
$’000 $’000 Interest rate swaps
260
204
Level 2
Discounted cash flow. Future cash flows are estimated based on forward interest rates (from observable yield curves at the end of the reporting period) and contract interest rates, discounted at a rate that reflects the credit risk of various counterparties
Consolidated
Average Less than 1 to 5 More than
interest
rate 1 year years 5 years Total
2014 % $'000 $'000 $'000 $'000
Financial assets
Non-interest bearing:
Trade receivables - 3,731 - - 3,731
Other receivables - 3,905 - - 3,905
Other financial assets - 437 - 43 480
Variable interest rate:
Cash and cash equivalents 1.00% 7,656 - - 7,656
Fixed interest rate maturity:
Other financial assets 9.00% 11 28 - 39
15,740 28 43 15,811
Financial liabilities Non-interest bearing: Financial Guarantee - 5,880 - - 5,880
Trade payables - 36,156 - - 36,156
Other payables - 9,943 - - 9,943
Variable interest rate:
Cash advance 2.73% - 24,690 - 24,690
Fixed interest rate maturity: Interest rate swaps 3.39% 260 - - 260
Finance lease liabilities 6.82% 10,789 12,450 - 23,239
Bank loans 4.76% 12,394 - - 12,394
Other loans 8.20% 3 4 - 7
75,425 37,144 - 112,569
The amounts included above for financial guarantee contracts are the maximum amounts the Group would be forced to settle under the arrangement for the full guaranteed amount if that amount is claimed by the counterparty to the guarantee. Based on expectations at the end of the reporting period, the Group considers that it is more likely than not that such an amount will not be payable under the arrangement. However, this estimate is subject to change depending on the probability of the counterparty claiming under the guarantee which is a function of the likelihood that the financial receivables held by the counterparty which are guaranteed suffer credit losses. Fair Value of financial assets and financial liabilities Some of the Group’s financial assets and financial liabilities are measured at fair value at the end of each reporting period. The following table gives information about how the fair value of these financial assets and financial liabilities are determined. F
or p
erso
nal u
se o
nly

NOTES TO THE FINANCIAL STATEMENTS for the year ended 30 June 2014 cont. Tassal Group Limited and Controlled Entities
91
39. FINANCIAL INSTRUMENTS (CONT.)
Consolidated
Average Less than 1 to 5 More than
interest
rate 1 year years 5 years Total
2013 % $'000 $'000 $'000 $'000
Financial assets Non-interest bearing:
Trade receivables - 8,842 - - 8,842
Other receivables - 4,507 - - 4,507
Other financial assets - 857 - 43 900
Variable interest rate: Cash and cash equivalents 1.25% 14,998 - - 14,998
Fixed interest rate
maturity: Other financial assets 9.00% 11 39 - 50
29,215 39 43 29,297
Financial liabilities Non-interest bearing:
Financial Guarantees - 5,880 - - 5,880
Trade payables - 34,533 - - 34,533
Other payables - 8,397 - - 8,397
Variable interest rate: Cash advance 2.87% - 29,807 - 29,807
Fixed interest rate
maturity: Interest rate swaps 3.39% - 204 - 204
Finance lease liabilities 7.44% 13,323 12,585 - 25,908
Bank loans 4.92% 17,348 - - 17,348
Other loans 8.20% 3 7 - 10
79,484 42,603 - 122,087
The amounts included above for financial guarantee contracts are the maximum amounts the Group would be forced to settle under the arrangement for the full guaranteed amount if that amount is claimed by the counterparty to the guarantee. Based on expectations at the end of the reporting period, the Group considers that it is more likely than not that such an amount will not be payable under the arrangement. However, this estimate is subject to change depending on the probability of the counterparty claiming under the guarantee which is a function of the likelihood that the financial
receivables held by the counterparty which are guaranteed suffer credit losses.
(h) Credit risk management
Credit risk refers to the risk that a counterparty will default on its contractual obligations or commitments resulting in financial loss to the consolidated entity. To help manage this risk, the consolidated entity has adopted the policy of only dealing with creditworthy counterparties in accordance with established credit limits and where appropriate obtaining sufficient collateral or other security generally via trade credit insurance arrangements. The overall financial strength of customers is also monitored through publicly available credit information.
The carrying amount of financial assets recorded in the financial statements, net of any allowance for losses, together with the financial guarantee contract as disclosed in Note 37 (b) (ii), represents the consolidated entity’s maximum exposure to credit risk without taking account of the value of any collateral or other security obtained.
The consolidated entity maintains a provision account, described in the Annual Financial Report as an allowance for doubtful debts, which represents the estimated value of specific trade receivables that may not be recovered. A general provision is not maintained. Unallocated receivables are charged to the allowance for doubtful debts account.
For
per
sona
l use
onl
y

NOTES TO THE FINANCIAL STATEMENTS for the year ended 30 June 2014 cont. Tassal Group Limited and Controlled Entities
92
39. FINANCIAL INSTRUMENTS (CONT.)
(i) Fair value of financial instruments
The carrying amount of financial assets and financial liabilities recorded in the financial statements approximates their respective fair values, determined in accordance with the summary of accounting policies disclosed in note 1 to these financial statements and having regard to likely future cash flows.
40. PARENT ENTITY INFORMATION
The accounting policies of the parent entity, which have been applied in determining the financial information shown
below, are the same as those applied in the consolidated financial statements. Refer to note 1 for a summary of the significant accounting policies relating to the Group.
Statement of financial position as at 30 June 2014 Company
2014
Company
2013
$’000 $’000
Current Assets
Trade and other receivables
132,571
131,167
Total Current Assets 132,571 131,167
Non-Current Assets
Other financial assets 28,119 28,119
Deferred tax assets 186 117
Total Non-current Assets 28,305 28,236
Total Assets 160,876 159,403
Current Liabilities
Current tax liability 1,500 1,003
Total Current Liabilities 1,500 1,003
Total Liabilities 1,500 1,003
Net Assets 159,376 158,400
Equity
Issued capital 154,213 154,027
Reserves 1,480 929
Retained earnings 3,683 3,444
Total Equity 159,376 158,400
Statement of comprehensive income as at 30 June 2014 Company
2014
Company
2013
$’000 $’000
Profit for the period 15,383 12,436
Other comprehensive income - -
Total comprehensive income 15,383 12,436 For
per
sona
l use
onl
y

DIRECTORS’ DECLARATION Tassal Group Limited and Controlled Entities
93
DIRECTORS’ DECLARATION
The Directors declare that:
1. In the opinion of the Directors of Tassal Group Limited (the Company):
(a) there are reasonable grounds to believe that the Company will be able to pay its debts as and when they become due and payable;
(b) The attached financial statements are in compliance with International Financial Reporting Standards, as stated in note 1 to the financial statements; and
(c) the attached financial statements and notes set out on pages 44-92 are in accordance with the Corporations Act 2001, including:
(i) giving a true and fair view of the financial position of the consolidated entity as at 30 June 2014 and of their performance, for the year ended on that date; and
(ii) complying with Accounting Standards and the Corporations Act 2001.
2. At the date of this declaration, the Company and its subsidiaries are party to a deed of cross guarantee entered into for the purpose of obtaining for the Company’s subsidiaries the benefit of relief from complying with certain accounting and audit requirements of the Corporations Act granted by ASIC by an order made under subsection 340 (1) of the Corporations Act on 27 June 2006. The order made by ASIC relieves the Company’s subsidiaries from complying with the same provisions of the Corporations Act as they would be relieved from complying with if they satisfied the conditions set out in ASIC Class Order 98/1418. The nature of the deed of cross guarantee is such that each company which is party to the deed guarantees to each creditor of each other company which is party to the deed payment in full of any debt owed by each other company.
In the Directors’ opinion, there are reasonable grounds to believe that the Company and each of its wholly-owned subsidiaries, being the parties to the deed of cross guarantee as detailed in note 34 to the financial statements will, as a group, be able to meet any obligations or liabilities to which they are, or may become, subject by virtue of the deed of cross guarantee.
3. The Directors have been given the declarations required by section 295A of the Corporations Act 2001 from the Chief Executive Officer and Chief Financial Officer for the financial year ended 30 June 2014.
Signed in accordance with a resolution of the Directors made pursuant to section 295(5) of the Corporations Act 2001.
On behalf of the Directors
A. D. McCallum Chairman
Hobart, this 19th day of August 2014
For
per
sona
l use
onl
y

INDEPENDENT AUDITOR’S REPORT Tassal Group Limited and Controlled Entities
94
Independent Auditor’s Report
to the members of Tassal Group Limited Report on the Financial Report
We have audited the accompanying financial report of Tassal Group Limited, which comprises the statement of financial position
as at 30 June 2014, the income statement, the statement of comprehensive income, the statement of cash flows and the statement of changes in equity for the year ended on that date, notes comprising a summary of significant accounting policies and other
explanatory information, and the directors’ declaration of the consolidated entity, comprising the company and the entities it controlled at the year’s end or from time to
time during the financial year as set out on pages 46-93.
Directors’ Responsibility for the Financial Report
The directors of the company are responsible for the preparation of the financial report that gives a true and fair view in accordance with Australian Accounting
Standards and the Corporations Act 2001 and for such internal control as the directors determine is necessary to enable the preparation of the financial report that gives a true and fair view and is free from material misstatement, whether due to fraud or error. In Note 1, the directors also state, in accordance with Accounting Standard
AASB 101 Presentation of Financial Statements, that the financial statements comply with International Financial Reporting Standards.
Auditor’s Responsibility
Our responsibility is to express an opinion on the financial report based on our audit. We conducted our audit in accordance with Australian Auditing Standards. Those
standards require that we comply with relevant ethical requirements relating to audit engagements and plan and perform the audit to obtain reasonable assurance whether the financial report is free from material misstatement.
An audit involves performing procedures to obtain audit evidence about the amounts and disclosures in the financial report. The procedures selected depend on the
auditor’s judgement, including the assessment of the risks of material misstatement of the financial report, whether due to fraud or error. In making those risk
assessments, the auditor considers internal control, relevant to the company’s preparation of the financial report that gives a true and fair view, in order to design audit
procedures that are appropriate in the circumstances, but not for the purpose of expressing an opinion on the effectiveness of the company’s internal control. An audit
also includes evaluating the appropriateness of accounting policies used and the reasonableness of accounting estimates made by the directors, as well as evaluating the
overall presentation of the financial report.
We believe that the audit evidence we have obtained is sufficient and appropriate to provide a basis for our audit opinion.
Auditor’s Independence Declaration
In conducting our audit, we have complied with the independence requirements of the Corporations Act 2001. We confirm that the independence declaration required
by the Corporations Act 2001, which has been given to the directors of Tassal Group Limited, would be in the same terms if given to the directors as at the time of this
auditor’s report.
Opinion
In our opinion:
(a) the financial report of Tassal Group Limited is in accordance with the Corporations Act 2001, including:
(i) giving a true and fair view of the company’s and consolidated entity’s financial position as at 30 June 2014 and of their performance for the year ended on
that date; and
(ii) complying with Australian Accounting Standards and the Corporations Regulations 2001; and
(b) the financial statements also comply with International Financial Reporting Standards as disclosed in Note 1
Report on the Remuneration Report
We have audited the Remuneration Report included in pages 30 to 43 of the directors’ report for the year ended 30 June 2014. The directors of the company are
responsible for the preparation and presentation of the Remuneration Report in accordance with section 300A of the Corporations Act 2001. Our responsibility is to
express an opinion on the Remuneration Report, based on our audit conducted in accordance with Australian Auditing Standards.
Opinion
In our opinion the Remuneration Report of Tassal Group Limited for the year ended 30 June 2014, complies with section 300A of the Corporations Act 2001.
DELOITTE TOUCHE TOHMATSU
Carl Harris
Partner
Chartered Accountants
Hobart, 19 August 2014
Liability limited by a scheme approved under Professional Standards Legislation Member of Deloitte Touche Tohmatsu Limited
Deloitte Touche Tohmatsu ABN 74 490 121 060 Level 8 22 Elizabeth Street Hobart TAS 7000 GPO Box 777 Hobart TAS 7001 Australia Tel: +61 3 6237 7000 Fax: +61 3 6237 7001 www.deloitte.com.au
For
per
sona
l use
onl
y

ADDITIONAL SECURITIES EXCHANGE INFORMATION Tassal Group Limited and Controlled Entities
95
The following additional information is provided in accordance with the ASX Listing Rules as at 31 July 2014.
Number of holder of equity securities
Ordinary share capital (quoted)
146,507,029 fully paid ordinary shares are held by 4,977 shareholders. At a general meeting, every shareholder present in person or by proxy, attorney of representative has one vote on a show of hands and, on a poll, one vote for each fully paid share held.
Performance rights (unquoted)
1,127,010 performance rights granted pursuant to the Company’s Long-term Incentive Plan are held by 14 employees. A performance right to ordinary shares does not entitle a participant under the Plan to voting rights, participation in new issues of securities or to receive dividends. In the event that shares are issued under the Plan at the end of the performance period pursuant to the performance rights, those shares will rank equally with existing ordinary shares, including entitlement to voting rights. Distribution of holders of equity securities
Number of equity securities held Ordinary Shares Performance Rights
No. of holders
No. of shares
% of shares
No. of holders
No. of rights
% of rights
1 – 1,000 1,667 810,106 0.55 - - -
1,001 – 5,000 2,188 5,739,656 3.92 - - -
5,001 – 10,000 608 4,492,384 3.07 - - -
10,001 – 100,000 468 10,742,621 7.33 13 790,501 70.14
100,001 and over 46 124,722,262 85.13 1 336,509 29.86
Rounding 0.00
4,977 146,507,029 100.00 14 1,127,010 100.00
The number of shareholders holding less than a marketable parcel of 125 fully paid ordinary shares on 31 July 2014 is 246 and they hold 4,991 fully paid ordinary shares.
Substantial shareholders
The following organisations have disclosed a substantial shareholder notice to ASX during the financial year.
Name Number of ordinary
shares % of voting power
advised
Allan Gray Australia Pty Ltd 12,137,048 8.28%
National Australia Bank Limited 12,123,795 8.27%
Australian Super Pty Ltd 8,673,188 5.92%
Tribeca Investments Partners Pty Ltd 8,216,424 5.61%
Maple-Brown Abbott Limited (ceasing to be a substantial
shareholder)
7,241,916 4.95%
Pacific Andes Resources Development Limited (ceasing to be a substantial shareholder)
6,799,499 4.64%
Twenty largest holders of quoted ordinary shares
1. J P MORGAN NOMINEES AUSTRALIA LIMITED 40,047,240 27.33
2. HSBC CUSTODY NOMINEES (AUSTRALIA) LIMITED 20,591,069 14.05
3. NATIONAL NOMINEES LIMITED 18,325,042 12.51
4. CITICORP NOMINEES PTY LIMITED 11,970,172 8.17
5. QUALITY FOOD (SINGAPORE) PTE LIMITED 6,799,499 4.64
6. BNP PARIBAS NOMS PTY LTD <DRP> 4,548,433 3.10
7.RBC INVESTOR SERVICES AUSTRALIA NOMINEES
PTY LIMITED <MBA A/C>4,028,355 2.75
8. MIRRABOOKA INVESTMENTS LIMITED 2,700,000 1.84
9. ARGO INVESTMENTS LIMITED 2,500,000 1.71
10.WARBONT NOMINEES PTY LTD <ACCUMULATION
ENTREPOT A/C>2,275,992 1.55
11. AMCIL LIMITED 1,125,000 0.77
12. BRAZIL FARMING PTY LTD 900,000 0.61
13. CATHOLIC CHURCH INSURANCE LIMITED 630,000 0.43
14. HUMANA PTY LTD <NEKON SUPER FUND A/C> 613,735 0.42
15. QIC LIMITED 517,586 0.35
16.RBC INVESTOR SERVICES AUSTRALIA NOMINEES
PTY LIMITED <GSAM A/C>512,296 0.35
17. GOWING BROS LIMITED 475,000 0.32
18. AMP LIFE LIMITED 457,855 0.31
19. UBS NOMINEES PTY LTD 353,094 0.24
20.HSBC CUSTODY NOMINEES (AUSTRALIA) LIMITED-
GSCO ECA352,930 0.24
119,723,298 81.72
26,783,731 18.28
Totals: Top 20 holders of ORDINARY FULLY PAID SHARES (TOTAL)
Total Remaining Holders Balance
Rank Name Units % of Units
On-market buy-back
There is no current on-market buy-back.
For
per
sona
l use
onl
y