alpargatasri.alpargatas.com.br/arquivos/informacoes_investidores/cobertura... · coming years,...
TRANSCRIPT

March 10, 2017 | Company Update
Alpargatas
Brazil | Outperform
Chasing Global – Resuming Coverage With an Outperform
With this report we are resuming coverage of Alpargatas with an outperform recommendation and a YE17 fair value of BRL 15.5/share. Management’s 2020 goals imply a transformation of its international operations, which could unlock sizable revenue and EBITDA growth in the years to come.
Alpargatas’s efforts to divest from assets with suboptimal returns will likely contribute to superior performance in Brazil, particularly if coupled with the expected recovery in the consumer environment.
The international operations are set to undergo significant changes that could lead to robust volume growth and richer operating margins if well executed.
We rate Alpargatas an outperform given the ~30% upside potential to our DCF-based fair-value and its compelling 13.5x YE17 P/E, as this multiple is quite discounted relative to the company’s retail peers.
Focusing on the core. The company’s recent sale of certain sporting goods assets and the non-renewal of some licensing agreements are just two examples of how Alpargatas is shifting course to focus on assets that are generating higher returns. These moves will likely allow for a greater focus on execution for Havaianas in Brazil while reducing the company’s FX volatility for its remaining sporting goods assets in Brazil (Mizuno). With a recovery in Brazilian consumption expected for 2018, we expect the company to see a recovery in sandals volume coupled with operating margin expansion in the coming years as operating leverage kicks in.
International operations revamp. Not much has changed since the new controlling shareholder took over, except at the company’s international division. At its last annual investor day, management unveiled a new plan to strengthen the company’s relationships in key regions in Asia/Pacific and Latin America, instead of treating them solely as “export destinations”. We used Brazilian SECEX numbers and United Nations global trade data for rubber-sandal volumes to gauge Alpargatas’s current export position and opportunities. We believe that the company could expand its international sandal volumes at a 15% CAGR from 2016 to 2020, increasing the contribution of the international operations to 23% of total sales and 35% of EBITDA by 2020 (up from 16% and 23%, respectively, at YE16).
A “show-me” story with the surprise potential skewed to the upside. We believe that the biggest risk to our investment thesis lies in the execution of Alpargatas’s plan to deliver on its 2020 goals. The company’s recent track record could be considered lackluster, dampening investors’ interest in the name. However, if our estimates hold water and 2017 brings the initial signals of a recovery in Brazil and an acceleration in the growth of the international operations, the upside potential is compelling, given that Alpargatas is currently trading at an attractive 13.5x YE17 P/E, below the average of its retail peers. Moreover, while our assumptions for the international operations are constructive, they are not as optimistic as the company’s 2020 goals – which could render our estimates conservative if management manages to meet its objectives. Our DCF-based YE17 fair value of BRL 15.5/share is derived from our forecast for a 19% net income CAGR over the next four years, driven by a combination of accelerating revenue growth and operating margin expansion, pushed by the international operations.
Estimates and Valuation
Years 2015a 2016e 2017e 2018e 2019e 2020e Net revenues (BRL m) 4,059 4,013 4,123 4,572 5,047 5,612 EBITDA (BRL m) 563 591 584 708 856 1,017 Net income (BRL m) 286 361 413 507 604 713 Net debt (BRL m) 184 -118 -287 -343 -410 -449 EPS 0.61 0.77 0.88 1.08 1.28 1.52 FCFE (BRL m) 400 512 393 362 456 547 EV/EBITDA 10.2 9.2 9.0 7.4 6.0 5.0 P/E 19.4 15.4 13.4 10.9 9.2 7.8 FCFE yield (%) 7.2 9.2 7.1 6.5 8.2 9.9 DPS (BRL ) 0.2 0.3 0.5 0.6 0.8 1.1 Dividend yield (%) 1.8 2.7 4.0 5.5 7.0 9.1 P/BV 2.9 2.6 2.4 2.2 2.1 1.9
Source: Itaú BBA
Ticker (local) ALPA4
Fair Value - BRL(YE17) 15.5
Stock Data
Current price BRL 11.80
Upside (YE17) % 31.4
52 Week high/low BRL 12.5/7.28
Shares outstanding th 470,450
Market capitalization BRL m 5,551
3-mth avg daily vol. BRL m 6
Performance (%) 1m 12m
Absolute 13.9 52.6
Vs. Ibovespa 14.1 15.8
Company x Ibovespa
90
110
130
150
170
Feb-
16
Mar
-16
Apr-1
6
May
-16
Jun-
16
Jul-1
6
Aug-
16
Sep-
16
Oct
-16
Nov
-16
Dec
-16
Jan-
17
IBOV ALPA4 Source: Itaú BBA
Please refer to page 14 of this report for important disclosures, analyst certifications and additional information. Itaú BBA does and seeks to do business with Companies covered in this research report. As a result, investors should be aware that the firm may have a conflict of interest that could affect the objectivity of this report. Investors should not consider this report as the sole factor in making their investment decision. Itaú Corretora de Valores S.A. is the securities arm of Itaú Unibanco Group. Itaú BBA is a registered mark used by Itaú Corretora de Valores S.A.
Ruben Couto, CNPI +55-11-3073-3014 [email protected] Thiago Macruz, CNPI +55-11-3073-3034 [email protected] Marco Calvi +55-11-3073-3016 [email protected]
CONSUMER TEAM

Alpargatas – March 10, 2017
Investment Summary
With this report we are resuming coverage of Alpargatas with an outperform recommendation and a YE17 fair value of BRL 15.5/share, implying ~30% upside potential. Our constructive stance toward Alpargatas is based on the company’s recent strategic shift, which was ushered in, in part, by its new controlling shareholder. In our view, the revamped approach to Havaianas’s international presence could unlock a sizable revenue and EBITDA venue that was previously dormant.
We split our investment thesis into three parts: i) a quick update on Alpargatas’s investment story, which includes the ownership change that has led to a greater focus on international operations; ii) our take on Alpargatas’s new global strategy; and iii) the current state of the Brazil operations that account for the bulk of Alpargatas’s value.
While management hasn’t changed over the last year, the same can’t be said of the strategic guidelines coming from the company’s board. Since J&F took over (in November 2015), the board has been reshuffled and the mindset on Alpargatas’s international business has changed materially. Moreover, over the past year, we have witnessed the company’s divestiture of assets running at losses, the cancellation of suboptimal licensing agreements and a renewed focus on international expansion. We briefly discuss each of these changes in page 3.
Alpargatas is now paving the way for a major expansion of its international presence. The company’s international division, which is focused on sandals and represents ~16% of total sales and ~23% of EBITDA, is undergoing a strategic overhaul. For the more established U.S. and Europe operations, we expect to see some tweaks, but the most significant change is likely to arise in regions that were previously handled by the Exports operation. By strengthening its direct relationships in key regions in Asia/Pacific and Latin America, Alpargatas expects to greatly boost its sandal volumes. On pages 6-9 we show our analysis of Brazilian SECEX numbers and United Nations global trade data. We believe that the company could increase its international sandal volumes at a ~15% CAGR from 2016-20, bringing the contribution of the international operations up to ~23% of total sales and ~35% of EBITDA by 2020.
In Brazil, the diminished focus on the sporting category is expected to allow management to focus on the Havaianas business and to prepare for the expected recovery in the consumer environment come 2018. The gradual maturation of the company’s new plant is expected to lead to marginal gross-margin gains in the coming years, allowing it to increase marketing expenses and capture the potential rebound in consumption. Moreover, given the sale of Topper and Rainha, we expect the volatility stemming from Mizuno’s imports to decline, further contributing to a more stable and profitable P&L for the Brazil operations. Please see pages 10-11 for details.
In our view, the caveat in our investment thesis for Alpargatas is execution. The company’s recent track record has been lackluster, as indicated by the stagnant bottom line in the 2011-15 stretch. During this period, some strategic missteps (such as a sandal capacity bottleneck and a lack of export diversification) combined with Brazil’s recession led to volatile results that drove investors away. While we acknowledge that the present strategic guidelines are pointing the right way, we are still a couple of quarters away, in our view, from seeing consistent results. The company’s 2020 guidance, which seems feasible, might be challenged by the market, turning Alpargatas into a “show-me” story.
Notwithstanding the execution risks, we believe that Alpargatas’s risk-reward balance is skewed to the upside. According to our estimates, which factor in the company meeting part of its 2020 goals, Alpargatas is likely to post a ~19% earnings CAGR over the next four years. This constructive bottom-line trend would be chiefly driven by a growing contribution from the international operations, especially in the form of higher margins, coupled with a recovery in Brazil, both of which could begin to pick up from 2018 on. If our forecasts hold water, Alpargatas could achieve a ROIC north of 20% (from ~14% in YE16) by 2019, an expectation which, combined with the attractive 13.5x YE17 P/E and ~30% upside potential to our DCF-based fair value, supports our outperform rating.
Itaú BBA
2

Alpargatas – March 10, 2017
Catching Up With Alpargatas
In the early 2010s, a period in which the company had a comfortable net cash position, management was a big advocate of M&A to fulfill the board’s vision of accelerating growth through brands that were complementary to its core businesses: footwear, apparel and accessories. However, Alpargatas’s story took a turn when the company’s controlling ownership was sold to J&F Holding in November 2015. Camargo Corrêa sold its controlling stake to J&F (44% of total capital) for a total of BRL 2.7 billion.
Even prior to the change in controlling ownership, Alpargatas was funneling its business into the lines that have been generating returns above its cost of capital. As the chart below on the left shows, Alpargatas has trimmed the number of brands it manages over the past few years.
Alpargatas – Focusing on Core and Profitable Brands Alpargatas – Current Shareholder Structure
86%
10% 4%
ALPA3
J&F Silvio Tini Treasury Free Float
21%
11%
3%65%
ALPA4
54%11%
2%
33%
Total Capital
Source: Alpargatas Source: Alpargatas
After previously managing more than a dozen brands, Alpargatas has recently been focusing on its big four: Havaianas/Dupé for sandals, Mizuno and Topper Argentina for sporting goods, Osklen for lifestyle apparel and Sete Leguas for professional rubber boots. Alpargatas achieved the now-concentrated brand portfolio through key corporate actions over the past 18 months:
i) Sale of Topper/Rainha businesses in Brazil. In May 2016 Alpargatas concluded the sale of Topper/Rainha to Sforza Group for BRL ~49 million, including all the brands’ business in Brazil except for the factories. Both assets had been running at losses since at least 2012. In our view, this move not only reduces Alpargatas’s exposure to the more challenging sporting goods category but also frees up production capacity to enable some production for Mizuno to be done in Brazil, reducing FX pressures.
ii) Partial sale of Topper Argentina. The Sforza deal also included the sale of 20% of Topper’s assets in Argentina. The deal closing is expected for 2H17, but we see this as an initial move that could lead to the full divestment of the company’s assets in Argentina. However, there is nothing further planned in the short term.
iii) Not renewing Timberland license. Alpargatas decided to not renew its Timberland licensing agreement with VF Corporation in 2016 to focus on Mizuno as its core sports footwear brand.
We believe that these moves are an important indication that previous market concerns over the company’s capital allocation (it was constantly flirting with M&A’s) are behind us. Instead, the current controlling shareholder seems to be steering the company toward its international presence, demanding that management find ways to increase Havaianas sales across the globe. This is one of the paths for the company to meet the constructive 2020 guidance unveiled at its last annual investors day in December 2016 (see chart below).
Itaú BBA
3

Alpargatas – March 10, 2017
Alpargatas – 2020 Guidance vs. 2016e and Recent Historical Peak
2020 Goal 2016e Recent Peak (Year)
Sandals total volume (BZ + Int') 320 million pairs ~250 million pairs ~253 million pairs (2014)
Int' share in Sandals Sales ~40% ~26% 29.5% (2015)
Consolidated EBITDA Margin 19-21% 14.7% 17.9% (2010)
ROCE >23% ~16% ~24% (2010)
Source: Alpargatas
In a nutshell, Alpargatas’s 2020 guidance implies major sandal volume growth (6.4% CAGR in 2016-2020), which also entails a boost in operating margin coming from a richer sales mix (sandals yield higher margins than sporting footwear). However, the big statement in the company’s 2020 plan is the level of contribution coming from the international operations, which is expected to contribute 40% of total sandal sales, up from the current 26%. In our view, this supports our perception that the current controlling shareholder is encouraging top management to accelerate its international expansion.
Lastly, Alpargatas’ goal of reaching a ROCE above 23% also suggests that the company is focusing on the businesses with higher returns. We see this change in narrative – from a company that was a brand manager pursuing M&A to a brand manager focusing on making its core brand (Havaianas) a global powerhouse – as positive. We explore the company’s international opportunity in greater detail below.
Havaianas Global: Looking for an Edge
Brazil ranks as one of the world’s biggest shoe manufacturers, producing more than 1 billion pairs in 2013, distributed among sandals, sporting, fashion and other types of footwear. Brazil is also the only non-Asian country that figures in the top-five world producers (see chart below). More interestingly, when looking at shoe exporters across the globe, Brazil fares much worse, ranking as the 14th largest exporter – equivalent to only 1% of global exports (see chart below). This data from Abicalçados/World Shoe Review shows just how big Brazilian shoe consumption is, and just how small the country’s relative importance is in the world’s footwear trade.
Main Footwear-Producing Countries (Millions of Pairs) Main Footwear-Exporting Countries (Millions of Pairs)
Country 2012 2013 2014China 10,610 11,353 11,693
India 2,350 2,480 2,579
Brazil 999 1,036 998Vietnam 735 779 854
Indonesia 688 695 715
Nigeria 372 384 393
Pakistan 235 237 245
Mexico 270 266 240
Thailand 221 221 222
Italy 198 202 197
Others 2,142 2,229 1,982
WORLD 18,820 19,882 20,118
Country 2012 2013 2014China 8,294 8,667 8,780
Vietnam 454 490 569
Indonesia 338 344 354
Belgium 201 196 228
Germany 175 185 227
Italy 214 220 215
India 148 152 165
Netherlands 138 156 162
Spain 132 140 158
UK 112 141 155
Brazil (14º) 113 133 129Others 1,135 1,177 1,180
WORLD 11,454 12,001 12,322
Source: WSR/Abicalçados Source: WSR/Abicalçados
The heavy concentration of Asia/Pacific countries among the top footwear exporters comes as no surprise. Over the past few decades, several major global companies have switched their production capacity to suppliers in the region, seeking to attain the lower production costs derived from cheaper labor. As a result, Brazil and non-Asian countries became less and less competitive from a cost perspective, limiting their share of global exports. However, we believe this is where brand makes a difference.
Itaú BBA
4
Alpargatas – March 10, 2017
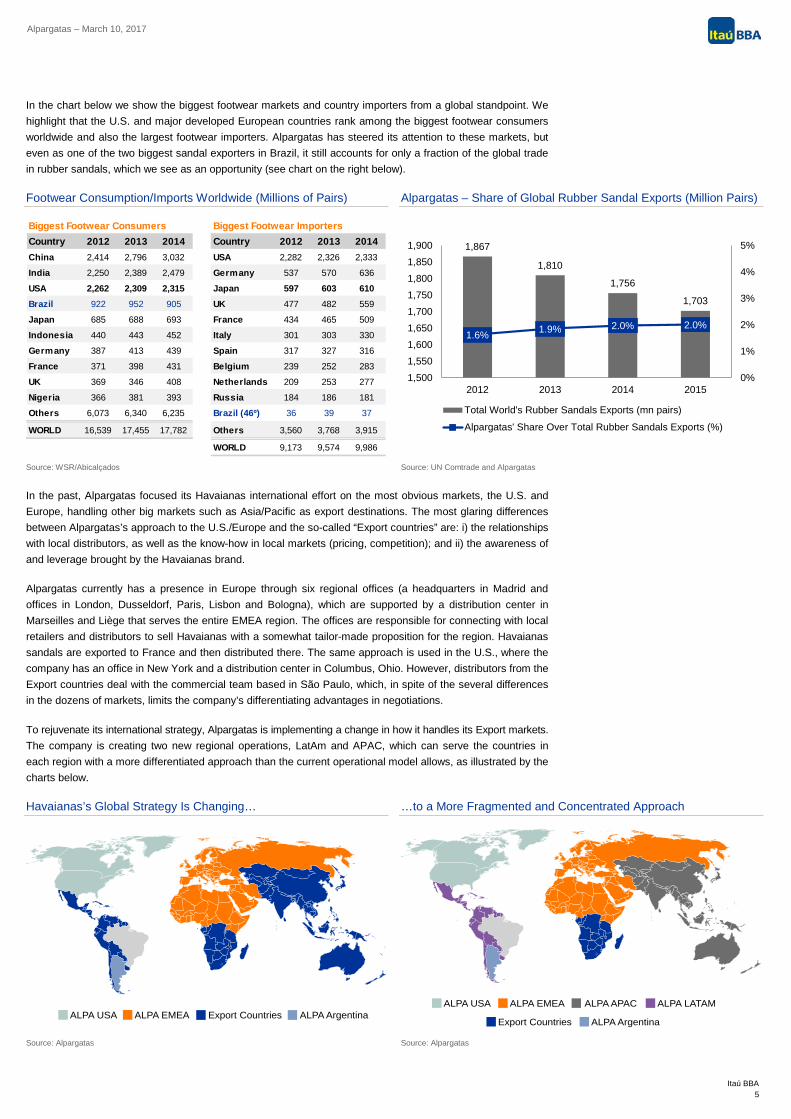
In the chart below we show the biggest footwear markets and country importers from a global standpoint. We highlight that the U.S. and major developed European countries rank among the biggest footwear consumers worldwide and also the largest footwear importers. Alpargatas has steered its attention to these markets, but even as one of the two biggest sandal exporters in Brazil, it still accounts for only a fraction of the global trade in rubber sandals, which we see as an opportunity (see chart on the right below).
Footwear Consumption/Imports Worldwide (Millions of Pairs) Alpargatas – Share of Global Rubber Sandal Exports (Million Pairs)
Biggest Footwear Consumers Biggest Footwear ImportersCountry 2012 2013 2014 Country 2012 2013 2014China 2,414 2,796 3,032 USA 2,282 2,326 2,333
India 2,250 2,389 2,479 Germany 537 570 636
USA 2,262 2,309 2,315 Japan 597 603 610Brazil 922 952 905 UK 477 482 559
Japan 685 688 693 France 434 465 509
Indonesia 440 443 452 Italy 301 303 330
Germany 387 413 439 Spain 317 327 316
France 371 398 431 Belgium 239 252 283
UK 369 346 408 Netherlands 209 253 277
Nigeria 366 381 393 Russia 184 186 181
Others 6,073 6,340 6,235 Brazil (46º) 36 39 37
WORLD 16,539 17,455 17,782 Others 3,560 3,768 3,915
WORLD 9,173 9,574 9,986
1,867
1,810
1,756
1,703
1.6% 1.9% 2.0% 2.0%
0%
1%
2%
3%
4%
5%
1,5001,5501,6001,6501,7001,7501,8001,8501,900
2012 2013 2014 2015
Total World's Rubber Sandals Exports (mn pairs)
Alpargatas' Share Over Total Rubber Sandals Exports (%)
Source: WSR/Abicalçados Source: UN Comtrade and Alpargatas
In the past, Alpargatas focused its Havaianas international effort on the most obvious markets, the U.S. and Europe, handling other big markets such as Asia/Pacific as export destinations. The most glaring differences between Alpargatas’s approach to the U.S./Europe and the so-called “Export countries” are: i) the relationships with local distributors, as well as the know-how in local markets (pricing, competition); and ii) the awareness of and leverage brought by the Havaianas brand.
Alpargatas currently has a presence in Europe through six regional offices (a headquarters in Madrid and offices in London, Dusseldorf, Paris, Lisbon and Bologna), which are supported by a distribution center in Marseilles and Liège that serves the entire EMEA region. The offices are responsible for connecting with local retailers and distributors to sell Havaianas with a somewhat tailor-made proposition for the region. Havaianas sandals are exported to France and then distributed there. The same approach is used in the U.S., where the company has an office in New York and a distribution center in Columbus, Ohio. However, distributors from the Export countries deal with the commercial team based in São Paulo, which, in spite of the several differences in the dozens of markets, limits the company’s differentiating advantages in negotiations.
To rejuvenate its international strategy, Alpargatas is implementing a change in how it handles its Export markets. The company is creating two new regional operations, LatAm and APAC, which can serve the countries in each region with a more differentiated approach than the current operational model allows, as illustrated by the charts below.
Havaianas’s Global Strategy Is Changing… …to a More Fragmented and Concentrated Approach
ALPA USA ALPA EMEA Export Countries ALPA Argentina
ALPA USA ALPA EMEA ALPA APAC ALPA LATAM
Export Countries ALPA Argentina
Source: Alpargatas Source: Alpargatas
Itaú BBA
5

Alpargatas – March 10, 2017
Seeking to gauge Alpargatas’s potential to boost Havaianas sales abroad as well as its recent track record, we scrutinized data from Brazil’s Foreign Trade System (SECEX) and United Nations Trade Statistics. Given rubber sandals’ commoditized nature, we are able to assess volumes based on its HS commodity code (640220 - rubber/plastic footwear, straps fix to sole by plug), measuring how much is exported from Brazil as well as the world’s biggest importers of the commodity.
Moreover, Brazil’s sandal market is effectively a duopoly dominated by Alpargatas and Grendene. Because the sandal factories are located in different states, we are able to get accurate export figures for both companies. The chart below shows Alpargatas’s reported figures for sandal exports and SECEX data for sandals exported from Paraíba, Pernambuco and Minas Gerais (where Alpargatas’ plants are located). Save for 2012, the disparity between Alpargatas’s reported figures and the SECEX data is minimal, allowing us to measure the company’s export performance on a monthly basis with some degree of confidence.
Alpargatas Sandals Exports – Reported vs. SECEX Data Alpargatas International Volumes Performance (YoY Growth)
2628
3034 35 34
2628
33 3336 35
0
5
10
15
20
25
30
35
40
2010 2011 2012 2013 2014 2015
Mill
ion
Pairs
Reported Data Secex Data
2012 2013 2014 2015 2016eInternational 32.8 33.4 35.6 35.0 29.6
YoY% 1.9% 6.6% -1.7% -15.5%US 3.2 2.3 3.8 2.9 2.8
YoY% -30.0% 69.8% -24.4% -2.8%EMEA 7.6 6.8 9.2 10.5 12.1
YoY% -10.4% 35.4% 15.1% 15.0%Exports 22.0 24.3 22.6 21.5 14.6
YoY% 10.8% -7.2% -4.7% -32.1%
Source: Alpargatas and SECEX Source: SECEX
As shown in the chart above, Export countries have represented roughly 65% of Alpargatas’s international sandal volumes and have also been the culprit for much of the division’s recent weakness in sales volumes. Most recently, Argentina and Angola, two countries that combined represented ~18% of total Export volumes in 2015, had exports interrupted in 2016 due to different circumstances. To avoid a concentration of exports in a few countries is one of the reasons why management is establishing a new operating model for exports in 2017.
Weak Export Volume Even Excluding Problematic Markets Argentina and Angola Are Big Markets for Exports
15%
-11%
0%
-5%
11%
-7% -5%
-32%
-40%
-30%
-20%
-10%
0%
10%
20%
2013 2014 2015 2016e
YoY%
Exports (ex-Argentina/Angola) Exports
2012 2013 2014 2015 2016eInternational 32.8 33.4 35.6 35.0 29.6
YoY% 1.9% 6.6% -1.7% -15.5%Argentina 3.0 1.7 2.2 2.6 0.1
YoY% -43.1% 27.3% 20.9% -95.4%Share of total Int' Volume 9.2% 5.1% 6.1% 7.5% 0.4%
Angola 4.1 5.6 5.2 3.6 0.0 YoY% 34.9% -6.9% -30.5% -99.9%Share of total Int' Volume 12.6% 16.7% 14.6% 10.3% 0.0%
Source: SECEX Source: SECEX
In order to partly meet its goal of 320 million pairs of sandals by 2020 in Brazil and abroad, we estimate that Alpargatas will have to almost double its output to international markets, to roughly 50 million pairs from the current 30 million. To achieve this, we estimate, the company will have to simultaneously: i) restore export volumes to their 2012-13 levels and then increase them further though the adoption of the new LatAm and APAC operating model; ii) more than double U.S. volumes from the stagnant level of the past couple of years; and iii) maintain its healthy double-digit growth in EMEA.
Itaú BBA
6
Alpargatas – March 10, 2017
In our view, the biggest opportunities lie in the expansion and development of the APAC and LatAm operations and in achieving stable volume growth in the U.S. market. Below we present our views on these two initiatives, while conservatively assuming that Alpargatas will maintain low-double-digit volume growth in EMEA, at a CAGR of 10% over the next four years, compared with the 12.6% CAGR achieved in 2012-16e.
LatAm/APAC Are Already Significant Markets That Will Benefit From Increased Focus
Even when Alpargatas addressed the LatAm/APAC regions from a distance, through distribution arrangements with distributors, both destinations were quite important to the company’s international expansion volumes. Based on SECEX data, we show below the company’s volumes aggregated by country in the LatAm and APAC regions.
LatAm and APAC Volumes Make Up a Major Portion of Alpargatas’s Exports
2012 2013 2014 2015 2016eInternational Sandals 32.8 33.4 35.6 35.0 29.6
YoY% 1.9% 6.6% -1.7% -15.5%LATAM 10.2 10.1 8.7 8.3 6.7
YoY% -1.4% -14.0% -4.4% -19.2%Share of total Int' Volume 31.2% 30.2% 24.4% 23.7% 22.6%
APAC 6.8 7.9 7.9 8.7 6.9 YoY% 10.8% -7.2% -4.7% -32.1%Share of total Int' Volume 20.6% 23.7% 22.2% 25.0% 23.3%
Source: SECEX
In our view, the increase in dedicated teams to support the LatAm and APAC regions can be expected to give Alpargatas a better understanding of each market’s particularities, allowing it to improve its commercial, marketing and distribution strategies and become more competitive while reducing its overdependence on a few countries (such as Argentina within LatAm). By maintaining a more active presence, we believe, Alpargatas can better implement expansion strategies that might include a different go-to-market approach and new formats of operation such as joint ventures in some countries.
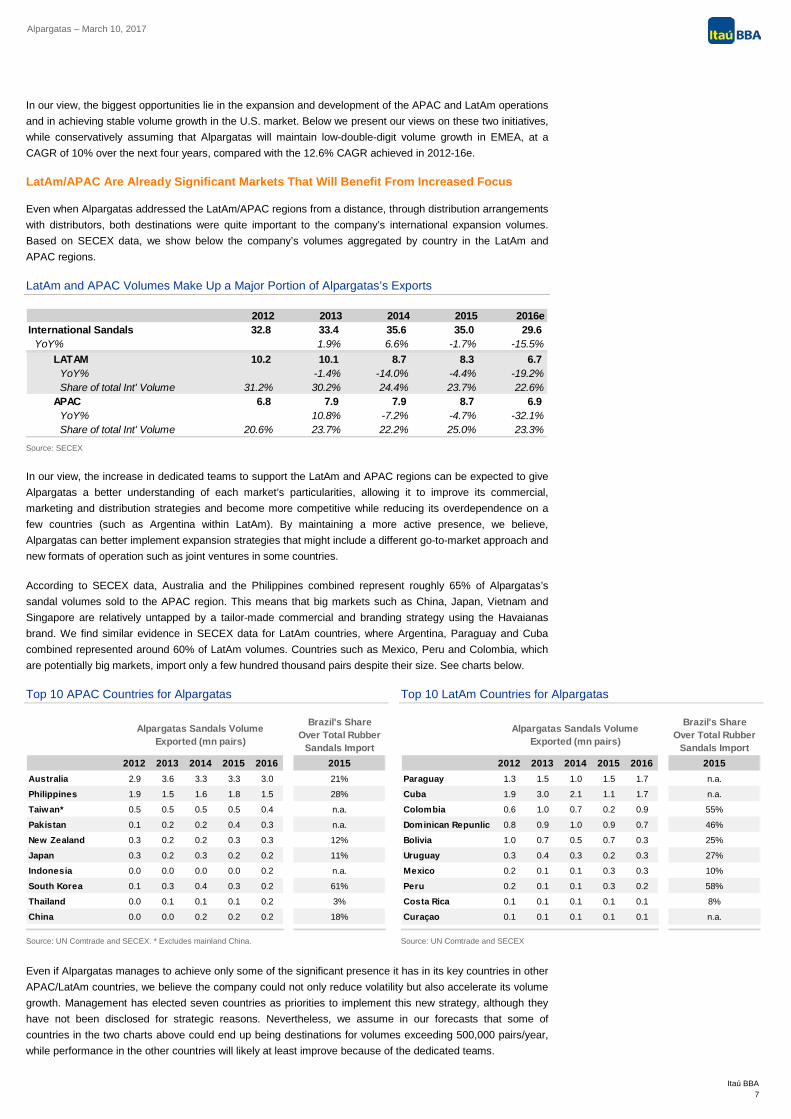
According to SECEX data, Australia and the Philippines combined represent roughly 65% of Alpargatas’s sandal volumes sold to the APAC region. This means that big markets such as China, Japan, Vietnam and Singapore are relatively untapped by a tailor-made commercial and branding strategy using the Havaianas brand. We find similar evidence in SECEX data for LatAm countries, where Argentina, Paraguay and Cuba combined represented around 60% of LatAm volumes. Countries such as Mexico, Peru and Colombia, which are potentially big markets, import only a few hundred thousand pairs despite their size. See charts below.
Top 10 APAC Countries for Alpargatas Top 10 LatAm Countries for Alpargatas
Brazil's Share Over Total Rubber
Sandals Import2012 2013 2014 2015 2016 2015
Australia 2.9 3.6 3.3 3.3 3.0 21%
Philippines 1.9 1.5 1.6 1.8 1.5 28%
Taiwan* 0.5 0.5 0.5 0.5 0.4 n.a.
Pakistan 0.1 0.2 0.2 0.4 0.3 n.a.
New Zealand 0.3 0.2 0.2 0.3 0.3 12%
Japan 0.3 0.2 0.3 0.2 0.2 11%
Indonesia 0.0 0.0 0.0 0.0 0.2 n.a.
South Korea 0.1 0.3 0.4 0.3 0.2 61%
Thailand 0.0 0.1 0.1 0.1 0.2 3%
China 0.0 0.0 0.2 0.2 0.2 18%
Alpargatas Sandals Volume Exported (mn pairs)
Brazil's Share Over Total Rubber
Sandals Import2012 2013 2014 2015 2016 2015
Paraguay 1.3 1.5 1.0 1.5 1.7 n.a.
Cuba 1.9 3.0 2.1 1.1 1.7 n.a.
Colombia 0.6 1.0 0.7 0.2 0.9 55%
Dominican Repunlic 0.8 0.9 1.0 0.9 0.7 46%
Bolivia 1.0 0.7 0.5 0.7 0.3 25%
Uruguay 0.3 0.4 0.3 0.2 0.3 27%
Mexico 0.2 0.1 0.1 0.3 0.3 10%
Peru 0.2 0.1 0.1 0.3 0.2 58%
Costa Rica 0.1 0.1 0.1 0.1 0.1 8%
Curaçao 0.1 0.1 0.1 0.1 0.1 n.a.
Alpargatas Sandals Volume Exported (mn pairs)
Source: UN Comtrade and SECEX. * Excludes mainland China. Source: UN Comtrade and SECEX
Even if Alpargatas manages to achieve only some of the significant presence it has in its key countries in other APAC/LatAm countries, we believe the company could not only reduce volatility but also accelerate its volume growth. Management has elected seven countries as priorities to implement this new strategy, although they have not been disclosed for strategic reasons. Nevertheless, we assume in our forecasts that some of countries in the two charts above could end up being destinations for volumes exceeding 500,000 pairs/year, while performance in the other countries will likely at least improve because of the dedicated teams.
Itaú BBA
7

Alpargatas – March 10, 2017
We expect these improvements to surface in a more pronounced manner from 2018 on, while we already expect some SG&A pressures to appear as early as 2017. All in, we are forecasting volume CAGRs of 16.9% and 15.7% for the LatAm and APAC regions, respectively, from YE17 to YE20.
Success in the U.S. Market Will Require Strengthening Havaianas Brand Equity Differentiation From Chinese Products
In the U.S. market, management expects to achieve double-digit volume growth in the coming years, largely by doing business differently than it has previously. In the U.S. market, rubber flip-flops are more popular in beach lifestyle regions such as California and Florida, where they are used more as casual wear. In our view, this marks a difference from the more formal/fashion association in Europe, where Havaianas’s “Made in Brazil” appeal works so well. Nevertheless, rubber flip-flop use in the U.S. has become widespread, with big companies such as Nike dominating the market with a wide assortment of product styles and prices.
While we lack precise data to measure how big the U.S. market is and how Alpargatas’s Havaianas are faring there, the country’s import trade data for rubber/plastic footwear tells us enough. The U.S. is by far the world’s biggest footwear importer, having imported more than 2 billion footwear pairs every year since 2013 according to WSR/Abicalçados. Out of this 2 billion imported pairs, roughly 5%-6%, or ~130 million pairs/year, are rubber/plastic footwear, according to UN trade data. What’s even more striking is that Brazil’s rubber footwear exports to the U.S. represent only ~3% of this total 130 million pair/year, with imported goods from China accounting for the large majority (~96%).
Brazil Has Only a Fraction of U.S. Rubber Footwear Import Market Rubber Footwear FOB Prices in Exports to U.S. – Brazil vs. China
139
129127 125
1232.0%
3.5%
2.6%
3.9%
3.2%
0%1%1%2%2%3%3%4%4%5%
115
120
125
130
135
140
145
2011 2012 2013 2014 2015
Mill
ion
Pairs
US Rubber Footwear Imports Brazil share of US imports
1.44 1.55 1.55 1.57 1.60
3.263.07
2.74 2.73 2.84
0
0.5
1
1.5
2
2.5
3
3.5
2011 2012 2013 2014 2015
FOB
/pai
r (U
S$)
China Brazil
Source: UN Comtrade and SECEX Source: UN Comtrade and SECEX
While the U.S. is a big market, we acknowledge the difficulty of changing course in the current competitive landscape. To more than double its U.S. sandal volumes in the coming years, Alpargatas will have to overcome the flood of low-priced Chinese products by building around its brand equity in the region. According to UN Comtrade data, Chinese rubber footwear has commanded an average FOB price of USD 1.5/pair in the U.S. over the past few years, compared to Brazil’s USD 3/pair. However, this is where we believe Havaianas could gain the upper hand over the Chinese products.
Alpargatas already deploys plenty of the Brazilian culture’s vibrancy in its marketing strategy to conquer the European market and attain a global identity. This alone has allowed the brand to position itself well ahead other emerging-market brands in terms of pricing (Havaianas’s price point begins in the USD 15 range). This added cultural dimension, which appeals to developed-market countries, can hardly be reproduced by Chinese manufacturers, in our view. Thus, we believe that Alpargatas has to focus on further brand-building strategies (e.g., a stronger digital presence) to strengthen the Havaianas brand and grab share from local competitors such as Nike while differentiating itself from Chinese products.
We expect Alpargatas to adopt a competitive pricing/product strategy in the U.S. going forward, likely keeping prices flat for the coming years. Moreover, we believe that the company will adopt a commercial structure similar to the one in place in Europe, with several commercial hubs distributed throughout the U.S., seeking to adapt better to the country’s various regions. While we expect volume growth to accelerate in response to these initiatives, it is likely to put some pressure on the international division’s SG&A as well.
Itaú BBA
8

Alpargatas – March 10, 2017
All in, we forecast that Alpargatas’s volume to the U.S. will expand at a 29% CAGR until 2020, reaching a total of 7.8 million pairs, up from the current ~3 million. Nevertheless, we believe this part of the company’s international expansion could prove to be the most challenging. The U.S. market is packed with big domestic and established brands aside from imports that could make meeting our ~8 million pair forecast a very difficult feat to achieve.
Our Forecasts for International Operations Imply an Additional ~22 Million Pairs by 2020
Taking all the above into consideration, we estimate that Alpargatas’s international sandal volume will expand at a 15% CAGR in 2017-20, totaling 52 million pairs by 2020 (from the ~30 million expected for 2016). The chart below summarizes our forecasts by region, and shows the evolution required from past performance. It is worth noting that the 2015-16 figures are somewhat blurred as a result of the issues in Angola and Argentina, so we believe that 35 million pairs/year is a more normalized level to depart from.
Alpargatas’s International Sandals Volume Forecasts (Millions of Pairs)
2012 2013 2014 2015 2016e 2017e 2018e 2019e 2020eInternational Sandals 32.5 33.2 35.4 34.9 29.6 33.7 38.6 44.6 52.0
YoY% 2.1% 6.6% -1.3% -15.3% 13.9% 14.6% 15.5% 16.6%US 3.2 2.3 3.8 2.9 2.8 3.6 4.7 6.1 7.8
YoY% -30.0% 69.8% -24.4% -2.8% 28.9% 29.0% 29.0% 29.0%EMEA 7.8 6.9 9.4 10.8 12.3 13.6 14.9 16.5 18.2
YoY% -11.6% 36.1% 15.4% 14.2% 10.0% 10.1% 10.2% 10.3%LATAM 10.2 10.1 8.7 8.3 6.7 7.8 9.1 10.6 12.5
YoY% -1.4% -14.0% -4.4% -19.2% 16.2% 16.6% 17.1% 17.6%APAC 6.8 7.9 7.9 8.7 6.9 7.8 8.9 10.4 12.3
YoY% 17.2% -0.2% 10.6% -21.2% 13.0% 14.4% 16.3% 19.0%Exports 4.5 6.1 5.6 4.2 0.8 0.9 1.0 1.1 1.2
YoY% 34.0% -7.5% -25.3% -80.0% 9.1% 9.4% 9.9% 10.7%
Source: SECEX and Itaú BBA
We expect the company to keep prices flat in the U.S. and Europe for the next couple of years, with only gradual increases in the other regions. As a result, we assume minor price increases in our 2017-18 forecasts, with an acceleration from 2019 on. All in, the combination of these estimates with our constructive volume assumption yields a forecast for international sandal revenues to grow at a robust 19% CAGR in 2017-20.
Our estimates would bring international sandals to represent 35% of Alpargatas’ total sandal revenue, slightly behind management’s guidance of 40% but well above the present ~26% share in 2016e. However, we do forecast some EBITDA-margin expansion for the company’s international division, which should contribute to a richer margin mix.
Our constructive volume assumptions imply some fixed-cost dilution, particularly in the ramp-up of new factories, which would provide marginal gains to international sandals’ gross margins (to around 72% from the current 69%). Moreover, we expect the division’s revenue growth to also yield some scale gains in SG&A, although at a smoother pace, as we expect a hike in expenses during 2017 due to the expansion of dedicated teams in the APAC/LatAm and U.S. markets. All in, we forecast an EBITDA margin expansion to 30% (from 21%) for the international operations, which would have a positive effect on consolidated profitability, given Brazil’s lower margins.
Itaú BBA
9

Alpargatas – March 10, 2017
A Growing International Sandal Share… …Leads to a Richer Margin Mix
14% 16% 16% 17% 18% 20% 23%
0%10%20%30%40%50%60%70%80%90%
100%
2014
A
2015
A
2016
E
2017
E
2018
E
2019
E
2020
E
Rev
enue
Mix
(%)
Brazil Argentina International Sandals
18%
23% 21%19%
21%25%
27%
0%
5%
10%
15%
20%
25%
30%
2014
A
2015
A
2016
E
2017
E
2018
E
2019
E
2020
E
EBIT
DA
Mar
gin
(%)
Brazil Argentina International Sandals
Source: Itaú BBA Source: Itaú BBA
We are cognizant that FX volatility and oil prices (the bulk of Havaianas’s raw materials are linked to oil/gas chain prices) could present risks to both the downside and the upside. But the company’s volume of imports and payments in foreign currency was greater than the volume of exports/receipts also in foreign currency in 2016. Nevertheless, with a growing share from international operations we believe Alpargatas could become a net USD exporter in the coming years.
Alpargatas in Brazil: Focusing on the Core
We share management’s view that the true winners in the footwear market are those companies that dress their customers from top to bottom. Take a look at what Nike managed to accomplish when it went beyond being a footwear company and became a global powerhouse by entering bigger markets such as apparel and accessories. However, there are few brand extension examples like Nike’s, and Alpargatas’s management seems to agree – a pick-up in Havaianas flip flops and an extension to other sandal-format products will continue to be the key growth driver in Brazil.
According to management, Havaianas commands a little bit more than 50% of Brazil’s flip-flop market, which coupled with the product’s low average ticket has helped the company to withstand Brazil’s steep recession. Out of the Brazilian retail companies under our coverage, Alpargatas figures among a handful that did not show a sales decline of more than 2% in any year during the 2012-16e stretch. In fact, Alpargatas’s management attributes the stagnant sales in Brazil over the past two years to some execution missteps related to capacity restrictions and its go-to-market strategy rather than to the state of the country’s economy.
Alpargatas – Sandal Production Capacity Alpargatas – Brazil Volume Evolution and Forecast for Sandals
0
50
100
150
200
250
300
350
400
450
2011 2012 2013 2014 2015 2016E2017E2018E2019E2020E
Sand
als
(mn
pairs
)
Total Capacity Total Sales
Montes Claros Plant 2020
Goal
0
50
100
150
200
250
300
2011 2012 2013 2014 2015 2016E 2017E 2018E 2019E 2020E
Sand
als
(mn
pairs
)
Source: Alpargatas Source: Alpargatas and Itaú BBA
As shown in the charts above, Alpargatas’s recent capacity increase, from the new Montes Claros factory introduced in 2014, has provided sufficient room for the company to chase its goal of 320 million pairs sold annually by 2020. We estimate that the company will have to invest somewhat in further capacity by 2018, and much more to operate with some margin of safety. Nonetheless, the sudden drop in volumes witnessed in 2014 (see chart on the right) is quite unlikely to be repeated, as the company is ready to accommodate
Itaú BBA
10

Alpargatas – March 10, 2017
growing domestic demand as Brazil’s GDP recovers. Our macro team forecasts 1.0% GDP growth in 2017, followed by an acceleration to 4.0% growth by 2018. We expect Alpargatas’s sandal volume growth in Brazil to follow suit, with 1.4% YoY growth in 2017 and 6% in 2018.
Besides the greater stability coming from Havaianas, which will likely translate to improved gross margins from present levels, we expect further cost improvements from the changes being made in production for Mizuno. As stated earlier in this report, the divestment of the Topper and Rainha brands is allowing Alpargatas’s plants dedicated to sporting goods to steer all their capacity to Mizuno.
Previously, the majority (~90%) of Mizuno sales were imports, which caused a big disruption in the company’s commercial strategy. With the steep BRL depreciation, management had to adjust Mizuno prices abruptly to cope with rising costs. This happened at precisely the wrong time, when the competition was slashing prices to preserve volumes. Seeking to protect itself from such externalities, Alpargatas managed to cut back the share of Mizuno’s imported goods to 23% as of 4Q16 (see chart below).
Mizuno’s Production Is Now Chiefly Sourced Locally
10%33% 38%
60%77%
90%67% 62%
40%23%
0%
20%
40%
60%
80%
100%
2015 1Q16 2Q16 3Q16 4Q16
Miz
uno
Prod
uctio
n
Domestic Production Imports
Source: Alpargatas
We acknowledge that sporting goods’ share of total Brazil sales will diminish going forward with the sale of Topper/Rainha. Alleviating the FX issues for Mizuno also contributes to reducing the number of problems that management has to fix, ultimately leaving more time and energy for the company’s core product (Havaianas). We see Osklen in the same way: it is still going through a turnaround, but the fact that it is still being managed as a separate company is not a bad thing, at least for now.
Estimates, Valuation and Rating
Below we share our key estimates for sales, EBITDA and net income, with a breakdown among the Brazil, International and Argentina operations. Our expected 5.6% net revenue CAGR for YE16-YE19 largely reflects accelerating revenue growth coming from the international operations, as discussed throughout this report. At the operating level, we expect the consolidated EBITDA margin to climb steadily over the coming years as a result of operating margin expansion in both the Brazil and international operations, partly offset by narrower margins in Argentina.
Alpargatas – Net Revenue Estimates Alpargatas – EBITDA Estimates
2,393 2,373 2,576 2,691 2,876 3,048
644 1,019 791 733 860 977501667 645 700
8351,023
0
1,000
2,000
3,000
4,000
5,000
6,000
2014A 2015A 2016E 2017E 2018E 2019E
Net
Rev
enue
s (B
RL
mill
ion)
Brazil Argentina International
315 272 351 378 459 52572 140
103 7171
80
91150 137 135
178
25113.5% 13.9%
14.7% 14.2%15.5%
17.0%
0%2%4%6%8%10%12%14%16%18%
0100200300400500600700800900
2014A 2015A 2016E 2017E 2018E 2019E
Con
solid
ated
EB
ITD
A M
g. (%
)
EBIT
DA
(BR
L m
illio
n)
Brazil Argentina International
Source: Itaú BBA Source: Itaú BBA
Itaú BBA
11

Alpargatas – March 10, 2017
The EBITDA margin improvement in Brazil will likely be chiefly due to faster growth in sandals relative to sporting goods, but it will also reflect ongoing gross margin recovery, as there is still significant idle capacity -- particularly in the new Montes Claros plant – to be filled. That said, EBITDA margins in Brazil are expected to stabilize near the 20% level, as we expect Alpargatas to continue to incur marketing expenses, which would limit efficiency gains. Based on this set of assumptions and our margin forecast for the international operations, described on page 9, we forecast a gradual consolidated EBITDA margin expansion to 18%, near the bottom of the company’s target range of 19%-20%.
In accordance with our constructive expectations for operating improvements in the coming years, we forecast significant bottom-line growth in the coming years. According to our numbers, Alpargatas is likely to deliver a ~19% CAGR for the bottom line over the next four years on a combination of EBITDA growth and improving financial results, which would offset a rising income tax rate. The financial results are expected to improve as a result of a growing cash position, as the company is not able to increase its payout further due to its fiscal incentives.
Alpargatas still benefits from reduced federal taxes (income taxes) through fiscal incentives in the form of lower sales tax rates (ICMS) granted by states in the Northeast, where most of its plants are located. We acknowledge that given Brazil’s fiscal issues and ongoing structural adjustment, these benefits are subject to significant changes, but for now we are leaving these assumptions unchanged going forward. Should the company lose these tax benefits, it would likely have a substantial impact to our EBITDA and net income estimates, as the benefits account for ~30% of our EBITDA forecast and ~50% of our net income forecast.
In addition, the profit generated from these fiscal benefits is not allowed to be distributed as dividends, a requirement that holds the company’s payout far below 100% even though it is generating more cash than it needs to fund the upcoming expansion. Nevertheless, we expect Alpargatas to distribute the majority of its “distributable” dividends. Given the fact that the tax benefits only apply to the Brazil operations and the growth of the international operations is likely to outpace that of Brazil, we expect a rising income tax rate and a growing payout in the coming years. The chart below shows our net income and payout estimates.
Alpargatas – Net Income and Payout Estimates
285 286361 413
507604
0%10%20%30%40%50%60%70%80%90%
0
100
200
300
400
500
600
700
2014A 2015A 2016E 2017E 2018E 2019E
Net
Inco
me
(BR
L m
illio
n)
Net Income Payout (%)
Source: Itaú BBA
Considering all the above, we are setting our YE17 fair value for Alpargatas at BRL 15.5/share (up from our prior YE16 fair value of BRL 10/share) after factoring into our model the company’s recent quarterly results and our more upbeat view on Alpargatas’s potential recovery in Brazil and its international operations, as described over the last pages. Some of the fair value increase was also the result of new forecasts from our macro team and our new cost-of-equity assumption (now at 13.6%, vs. 14.6% previously).
Based on our calculations, Alpargatas’s preferred shares (ALPA4) offer ~30% upside potential to our DCF-based fair value (assuming 4.5% growth in perpetuity), a level which, coupled with the attractive YE17 P/E of 13.6x, supports our outperform recommendation. In our view, the biggest risk for our investment thesis lies in execution. We see the company’s brand equity as one of its core assets, and the execution of its strategy in Brazil and its aggressive international expansion plan as its greatest challenge.
Itaú BBA
12

Alpargatas – March 10, 2017
Alpargatas – Full Financials
P&L (BRLmn) 2015A 2016E 2017E 2018E 2019E 2020E MARGINS 2015A 2016E 2017E 2018E 2019E 2020E
NET REVENUES 4,059 4,013 4,123 4,572 5,047 5,612 SG&A as % of Net Sales 33.7% 33.1% 34.5% 33.8% 33.5% 33.2%
COGS (2,326) (2,198) (2,222) (2,425) (2,614) (2,846) GROSS MARGIN 42.7% 45.2% 46.1% 47.0% 48.2% 49.3%
GROSS PROFIT 1,732 1,815 1,901 2,147 2,433 2,766 OPERATING MARGIN 9.0% 12.2% 11.6% 13.2% 14.8% 16.1%
SG&A Expenses (1,367) (1,326) (1,422) (1,545) (1,688) (1,864) EBITDA MARGIN 13.9% 14.7% 14.2% 15.5% 17.0% 18.1%
OPERATING INCOME (EBIT) 365 489 479 602 745 902 NET MARGIN 7.0% 9.0% 10.0% 11.1% 12.0% 12.7%
Depreciation & amortization 102 104 104 106 111 115
Adj. EBITDA (Co Def.) 563 591 584 708 856 1,017 RETURNS 2015A 2016E 2017E 2018E 2019E 2020E
Financial Result (57) (56) (25) (11) (6) (2) EBIT (1-t) 241 323 316 397 492 595
FX Variation + Other (4) (27) 0 0 0 0 Capital Employed 2,116 1,985 2,005 2,146 2,288 2,448
Equity Income 0 0 0 0 0 0 ROCE (EBIT) 11.3% 15.7% 15.8% 19.1% 22.2% 25.1%
EARNINGS BEFORE TAXES 304 406 454 591 739 900 Invested Capital 2,321 2,161 2,181 2,321 2,463 2,623
Income Tax & Contributions (28) (47) (40) (89) (141) (193) ROIC 10.4% 14.4% 14.6% 17.7% 20.6% 23.4%
Minorities Participation 9 2 0 5 5 6 WACC 13.6% 13.6% 13.6% 13.6% 13.6% 13.6%
NET INCOME (control. Shareholders) 286 361 413 507 604 713 ROIC/WACC 0.8 1.1 1.1 1.3 1.5 1.7
ROE 14.2% 17.9% 18.8% 21.2% 23.3% 25.5%BALANCE SHEET 2015A 2016E 2017E 2018E 2019E 2020E
Cash 488 635 804 860 926 966 MOMENTUM 2015A 2016E 2017E 2018E 2019E 2020E
Accounts Receivable 884 800 822 911 1,006 1,119 Revenues Grow th 14.7% -1.1% 2.8% 10.9% 10.4% 11.2%
Inventories 634 537 543 593 639 696 EBIT Grow th 3.6% 33.9% -2.0% 25.7% 23.7% 21.1%
Other Assets ST 203 184 189 209 231 257 EBITDA Grow th 17.7% 5.0% -1.3% 21.3% 20.9% 18.8%
Other Assets LT 140 147 147 147 147 147 Earnings Grow th 0.3% 26.2% 14.6% 22.7% 19.0% 18.1%
FIXED ASSETS 1,415 1,379 1,379 1,432 1,483 1,535 TOTAL ASSETS 3,763 3,681 3,884 4,152 4,433 4,719 MULTIPLES 2015A 2016E 2017E 2018E 2019E 2020E
Financing ST 495 184 184 184 184 184 Share Price (hist avg / closing) BRL 11.8 BRL 11.8 BRL 11.8 BRL 11.8 BRL 11.8 BRL 11.8
Suppliers 438 371 375 409 441 481 Market Cap (R$m) 5,551 5,551 5,551 5,551 5,551 5,551
Other Liabilities ST 377 368 378 415 455 502 Net Debt 184 (118) (287) (343) -409.8 -449.4
Financing LT 177 333 333 333 333 333 EV 5,736 5,433 5,264 5,208 5,142 5,102
Other Liabilities LT 345 322 322 322 322 322 EV/EBITDA 10.2 9.2 9.0 7.4 6.0 5.0
SHAREHOLDERS' EQUITY 1,931 2,103 2,292 2,489 2,698 2,897 EV/EBIT 15.7 11.1 11.0 8.6 6.9 5.7 TOTAL LIABILITIES & EQUITY 3,763 3,681 3,884 4,152 4,433 4,719 P/E 19.4 15.4 13.4 10.9 9.2 7.8
PEG ratio 66.1 0.6 0.9 0.5 0.5 0.4DEBT SITUATION 2015A 2016E 2017E 2018E 2019E 2020E P/CF 14.3 12.0 10.7 9.1 7.8 6.7
TOTAL FINANCIAL DEBT 673 517 517 517 517 517 EV/Sales 1.4 1.4 1.3 1.1 1.0 0.9
Cash 488 635 804 860 926 966 P/BV 2.9 2.6 2.4 2.2 2.1 1.9
TOTAL NET DEBT 184 -118 -287 -343 -410 -449
Net f in exp / EBITDA -10.0% -9.5% -4.3% -1.6% -0.7% -0.2% Target Price R$/Share
Net Debt to Equity 9.6% -5.6% -12.5% -13.8% -15.2% -15.5% Upside %
Net Debt to Total Capitalization 8.7% -6.0% -14.3% -16.0% -17.9% -18.4% Total Return %
Net Debt/EBITDA 0.33 -0.20 -0.49 -0.49 -0.48 -0.44Multiples at Target 2015A 2016E 2017E 2018E 2019E 2020E
CASH FLOW 2015A 2016E 2017E 2018E 2019E 2020E Target Price R$/share BRL 15.5 BRL 15.5 BRL 15.5 BRL 15.5 BRL 15.5 BRL 15.5
Operating Income (EBIT) 365 489 479 602 745 902 Target Mcap 7,292 7,292 7,292 7,292 7,292 7,292
Depreciation 102 104 104 106 111 115 Net Debt 184 (118) (287) (343) (410) (449)
EBITDA 563 591 584 708 856 1,017 EV 7,476 7,174 7,005 6,949 6,882 6,843
Income Taxes (28) (47) (40) (89) (141) (193) EV/EBITDA 13.3 12.1 12.0 9.8 8.0 6.7
Working Capital 47 125 (20) (88) (91) (109) EV/EBIT 20.5 14.7 14.6 11.5 9.2 7.6
Operating Cash Flow 583 669 523 532 624 716 P/E 25.5 20.2 17.6 14.4 12.1 10.2
Capex (126) (100) (105) (159) (163) (167) P/CF 18.8 15.7 14.1 11.9 10.2 8.8
Operating Free Cash Flow 457 568 419 373 462 550 EV/Sales 1.8 1.8 1.7 1.5 1.4 1.2
Net Interest Expenses (57) (56) (25) (11) (6) (2)
FCFE (before ∆ Debt) 400 512 393 362 456 547FCFE Yield (FCFE yield) 7.2% 9.2% 7.1% 6.5% 8.2% 9.9%
2015A 2016E 2017E 2018E 2019E 2020E Operating Data 2015A 2016E 2017E 2018E 2019E 2020E
Shares Fully Diluted (m) 470.4 470.4 470.4 470.4 470.4 470.4 Sandals Volume (mn) 237.1 250.8 258.1 276.6 292.6 310.4
EPS 0.6 0.8 0.9 1.1 1.3 1.5 Brazil 202.9 221.2 224.4 238.0 248.0 258.3
BVPS 4.1 4.5 4.9 5.3 5.7 6.2 International 34.2 29.6 33.7 38.6 44.6 52.1
Cash Flow 387.5 464.3 517.8 613.1 714.8 828.3
CFPS 0.8 1.0 1.1 1.3 1.5 1.8 EBITDA Margin (%) 13.9% 14.7% 14.2% 15.5% 17.0% 18.1%
Dividend / Interest on Equity 98.9 147.9 224.4 305.1 389.5 507.9 Brazil 11.5% 13.6% 14.0% 15.9% 17.2% 18.5%
DPS 0.2 0.3 0.5 0.6 0.8 1.1 US, Europe & Exports 22.5% 21.2% 19.2% 21.3% 24.6% 27.3%
Dividend Yield 1.8% 2.7% 4.0% 5.5% 7.0% 9.1% Argentina 13.8% 13.1% 9.7% 8.3% 8.2% 6.0% Source: Alpargatas and Itaú BBA
Itaú BBA
13

Alpargatas – March 10, 2017
DISCLAIMER Itaú BBA is a brand name of Itaú Corretora de Valores S.A.
Ratings: Definitions, Dispersion and Banking Relationships
Ratings (1) Definition (2) Coverage (3) Banking Relationship (4)
Outperform The analyst expects the stock to perform better than market average. 52% 49%
Market Perform The analyst expects the stock to perform in line with market average. 40% 37%
Underperform The analyst expects the stock to perform below market average. 8% 8%
1. The ratings used herein (Outperform, Market Perform and Underperform) correspond approximately to Buy, Hold and Sell,respectively.
2. Ratings reflect the analyst’s assessment of the stock price performance in the medium term compared with market average.Recommendations will remain valid until the analyst changes the rating, which may happen as a result of news or simply due toa change in the stock price (there is no defined time horizon). Companies are grouped into industries, according to theirsimilarities. The industries are: (i) Banking & Financial Services, (ii) Consumer Goods & Retail + Food & Beverage, (iii)Healthcare + Education, (iv) Steel & Mining + Pulp & Paper, (v) Oil, Gas & Petrochemicals + Agribusiness, (vi) Real Estate, (vii) Telecommunications, Media and Technology, (viii) Transportation, Manufacturing and Logistics, (ix) Utilities, and (x) EquityStrategy.
3. Percentage of companies covered by Itaú Corretora de Valores S.A. within this rating category.
4. Percentage of companies within this rating category, for which Itaú Unibanco S.A. or any of its affiliated companies providedinvestment banking services over the last 12 (twelve) months, or which may be provided during the next 3 (three) months.
Third Party Disclosures
Companies Mentioned Ticker Recent Price Disclosure Items
1 2 3 4 5 6 Alpargatas PN ALPA4 11.80 -
1. Itaú Corretora de Valores S.A. and/or its affiliated companies have managed or co-managed a public offer for the companiesanalyzed in this report in the last 12 (twelve) months, for which they received compensation.
2. Itaú Corretora de Valores S.A. and/or its affiliated companies received compensation for the investment banking servicesprovided to the companies analyzed in this report in the last 12 (twelve) months, and expect to receive or intend to seekcompensation for such services to be provided to companies analyzed in this report in the next 3 (three) months.
3. Itaú Corretora de Valores S.A. and/or its affiliated companies were acting as market makers for the companies analyzed in this report at the time this report was issued.
4. Itaú Corretora de Valores S.A. and/or its affiliated companies have acted as an underwriter of securities issued by thecompanies analyzed in this report within the last 5 (five) years.
5. Itaú Corretora S.A. and/or its affiliated companies, and funds, portfolios and investment clubs managed by Itaú Corretora deValores S.A. beneficially own, directly or indirectly, 1% (one percent) or more of any class of common shares issued by thecompanies analyzed in this report as of the end of last month.
6. The analyzed issuer(s) have a relevant interest in companies of the Itaú Unibanco Group.
Alpargatas PN
15-D
ec
0.0
2.0
4.0
6.0
8.0
10.0
12.0
Aug-
15
Sep-
15
Oct
-15
Nov
-15
Dec
-15
Jan-
16
Feb-
16
Mar
-16
Apr-1
6
May
-16
Jun-
16
Jul-1
6
Aug-
16
Sep-
16
Oct
-16
Nov
-16
Dec
-16
Jan-
17
Feb-
17
Underperform Market Perform Outperform UR ALPA4 Fair Value
Source: Itaú BBA
Itaú BBA 14

Alpargatas – March 10, 2017
Relevant Information
1. This report has been produced by Itaú Corretora de Valores S.A (“Itaú BBA”), a subsidiary of Itaú Unibanco S.A., regulated by the Securities and Exchange Commission of Brazil (CVM), and distributed by Itaú BBA or one of its affiliates (altogether, “Itaú Unibanco Group”). Itaú BBA is the brand name used by Itaú Corretora de Valores S.A., by its affiliates or by other companies of the Itaú Unibanco Group.
2. This report aims at providing information only and does not constitute, and should not be construed as an offer to buy or sell, or a solicitation of an offer to buy or sell any financial instrument, or to participate in any particular trading strategy in any jurisdiction. The information herein is believed to be reliable as of the date on which this report was issued and has been obtained from public sources believed to be reliable. Itaú Unibanco Group does not make any express or implied representation or warranty as to the completeness, reliability or accuracy of such information, nor does this report intend to be a complete statement or summary of the investment strategies, markets or developments referred to herein. Opinions, estimates, and projections expressed herein constitute the current judgment of the analyst responsible for the substance of this report as of the date on which it was issued and are, therefore, subject to change without notice. Prices and availability of financial instruments are indicative only and subject to change without notice. Itaú Unibanco Group has no obligation to update, modify or amend this report and inform the reader accordingly, except when terminating coverage of the issuer of the securities discussed in this report.
3. The analyst responsible for the production of this report, whose name is highlighted in bold, hereby certifies that the views expressed herein accurately and exclusively reflect his or her personal views and opinions about any and all of the subject issuers or securities and were prepared independently and autonomously, including from Itaú BBA, Banco Itaú BBA S.A and other group companies. Because personal views of analysts may differ from one another, Itaú BBA, its subsidiaries and affiliates may have issued or may issue other reports that are inconsistent with, and/or reach different conclusions from, the information presented herein. The analyst responsible for the production of this report is not registered and/or qualified as a research analyst with the NYSE or FINRA and is not associated with Itau BBA USA Securities, Inc. and, therefore, may not be subject to Rule 2711 restrictions on communications with a subject company, public appearances and trading securities held by a research analyst account.
4. An analyst’s compensation is determined based upon the total revenues of Itaú BBA, a portion of which is generated through investment banking activities. Like all employees of Itaú BBA, its subsidiaries and affiliates, analysts receive compensation that is linked to global earnings. Therefore, analyst’s compensation can be considered to be indirectly related to this report. However, the analyst responsible for the content of this report hereby certifies that no part of his or her compensation was, is, or will be directly or indirectly related to any specific recommendation or opinion herein or linked to the pricing of any of the securities discussed herein. Itaú Unibanco Group and the funds, portfolios and securities investment clubs managed by Itaú Unibanco Group may have a direct or indirect stake equal to no more than 1% (one percent) of the capital stock of the companies, and may have been involved in the acquisition, sale or trading of such shares in the market.
5. The financial instruments discussed in this report may not be suitable for all investors. This report does not take into account the investment objectives, financial situation or particular needs of any particular investor. Investors wishing to purchase or otherwise deal in the securities covered in this report should obtain relevant documents relating to the financial instruments and exchanges and confirm their contents. Investors should obtain independent financial advice based on their own particular circumstances before making an investment decision based on the information herein. Final decision on investments must be made by each investor considering various risks, fees and commissions. If a financial instrument is denominated in a currency other than an investor’s currency, changes in exchange rates may adversely affect the price or value of, or the income derived from the financial instrument, and the reader of this report assumes all foreign exchange risks. Income from financial instruments may vary, and therefore their price or value may rise or fall, either directly or indirectly. Past performance does not necessarily indicate future results, and no representation or warranty, express or implied, is made herein regarding future performance. Itaú Unibanco Group does not accept any liability whatsoever for any direct or consequential loss arising from the use of this report or its content, and the investor using this report undertakes to irrevocably exempt the Itaú Unibanco Group from any claims, complaints and/or demands.
6. This report may not be reproduced or redistributed to any other person, in whole or in part, for any purpose, without the prior written consent of Itaú BBA. Additional information on the financial instruments discussed in this report is available upon request.
7. As required by the Brazilian Securities and Exchange Commission rules, the analysts responsible for this report indicate potential conflict situations in the table below of “Relevant Information”.
Additional Note to reports distributed in: (i) U.K. and Europe: The sole purpose of this material is to provide information only, and it does not constitute or should be construed as a proposal or request to enter into any financial instrument or to participate in any specific business strategy. The financial instruments discussed in this material may not be suitable for all investors, and are directed solely at Eligible Counterparties and Professionals as defined by the Financial Conduct Authority. This material does not take into consideration the objectives, financial situation or specific needs of any particular client. Clients must obtain financial, tax, legal, accounting, economic, credit and market advice on an individual basis, based on their personal characteristics and objectives, prior to making any decision based on the information contained herein. By accessing the material, you confirm that you are aware of the laws in your jurisdiction relating to the provision and sale of financial service products. You acknowledge that this material contains proprietary information and you agree to keep this information confidential. Itau BBA International plc (IBBAInt) exempts itself from any liability for any losses, whether direct or indirect, which may arise from the use of this material, from its content and is under no obligation to update the information contained in this document. Additionally, you confirm that you understand the risks related to the financial instruments discussed in this material. Due to international regulations not all financial instruments/services may be available to all clients. You should be aware of and observe any such restrictions when considering a potential investment decision. Past performance and forecast are not a reliable indicator of future results. The information contained herein has been obtained from internal and external sources and is believed to be reliable as of the date in which this material was issued, however IBBAInt does not make any representation or warranty as to the completeness, reliability or accuracy of information obtained by third parties or public sources. Additional information relative to the financial products discussed in this material is available upon request. Itau BBA International plc registered office is 20th floor, 20 Primrose Street, London, United Kingdom, EC2A 2EW and is authorised by the Prudential Regulation Authority and regulated by the Financial Conduct Authority and the Prudential Regulation Authority (FRN 575225) – Itau BBA International plc Lisbon Branch is regulated by Banco de Portugal for the conduct of business. Itau BBA International plc has representative offices in France, Germany, Spain which are authorised to conduct limited activities and the business activities conducted are regulated by Banque de France, Bundesanstalt fur Finanzdienstleistungsaufsicht (BaFin), Banco de España respectively. For any queries please contact your relationship manager; (ii) U.S.A: Itau BBA USA Securities, Inc., a FINRA/SIPC member firm, is distributing this report and accepts responsibility for the content of this report. Any US investor receiving this report and wishing to effect any transaction in any security discussed herein should do so with Itau BBA USA Securities, Inc. at 767 Fifth Avenue, 50th Floor, New York, NY 10153; (iii) Asia: This report is distributed in Hong Kong and Japan by Itaú Asia Securities Limited, which is licensed in Hong Kong by the Securities and Futures Commission for Type 1 (dealing in securities) regulated activity. Itaú Asia Securities Limited accepts all regulatory responsibility for the content of this report. In Hong Kong, any investors wishing to purchase or otherwise deal in the securities covered in this report should contact Itaú Asia Securities Limited at 29th Floor, Two IFC, 8 Finance Street – Central, Hong Kong; (iv) Middle East: This report is distributed by Itau Middle East Limited. Itau Middle East Limited is regulated by the Dubai Financial Services Authority and is located at Suite 305, Level 3, Al Fattan Currency House, Dubai International Financial Centre, PO Box 482034, Dubai, United Arab Emirates. This material is intended only for Professional Clients (as defined by the DFSA Conduct of Business module) no other persons should act upon it; (v) Brazil: Itaú Corretora de Valores S.A., a subsidiary of Itaú Unibanco S.A authorized by the Central Bank of Brazil and approved by the Securities and Exchange Commission of Brazil, is distributing this report. If necessary, contact the Client Service Center: 4004-3131* (capital and metropolitan areas) or 0800-722-3131 (other locations) during business hours, from 9 a.m. to 8 p.m., Brasilia time. If you wish to re-evaluate the suggested solution, after utilizing such channels, please call Itaú’s Corporate Complaints Office: 0800-570-0011 (on business days from 9 a.m. to 6 p.m., Brasilia time) or write to Caixa Postal 67.600, São Paulo-SP, CEP 03162-971.* Cost of a local call.
Relevant Information – Analysts
Analysts Disclosure Items
1 2 3 4 5 Ruben Couto Thiago Macruz Marco Calvi
1. The investment analysts involved in the preparation of this report are related to an individual who works for the issuer object of this analysis report.
2. The investment analysts, their spouses or companions, have a direct or indirect stake, in their names, in the capital stock and/or other securities issued by the companies object of their analysis.
3. The Investment analysts, their spouses or companions, are directly or indirectly involved in the purchase, sale, disposal or trading of securities that are the object of this report.
4. The investment analysts, their spouses or companions, have a direct or indirect financial interest in the issuing company of the securities analyzed in this report.
5. The investment analysts, their spouses or companions, deal with shares of mutual funds which concentrate their investments in the analyzed company or in the company’s industry, or in which they can directly or indirectly influence their management or administration.
Itaú BBA
15