yellowstone river reach narratives reach pc7 -...
TRANSCRIPT
Yellowstone River Reach Narratives Reach PC7County Park
Classification PCA: Partially confined anabranching
General Comments
Narrative Summary
Reach PC7 extends from the mouth of Six Mile Creek to the Grey Owl fishing access site. It is six miles long and is classified as a Partially Confined Anabranching (PCA) channel type. This indicates that the reach supports side channels and wooded islands, and intermittently flows along the edge of the stream corridor. The relatively complex reach type is evidenced by the relative broad Channel Migration Zone (CMZ) footprint, which is typically about 1500 to 2500 feet wide in this reach. In comparison, Reach PC6 just upstream has a CMZ that is typically about 500 feet wide. There are a total of 1,171 acres of stream corridor within the CMZ in Reach PC7. About 6 percent of that area has been restricted by bank armor.
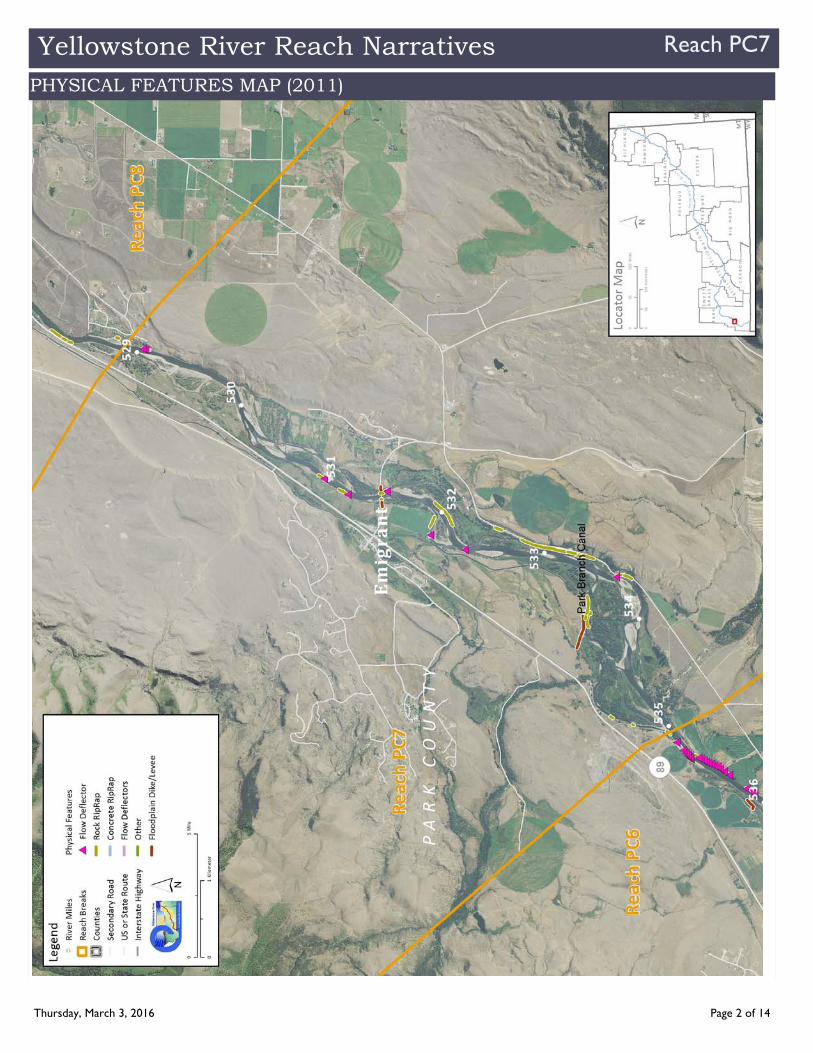
Reach PC7 has over 8,800 feet of rock riprap and 550 feet of flow deflectors, which collectively armors about 15 percent of the total bankline. Of those 9,350 feet of armor, about 350 feet were constructed since 2001. Since 1950, one side channel that is 2,950 feet long was blocked by a dike at RM 532. This isolated channel is located just upstream of the Emigrant Bridge on the east floodplain, and has been identified as a potential side channel restoration area. In the upstream portion of the reach at RM 534, the Park Branch Canal diverts water from a long side channel that has been active since at least the 1950s.
Land use conversions in Reach PC7 have seen a reduction in flood irrigation that has been accompanied by about 67 acres of development of sprinkler and pivot irrigation systems. That said, this reach has experienced major exurban growth, from 0 acres in 1950 to 298 acres in 2011. Most of that growth reflects rural subdivision development on the glacial outwash terraces above the active stream corridor. There is one boat ramp on the right bank just above the Emigrant Bridge at the Emigrant Fishing Access Site, and just below the bridge, there is a ~72 acre fishing access site without boating facilities on the west side of the river (Emigrant West).
Reach PC7 contains over 200 acres of emergent wetlands, many of which appear to be associated with groundwater seepage from the base of the glacial terraces on the east side of the river, and ditch seepage on the west side of the river. These areas tend to be utilized as non-irrigated hay/pasture ground.
About 1.5 acres of Russian olive have been mapped in Reach PC7, which is a dramatic increase relative to upstream reaches.
This area of the upper Yellowstone River has seen three severe floods in the last 20 years. The 1996 and 1997 floods were very damaging, early-June events that peaked at 37,100 and 38,000 cfs, respectively. At the time, these were considered to be sequential 100-year floods. Then in late June of 2011, the river peaked at 40,600 cfs, which is currently the flood of record at Livingston. This flood exceeded a 100-year event, with both the 1996/1997 events considered to have exceeded a 75-year flood.
A hydrologic evaluation of flow depletions indicates that flow alterations over the last century have been relatively small in this reach. The biggest influence has been on low flows: severe low flows described as 7Q10 (the lowest average 7-day flow anticipated every ten years) for summer months has dropped from an estimated 1,340 cfs to 1,320 cfs with human development, a reduction of 1.5 percent.
CEA-Related observations in Reach PC7 include: •Conversion of agricultural land to exurban development •Post-1950s side channel blockage with identified restoration potential •Sharp increase in Russian olive extent relative to upstream reaches
Recommended Practices (may include Yellowstone River Recommended Practices--YRRPs) for Reach PC7 include: •Side Channel Restoration at RM 532R. •Diversion Infrastructure Management at Park Branch Canal, RM 535.5 •Russian olive removal
General Location Six Mile Cr to Grey Owl
Upstream River Mile 535
Downstream River Mile 529
Length 6.00 mi (9.66 km)
Thursday, March 3, 2016 Page 1 of 14
Yellowstone River Reach Narratives Reach PC7
PHYSICAL FEATURES MAP (2011)
Thursday, March 3, 2016 Page 2 of 14
Yellowstone River Reach Narratives Reach PC7
HYDROLOGIC SUMMARY
19,100
19,000
27,100
27,000
33,400
33,400
36,000
36,000
41,900
41,900
Unregulated
Regulated
2 Yr 10 Yr 50 Yr 100 Yr 500 Yr
-0.52% -0.37% 0.00% 0.00% 0.00%% Change
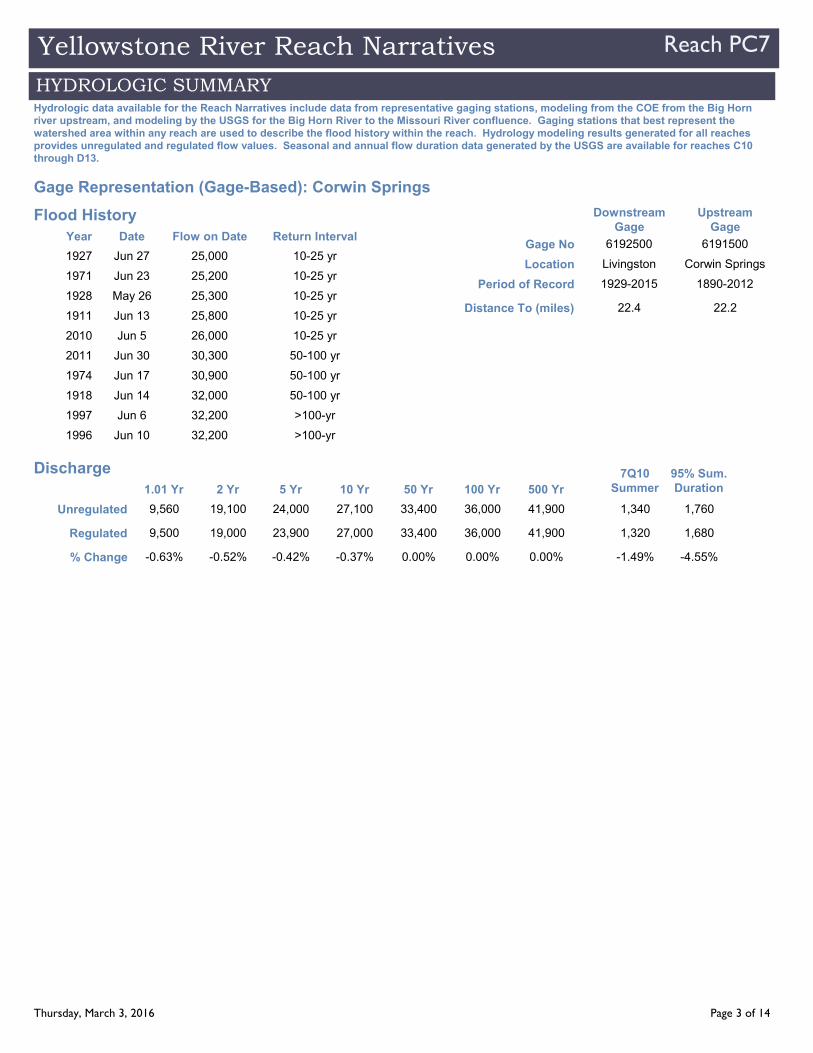
Hydrologic data available for the Reach Narratives include data from representative gaging stations, modeling from the COE from the Big Horn river upstream, and modeling by the USGS for the Big Horn River to the Missouri River confluence. Gaging stations that best represent the watershed area within any reach are used to describe the flood history within the reach. Hydrology modeling results generated for all reaches provides unregulated and regulated flow values. Seasonal and annual flow duration data generated by the USGS are available for reaches C10 through D13.
61915006192500
Livingston Corwin Springs
UpstreamGage
DownstreamGage
Gage No
Location
1890-20121929-2015Period of Record
22.222.4Distance To (miles)
Gage Representation (Gage-Based): Corwin Springs
9,560
9,500
1.01 Yr
-0.63%
Flood History
24,000
23,900
5 Yr
-0.42%
1,760
1,680
95% Sum.Duration
-4.55%
1,340
1,320
7Q10Summer
-1.49%
Discharge
Year Date Flow on Date Return Interval
1927 Jun 27 25,000 10-25 yr
1971 Jun 23 25,200 10-25 yr
1928 May 26 25,300 10-25 yr
1911 Jun 13 25,800 10-25 yr
2010 Jun 5 26,000 10-25 yr
2011 Jun 30 30,300 50-100 yr
1974 Jun 17 30,900 50-100 yr
1918 Jun 14 32,000 50-100 yr
1997 Jun 6 32,200 >100-yr
1996 Jun 10 32,200 >100-yr
Thursday, March 3, 2016 Page 3 of 14
Yellowstone River Reach Narratives Reach PC7
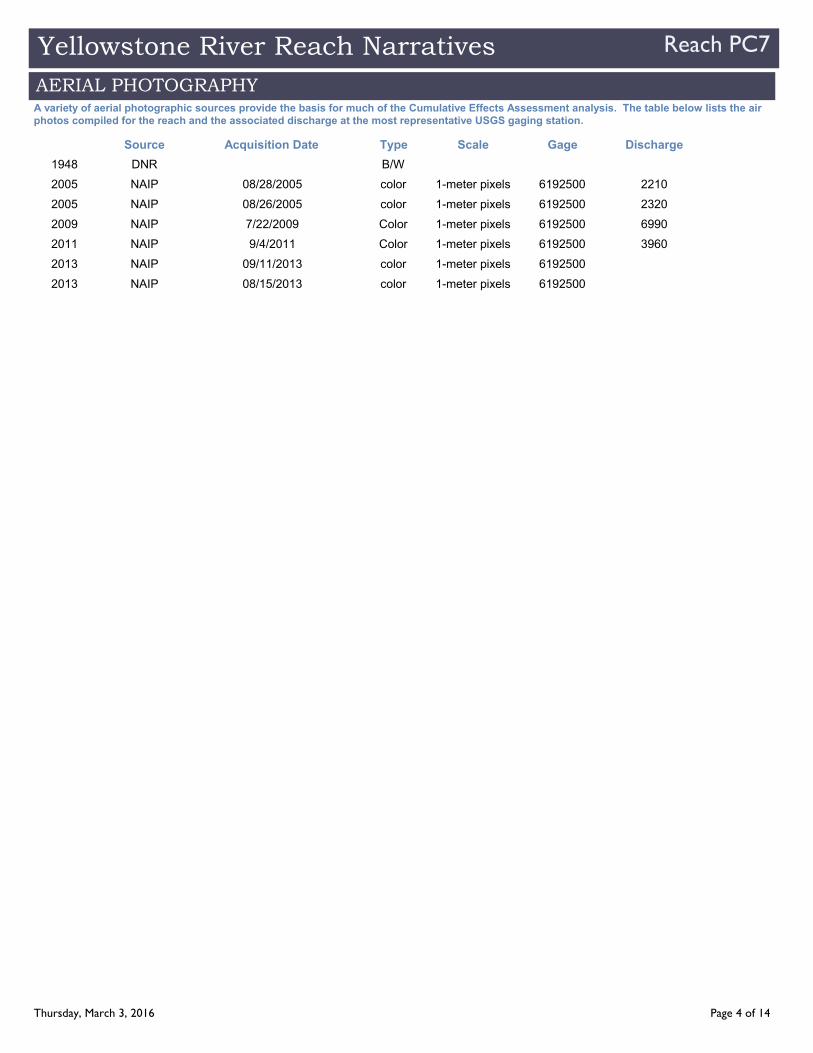
Source Acquisition Date Scale Gage Discharge
A variety of aerial photographic sources provide the basis for much of the Cumulative Effects Assessment analysis. The table below lists the air photos compiled for the reach and the associated discharge at the most representative USGS gaging station.
Type
AERIAL PHOTOGRAPHY
1948 DNR B/W
2005 NAIP 08/28/2005 1-meter pixels 6192500 2210color
2005 NAIP 08/26/2005 1-meter pixels 6192500 2320color
2009 NAIP 7/22/2009 1-meter pixels 6192500 6990Color
2011 NAIP 9/4/2011 1-meter pixels 6192500 3960Color
2013 NAIP 09/11/2013 1-meter pixels 6192500color
2013 NAIP 08/15/2013 1-meter pixels 6192500color
Thursday, March 3, 2016 Page 4 of 14
Yellowstone River Reach Narratives Reach PC7
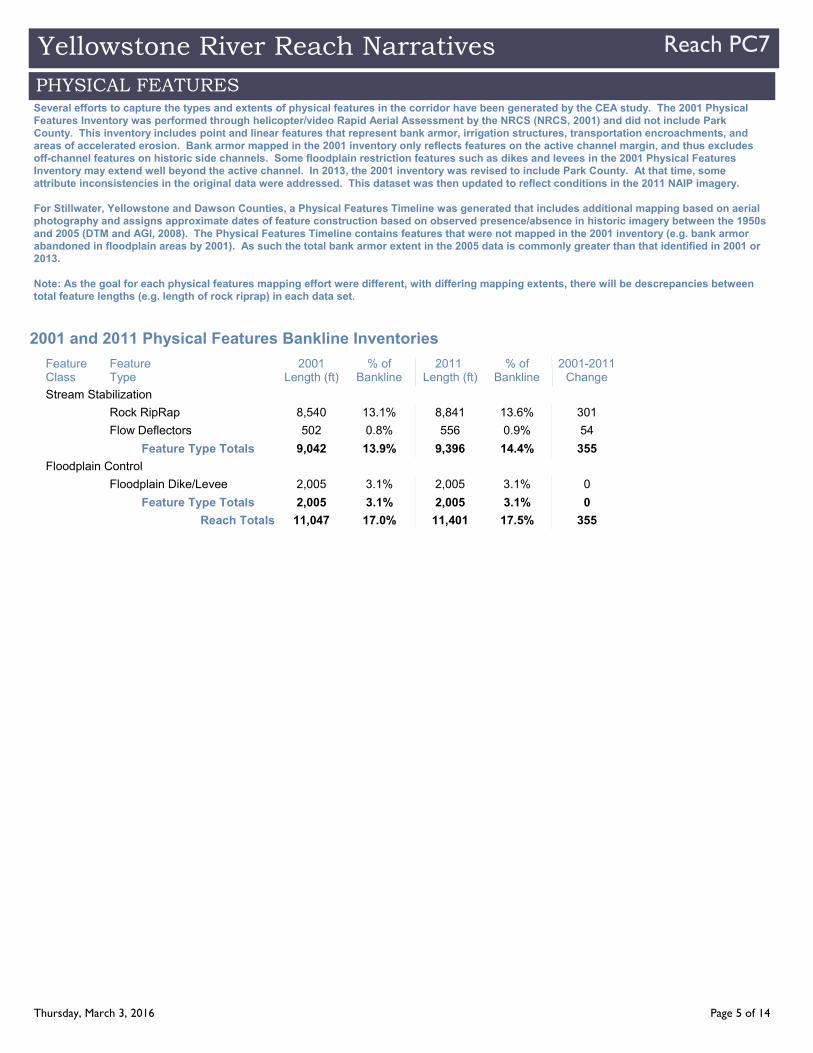
Several efforts to capture the types and extents of physical features in the corridor have been generated by the CEA study. The 2001 Physical Features Inventory was performed through helicopter/video Rapid Aerial Assessment by the NRCS (NRCS, 2001) and did not include Park County. This inventory includes point and linear features that represent bank armor, irrigation structures, transportation encroachments, and areas of accelerated erosion. Bank armor mapped in the 2001 inventory only reflects features on the active channel margin, and thus excludes off-channel features on historic side channels. Some floodplain restriction features such as dikes and levees in the 2001 Physical Features Inventory may extend well beyond the active channel. In 2013, the 2001 inventory was revised to include Park County. At that time, some attribute inconsistencies in the original data were addressed. This dataset was then updated to reflect conditions in the 2011 NAIP imagery.
For Stillwater, Yellowstone and Dawson Counties, a Physical Features Timeline was generated that includes additional mapping based on aerial photography and assigns approximate dates of feature construction based on observed presence/absence in historic imagery between the 1950s and 2005 (DTM and AGI, 2008). The Physical Features Timeline contains features that were not mapped in the 2001 inventory (e.g. bank armor abandoned in floodplain areas by 2001). As such the total bank armor extent in the 2005 data is commonly greater than that identified in 2001 or 2013.
Note: As the goal for each physical features mapping effort were different, with differing mapping extents, there will be descrepancies between total feature lengths (e.g. length of rock riprap) in each data set.
PHYSICAL FEATURES
FeatureType
FeatureClass
2001Length (ft)
% ofBankline
2001 and 2011 Physical Features Bankline Inventories
2011 Length (ft)
% ofBankline
2001-2011Change
Stream Stabilization
Rock RipRap 8,540 13.1% 8,841 13.6% 301
Flow Deflectors 502 0.8% 556 0.9% 54
9,042 13.9%Feature Type Totals 9,396 14.4% 355
Floodplain Control
Floodplain Dike/Levee 2,005 3.1% 2,005 3.1% 0
2,005 3.1%Feature Type Totals 2,005 3.1% 0
11,047 17.0% 11,401 17.5% 355 Reach Totals
Thursday, March 3, 2016 Page 5 of 14

Yellowstone River Reach Narratives Reach PC7
GEOMORPHIC
1.8634,130
2.2732,556
1976 to 1995:
1995 to 2001:
1950 to 2001: 22.08%
BankfullBraiding
ParameterPrimary Chan.
Length (ft)
1950
1976
1995
2001
% Change inBraiding
1950 to 1976:29,472
41,507
Anab. Ch.Length (ft)
Braiding (Bankfull)
The geomorphology data presented below consist of measured changes in Braiding Parameter since 1950 and blocked side channels. Braiding parameter is a measure of the total length of side channels relative to that of the main channel. The braiding parameter is calculated as the sum of anabranching and primary channel lengths divided by the primary channel length. Secondary channels within the bankfull margins are a function of flow stage and hence were not included in the braiding parameter calculation. If a reach has a braiding parameter of 3, then the total bankfull channel length is three times that of the main channel. The mean braiding parameter measured for all 88 reaches is 1.8.
Blocked side channels that were either plugged with a small dike or cutoff by larger features such as a levee or road prism were identified for the pre and post-1950s eras.
Additional geomorphic parameters are discussed in more detail in the study report and appendices.
2,950Post-1950s (ft)Length of SideChannels Blocked
0.41-1,574Change 1950 - 2001 12,035
0Pre-1950s (ft)
ICE JAMSIce jam data were obtained from the National Ice Jam Database maintained by the Ice Engineering Group at Army Corps of Engineers Cold Regions Research and Engineering Laboratory (https://rsgis.crrel.usace.army.mil/icejam/). From this database, Yellowstone River ice jams are summarized by reach in the Yellowstone River Historic Events Timeline (DTM and AGI, 2008b). The basic information for each ice jam is presented as a list of events. The graph represents the number of database entries for a reach. Note that a single jam event may have multiple entries.
0
5
10
15
20
25
30
35
PC13
Stillwater
A13
Clarks Fork
A17 B2
B6
Bighorn C5
C10
C13
C14
Tongue
C16
C17
C19
Powder
D1
D2
D4
D5
D6
D11
D13
D14
D15
Number of Database Entries
Reach
Yellowstone River Ice Jams1894‐2012
April
March
February
January
December
November
Thursday, March 3, 2016 Page 6 of 14
Yellowstone River Reach Narratives Reach PC7
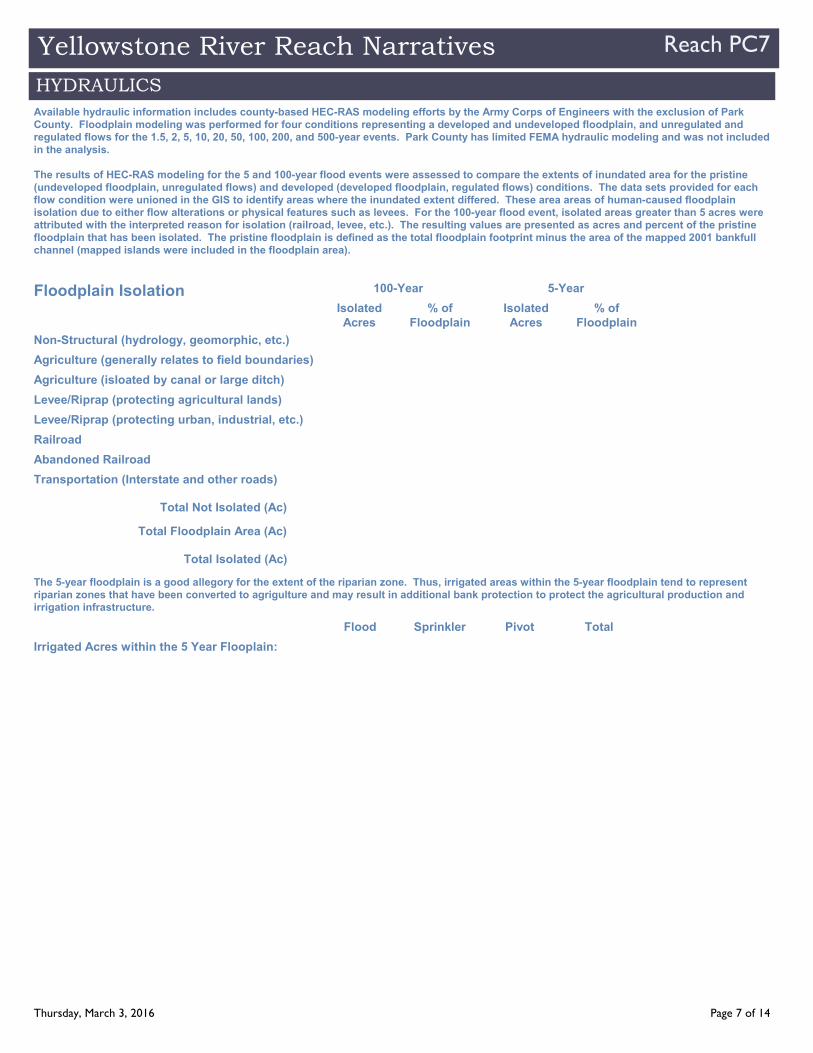
Available hydraulic information includes county-based HEC-RAS modeling efforts by the Army Corps of Engineers with the exclusion of Park County. Floodplain modeling was performed for four conditions representing a developed and undeveloped floodplain, and unregulated and regulated flows for the 1.5, 2, 5, 10, 20, 50, 100, 200, and 500-year events. Park County has limited FEMA hydraulic modeling and was not included in the analysis.
The results of HEC-RAS modeling for the 5 and 100-year flood events were assessed to compare the extents of inundated area for the pristine (undeveloped floodplain, unregulated flows) and developed (developed floodplain, regulated flows) conditions. The data sets provided for each flow condition were unioned in the GIS to identify areas where the inundated extent differed. These area areas of human-caused floodplain isolation due to either flow alterations or physical features such as levees. For the 100-year flood event, isolated areas greater than 5 acres were attributed with the interpreted reason for isolation (railroad, levee, etc.). The resulting values are presented as acres and percent of the pristine floodplain that has been isolated. The pristine floodplain is defined as the total floodplain footprint minus the area of the mapped 2001 bankfull channel (mapped islands were included in the floodplain area).
HYDRAULICS
Irrigated Acres within the 5 Year Flooplain:
Flood Sprinkler Pivot Total
The 5-year floodplain is a good allegory for the extent of the riparian zone. Thus, irrigated areas within the 5-year floodplain tend to represent riparian zones that have been converted to agrigulture and may result in additional bank protection to protect the agricultural production and irrigation infrastructure.
IsolatedAcres
% ofFloodplain
Non-Structural (hydrology, geomorphic, etc.)
Agriculture (generally relates to field boundaries)
Agriculture (isloated by canal or large ditch)
Levee/Riprap (protecting agricultural lands)
Levee/Riprap (protecting urban, industrial, etc.)
Railroad
Abandoned Railroad
Transportation (Interstate and other roads)
Total Not Isolated (Ac)
Total Floodplain Area (Ac)
100-Year 5-Year
Total Isolated (Ac)
IsolatedAcres
% ofFloodplain
Floodplain Isolation
Thursday, March 3, 2016 Page 7 of 14
Yellowstone River Reach Narratives Reach PC7
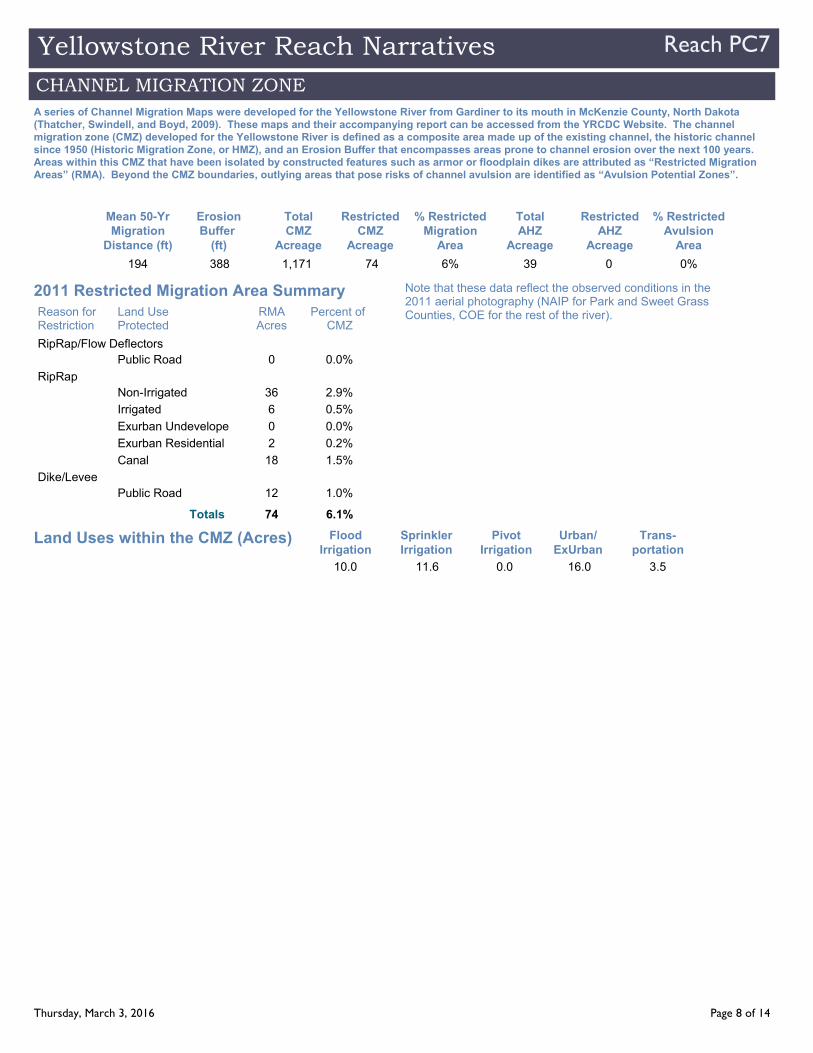
194 388 74 6% 391,171 0 0%
Mean 50-YrMigration
Distance (ft)
ErosionBuffer
(ft)
RestrictedCMZ
Acreage
% RestrictedMigration
Area
TotalAHZ
Acreage
TotalCMZ
Acreage
RestrictedAHZ
Acreage
% RestrictedAvulsion
Area
A series of Channel Migration Maps were developed for the Yellowstone River from Gardiner to its mouth in McKenzie County, North Dakota (Thatcher, Swindell, and Boyd, 2009). These maps and their accompanying report can be accessed from the YRCDC Website. The channel migration zone (CMZ) developed for the Yellowstone River is defined as a composite area made up of the existing channel, the historic channel since 1950 (Historic Migration Zone, or HMZ), and an Erosion Buffer that encompasses areas prone to channel erosion over the next 100 years. Areas within this CMZ that have been isolated by constructed features such as armor or floodplain dikes are attributed as “Restricted Migration Areas” (RMA). Beyond the CMZ boundaries, outlying areas that pose risks of channel avulsion are identified as “Avulsion Potential Zones”.
CHANNEL MIGRATION ZONE
Land Uses within the CMZ (Acres)
10.0 11.6 16.0 3.50.0
FloodIrrigation
SprinklerIrrigation
Urban/ExUrban
Trans-portation
PivotIrrigation
Land UseProtected
Reason forRestriction
RMAAcres
Percent of CMZ
2011 Restricted Migration Area Summary Note that these data reflect the observed conditions in the 2011 aerial photography (NAIP for Park and Sweet Grass Counties, COE for the rest of the river).
RipRap/Flow DeflectorsPublic Road 0 0.0%
RipRapNon-Irrigated 36 2.9%
Irrigated 6 0.5%
Exurban Undevelope 0 0.0%
Exurban Residential 2 0.2%
Canal 18 1.5%
Dike/LeveePublic Road 12 1.0%
74 6.1%Totals
Thursday, March 3, 2016 Page 8 of 14
Yellowstone River Reach Narratives Reach PC7
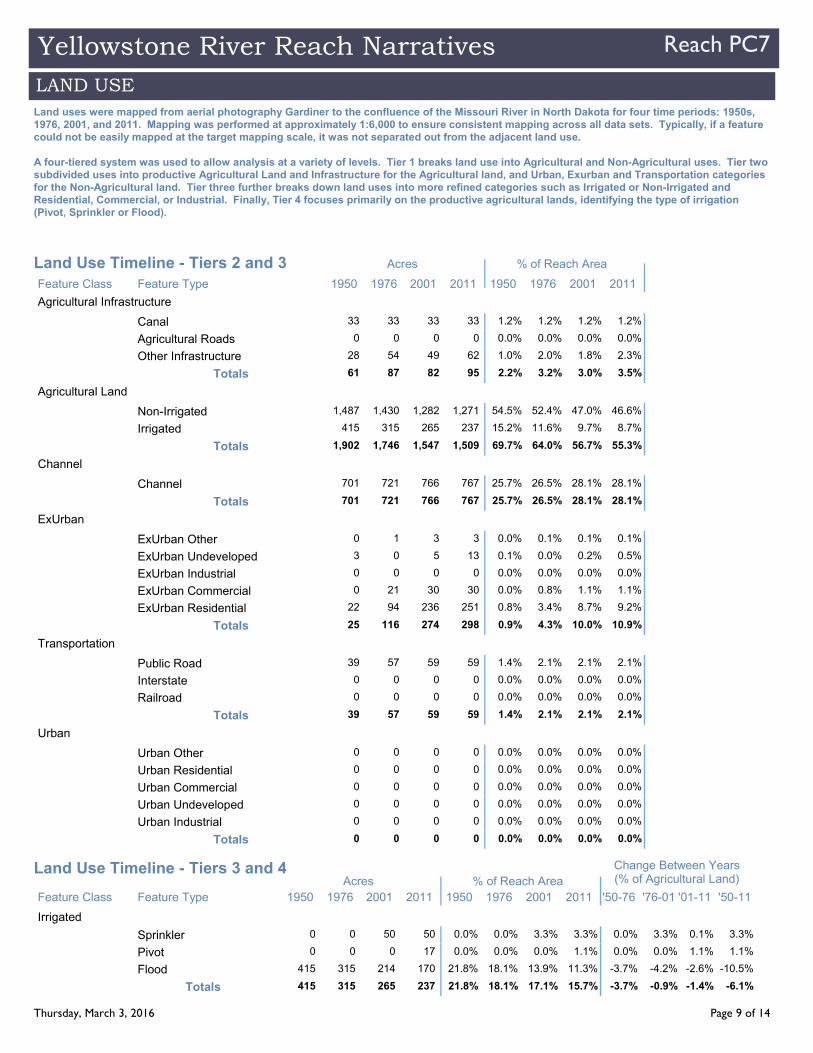
Land uses were mapped from aerial photography Gardiner to the confluence of the Missouri River in North Dakota for four time periods: 1950s, 1976, 2001, and 2011. Mapping was performed at approximately 1:6,000 to ensure consistent mapping across all data sets. Typically, if a feature could not be easily mapped at the target mapping scale, it was not separated out from the adjacent land use.
A four-tiered system was used to allow analysis at a variety of levels. Tier 1 breaks land use into Agricultural and Non-Agricultural uses. Tier two subdivided uses into productive Agricultural Land and Infrastructure for the Agricultural land, and Urban, Exurban and Transportation categories for the Non-Agricultural land. Tier three further breaks down land uses into more refined categories such as Irrigated or Non-Irrigated and Residential, Commercial, or Industrial. Finally, Tier 4 focuses primarily on the productive agricultural lands, identifying the type of irrigation (Pivot, Sprinkler or Flood).
LAND USE
Feature Type 1950 1976 2001 2011 1950 1976 2001 2011Feature Class
Acres % of Reach AreaLand Use Timeline - Tiers 2 and 3
Agricultural Infrastructure
Canal 33 33 33 33 1.2% 1.2% 1.2% 1.2%
Agricultural Roads 0 0 0 0 0.0% 0.0% 0.0% 0.0%
Other Infrastructure 28 54 49 62 1.0% 2.0% 1.8% 2.3%
61 87 82 95 2.2% 3.2% 3.0% 3.5%Totals
Agricultural Land
Non-Irrigated 1,487 1,430 1,282 1,271 54.5% 52.4% 47.0% 46.6%
Irrigated 415 315 265 237 15.2% 11.6% 9.7% 8.7%
1,902 1,746 1,547 1,509 69.7% 64.0% 56.7% 55.3%Totals
Channel
Channel 701 721 766 767 25.7% 26.5% 28.1% 28.1%
701 721 766 767 25.7% 26.5% 28.1% 28.1%Totals
ExUrban
ExUrban Other 0 1 3 3 0.0% 0.1% 0.1% 0.1%
ExUrban Undeveloped 3 0 5 13 0.1% 0.0% 0.2% 0.5%
ExUrban Industrial 0 0 0 0 0.0% 0.0% 0.0% 0.0%
ExUrban Commercial 0 21 30 30 0.0% 0.8% 1.1% 1.1%
ExUrban Residential 22 94 236 251 0.8% 3.4% 8.7% 9.2%
25 116 274 298 0.9% 4.3% 10.0% 10.9%Totals
Transportation
Public Road 39 57 59 59 1.4% 2.1% 2.1% 2.1%
Interstate 0 0 0 0 0.0% 0.0% 0.0% 0.0%
Railroad 0 0 0 0 0.0% 0.0% 0.0% 0.0%
39 57 59 59 1.4% 2.1% 2.1% 2.1%Totals
Urban
Urban Other 0 0 0 0 0.0% 0.0% 0.0% 0.0%
Urban Residential 0 0 0 0 0.0% 0.0% 0.0% 0.0%
Urban Commercial 0 0 0 0 0.0% 0.0% 0.0% 0.0%
Urban Undeveloped 0 0 0 0 0.0% 0.0% 0.0% 0.0%
Urban Industrial 0 0 0 0 0.0% 0.0% 0.0% 0.0%
0 0 0 0 0.0% 0.0% 0.0% 0.0%Totals
Feature Type 1950 1976 2001 2011 1950 1976 2001 2011 '50-76 '76-01 '01-11 '50-11Feature ClassAcres % of Reach Area
Land Use Timeline - Tiers 3 and 4 Change Between Years(% of Agricultural Land)
Irrigated
Sprinkler 0 0 50 50 0.0% 0.0% 3.3% 3.3% 0.0% 3.3% 0.1% 3.3%
Pivot 0 0 0 17 0.0% 0.0% 0.0% 1.1% 0.0% 0.0% 1.1% 1.1%
Flood 415 315 214 170 21.8% 18.1% 13.9% 11.3% -3.7% -4.2% -2.6% -10.5%
415 315 265 237 21.8% 18.1% 17.1% 15.7% -3.7% -0.9% -1.4% -6.1%Totals
Thursday, March 3, 2016 Page 9 of 14
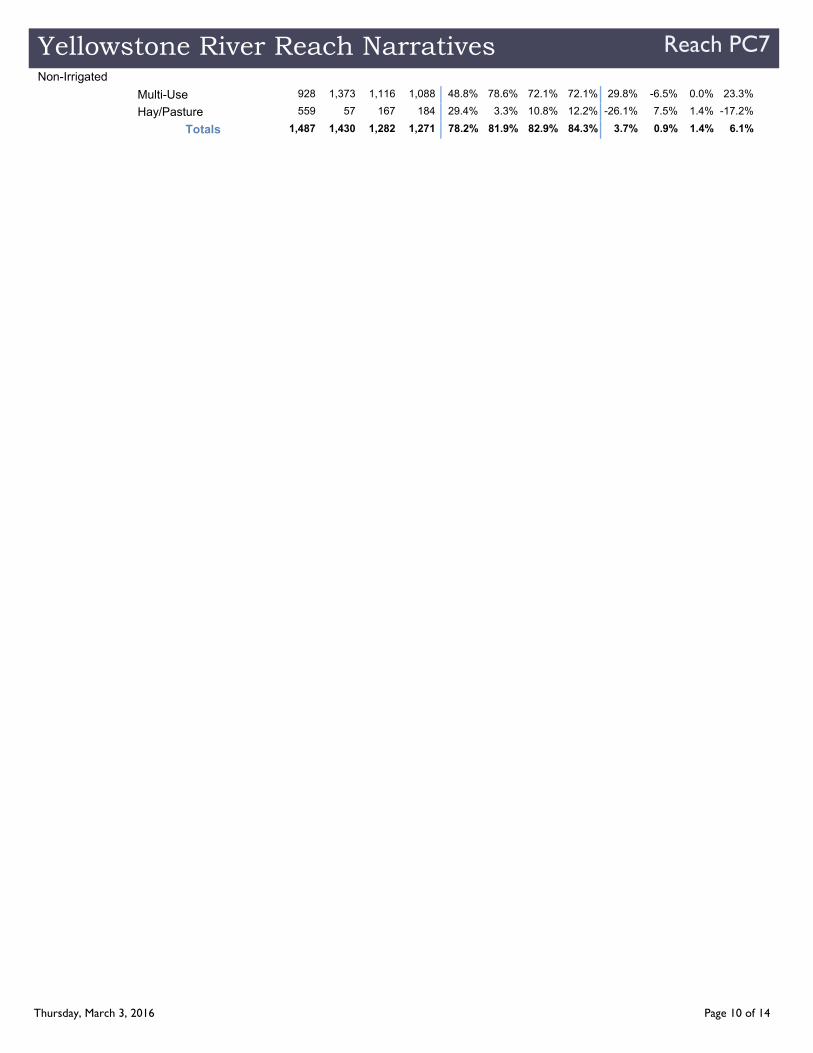
Yellowstone River Reach Narratives Reach PC7Non-Irrigated
Multi-Use 928 1,373 1,116 1,088 48.8% 78.6% 72.1% 72.1% 29.8% -6.5% 0.0% 23.3%
Hay/Pasture 559 57 167 184 29.4% 3.3% 10.8% 12.2% -26.1% 7.5% 1.4% -17.2%
1,487 1,430 1,282 1,271 78.2% 81.9% 82.9% 84.3% 3.7% 0.9% 1.4% 6.1%Totals
Thursday, March 3, 2016 Page 10 of 14
Yellowstone River Reach Narratives Reach PC7
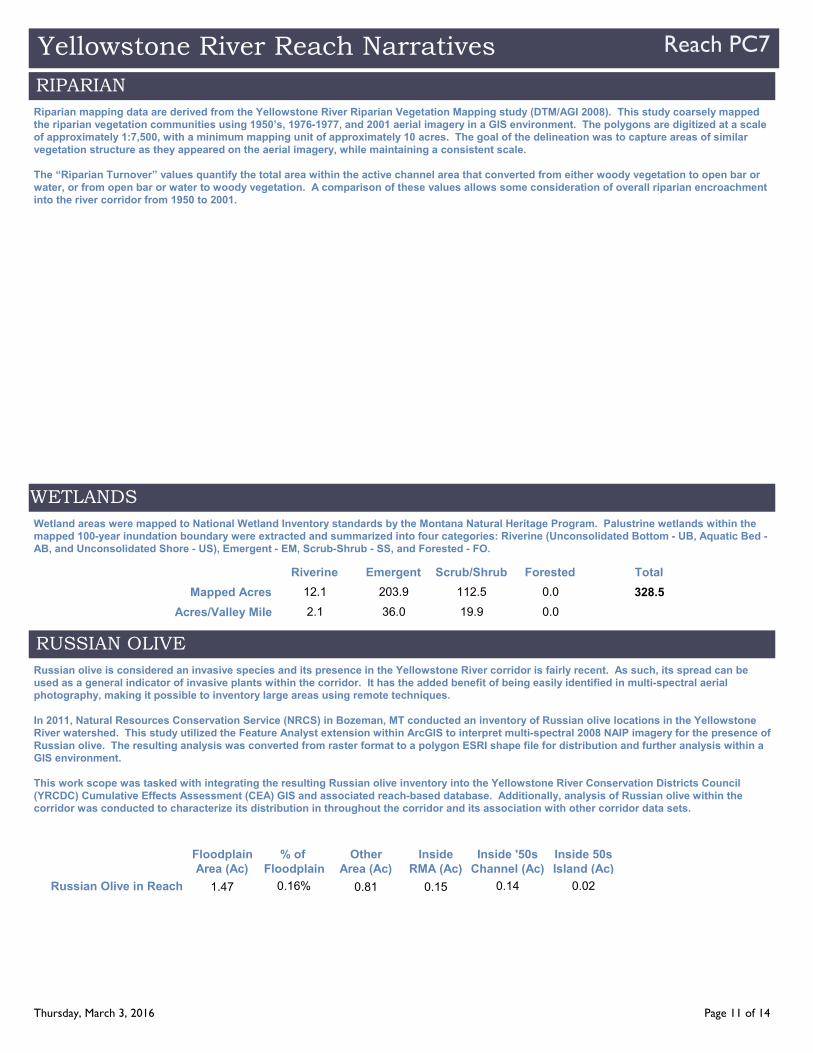
Riparian mapping data are derived from the Yellowstone River Riparian Vegetation Mapping study (DTM/AGI 2008). This study coarsely mapped the riparian vegetation communities using 1950’s, 1976-1977, and 2001 aerial imagery in a GIS environment. The polygons are digitized at a scale of approximately 1:7,500, with a minimum mapping unit of approximately 10 acres. The goal of the delineation was to capture areas of similar vegetation structure as they appeared on the aerial imagery, while maintaining a consistent scale.
The “Riparian Turnover” values quantify the total area within the active channel area that converted from either woody vegetation to open bar or water, or from open bar or water to woody vegetation. A comparison of these values allows some consideration of overall riparian encroachment into the river corridor from 1950 to 2001.
RIPARIAN
Russian olive is considered an invasive species and its presence in the Yellowstone River corridor is fairly recent. As such, its spread can be used as a general indicator of invasive plants within the corridor. It has the added benefit of being easily identified in multi-spectral aerial photography, making it possible to inventory large areas using remote techniques.
In 2011, Natural Resources Conservation Service (NRCS) in Bozeman, MT conducted an inventory of Russian olive locations in the Yellowstone River watershed. This study utilized the Feature Analyst extension within ArcGIS to interpret multi-spectral 2008 NAIP imagery for the presence of Russian olive. The resulting analysis was converted from raster format to a polygon ESRI shape file for distribution and further analysis within a GIS environment.
This work scope was tasked with integrating the resulting Russian olive inventory into the Yellowstone River Conservation Districts Council (YRCDC) Cumulative Effects Assessment (CEA) GIS and associated reach-based database. Additionally, analysis of Russian olive within the corridor was conducted to characterize its distribution in throughout the corridor and its association with other corridor data sets.
RUSSIAN OLIVE
1.47 0.81 0.15 0.14Russian Olive in Reach
FloodplainArea (Ac)
OtherArea (Ac)
InsideRMA (Ac)
Inside '50sChannel (Ac)
0.02
Inside 50sIsland (Ac)
0.16%
% of Floodplain
WETLANDS
203.9 112.5 0.0 Mapped Acres
Emergent Scrub/Shrub Forested
Wetland areas were mapped to National Wetland Inventory standards by the Montana Natural Heritage Program. Palustrine wetlands within the mapped 100-year inundation boundary were extracted and summarized into four categories: Riverine (Unconsolidated Bottom - UB, Aquatic Bed - AB, and Unconsolidated Shore - US), Emergent - EM, Scrub-Shrub - SS, and Forested - FO.
12.1
Riverine
36.0 19.9 0.0Acres/Valley Mile 2.1
328.5
Total
Thursday, March 3, 2016 Page 11 of 14

Yellowstone River Reach Narratives Reach PC7
Fisheries data available for the Reach Narratives include low-flow and high-flow habitat mapping of 2001 conditions for 406 miles of river, extending from the mouth upstream to a point approximately 8 miles upstream of Park City. Habitat mapping was performed remotely on the 2001 CIR aerial photography utilizing habitat classifications developed by Montana Fish, Wildlife, and Parks (DTM 2009). Historic habitat mapping using the 1950’s imagery is limited to Reach B1 (high-flow) and D9 (low and high-flow).
Fisheries field sampling data have been provided by Ann Marie Reinhold (MSU). In this study, the Yellowstone River from Park City to Sidney was divided into five segments. Within each segment, fish were sampled in reaches modified by riprap (“treatment reaches”) and relatively unmodified reaches (“control reaches”). Fish sampling was conducted during summer and autumn of 2009, 2010, and 2011. Boat electrofishing, trammel nets, mini-fyke nets and bag seines were used to collect data from river bends.
Fish presence data is only presented for those reaches that were sampled.
The Low Flow Habitat Mapping followed schema deveoped by Montana Fish Wildlife and Parks to identify key habitat units for certain aquatic species.
FISHERIES SUMMARY
Thursday, March 3, 2016 Page 12 of 14
Yellowstone River Reach Narratives Reach PC7
AVIANBirds were sampled in 2006 and 2007 by Danielle Jones of Montana State University. Point count methods were used at 304 randomly chosen sites in 21 braided or anabranching reaches. Each site was visited multiple times within a season, and sites were visited in both years. Birds were sampled in grassland, shrubland, and cottonwood forest habitats. Additional bird data was collected by Amy Cilimburg of Montana Audubon in summer 2012. High priority areas for data collection were identified with the assistance of the YRCDC Technical Advisory Committee. The Audubon methodology recorded data for a wider variety of bird species relative to the MSU study, including raptors and waterfowl.
Thursday, March 3, 2016 Page 13 of 14
Yellowstone River Reach Narratives Reach PC7
Thursday, March 3, 2016 Page 14 of 14