yellowstone science - national park service · support for yellowstone science is provided by the...
TRANSCRIPT

Yellowstone ScienceA quarterly publication devoted to the natural and cultural resources
Volume 5 Number 1
Clarifying the Park’s Muddy WatersA Grand Fisheries ExperimentGrizzly Bears: A Book ReviewCamping and Forest Structure
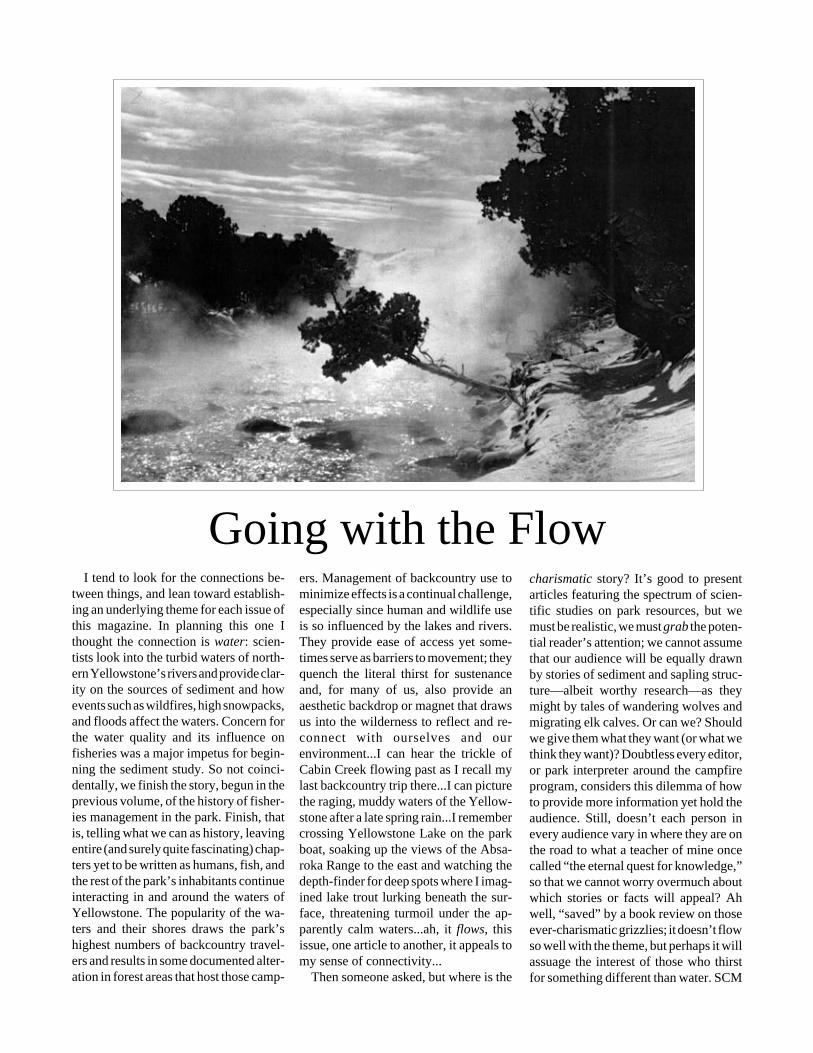
Going with the FlowI tend to look for the connections be-
tween things, and lean toward establish-ing an underlying theme for each issue ofthis magazine. In planning this one Ithought the connection is water: scien-tists look into the turbid waters of north-ern Yellowstone’s rivers and provide clar-ity on the sources of sediment and howevents such as wildfires, high snowpacks,and floods affect the waters. Concern forthe water quality and its influence onfisheries was a major impetus for begin-ning the sediment study. So not coinci-dentally, we finish the story, begun in theprevious volume, of the history of fisher-ies management in the park. Finish, thatis, telling what we can as history, leavingentire (and surely quite fascinating) chap-ters yet to be written as humans, fish, andthe rest of the park’s inhabitants continueinteracting in and around the waters ofYellowstone. The popularity of the wa-ters and their shores draws the park’shighest numbers of backcountry travel-ers and results in some documented alter-ation in forest areas that host those camp-
charismatic story? It’s good to presentarticles featuring the spectrum of scien-tific studies on park resources, but wemust be realistic, we must grab the poten-tial reader’s attention; we cannot assumethat our audience will be equally drawnby stories of sediment and sapling struc-ture—albeit worthy research—as theymight by tales of wandering wolves andmigrating elk calves. Or can we? Shouldwe give them what they want (or what wethink they want)? Doubtless every editor,or park interpreter around the campfireprogram, considers this dilemma of howto provide more information yet hold theaudience. Still, doesn’t each person inevery audience vary in where they are onthe road to what a teacher of mine oncecalled “the eternal quest for knowledge,”so that we cannot worry overmuch aboutwhich stories or facts will appeal? Ahwell, “saved” by a book review on thoseever-charismatic grizzlies; it doesn’t flowso well with the theme, but perhaps it willassuage the interest of those who thirstfor something different than water. SCM
ers. Management of backcountry use tominimize effects is a continual challenge,especially since human and wildlife useis so influenced by the lakes and rivers.They provide ease of access yet some-times serve as barriers to movement; theyquench the literal thirst for sustenanceand, for many of us, also provide anaesthetic backdrop or magnet that drawsus into the wilderness to reflect and re-connect with ourselves and ourenvironment...I can hear the trickle ofCabin Creek flowing past as I recall mylast backcountry trip there...I can picturethe raging, muddy waters of the Yellow-stone after a late spring rain...I remembercrossing Yellowstone Lake on the parkboat, soaking up the views of the Absa-roka Range to the east and watching thedepth-finder for deep spots where I imag-ined lake trout lurking beneath the sur-face, threatening turmoil under the ap-parently calm waters...ah, it flows, thisissue, one article to another, it appeals tomy sense of connectivity...
Then someone asked, but where is the

Suspended Sediment in the Rivers ofNorthern Yellowstone
Fire-related increases in sediment varied greatly by season andwatershed, and many other valuable lessons are gained from apre and postfire database on hydrology and sediment in the Lamarand Yellowstone river basins.by Roy Ewing
A Grand Experiment, ContinuedIn the latter half of the twentieth century, fisheries management shiftstoward protection of native species and a new era in fisheries responsibil-ity begins for Yellowstone National Park.Part Two of an article by Mary Ann Franke
Leave Only Footprints?Backcountry users influence forest structure around campsites, andmay affect forest survival and regeneration.by James Y. Taylor
ReviewThe Grizzly Bears of Yellowstone: Their Ecology in theYellowstone Ecosystem, 1959-1992, by John Craighead.Reviewed by Mark Boyce
News and NotesNew Brucella vaccine to be tested on Yellowstone bison • ThomasMoran paintings to be displayed at National Gallery of Art • Summaryof progress toward wolf restoration two years into the effort
A quarterly publication devoted to the natural and cultural resources
2
8
14
18
Editor
Sue Consolo-MurphyArt Director
Renée EvanoffAssociate Editor
Sarah BroadbentAssistant Editor
Mary Ann FrankePrinting
Artcraft Inc.Bozeman, Montana
On the cover: Fishing Bridge inthe 1950s. See Part Two of thehistory of fisheries managementin Yellowstone on page 3. PhotoNPS archives. Above: An SCAvolunteer taking water samplesfrom the bridge at CorwinSprings, Montana in May of1991. Photo courtesy Roy Ewing.
Table of ContentsVolume 5 Number 1 Winter 1997
Yellowstone Science
21
Yellowstone Science is published quarterly, and submissions are welcome from all investigatorsconducting formal research in the Yellowstone area. Editorial correspondence should be sent tothe Editor, Yellowstone Science, Yellowstone Center for Resources, P.O. Box 168, Yellowstone
National Park, WY 82190.The opinions expressed in Yellowstone Science are the authors' and may not reflect either
National Park Service policy or the views of the Yellowstone Center for Resources.Copyright © 1997, the Yellowstone Association for Natural Science, History & Education.
Support for Yellowstone Science is provided by the Yellowstone Association for NaturalScience, History & Education, a non-profit educational organization dedicated to serving the
park and its visitors. For more information about the Yellowstone Association, includingmembership, write to P.O. Box 117, Yellowstone National Park, WY 82190.
Yellowstone Science is printed on recycled paper with a linseed oil-based ink.
Yellowstone Science2
Suspended Sediment in theRivers of Northern Yellowstone
Assessing Changes from the 1988 Fires
by Roy Ewing
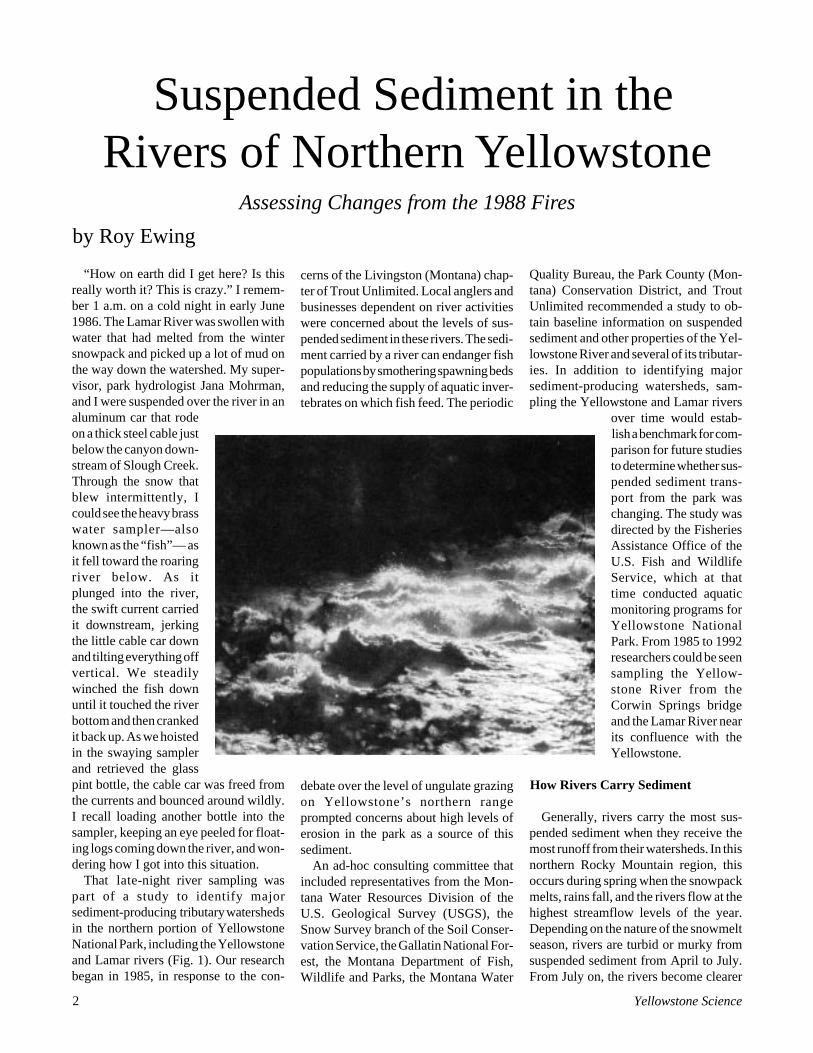
“How on earth did I get here? Is thisreally worth it? This is crazy.” I remem-ber 1 a.m. on a cold night in early June1986. The Lamar River was swollen withwater that had melted from the wintersnowpack and picked up a lot of mud onthe way down the watershed. My super-visor, park hydrologist Jana Mohrman,and I were suspended over the river in analuminum car that rodeon a thick steel cable justbelow the canyon down-stream of Slough Creek.Through the snow thatblew intermittently, Icould see the heavy brasswater sampler—alsoknown as the “fish”— asit fell toward the roaringriver below. As itplunged into the river,the swift current carriedit downstream, jerkingthe little cable car downand tilting everything offvertical. We steadilywinched the fish downuntil it touched the riverbottom and then crankedit back up. As we hoistedin the swaying samplerand retrieved the glasspint bottle, the cable car was freed fromthe currents and bounced around wildly.I recall loading another bottle into thesampler, keeping an eye peeled for float-ing logs coming down the river, and won-dering how I got into this situation.
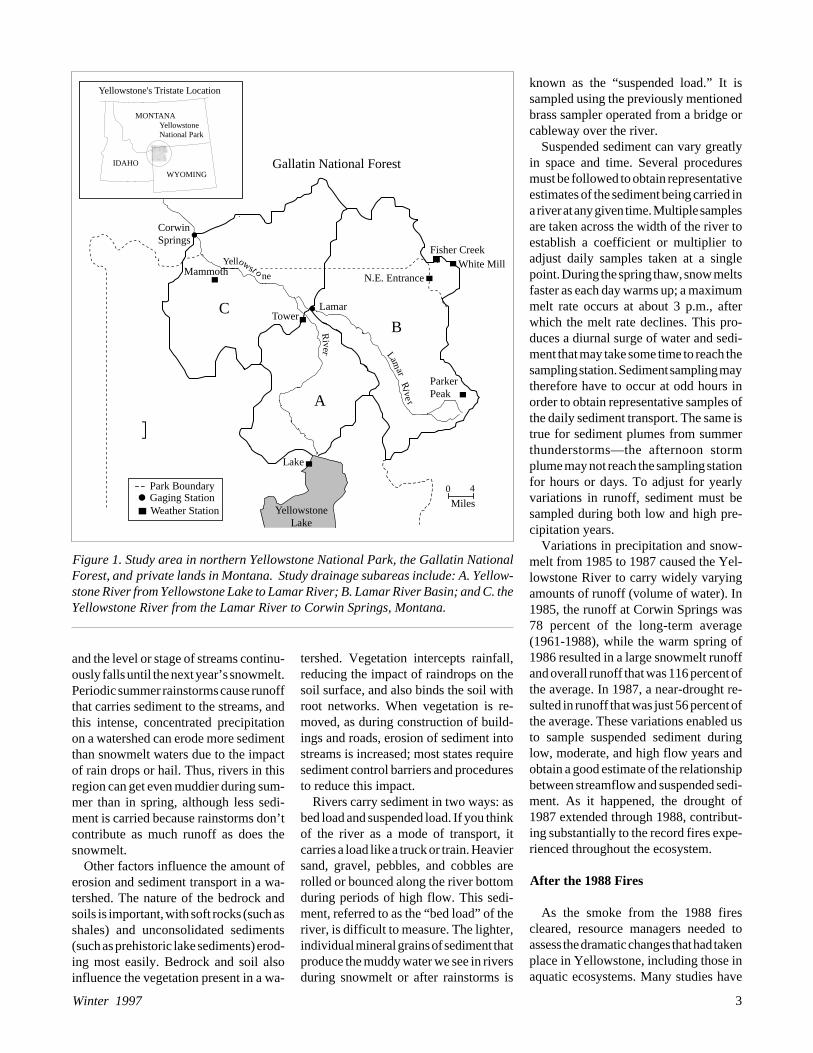
That late-night river sampling waspart of a study to identify majorsediment-producing tributary watershedsin the northern portion of YellowstoneNational Park, including the Yellowstoneand Lamar rivers (Fig. 1). Our researchbegan in 1985, in response to the con-
cerns of the Livingston (Montana) chap-ter of Trout Unlimited. Local anglers andbusinesses dependent on river activitieswere concerned about the levels of sus-pended sediment in these rivers. The sedi-ment carried by a river can endanger fishpopulations by smothering spawning bedsand reducing the supply of aquatic inver-tebrates on which fish feed. The periodic
debate over the level of ungulate grazingon Yellowstone’s northern rangeprompted concerns about high levels oferosion in the park as a source of thissediment.
An ad-hoc consulting committee thatincluded representatives from the Mon-tana Water Resources Division of theU.S. Geological Survey (USGS), theSnow Survey branch of the Soil Conser-vation Service, the Gallatin National For-est, the Montana Department of Fish,Wildlife and Parks, the Montana Water
Quality Bureau, the Park County (Mon-tana) Conservation District, and TroutUnlimited recommended a study to ob-tain baseline information on suspendedsediment and other properties of the Yel-lowstone River and several of its tributar-ies. In addition to identifying majorsediment-producing watersheds, sam-pling the Yellowstone and Lamar rivers
over time would estab-lish a benchmark for com-parison for future studiesto determine whether sus-pended sediment trans-port from the park waschanging. The study wasdirected by the FisheriesAssistance Office of theU.S. Fish and WildlifeService, which at thattime conducted aquaticmonitoring programs forYellowstone NationalPark. From 1985 to 1992researchers could be seensampling the Yellow-stone River from theCorwin Springs bridgeand the Lamar River nearits confluence with theYellowstone.
How Rivers Carry Sediment
Generally, rivers carry the most sus-pended sediment when they receive themost runoff from their watersheds. In thisnorthern Rocky Mountain region, thisoccurs during spring when the snowpackmelts, rains fall, and the rivers flow at thehighest streamflow levels of the year.Depending on the nature of the snowmeltseason, rivers are turbid or murky fromsuspended sediment from April to July.From July on, the rivers become clearer
Winter 1997 3
0 4
Miles
Yellowst o
ne
Ri ver
Mammoth
Corwin Springs
B
A
C
Fisher CreekWhite Mill
N.E. Entrance
ParkerPeak
YellowstoneLake
Lake
Lamar Tower
Park BoundaryGaging StationWeather Station
Gallatin National Forest
Lamar
Ri ver
]
MONTANA
WYOMING
IDAHO
YellowstoneNational Park
Yellowstone's Tristate Location
Figure 1. Study area in northern Yellowstone National Park, the Gallatin NationalForest, and private lands in Montana. Study drainage subareas include: A. Yellow-stone River from Yellowstone Lake to Lamar River; B. Lamar River Basin; and C. theYellowstone River from the Lamar River to Corwin Springs, Montana.
and the level or stage of streams continu-ously falls until the next year’s snowmelt.Periodic summer rainstorms cause runoffthat carries sediment to the streams, andthis intense, concentrated precipitationon a watershed can erode more sedimentthan snowmelt waters due to the impactof rain drops or hail. Thus, rivers in thisregion can get even muddier during sum-mer than in spring, although less sedi-ment is carried because rainstorms don’tcontribute as much runoff as does thesnowmelt.
Other factors influence the amount oferosion and sediment transport in a wa-tershed. The nature of the bedrock andsoils is important, with soft rocks (such asshales) and unconsolidated sediments(such as prehistoric lake sediments) erod-ing most easily. Bedrock and soil alsoinfluence the vegetation present in a wa-
tershed. Vegetation intercepts rainfall,reducing the impact of raindrops on thesoil surface, and also binds the soil withroot networks. When vegetation is re-moved, as during construction of build-ings and roads, erosion of sediment intostreams is increased; most states requiresediment control barriers and proceduresto reduce this impact.
Rivers carry sediment in two ways: asbed load and suspended load. If you thinkof the river as a mode of transport, itcarries a load like a truck or train. Heaviersand, gravel, pebbles, and cobbles arerolled or bounced along the river bottomduring periods of high flow. This sedi-ment, referred to as the “bed load” of theriver, is difficult to measure. The lighter,individual mineral grains of sediment thatproduce the muddy water we see in riversduring snowmelt or after rainstorms is
known as the “suspended load.” It issampled using the previously mentionedbrass sampler operated from a bridge orcableway over the river.
Suspended sediment can vary greatlyin space and time. Several proceduresmust be followed to obtain representativeestimates of the sediment being carried ina river at any given time. Multiple samplesare taken across the width of the river toestablish a coefficient or multiplier toadjust daily samples taken at a singlepoint. During the spring thaw, snow meltsfaster as each day warms up; a maximummelt rate occurs at about 3 p.m., afterwhich the melt rate declines. This pro-duces a diurnal surge of water and sedi-ment that may take some time to reach thesampling station. Sediment sampling maytherefore have to occur at odd hours inorder to obtain representative samples ofthe daily sediment transport. The same istrue for sediment plumes from summerthunderstorms—the afternoon stormplume may not reach the sampling stationfor hours or days. To adjust for yearlyvariations in runoff, sediment must besampled during both low and high pre-cipitation years.
Variations in precipitation and snow-melt from 1985 to 1987 caused the Yel-lowstone River to carry widely varyingamounts of runoff (volume of water). In1985, the runoff at Corwin Springs was78 percent of the long-term average(1961-1988), while the warm spring of1986 resulted in a large snowmelt runoffand overall runoff that was 116 percent ofthe average. In 1987, a near-drought re-sulted in runoff that was just 56 percent ofthe average. These variations enabled usto sample suspended sediment duringlow, moderate, and high flow years andobtain a good estimate of the relationshipbetween streamflow and suspended sedi-ment. As it happened, the drought of1987 extended through 1988, contribut-ing substantially to the record fires expe-rienced throughout the ecosystem.
After the 1988 Fires
As the smoke from the 1988 firescleared, resource managers needed toassess the dramatic changes that had takenplace in Yellowstone, including those inaquatic ecosystems. Many studies have

Yellowstone Science4
found that several factors cause suspendedriver sediment to increase in burned wa-tersheds: raindrop impact on the soil in-creases because the tree canopy that in-tercepted raindrops is reduced or gone;surface flow increases because ofgroundcover destruction; and sedimentdelivery patterns change. Because in-creased suspended sediment may harmfish populations, we decided to continueour studies and estimate changes in sus-pended sediment output from the Yel-lowstone River drainage after the wild-fires. The objectives of the extended study,which lasted from 1989 through 1992,were to measure postfire streamflow andsuspended sediment on the Yellowstoneand several tributaries at the same placesas in our original study, and to identifyfire-related changes in river sediment.Volunteers from the Student Conserva-tion Association assisted park staff insampling rivers and gathering hydrologicinformation. The National Park Service(NPS) and USGS used the same tech-niques used in our prefire study to collectwater samples, measure streamflow, andanalyze the data.
Postfire Changes in Precipitation,Runoff, and Suspended Sediment
As it happened, average total precipita-tion was greater during the postfire studyperiod (1989-1992) than it was from 1985to 1987. Although this was also true for
postfire winter and spring averages, sum-mer precipitation was less than the prefireaverage. Although the years after thefires had greater average precipitationthan in the prefire period, cooler snow-melt periods resulted in lowerstreamflows. The largest postfire snow-melt runoff (116 percent of average) andtotal April-September runoff (102 per-cent of average) on the Yellowstone Riverat Corwin Springs occurred in 1991 ( seeTable 1). In contrast, the greateststreamflow prefire year, 1986, had a snow-melt runoff of 126 percent and totalrunoff of 116 percent of the long-termaverage.
Suspended sediment increased in theYellowstone and Lamar rivers followingthe 1988 wildfires. The question thatarose was “How much of this increasewas due to greater precipitation and run-off (climatic factors) and how much wasdue to fire-related effects, such as in-creased erosion?” The postfire averagetotal suspended sediment load increased69 percent over the prefire average for theYellowstone River and 34 percent for theLamar River (see Table 2). The postfiresnowmelt average load was 74 percentgreater than prefire on the YellowstoneRiver but only 23 percent greater on theLamar River. The Lamar River experi-enced much greater increases in summersediment load (743 percent over prefire)than did the Yellowstone River (16 per-cent over prefire).
Fire-Related Changes in Sediment
Because greater precipitation and re-sultant runoff during the postfire periodwas likely to have caused higher levels ofsuspended sediment, two methods wereused to try to isolate the changes in sus-pended sediment due to fire effects. In thefirst method, suggested by USGS hy-drologist John Lambing, the monthlymeasured load (in tons) was divided bythe monthly measured runoff (in acre-feet)to express the suspended sediment loadas an amount per monthly runoff (tonsper acre-feet). The resulting measures forpostfire and prefire periods were there-fore independent of river flow (or pre-cipitation) and could be compared. Usingthis method, changes in river sedimentcould be identified that were most likelyrelated to fire effects.
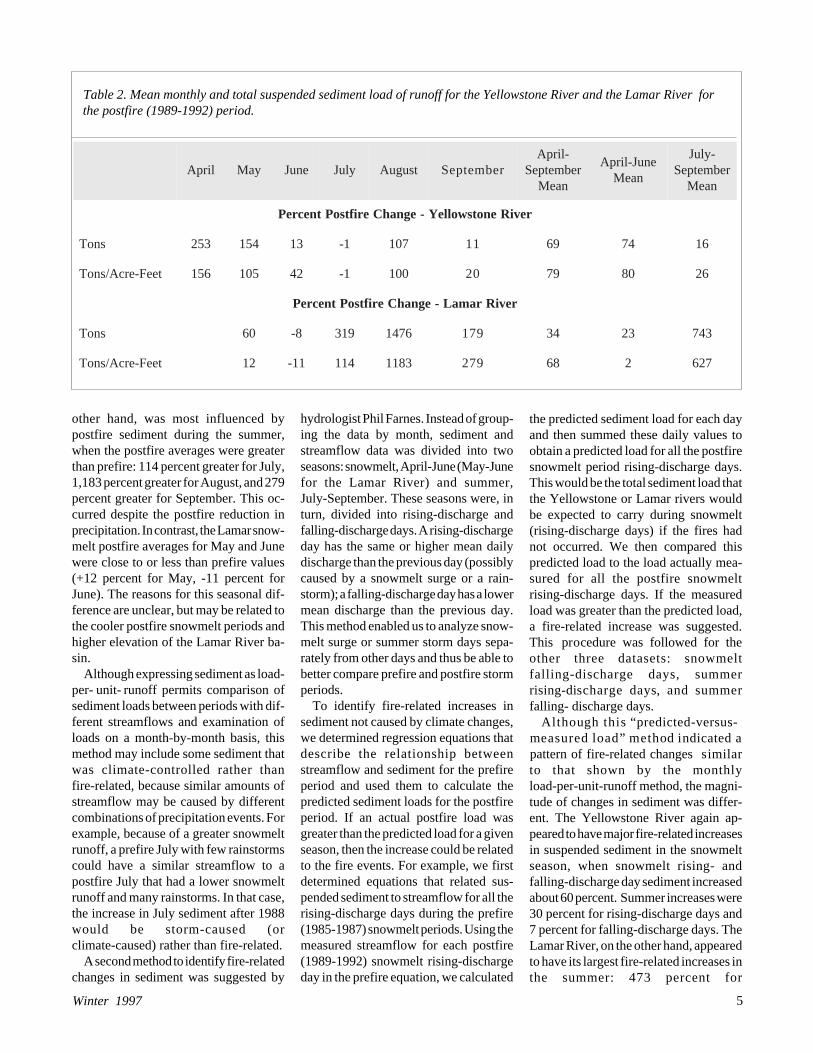
For the Yellowstone River as mea-sured at Corwin Springs, postfire increasesin monthly sediment load- per- unit- runoffoccurred most notably during the snow-melt months of April, May, and June,when the postfire monthly average(1989-1992) increased 156, 105, and 42percent over the prefire (1985-1987)monthly average values. Summer postfirechanges were more variable, with theJuly postfire average less than prefire (-1percent), August postfire average 100percent greater than prefire, and the Sep-tember postfire average 20 percent morethan the prefire. The Lamar River, on the
Table 1. Prefire 1985-1987 and postfire 1989-1992 monthly and seasonal runoff as a percentage of long-term prefiremean runoff of the Yellowstone River at Corwin Springs, Montana.
eriferP lirpA yaM enuJ tlemwonS yluJ tsuguA tpeS remmuStpeS-lirpA
latoT
5891 02.811 77.621 65.36 70.78 29.35 40.27 64.58 07.36 56.77
6891 01.551 25.501 41.231 96.521 07.49 90.901 69.111 32.101 38.511
7891 26.041 71.49 86.83 63.36 34.93 78.35 39.65 20.64 73.65
naeM 79.731 28.801 31.87 40.29 86.26 33.87 87.48 23.07 92.38
eriftsoP
9891 80.161 74.631 09.38 38.501 11.07 65.87 16.77 35.37 28.29
0991 62.242 71.19 59.68 88.99 66.97 89.48 45.58 00.28 76.29
1991 65.69 02.831 03.701 99.511 09.67 29.38 82.88 55.08 17.101
2991 80.491 84.741 92.85 68.59 63.36 69.66 16.57 52.66 39.38
naeM 94.371 33.821 11.48 93.401 15.27 16.87 67.18 85.57 87.29
Winter 1997 5
other hand, was most influenced bypostfire sediment during the summer,when the postfire averages were greaterthan prefire: 114 percent greater for July,1,183 percent greater for August, and 279percent greater for September. This oc-curred despite the postfire reduction inprecipitation. In contrast, the Lamar snow-melt postfire averages for May and Junewere close to or less than prefire values(+12 percent for May, -11 percent forJune). The reasons for this seasonal dif-ference are unclear, but may be related tothe cooler postfire snowmelt periods andhigher elevation of the Lamar River ba-sin.
Although expressing sediment as load-per- unit- runoff permits comparison ofsediment loads between periods with dif-ferent streamflows and examination ofloads on a month-by-month basis, thismethod may include some sediment thatwas climate-controlled rather thanfire-related, because similar amounts ofstreamflow may be caused by differentcombinations of precipitation events. Forexample, because of a greater snowmeltrunoff, a prefire July with few rainstormscould have a similar streamflow to apostfire July that had a lower snowmeltrunoff and many rainstorms. In that case,the increase in July sediment after 1988would be storm-caused (orclimate-caused) rather than fire-related.
A second method to identify fire-relatedchanges in sediment was suggested by
hydrologist Phil Farnes. Instead of group-ing the data by month, sediment andstreamflow data was divided into twoseasons: snowmelt, April-June (May-Junefor the Lamar River) and summer,July-September. These seasons were, inturn, divided into rising-discharge andfalling-discharge days. A rising-dischargeday has the same or higher mean dailydischarge than the previous day (possiblycaused by a snowmelt surge or a rain-storm); a falling-discharge day has a lowermean discharge than the previous day.This method enabled us to analyze snow-melt surge or summer storm days sepa-rately from other days and thus be able tobetter compare prefire and postfire stormperiods.
To identify fire-related increases insediment not caused by climate changes,we determined regression equations thatdescribe the relationship betweenstreamflow and sediment for the prefireperiod and used them to calculate thepredicted sediment loads for the postfireperiod. If an actual postfire load wasgreater than the predicted load for a givenseason, then the increase could be relatedto the fire events. For example, we firstdetermined equations that related sus-pended sediment to streamflow for all therising-discharge days during the prefire(1985-1987) snowmelt periods. Using themeasured streamflow for each postfire(1989-1992) snowmelt rising-dischargeday in the prefire equation, we calculated
the predicted sediment load for each dayand then summed these daily values toobtain a predicted load for all the postfiresnowmelt period rising-discharge days.This would be the total sediment load thatthe Yellowstone or Lamar rivers wouldbe expected to carry during snowmelt(rising-discharge days) if the fires hadnot occurred. We then compared thispredicted load to the load actually mea-sured for all the postfire snowmeltrising-discharge days. If the measuredload was greater than the predicted load,a fire-related increase was suggested.This procedure was followed for theother three datasets: snowmeltfalling-discharge days, summerrising-discharge days, and summerfalling- discharge days.
Although this “predicted-versus-measured load” method indicated apattern of fire-related changes similarto that shown by the monthlyload-per-unit-runoff method, the magni-tude of changes in sediment was differ-ent. The Yellowstone River again ap-peared to have major fire-related increasesin suspended sediment in the snowmeltseason, when snowmelt rising- andfalling-discharge day sediment increasedabout 60 percent. Summer increases were30 percent for rising-discharge days and7 percent for falling-discharge days. TheLamar River, on the other hand, appearedto have its largest fire-related increases inthe summer: 473 percent for
Table 2. Mean monthly and total suspended sediment load of runoff for the Yellowstone River and the Lamar River forthe postfire (1989-1992) period.
lirpA yaM enuJ yluJ tsuguA rebmetpeS-lirpA
rebmetpeSnaeM
enuJ-lirpAnaeM
-yluJrebmetpeS
naeM
reviRenotswolleY-egnahCeriftsoPtnecreP
snoT 352 451 31 1- 701 11 96 47 61
teeF-ercA/snoT 651 501 24 1- 001 02 97 08 62
reviRramaL-egnahCeriftsoPtnecreP
snoT 06 8- 913 6741 971 43 32 347
teeF-ercA/snoT 21 11- 411 3811 972 86 2 726

Yellowstone Science
rising-discharge days and 390 percent forfalling-discharge days. No fire-relatedsnowmelt increases in suspended sedi-ment were evident on the Lamar Riverusing this method (Fig. 2).
Climate and Variation in Fire Effects
Our research indicated that fire-relatedincreases in suspended sediment occurredon the Yellowstone and Lamar riversfollowing the 1988 wildfires, but not inall seasons, and that the hydrologic be-havior of burned watersheds can varygreatly. Postfire increases in suspendedsediment were most evident on the Yel-lowstone at Corwin Springs during springsnowmelt, while the Lamar did not trans-port abnormally large sediment loads.On the other hand, summersuspended-sediment loads increased dra-matically in the Lamar, but were notmeasured downstream on the Yellow-stone at Corwin Springs. Evidently therunoff from unburned watersheds or thosenot receiving summer storms were enoughto dilute the sediment effects from theLamar River.
The bulk of suspended sediment in thisregion is transported in rivers during thespring snowmelt season; even large in-creases in summer sediment load are smallby comparison to snowmelt loads. Thus,despite large postfire increases in sum-mer sediment loads for the Lamar River,its mean postfire load (18,253 tons) wasless than 10 percent of the mean total load(193,669 tons).
Postfire climate played an importantrole in influencing the sediment responseof the Yellowstone and Lamar rivers. Thefirst two years following the fires hadrelatively cool springs and few prolongedwarm intervals, resulting in modest snow-melt runoffs. Watersheds are most vul-nerable to accelerated erosion in the yearsimmediately after wildfires, when burnedsurface vegetation has not had time toregenerate. If there had been high snow-melt runoffs in the springs immediatelyfollowing the fires, sediment transportcould have been much higher. The coolerpostfire snowmelts from 1989 to 1992may have also mitigated the snowmeltsediment response of the higher eleva-tion Lamar basin, which was burned overa greater area than many of the other
watersheds in the Yellowstone drainagefrom Yellowstone Lake to CorwinSprings. We would naturally expect thatit would also show the greatestsuspended-load response to the fires.
Again, this study attempted to measurethe effects of the fires only upon sus-pended sediment, not total fluvial sedi-ment, in two of Yellowstone’s major riv-ers. The portion of total sediment loadcarried as bed load (coarser sediment) isoften larger as one approaches the moun-tainous headwaters of rivers. The behav-ior of coarser sediment in mountainouswatersheds following fires may be differ-ent from the suspended or finer sedimentportion of the total sediment load in mag-nitude or timing of its response. Indeed,there is evidence to suggest that therewere substantial coarse sediment and massmovement responses to the Yellowstonefires. Studies of burned and unburnedwatersheds in the Shoshone NationalForest indicate that there were majorevents of coarse sediment transport in thefirst years after the fires without a corre-sponding increase in suspended sediment.Forest staff conducted field trips offire-affected watersheds scoured and in-cised by high-volume coarse sedimentflow during summer storms. Field trips inthe Lamar River basin found numerousinstances of burnt-out woody debris jams
which would release impounded coarsebed-load sediment upon the firsthigh-streamflow storm. Likewise, GrantMeyer documented the effects of fluvial,hyper-concentrated, and debris flowevents in the Lamar watershed in 1989and 1990 in his study of fire and alluvialchange. These observations indicate ma-jor changes in the amounts of coarsesediment transported and insediment-delivery patterns in the steepmountain stream channels following thefires and provide a complementary, ifqualitative, picture of fire-effects on sedi-ment transport.
Management Implications
Findings of the postfire sediment studyuseful to resource managers fall into twoareas: direct information and analyticaltools. Establishing the normal ranges ofsuspended-sediment transport out of Yel-lowstone is direct information that can beused to compare to future sediment loadsassociated with specific managementpractices. Our sampling for sediment andstreamflow before and after the fires pro-vides baseline information on suchstreams as Soda Butte Creek, which couldhave been affected by recent develop-ments outside the park.
This study indicates that managers can
6
900
800
700
600
500
400
300
200
1001989 1990 1991 1992
Yellowstone Est.Yellowstone Meas.
Lamar Est.
Lamar Meas.
Sedi
men
t Loa
d (T
ons)
(Tho
usan
ds)
Figure 2. Estimated and measured suspended sediment loads for the YellowstoneRiver (April-September) and the Lamar River (May-September) for postfire years1989-1992.

Winter 1997
expect climate to exert the primary influ-ence upon the amounts of suspended sedi-ment sent into and carried out by streamsafter wildfires. The spring snowmelt run-off carries most of the year’s suspendedsediment in streams, and the character ofpostfire snowmelts are critical to sedi-ment responses. The scenario forleast-transported sediment is one wherethe spring is cool with few prolongedwarm periods, an average or low wintersnowpack, and little spring precipitation.The scenario for a large post-disturbancesediment response has a warmer spring,with at least one period of several con-secutive days of warm temperatures, anaverage to large winter snowpack, and alot of spring precipitation.
Summer suspended-sediment transportin the badly burned steep mountain drain-ages of the Lamar River basin increaseddramatically after the fires and yet theeffects downstream were evidently miti-gated by runoff from unburned water-sheds or those unaffected by storms.Changes in coarse sediment delivery mayhave been as great or greater as thesewatersheds released sediment stored be-hind burned woody debris dams and ex-perienced mass movement, debris, andhigh fluvial streamflows immediatelyfollowing the fires. The mountain water-sheds have been readjusting coarse sedi-ment delivery ever since the 1988 firesand are storing released sediment behindnew woody debris jams. Comparison ofpredicted to measured suspended sedi-ment in the Lamar River in 1992 suggestsa return to prefire levels and may indicatethat readjustment of sediment deliverypatterns has been accomplished.
Both linear and non-linear regressionequations relating suspended sediment tostreamflow for prefire and postfire peri-ods are among the useful analytical toolswe developed. If direct suspended-sediment sampling is conducted in thefuture, these equations can be used tocompare predicted loads to measuredloads. Estimations can be made as towhether the Yellowstone River drainagehas returned to prefire levels of sedimenttransport or whether the river is becom-ing muddier due to wildlife grazing orother factors. For the spring snowmeltseason, streamflow-sediment rating equa-tions can be used to estimate sediment
transport levels on the Yellowstone andLamar Rivers without further sampling.Based on values of mean daily streamflow,values of suspended sediment can be as-signed to each day using the proper prefirerising- or falling-discharge rating equa-tion.
A less expensive tool to monitor sedi-ment transport levels on the rivers can bedeveloped from suspended sediment-turbidity data we collected. Turbidity canbe measured more easily and cheaplythan suspended sediment and estimatesof contained suspended sediment can bemade using our sediment-turbidity dataand equations. These would be particu-larly useful during summer, whenstreamflow-sediment rating equations arenot as accurate as those forturbidity-suspended sediment.
Relationships between precipitation atpark weather stations and runoff at theCorwin Springs gaging station were re-vised after the wildfires. These multipleregression equations describe theprecipitation-runoff relationship and wereused with historical flood data to produceequations that can predict the date of peaksnowmelt runoff on the YellowstoneRiver for a given season. This informa-tion can be of value in planning for clos-ing areas due to high water, predictingearliest dates for fording rivers, or otheractivities that require knowledge of thedate of peak river flow. Finally, informa-tion on suspended sediment levels andhydrological patterns can be useful tofisheries and aquatic ecology studies.
The Importance of Baseline Data
As the United States becomes moredeveloped, we need to measure the physi-cal and ecological processes in wildlandareas so that we can judge possible ef-fects of natural or anthropogenic distur-bances. If we do not know the hydrologicand sediment behavior in unmanipulatedlandscapes, we cannot know how farwatersheds will deviate from normal whenmodified by construction, agriculture, ornatural disturbances such as fires. Putanother way, how can we judge if a streamis acting “naturally” without comparingit to streams in wild, unmodified land-scapes? Few undammed or undivertedwatersheds such as the Yellowstone River
7
are left to study in the United States. Itwas fortuitous that three years of sam-pling and measurement had been com-pleted before the 1988 fires, for withoutit, we could not have measured the effectsof the fires upon suspended sedimentloads. Resource managers now have asuspended sediment database that can beused as a yardstick in the future. Forinstance, comparison of 1992 data to theprefire average indicated that the Yel-lowstone River had not yet returned toprefire levels of sediment transport. Howlong did the effects of the 1988 fires last?Are the effects, in fact, over? Is the Yel-lowstone River getting muddier due towildlife overgrazing, as anglers suspectedin the days of the sediment study? Is upliftof parts of the Yellowstone plateau byunderlying magma causing increasingsediment transport? These questions can-not be addressed, much less answered,without a historic database of naturalresource information.
In retrospect, driving many miles eachweek, hiking up burned-out mountainstreams, sampling in the rain and snow,and hanging out over rivers late at night,proved to be only slightly crazy and wellworth the effort.
Roy Ewing studied northernYellowstone’s watersheds from 1985 to1994, seeking to shed some clarity on themurky issue of muddy waters. He has amaster’s degree in geology from the Uni-versity of Tennessee. While with thePeace Corps in India he worked on awater drilling project . He currently livesin his home state of Tennessee.
REFERENCES
Bevinger, G. 1989, 1990, 1991. Interim Reports,Silvertip Watershed Monitoring Project. ShoshoneNat. Forest, Cody, Wyo.
Ewing, Roy 1995. Suspended Sediment in theYellowstone National Park Area Following the1988 Wildfires. Yellowstone Center for Re-sources, Nat. Park Serv., Yellowstone Nat.Park,Wyo.
Ewing, Roy 1996. Postfire Suspended Sedimentfrom Yellowstone National Park, Wyo. WaterResources Bulletin 32(3):605-627.
Meyer, Grant A., S.G. Wells, R.C. Balling, andA.J. Jull 1992. Response of Alluvial Systems toFire and Climate Change in Yellowstone Na-tional Park. Letters to Nature, Nature 357:147-150.
Yellowstone Science8
benefit of the extensive dam constructiontaking place throughout the west in the1950s and 1960s. With its Yellowstonefishery researchers needed elsewhere, theUSFWS replaced them in 1961 with ateam of managers whose mission was toapply the research findings. This includedthe concept of “maximum sustained yield”(MSY), which had become accepted byfishery biologists throughout the world.According to MSY theory, the number offish that can be harvested annually with-out causing the fishery to collapse (the“harvestable surplus”) is considered botha goal and a restraint. As the MSY isapproached each year, the catch per hourstarts to decline and anglers catch fewerlarge fish and presumably stop fishing. Ifno more than the MSY is removed, thefishery can be sustained indefinitely, butexceeding the MSY results in recruit-ment failure and the population will plum-met.
Embedded within this complex equa-tion is the old idea that all forms ofwildlife go forth and multiply to producea surplus of animals, leaving the humanspecies with the duty to harvest them. AtYellowstone, this meant it was thoughtbeneficial to occasionally cull the elk andbison herds, ship “extra” bears to zoos,and harvest fish for their own good. It wassimply a scientific matter of determininghow many animals could or should beremoved. In 1963, the MSY for Yellow-stone Lake was estimated to be 325,000cutthroat trout a year. (The YellowstoneLake harvest had peaked at about 390,000fish in 1959.) However accurate MSYmay have been in theory, the fisherymanagers found it unworkable in prac-tice. Random fluctuations in the environ-ment upset the balance of recruitmentand harvest—high spring waters mightincrease spawning mortality, or fine sum-
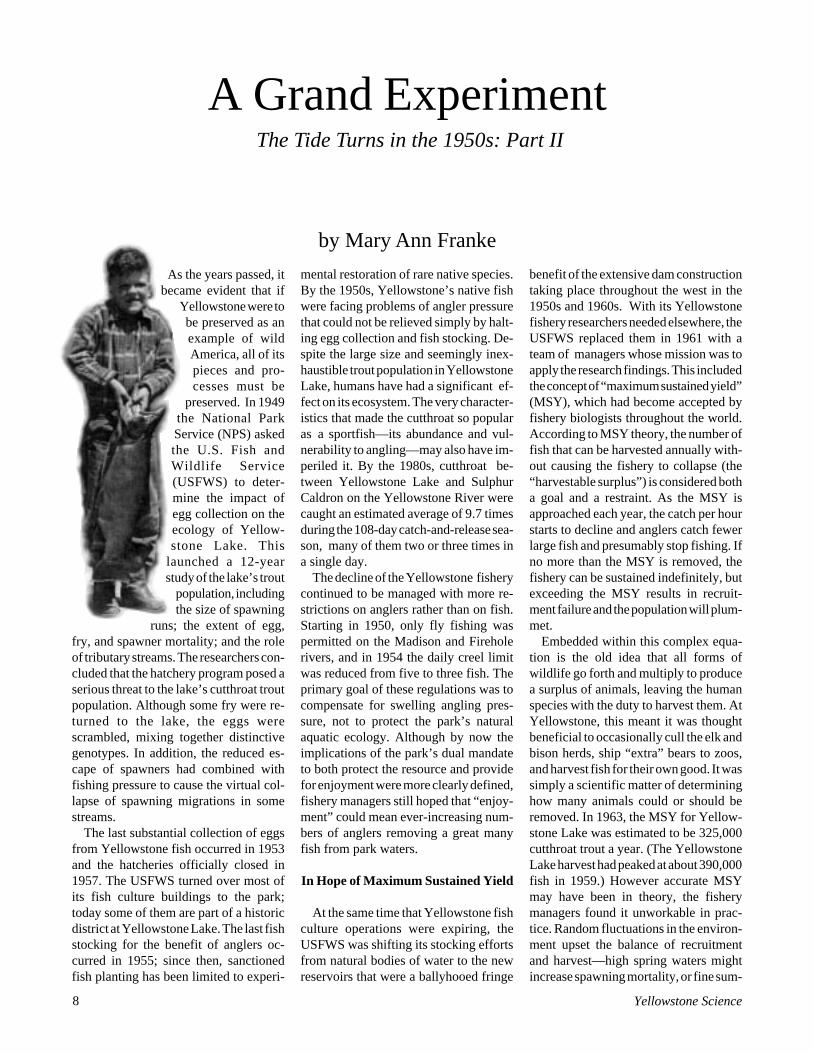
As the years passed, itbecame evident that if
Yellowstone were tobe preserved as anexample of wildAmerica, all of itspieces and pro-cesses must be
preserved. In 1949the National ParkService (NPS) askedthe U.S. Fish andWildlife Service(USFWS) to deter-mine the impact ofegg collection on theecology of Yellow-stone Lake. This
launched a 12-yearstudy of the lake’s trout
population, includingthe size of spawning
runs; the extent of egg,fry, and spawner mortality; and the roleof tributary streams. The researchers con-cluded that the hatchery program posed aserious threat to the lake’s cutthroat troutpopulation. Although some fry were re-turned to the lake, the eggs werescrambled, mixing together distinctivegenotypes. In addition, the reduced es-cape of spawners had combined withfishing pressure to cause the virtual col-lapse of spawning migrations in somestreams.
The last substantial collection of eggsfrom Yellowstone fish occurred in 1953and the hatcheries officially closed in1957. The USFWS turned over most ofits fish culture buildings to the park;today some of them are part of a historicdistrict at Yellowstone Lake. The last fishstocking for the benefit of anglers oc-curred in 1955; since then, sanctionedfish planting has been limited to experi-
mental restoration of rare native species.By the 1950s, Yellowstone’s native fishwere facing problems of angler pressurethat could not be relieved simply by halt-ing egg collection and fish stocking. De-spite the large size and seemingly inex-haustible trout population in YellowstoneLake, humans have had a significant ef-fect on its ecosystem. The very character-istics that made the cutthroat so popularas a sportfish—its abundance and vul-nerability to angling—may also have im-periled it. By the 1980s, cutthroat be-tween Yellowstone Lake and SulphurCaldron on the Yellowstone River werecaught an estimated average of 9.7 timesduring the 108-day catch-and-release sea-son, many of them two or three times ina single day.
The decline of the Yellowstone fisherycontinued to be managed with more re-strictions on anglers rather than on fish.Starting in 1950, only fly fishing waspermitted on the Madison and Fireholerivers, and in 1954 the daily creel limitwas reduced from five to three fish. Theprimary goal of these regulations was tocompensate for swelling angling pres-sure, not to protect the park’s naturalaquatic ecology. Although by now theimplications of the park’s dual mandateto both protect the resource and providefor enjoyment were more clearly defined,fishery managers still hoped that “enjoy-ment” could mean ever-increasing num-bers of anglers removing a great manyfish from park waters.
In Hope of Maximum Sustained Yield
At the same time that Yellowstone fishculture operations were expiring, theUSFWS was shifting its stocking effortsfrom natural bodies of water to the newreservoirs that were a ballyhooed fringe
A Grand Experiment
by Mary Ann Franke
The Tide Turns in the 1950s: Part II
Winter 1997 9
mer weather could increase angler days—making the MSY goal infeasible. Thefishery managers didn’t know what theannual harvest target would be each yearuntil it was too late to do anything aboutit; its “accuracy” was meaningful only ina historical context.
When a “Fishing for Fun” programbegan in 1962, instead of being requiredto keep and count all fish toward theirdaily limit, anglers were encouraged toreturn fish to the water. But this first steptoward catch-and-release fishing in-creased exploitation in popular fishingareas because anglers no longer had tostop after three fish: they could keepgoing until they’d landed three big ones.This reduced the spawning stock and,with the use of bait still permitted, hook-ing mortality for released fish was esti-mated to be 18 percent. And even withcatch-and-release encouraged, many fishwere deliberately wasted. “Investigationshave shown that in the Fishing Bridgearea in a single month, 7,500 fish werediscarded in garbage receptacles,” ac-cording to the Superintendent’s AnnualReport for 1966. By then, the USFWShad recommended that “Fishing for Fun”be suspended. To better distribute an-glers by encouraging use of remote lakeareas, they recommended permittinglarger boats on the lake and increasing thedaily limit to five fish in certain areas.They even proposed building a roadaround the lake to “equalize fishing pres-sure.” The park did not regard such mea-sures as the solution to increasing anglingpressure and declined to adopt them.
Even if the 1963 MSY estimate of325,000 cutthroat trout was accurate, prioryears of excessive harvest, especially ofspawning age trout, produced dire re-sults. During the period from 1963 to1969, the catch rate fell from 0.71 to 0.45trout per hour, the lowest on record. Andtwo years after the estimated number ofanglers on Yellowstone Lake reached itsall-time high of 242,000 in 1967, theannual harvest dropped to 175,000 trout.
While fisheries managers were stilltrying to apply MSY theory, the InteriorSecretary’s Advisory Board on WildlifeManagement set forth a far more momen-tous idea in 1963. Known as the LeopoldReport, for chairman A. Starker Leopold,it advised: “As a primary goal, we would
recommend that the biotic associationswithin each park be maintained, or wherenecessary recreated, as nearly as possiblein the condition that prevailed when thearea was first visited by the white man.”As the report prophetically recognized,“The implications of this seeminglysimple aspiration are stupendous.”
A New Form of Angler Pride
With the impetus of the Leopold Re-port and the threat of resource damagefrom increasing visitation, Yellowstonebegan to move toward more “natural”ecosystem regulation when Jack Ander-son became Superintendent in 1967.Although the transition initiated a periodof great controversy in elk, bison, bear,and fire management, changes to the fish-ery program received wide-spread sup-port. The perspective of the USFWS andof anglers themselves was shifting; manyrealized that without tighter controls onthe number of harvested fish, their fish-ing days would be numbered.
To bolster its fish populations, Yellow-stone adopted stricter angling regulationsthat varied by species and location. In1969 bait fishing was prohibited to fostercatch-and-release fishing and to preventthe planting of non-native species causedby bait dumping. Starting in 1970, cut-throat trout from Yellowstone Lake hadto be at least 14 inches long to be kept. In1973, the daily creel limit for most parkwaters was dropped to two fish and manystreams were designated catch-and-re-lease only. Some waters, including theYellowstone River at Fishing Bridge andin Hayden Valley, were closed entirely tofishing to protect spawning runs, for aes-thetic reasons, or to allow waterfowl andwildlife to use the shoreline waters undis-turbed.
With the new size and creel limits, by1974 the cutthroat harvest from Yellow-stone Lake had dropped to an annualaverage of about 100,000 trout, while thelanding rate had risen to almost one troutan hour. Despite signs of population re-surgence, the 14-inch minimum size limithad the unfortunate effect of removingthe older and larger cutthroat trout. By1974 data showed that the average size ofcutthroat prespawners had begun to de-crease to levels observed before the 14-
“I fully realize how humanly chest-expanding it is to empty a full creelbefore an admiring circle of friends.But there is a great kick in the otherpoint of view if only you can onceacquire it. There is a great kick intaking a fine trout who has foughtyou well, gently removing the hook,holding him firmly behind the pec-toral fins, and placing him a fewseconds in the water whilst he re-covers his breath, then watching lifecome back, his tail begin to wag asthough in gratitude, and finally see-ing him glide away happily into theelement from which you took him...You will not be saving just onetrout; you will be sponsoring a newform of pride amongst anglers whichin time, I hope, will replace the pridein the long string of dead fish.” —Howard Back, The Waters ofYellowstone With Rod and Fly, 1938.
inch minimum was set.To improve the age structure and fur-
ther reduce the annual harvest, the sizelimit was changed to a 13-inch maximumin 1975. Three years later, however, theprospects for Yellowstone Lake cutthroatwere still in doubt. According to the Fish-ery Management Program report for 1977:“The total annual kill on YellowstoneLake may still be too large to achievecompatibility under current use trends.Either increased effort and/or improvedcatch-per-unit-effort will significantlyincrease the total kill over current levels.Providing optimum sport fishing requiresthat the trout stock is at a populationdensity well above the MSY level toinsure sufficient density, competition, andvoraciousness to provide said sport. Fromour experience on other no-kill cutthroatfisheries in the park, catch-and-releaseonly fishing on Yellowstone Lake is defi-nitely indicated.”
The fishery managers were more pes-simistic than appears warranted, at leastso far. Although the landing rate hasremained high during the last 20 years,the proportion of older and larger cut-throat trout in both angler catch and inspawning streams has increased. Becausethe fish have become larger, fewer have
Yellowstone Science
that maintain natural conditions.While the growing number of wildlife
viewers provided much of the stimulusfor hunting bans in national parks, fishhave always been regarded differentlythan other wildlife and lacked such de-fenders. For most people, wildlife appre-ciation entails direct observation of ani-mals whose family relationships and be-havior can be more easily viewed andanthropomorphized than those of fish.However, anglers can help in the defenseof the cutthroat trout in Yellowstone Lake,according to John Varley, Director of theYellowstone Center for Resources andformer staff member of Yellowstone’sFisheries Assistance Office (FAO).“We’re absolutely going to need the an-gler to help us with lake trout control. Wecan’t afford to replace their 250,000 hoursof effort a year in removing that non-native predator.”
Still Angling After All These Years
To help determine the effect of anglinglimits and monitor fisheries trends, theFAO established the Volunteer AnglerReport (VAR) in 1973. Using a combina-tion of park exit surveys and postage-paid return cards given to anglers withtheir licenses, the VAR system keepsrecords on angling pressure, harvest, land-ing rate, mean length of fish, and compli-ance with fishing regulations.
been small enough to be kept and morehave remained in the lake to spawn. Boththe fish and the angler have benefitted incertain ways from the shift to less con-sumptive angling. Since catch-and-re-lease fishing was established on the Yel-lowstone River between YellowstoneLake and the Grand Canyon, the percent-age of anglers who land at least one troutthere has almost doubled, to 62 percent.According to visitor surveys, catching atleast one fish is the most important com-ponent in providing anglers with a satis-fying experience.
The “improvement” cannot be mea-sured simply in numbers. What manyanglers want from their fishing experi-ence has changed. In the 1930s, someanglers objected to stocking “catchable”size trout rather than eggs and finger-lings; they preferred catching “stream-grown” fish, which they considered “wildtrout fishing.” Today, quality angling inYellowstone is officially defined as “theopportunity to fish for wild trout in a wildsetting,” with less emphasis on numbersor sizes of fish caught and more on thetotal experience. A total experience in anundisturbed environment means that fishare primarily available to other animalsas food.
Although there may be a computable“harvestable surplus” of fish that can beremoved from Yellowstone each yearwithout damaging its native species, the
goal of the fisheries program is no longerto achieve it. In the same way that elk,bear, and bison populations are now per-mitted, insofar as possible, to controltheir size through natural regulation, thedecline of angling pressure onYellowstone’s lake and streams will per-mit fish populations to be controlled to alarger extent by other factors. As a result,fish populations have been restored to alevel more closely resembling their primi-tive state and are functioning more natu-rally as part of the park’s nutrient chain.
Why is Fishing Permitted inYellowstone?
While fishing is provided for by law insome national parks, it exists by traditionin others like Yellowstone. As park man-agers have learned how to best provide anenjoyable fishing experience while pre-serving the fish resource, they must stilladdress the question: “Why isn’t fishingprohibited as hunting is?”
Of the many possible answers—tradi-tion, the dependence of the local economyon fishing, the greater popularity of an-gling compared to hunting, the lack ofdanger posed to other park visitors andwildlife posed by fishing compared tohunting—none will satisfy the purist.Angling is an anomaly in a park whoseprimary purpose is to preserve naturalenvironments and native species in ways
10
19921988198419801976197219680
20,000
40,000
60,000
80,000
100,000
120,000
140,000
160,000
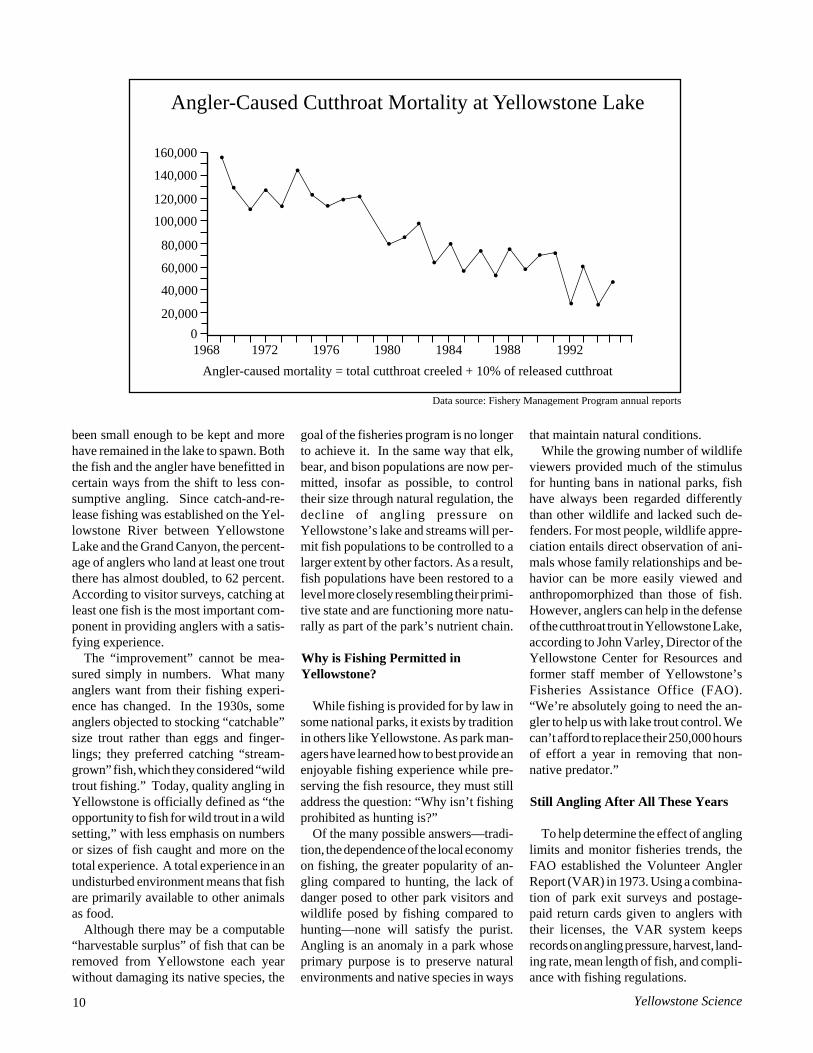
Angler-Caused Cutthroat Mortality at Yellowstone Lake
Angler-caused mortality = total cutthroat creeled + 10% of released cutthroat
Data source: Fishery Management Program annual reports
Winter 1997 11
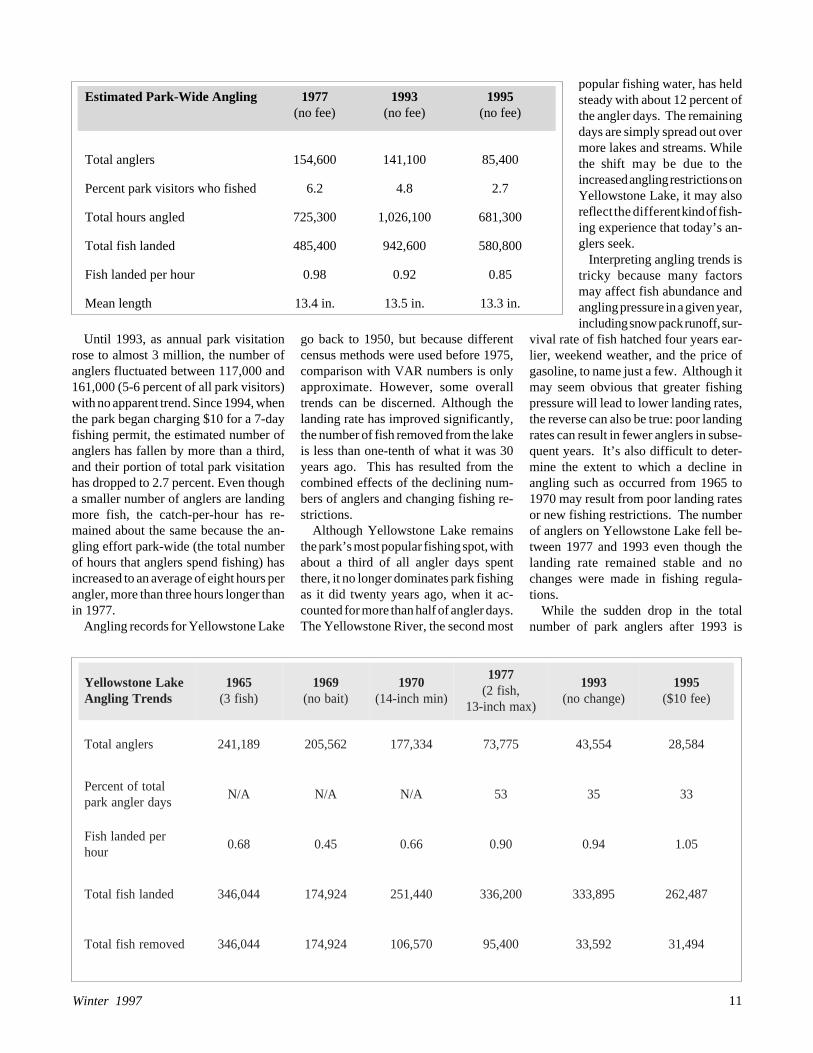
Until 1993, as annual park visitationrose to almost 3 million, the number ofanglers fluctuated between 117,000 and161,000 (5-6 percent of all park visitors)with no apparent trend. Since 1994, whenthe park began charging $10 for a 7-dayfishing permit, the estimated number ofanglers has fallen by more than a third,and their portion of total park visitationhas dropped to 2.7 percent. Even thougha smaller number of anglers are landingmore fish, the catch-per-hour has re-mained about the same because the an-gling effort park-wide (the total numberof hours that anglers spend fishing) hasincreased to an average of eight hours perangler, more than three hours longer thanin 1977.
Angling records for Yellowstone Lake
go back to 1950, but because differentcensus methods were used before 1975,comparison with VAR numbers is onlyapproximate. However, some overalltrends can be discerned. Although thelanding rate has improved significantly,the number of fish removed from the lakeis less than one-tenth of what it was 30years ago. This has resulted from thecombined effects of the declining num-bers of anglers and changing fishing re-strictions.
Although Yellowstone Lake remainsthe park’s most popular fishing spot, withabout a third of all angler days spentthere, it no longer dominates park fishingas it did twenty years ago, when it ac-counted for more than half of angler days.The Yellowstone River, the second most
popular fishing water, has heldsteady with about 12 percent ofthe angler days. The remainingdays are simply spread out overmore lakes and streams. Whilethe shift may be due to theincreased angling restrictions onYellowstone Lake, it may alsoreflect the different kind of fish-ing experience that today’s an-glers seek. Interpreting angling trends istricky because many factorsmay affect fish abundance andangling pressure in a given year,including snow pack runoff, sur-
vival rate of fish hatched four years ear-lier, weekend weather, and the price ofgasoline, to name just a few. Although itmay seem obvious that greater fishingpressure will lead to lower landing rates,the reverse can also be true: poor landingrates can result in fewer anglers in subse-quent years. It’s also difficult to deter-mine the extent to which a decline inangling such as occurred from 1965 to1970 may result from poor landing ratesor new fishing restrictions. The numberof anglers on Yellowstone Lake fell be-tween 1977 and 1993 even though thelanding rate remained stable and nochanges were made in fishing regula-tions.
While the sudden drop in the totalnumber of park anglers after 1993 is
ekaLenotswolleYsdnerTgnilgnA
5691)hsif3(
9691)tiabon(
0791)nimhcni-41(
7791,hsif2(
)xamhcni-31
3991)egnahcon(
5991)eef01$(
srelgnalatoT 981,142 265,502 433,771 577,37 455,34 485,82
latotfotnecrePsyadrelgnakrap
A/N A/N A/N 35 53 33
repdednalhsiFruoh
86.0 54.0 66.0 09.0 49.0 50.1
dednalhsiflatoT 440,643 429,471 044,152 002,633 598,333 784,262
devomerhsiflatoT 440,643 429,471 075,601 004,59 295,33 494,13
Estimated Park-Wide Angling 1977 1993 1995(no fee) (no fee) (no fee)
Total anglers 154,600 141,100 85,400
Percent park visitors who fished 6.2 4.8 2.7
Total hours angled 725,300 1,026,100 681,300
Total fish landed 485,400 942,600 580,800
Fish landed per hour 0.98 0.92 0.85
Mean length 13.4 in. 13.5 in. 13.3 in.

Yellowstone Science12
easily attributed to the new permit fee, italso seems reasonable to expect that, astotal park visitation has grown and be-come more diverse, the percent of visi-tors who come to Yellowstone primarilyor partly to fish would decline. Mean-while, the park has also been tracking theextent of “non-consumptive” use of fishresources, by which is meant the enjoy-ment of fish without benefit of rod andreel. In 1994, there were an estimated176,400 observers at LeHardy Rapids onthe Yellowstone River, where spawningcutthroat can be seen jumping the rapids,and 167,000 at Fishing Bridge, wherehundreds of trout can be seen feeding,fighting, and mating in the water below.However, these numbers also droppedafter 1993, suggesting that many of thespectators are also sport fishermen.
A Transition Period for FisheryManagement
For decades the park’s fisheries pro-gram was guided by an interagency agree-ment whereby the NPS helped to fund thefishery monitoring and management ac-tivities carried out by USFWS staff work-ing in the FAO. While the NPS has beenresponsible for policy guidance and set-ting and enforcing the park’s fishing regu-lations, it has been USFWS staff whohave gathered and analyzed the data onfish populations and angler use needed tocome up with appropriate restrictions foreach species and body of water. Alongwith its more dubious legacies, the longhistory of fishery management in Yel-lowstone has established a long-termdatabase on the park’s fish species thatexceeds that for any other park animal.For example, FAO activities included:§ Backcountry stream and lake sur-
veys for baseline chemical, physical, andbiological characteristics; preparation ofwatershed maps, and evaluation of thehabitat’s ability to support fish.§ Spawning surveys related to grizzly
bear predation on fish.§ Monitoring the effects of fire activ-
ity and fire retardants on fish populations.§ Removal of non-native brook trout
from Arnica Creek to prevent invasion ofYellowstone Lake and other tributaries.§ Gill-netting of non-native lake trout
in Yellowstone Lake.
§ Testing for whirling disease, whichhas not yet been found in the park, butwhich fisheries biologists believe is amajor cause of trout declines in the Madi-son River outside the park.§ Collecting brood stock from the
Yellowstone River to help restore cut-throat trout in its range outside the park(in cooperation with the Montana andWyoming game and fish departments).
However, as a result of its own budgetconstraints and priorities shifting towardrestoration and management of imperiledspecies, the USFWS closed its FisheriesAssistance Office in September 1996.“Because our role in Yellowstone wasone of technical advice rather than man-agement responsibility, it became a luxuryitem the Fish and Wildlife Service couldno longer afford,” explained LynnKaeding, former project leader for theUSFWS Fishery and Aquatic Manage-ment Program in Yellowstone.
But Kaeding looks back with somesatisfaction on the progress made in cre-ating a better balance between anglingpressure and natural regulation of fishpopulations. Fish populations that werelong depleted have been restored to alevel more closely resembling their primi-tive state, and are functioning more natu-rally as part of the park’s nutrient chains.“Although they came in before my time,I’d have to say that the regulation changesmade in the 1970s were a high-watermark for this office. Part of their successis due to the fact that Yellowstone hasexclusive jurisdiction over its waters andcan implement the kind of restrictionsthat would be difficult or impossible else-where. There is only one Yellowstoneand only one fishery resource like this.”
“The Fish and Wildlife cooperativeagreement with the park has been a goodthing,” agreed Dan Reinhart, resourcemanagement coordinator for the LakeDistrict, “and we are going to miss themdearly, especially now that we have thelake trout crisis to deal with.”
Lynn Kaeding and one of the otherFAO fishery staff members have beenreassigned to the USFWS office inBozeman, Montana, which is involved ininteragency efforts to restore river popu-lations of Arctic grayling, bull trout, andwestslope cutthroat trout, and to addressthe whirling disease threat to trout fisher-
ies in the Northern Rockies. AnotherUSFWS staff member has chosen to re-main in Yellowstone and transfer to theNPS. Dr. Jack McIntyre, a retired fisher-ies biologist with extensive experience inthe university and federal domains, hasbeen volunteering as interim head of thepark’s fisheries program since July 1996.
Although the park expects to add morepermanent aquatic or fisheries biologiststo its staff during the next few years, StuColeman, chief of the Natural ResourcesBranch at Yellowstone, looks forward tocontinuing cooperative efforts with theUSFWS. “We think that it is essentialthat this long-standing partnership bemaintained for the benefit of the aquaticresources of the park and surroundinggreater Yellowstone area,” he said. “Cur-rently the park and the Bozeman unit aredrafting a Memorandum of Understand-ing to outline areas of mutual concern andsupport.”
The Limits of Restoration
Although taking on full responsibilityfor running the Yellowstone’s fisheries
Fisheries Assistance Office personnelduring grayling egg-taking opera-tions (above) at Grebe Lake in June1976, and transporting grayling viahelicopter bucket to Canyon Creek(below) in September of the same year.

Winter 1997 13
program will present a financial chal-lenge at a time when budgets are alreadystrained, John Varley does not see thedeparture of the USFWS staff as result-ing in any significant changes of direc-tion. “Our three major objectives willremain the same: to manage aquatic re-sources as an integral part of the ecosys-tem; to preserve and, where feasible, re-store native fishes and their habitats; andto provide high-quality fishing opportu-nities that are consistent with the first twoobjectives.” More specifically, the pri-orities during the coming years will be to:§ Assess the magnitude of the pos-
sible impacts of lake trout on the Yellow-stone cutthroat trout population and moni-tor the effects.§ Control lake trout abundance to the
extent necessary to prevent decline of thecutthroat trout to no more than 10 percentof 1985-1995 population levels.§ Reestablish westslope cutthroat and
fluvial grayling in park waters whereappropriate.§ Eliminate exotic fish and snails
from park waters where feasible anddesirable.§ Maintain fishing regulations and
opportunities that are consistent withquality angling, fish populations, andother wildlife goals at each location.
If Yellowstone could bring the wolfback, shouldn’t it remove the rainbow,brook, and lake trout? Some environ-mentalists regard the question of return-ing waters like Lewis and Shoshone lakesto fishlessness as a measure ofYellowstone’s commitment to restoringthe ecosystem to its primitive state. Forthe immediate future, the discussion re-mains largely philosophic because thereis no feasible means to entirely extirpatenon-native fish without damaging nativeresources—bombing the lakes to savethem, as it were. Furthermore, because
Yellowstone waters generally receivedonly one or two plantings a long whileago and have remained relatively undis-turbed since then, the park’s populationsof both native and exotic species havebecome valuable as a gene pool.
“We believe we have very pure strainsof both Loch Levan and Von Behr browntrout,” said John Varley. “And we mayhave unique strains of rainbow trout thatcould become important in addressingthe problem of whirling disease.” For thelast decade, lake trout eggs from LewisLake, which were stocked from LakeMichigan a hundred years ago, have beenused to reestablish “genetically pure” laketrout in Lake Michigan, where they hadbeen extirpated by commercial fishing,parasitism by non-native sea lamprey,and pollution.
Efforts to restore fluvial grayling in thepark have been hampered by the lack ofsuitable sites; much of their former habi-tat is now occupied by non-native specieswith which they cannot compete. In1976, the brown and rainbow trout werepoisoned in Canyon Creek and a barrierwaterfall was constructed to prevent up-stream recontamination, but neither thepoisoning nor the transplant endured asthe grayling slipped downstream. Morerecently Cougar Creek, which is in thegrayling’s native range, was chosen forexperimental planting because it containsonly hybridized westslope cutthroat troutand mottled sculpin, species that havehistorically been sympatric with the gray-
ling. Attempts at stocking various densi-ties and age classes during 1993-1996have not been encouraging. “The fluvialgrayling don’t seem to be very fond ofCougar Creek,” John Varley observed.“They’re a big river fish. But we’ll prob-ably get them back in the park someday.”
As part of its fundraising effort for thenext year, the Yellowstone Foundationhas pledged to raise $30,000 to restorewestslope cutthroat to their native rangein Canyon Creek. After Canyon Creekhas been chemically “reclaimed” using amore sophisticated technique than wasavailable in 1976, pure westslope cut-throat brood stock from the headwaterareas in Montana, will be planted in thecreek.
Into the 21st Century
Although its geographical remotenessand status as a national park did notprevent some apparently irreversible mis-takes, Yellowstone still contains one ofthe most significant and unimpairedaquatic ecosystems in the United States.Through the blessings of politics andgeology, it contains the headwaters ofmost of its watersheds, minimizing thepossibility of receiving downstream pol-lution from developed areas. Despite thechanges that have taken place in the park’soriginal aquatic species composition anddistribution, over the long run NPS poli-cies have prevented or at least reducedhabitat degradation from dam and roadconstruction, mineral extraction, siltingfrom deforestation, water diversion forirrigation, and livestock grazing.
So the grand Yellowstone experimentwill continue into the 21st century. Whathas changed since Captain Boutelle re-quested the first planting of rainbow troutin 1889 is that we no longer expect we canimprove upon the assemblage and pro-cesses that this particular portion of theearth arrived at without human assis-tance. Nor, having seen the results ofhuman influence, can we simply retreatand “let nature take its course.” Instead,with Yellowstone’s fish, as with all itswildlife, we hope that by reaching a deeperunderstanding of how natural processeswork without our interference we canbetter manage the wildlands and watersthat are left to us to preserve. ❧
“Restoring the primitive scene is notdone easily nor can it be done com-pletely... Exotic plants, animals, anddiseases are here to stay. All theselimitations we fully realize. Yet, ifthe goal cannot be fully achieved itcan be approached.” — A. S. Leopoldet al., Wildlife Management in theNational Parks, 1963
Fish populations and fisheries man-agement in Yellowstone have a pro-found effect on the species of birds andmammals that feed on them.

Yellowstone Science14
Decades ago, Aldo Leopold stated thatit would not be logging, mining, or roadsthat would threaten the wilderness, butthe people who came to visit these areas.Although many camping-induced impactsmay initially be subtle, campsites receivethe greatest impact of any backcountryareas and land managers are concernedthat cumulative and accelerated changesmay be occurring. If management strate-gies and practices to conserve wildernessenvironments are to be developed, mea-surements of the impacts and environ-mental changes are essential. One suchimpact that had not been researched wasthat of camping-related activities on theforest structure surrounding backcountrycampsites.
To determine if such changes are mea-surable, I studied 30 campsites in Yel-lowstone National Park (YNP) during1993 and 1994.
My hypotheses were that:• The density of tree saplings up to
140 cm (4.6 ft) height would increase asdistance from the campsite increased.
• The forest structure around camp-sites would be measurably different de-pending on user type, i.e., sites used bybackpackers compared to those used bycampers arriving by canoes and motor-boats.
• More annual campsite users wouldcorrelate with a larger area of impact.
This research was conducted as part ofa master’s degree program within theDepartment of Earth Science at MontanaState University in cooperation with TomOlliff of the Backcountry Office in Yel-lowstone, with funding provided by theYellowstone Center for Mountain Envi-ronments (now the Mountain ResearchCenter) at Montana State University.David Cole, of the Aldo Leopold Center
for Wilderness Research, IntermountainResearch Station, U.S. Forest Service,also provided financial and technical sup-port which proved invaluable.
Previous Research
Research within mountainous environ-ments (Cole 1982, 1989) has shown thatforest tree species and other woody veg-etation are more susceptible to damageby trampling than are forbs. In the EagleCap Wilderness (Cole 1986) and the BobMarshall Wilderness (Cole 1983), sap-lings were found to be more susceptibleto trampling than were mature trees, andalmost all saplings within campsite areaswere eliminated because of trampling.The forest regeneration that did occurtook place within isolated pockets ofcampsites where young trees were pro-tected by mature trees.
Leave Only Footprints?How Backcountry Campsite Use Affects Forest Structure
by James Y. Taylor
Photo James Taylor
Winter 1997 15
Increasing campsite use has been posi-tively correlated with increased impacts.It has been found that even with low use,campsite degradation, reductions in treedensity, and changes in the percent ofunderstory vegetation have occurredwithin mountain environments of thewestern United States. Studies of humanuse and campsite impacts have shownthat the most influential factors of recre-ational impact included user behaviorand mode of travel.
Sampling Method
We chose YNP for this study becauseit has data available on the annual num-bers of backcountry users and types ofuse for each campsite. This type of data israre, and has been lacking in many previ-ous impact studies. Topographic maps,aerial photographs, backcountry user data,surficial geology maps, habitat maps,cover type maps, and previous campsiteinventories were used to selectbackcountry campsites on bothYellowstone Lake and Shoshone Lake,which had multiple user types and anabundance of campsites at similar eleva-tions with similar microclimatic condi-tions.
This study included 30 campsites withinthe lodgepole cover types (LP1 and LP2as used by Don Despain of the NationalBiological Service in Yellowstone): 12
were exclusively motorboat sites, 13 wereexclusively canoe sites, and 5 were ex-clusively backpacking sites. (There areno stock sites on Yellowstone or Shoshonelakes.) The average annual number ofusers at each of the 30 campsites rangedfrom 37 to 756. To maintain an even rateof regeneration potential, sites in olderforests and those recovering from recentfires were not used. Three control sites,which showed no signs of prior use, weremeasured in the same way as the camp-sites so that as many natural factors aspossible would remain constant. Thesenon-camping control sites were randomlylocated 1 km along the shoreline fromevery tenth campsite studied.
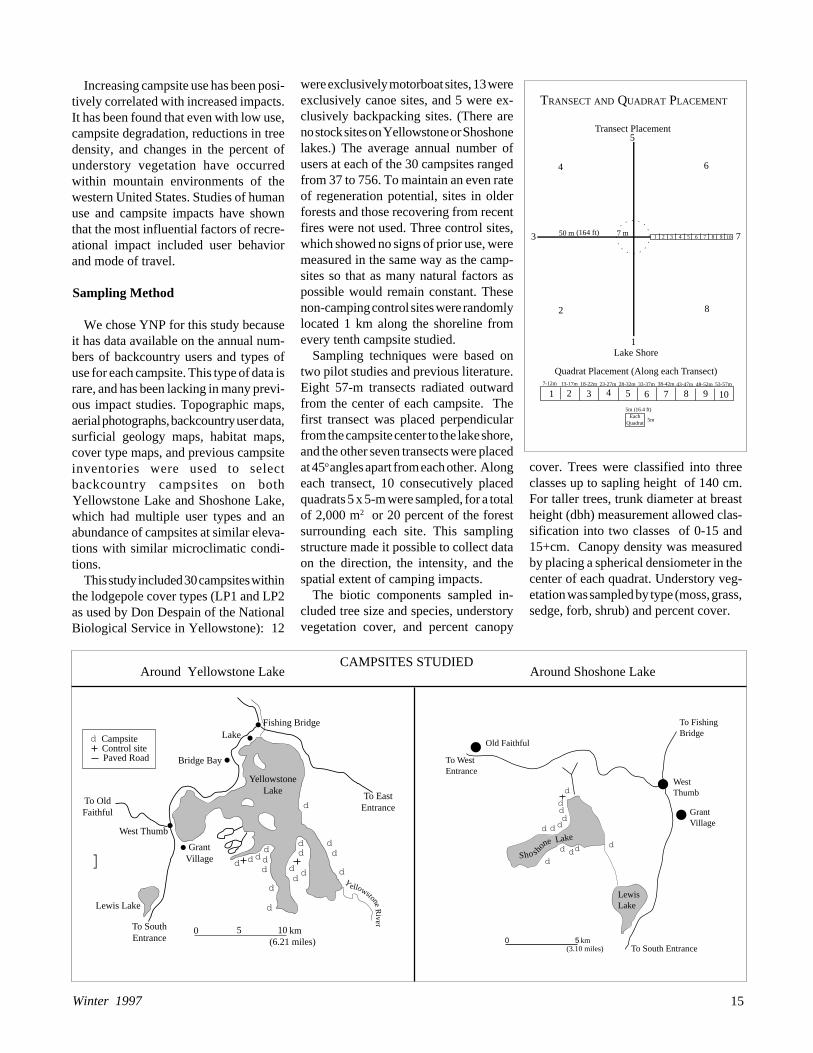
Sampling techniques were based ontwo pilot studies and previous literature.Eight 57-m transects radiated outwardfrom the center of each campsite. Thefirst transect was placed perpendicularfrom the campsite center to the lake shore,and the other seven transects were placedat 45o angles apart from each other. Alongeach transect, 10 consecutively placedquadrats 5 x 5-m were sampled, for a totalof 2,000 m2 or 20 percent of the forestsurrounding each site. This samplingstructure made it possible to collect dataon the direction, the intensity, and thespatial extent of camping impacts.
The biotic components sampled in-cluded tree size and species, understoryvegetation cover, and percent canopy
cover. Trees were classified into threeclasses up to sapling height of 140 cm.For taller trees, trunk diameter at breastheight (dbh) measurement allowed clas-sification into two classes of 0-15 and15+cm. Canopy density was measuredby placing a spherical densiometer in thecenter of each quadrat. Understory veg-etation was sampled by type (moss, grass,sedge, forb, shrub) and percent cover.
d d ddd
d
d
d
dd d
dd d
d
d
d]
5 100 km
YellowstoneLake
Yellowstone
River
West Thumb
To OldFaithful
GrantVillage
Lewis Lake
To SouthEntrance
Fishing BridgeLake
Bridge Bay
To EastEntrance
d CampsiteControl sitePaved Road
(6.21 miles) 0 5
d
dddddd
d
d ddd
Old Faithful
To WestEntrance
WestThumb
GrantVillage
To FishingBridge
To South Entrance
Lewis Lake
Sho sho
ne Lake
km(3.10 miles)
CAMPSITES STUDIEDAround Yellowstone Lake Around Shoshone Lake
1 2 3 4 5 6 7 8 9 10 7
8
1Lake Shore
2
50 m (164 ft) 7 m3
4
5Transect Placement
6
1 2 3 4 5 6 7 8 9 10
Quadrat Placement (Along each Transect)7-12m 13-17m 18-22m 23-27m 28-32m 33-37m 38-42m 43-47m 48-52m 53-57m
5m
5m (16.4 ft)Each
Quadrat
TRANSECT AND QUADRAT PLACEMENT
Yellowstone Science16
Effects on Sapling Occurrence
The campsites had an average of 5.22conifer saplings per quadrat; the controlsites had an average of 11.96 saplings perquadrat. This difference in density wassignificant (P = 0.00002), and an impor-tant impact that we investigated further.The intercept point where the averagenumber of saplings per quadrat at thecampsites equalled the average density atthe control sites was graphed. This pro-vides a visual assessment of the change insapling density showing the spatial ex-tent and possible impact of backcountryuse at the campsites.
Density of saplings. The spatial im-pact and density of saplings around thecampsites are best understood by lookingat each transect separately. All transectswithin the campsites were significantlydifferent from those in the control sites.Within the campsites, the average den-sity increased from 1.09 saplings in quad-rat 1 to 8.35 saplings in quadrat 10 (far-thest from the campsite center), indicat-ing a strong positive correlation (r = 0.97)between distance from the center of thesite and the density of saplings. The aver-age number of saplings per quadrat in-creased outward along all campsitetransects except in the transect from thecenter of the site to the lakeshore.
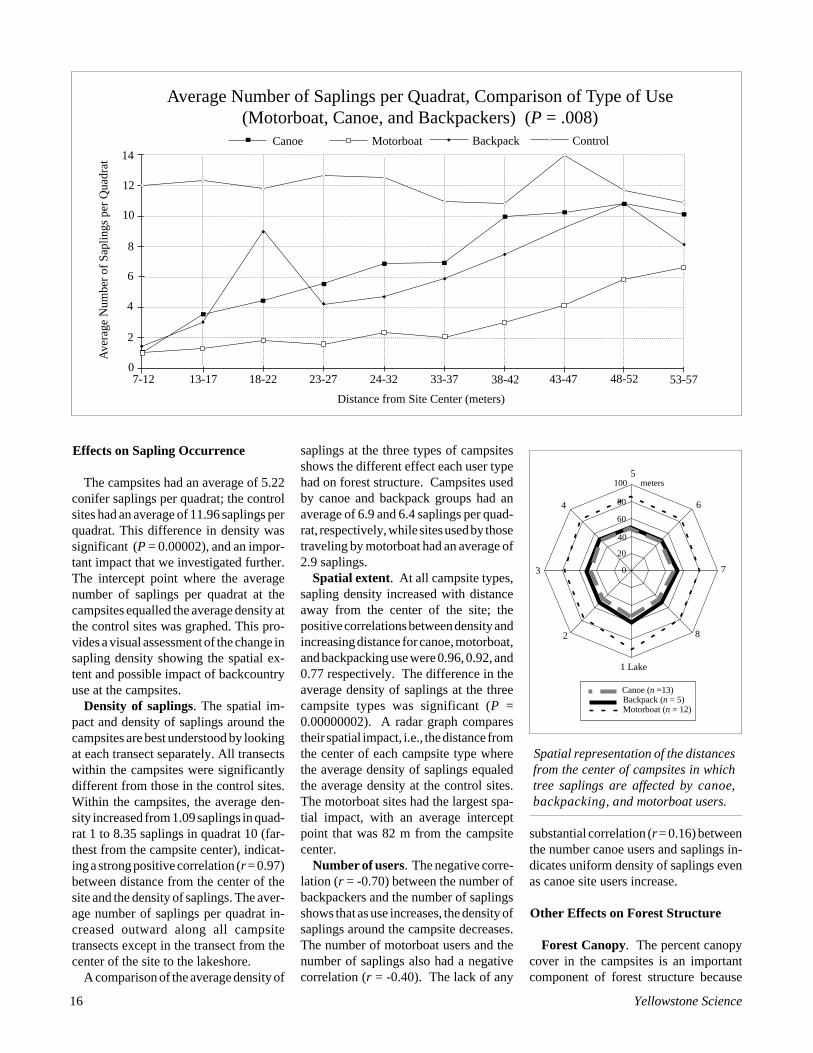
A comparison of the average density of
saplings at the three types of campsitesshows the different effect each user typehad on forest structure. Campsites usedby canoe and backpack groups had anaverage of 6.9 and 6.4 saplings per quad-rat, respectively, while sites used by thosetraveling by motorboat had an average of2.9 saplings.
Spatial extent. At all campsite types,sapling density increased with distanceaway from the center of the site; thepositive correlations between density andincreasing distance for canoe, motorboat,and backpacking use were 0.96, 0.92, and0.77 respectively. The difference in theaverage density of saplings at the threecampsite types was significant (P =0.00000002). A radar graph comparestheir spatial impact, i.e., the distance fromthe center of each campsite type wherethe average density of saplings equaledthe average density at the control sites.The motorboat sites had the largest spa-tial impact, with an average interceptpoint that was 82 m from the campsitecenter.
Number of users. The negative corre-lation (r = -0.70) between the number ofbackpackers and the number of saplingsshows that as use increases, the density ofsaplings around the campsite decreases.The number of motorboat users and thenumber of saplings also had a negativecorrelation (r = -0.40). The lack of any
substantial correlation (r = 0.16) betweenthe number canoe users and saplings in-dicates uniform density of saplings evenas canoe site users increase.
Other Effects on Forest Structure
Forest Canopy. The percent canopycover in the campsites is an importantcomponent of forest structure because
Spatial representation of the distancesfrom the center of campsites in whichtree saplings are affected by canoe,backpacking, and motorboat users.
53-5748-5243-4738-4233-3724-3223-2718-2213-17 7-12 0
2
4
6
8
10
12
14Canoe Motorboat Backpack Control
Ave
rage
Num
ber
of S
aplin
gs p
er Q
uadr
atAverage Number of Saplings per Quadrat, Comparison of Type of Use
(Motorboat, Canoe, and Backpackers) (P = .008)
Distance from Site Center (meters)
5
6
7
8
1 Lake
2
3
4
100 meters
80
60
40
20
0
Canoe (n =13)Backpack (n = 5)Motorboat (n = 12)

Winter 1997 17
canopy influences microclimates. A de-crease in canopy cover may result inincreased amounts of precipitation reach-ing the forest floor, stronger local forestwinds, and increased radiation, whichcan affect tree survival. According to myresearch, this aspect of forest structurehas also been affected by campsite use.The average percent forest canopy coverdiffered significantly (P = 0.00003) be-tween the campsites and the control sites.A positive correlation (r = 0.31) betweendistance and canopy cover at all campsitetypes showed that percent canopy coverincreased as distance from the campsitecenters increased.
Bare Area. The percent bare area alsodiffered significantly (P = 0.0005) be-tween the campsites and the control sites.There was a negat ive correlation (r = -0.95) between the distance from thecenter of a campsite and the percent barearea: as one might expect, the percentbare area decreased as distance from thecampsite increased.
Understory Vegetation. For this studywe measured moss, grasses, sedges, forbs,and shrubs. The average percent under-story vegetation differed significantly(P = 0.01) between the campsites and thecontrol sites for all understory compo-nents except forbs.
Total Potential Effect
As expected, the forest structure sur-rounding the campsites at YellowstoneLake and Shoshone Lake has been af-fected by campsite use. As measured by
the percent of bare area and the occur-rence of trees, the changes are focusednear the center of the campsites but alsoextend into the periphery forest. This issimilar to the effects seen in other popularbackcountry areas (Cole 1983, 1986).
In measuring the spatial extent ofchange, we found that the average num-ber of saplings per quadrat at the camp-sites did not equal that at the control sitesuntil a distance of 45 m from the center ofthe campsite was reached. This meansthat average affected area was 6,362 m2
per campsite, or a total affected area of190,860 m2 for the 30 backcountry camp-sites studied. Extrapolating to all 302backcountry campsites that existed inYNP in 1994, that could equal a potentialimpact of 1,921,324 m2 .
My finding that the density of saplingsincreases as distance from the campsitecenter increases implies thatcampsite-related activities have an im-pact on the regeneration and survival offorest saplings. A better understanding ofthe attributes of this important relation-ship is needed in order for managers todevelop management strategies and con-servation practices to preserve the for-ested ecosystem. Campsite use could re-sult in the near elimination of forest re-generation, which in turn could lead toreductions in tree density and the un-wanted creation or expansion ofnonforested areas.
Implications for WildernessManagement
There has been rapid growth during thelast century in recreational uses of wildlands. These are the lands that have beenprotected by agencies such as the NPS,and laws such as the Wilderness Act of1964, which states that we are to managedesignated wilderness areas so that “natu-ral conditions are preserved and the im-print of man’s work remains substan-tially unnoticeable.” But Leopold ap-pears to have been correct when he statedthat people have a substantial impact onthe wilderness areas they visit. The use ofbackcountry areas for camping is notentirely benign and has a spatial attributethat should be better understood if a man-agement goal for YNP is to balance sus-tainable recreational use while maintain-ing environmental integrity. It is impor-tant that we understand that a continualincrease in recreational use might lead togreater effects on the forests. Educatingrecreational users in backcountry ethicsto reduce trampling, group size, and so-cial trails, and encouraging use of canoesor backpacking over motorboat use mayreduce the impact to conifer saplings sur-rounding backcountry campsites in YNP.
James Y. Taylor is the science specialistat Carden Memorial School, Salt LakeCity, Utah. He also conducts extendedfield courses to promote greater under-standing of the natural world. He re-ceived a B.S. in biogeography from theUniversity of Utah, and a M.S. in EarthSciences from Montana State University.
REFERENCES
Cole, D.N. 1982. Wilderness campsite im-pacts: Effect of amount of use. USDA ForestService Research Paper INT-284. 34pp.
Cole, D.N. 1983. Campsite conditions in theBob Marshall Wilderness, Montana. USDAForest Service Research Paper INT-312. 18pp.
Cole, D.N. 1986. Ecological changes oncampsites in the Eagle Cap Wilderness, 1974to 1984. USDA Forest Service Research PaperINT-368. 15pp.
Cole, D.N. 1989. Wilderness campsite moni-toring methods: A sourcebook. USDAForest Service Research Paper INT-259. 57pp.
Despain, D.G. 1990. Yellowstone vegetation:Consequences of environment andhistory in a natural setting. Roberts RinehartPublishers: Boulder. 239pp.
A young couple canoeing from their campsite on Peale Island, Yellowstone Lake.
Photo Renee Evanoff
Yellowstone Science18
The Grizzly Bears of Yellowstone: TheirEcology in the Yellowstone Ecosystem,1959-1992 by John J. Craighead,, Jay S.Sumner, and John A. Mitchell. IslandPress, Washington, D.C., 1995, 535pages. $100.
One evening in 1992 during a visit toNagarahole National Park in southernIndia, I joined other park visitors after aday looking for tiger, leopard, gaur, el-ephant, chital, sambar, and sloth bear towatch a wildlife movie. Imagine my sur-prise, halfway around the world from myhome in Wyoming, when we were treatedto a 25-year-old flick featuring John andFrank Craighead and families in Yellow-stone. The film illustrated pioneeringapplications of radiotelemetry for thestudy of grizzly bear movements andbehavior, but mostly characterized theexciting lives of the Craigheads.
The Craighead brothers have beenamong the world’s most celebrated wild-life biologists during the second half ofthe 20th century, and for good reason.Their studies have pioneered a number ofwildlife techniques that have revealedimportant facts of behavior, movements,and ecology of many raptors and severalspecies of large mammals, especially elkand grizzly bears. The broad scope oftheir contributions to natural history isexemplified by their authorship of doz-ens of scientific papers on grizzly bearsand elk as well as A Field Guide to RockyMountain Wildflowers in the PetersonGuide Series. Their lives dedicated tonature study have been emulated by ageneration of aspiring field biologists.
The Grizzly Bears of Yellowstone is thecapstone contribution by John Craighead,who turned 80 this year. The volume is afitting tribute. Island Press has done aspectacular job producing the book with
glossy coated paper and an abundance ofcolor plates. Throughout, the book is wellwritten and produced with few typo-graphical errors. At $100 I expect fewpeople to buy the book, but given thewealth of data and the quality of produc-tion, the price seems reasonable.
In 1979, John’s brother, FrankCraighead, wrote his own book summa-
rizing their joint Yellowstone field stud-ies of 1959-1970 entitled The Track of theGrizzly (Craighead 1979). In contrast,The Grizzly Bears of Yellowstone is morea research monograph with more techni-cal detail than in Frank’s story. The Griz-zly Bears of Yellowstone summarizes 35years of grizzly bear studies in the GreaterYellowstone Ecosystem (GYE) with prin-
Review Essay
The Grizzly Bears of YellowstoneTheir Ecology in the Yellowstone Ecosystem, 1959-1992
by Mark S. Boyce
Winter 1997 19
cipal focus on the 1959-1970 period. Thebook is divided into two major sections:“The study (1959-1970)” totaling 345pages of text that details investigationsby the Craigheads, and “Population com-parisons (1974-1992): the era of decreedresearch” which spans 133 pages review-ing the work of the Interagency GrizzlyBear Study Team (IGBST), principallyRichard Knight and Bonnie Blanchard,subsequent to the Craighead investiga-tions.
The purpose of the book was to de-scribe the structure of the population ofgrizzly bears in the GYE (p. 91). Al-though the scope of the book is vast,including discussions of genetics, popu-lation biology, behavior, physiology,parasitology, and management, most ofthe book summarizes population studiesand behavior observations. Given thenature of the beast, this research is neces-sarily descriptive natural history ratherthan experimental science. The behav-ioral sections of the book include fewfunctional analyses of mechanisms un-derlying the behaviors. Instead the au-thors report detailed descriptions of be-havior of bears in aggregations, such asthose associated with major food sources,and include considerable detail aboutdominance hierarchies.
When the Craigheads began their fieldstudies in Yellowstone in 1959, the Na-tional Park Service was still allowingbears to feed at several garbage dumpsdistributed throughout the park. For avariety of reasons, Park Service officialsdecided that such feeding was inappro-priate in a national park and decided toclose the dumps and truck the garbageoutside the park. The Craighead brothersargued vigorously that to close the dumpsmeant death to enormous numbers ofbears that had grown accustomed to feed-ing at the dumps. They were right! Mor-tality of grizzly bears was very high in theyears following the closure of the dumpsduring the period of adjustment to naturalfood sources. All evidence suggested thatthe bear population continued to declineduring the period 1970-1983 at whichtime the Interagency Grizzly Bear Com-mittee (IGBC) promulgated strict rulesfor management of public lands designedto reduce mortality on grizzly bears.
The disagreement between the
Craigheads and the National Park Ser-vice is a classic story in biopolitics. Theconflict became so polarized that theNational Academy of Sciences formed acommittee to review appropriate coursesfor management of Yellowstone’s griz-zlies. In this book we again read theCraighead view that seems to havechanged little in 25 years. Anyone inter-ested in an alternative account of thehistory should consult Schullery’s (1992)book on The Bears of Yellowstone. I willnot reiterate the details here, preferring tofocus on biological issues.
Craighead et al. present detailed demo-graphic data for the grizzly bear popula-tion during 1959-1970 and include valu-able discussion of the sampling problemsassociated with these data. In particular,I found the treatment of reproduction tobe useful for reducing biases involvedwith estimates of reproductive rates. Eventhough much of the data from theCraighead studies is available elsewhere,this book provides insight into the inter-pretation of these data that is not previ-ously published.
Chapter 9 of the book is devoted to acontroversial discussion of density de-pendence. Several authors have criticizedearlier work of the Craigheads that ig-nored the role of density-dependent sur-vival and reproduction as stabilizingforces in population dynamics. These criti-cisms are dealt with rather firmly in Chap-ter 9, but an alternative analysis explain-ing where density dependence occurs inthe population is not provided. No men-tion is made of the studies by Mark Shaffer(1983) showing that reproductive ratesare density dependent in the Craighead’sdata. In fact, they claim that no evidenceexists for reproductive compensation. Ihave recently reanalyzed much of theIGBST data to discover thatdensity-dependent survival prevails dur-ing the period 1975-1995. Perhapsdensity-dependent survival operates dueto density-dependent food limitation un-der current management whereas loss ofcubs to males was more of a factor duringthe Craighead era when bears were con-centrated for feeding at the dumps. Alter-natively, perhaps mortality of bears dur-ing the Craighead era was lower becausemovements out of the park were lessnecessary (p. 301).
A major focus of this monograph is toexamine the phenomenon of “ecocenters,”i.e., garbage dumps or other concentra-tions of food, and their consequence tothe ecology and behavior of grizzly bears.Despite the conclusions in the NationalAcademy of Sciences review of theCraighead analysis that there existed somebackcountry bears that did not use thedumps, Craighead et al. insist that duringthe 1959-1970 period all bears were feed-ing at the dumps, at least part of the time.In support of this view they present radio-telemetry locations for a number of bearsshowing how their home ranges typicallyincluded the dumps. The authors con-clude that ecocenters result in subpopula-tions of bears “whose members movedroutinely between the ecocentered aggre-gation . . . and the backcountry.” Clearlythe dumps substantially altered the socialand demographic environment for thebears of the GYE. Remarkably, Craigheadet al. believe that we should have kept thedumps.
Of course some natural bear popula-tions are focused on ecocenters, e.g.,brown bears feeding on salmon in Alaska.But this was not largely the system of theRocky Mountains and, to my mind, theCraighead argument that we should bemaintaining ecocenters to sustain largepopulations of grizzly bears certainly fliesin the face of ecological-process man-agement for national parks, i.e., trying tomaintain natural ecological processes withminimal human intervention. Supplemen-tal provisioning can sustain a larger griz-zly population in an area, but at the heavycost of completely altering the social anddemographic environment of the bears,not to mention the consequences to otherecosystem components that are influencedby a large bear population. Conservationshould involve considerations beyond thenecessary preservation of populations andgene pools. Somehow there must be valuein preserving places like Yellowstonewith minimal human influence, and al-lowing natural ecological processes toprevail.
The National Park Service took a bigrisk in 1970 when they decided to quitfeeding bears in Yellowstone. The highmortality associated with the dump clo-sures subjected the grizzly bear popula-tion to great risk of extinction. The
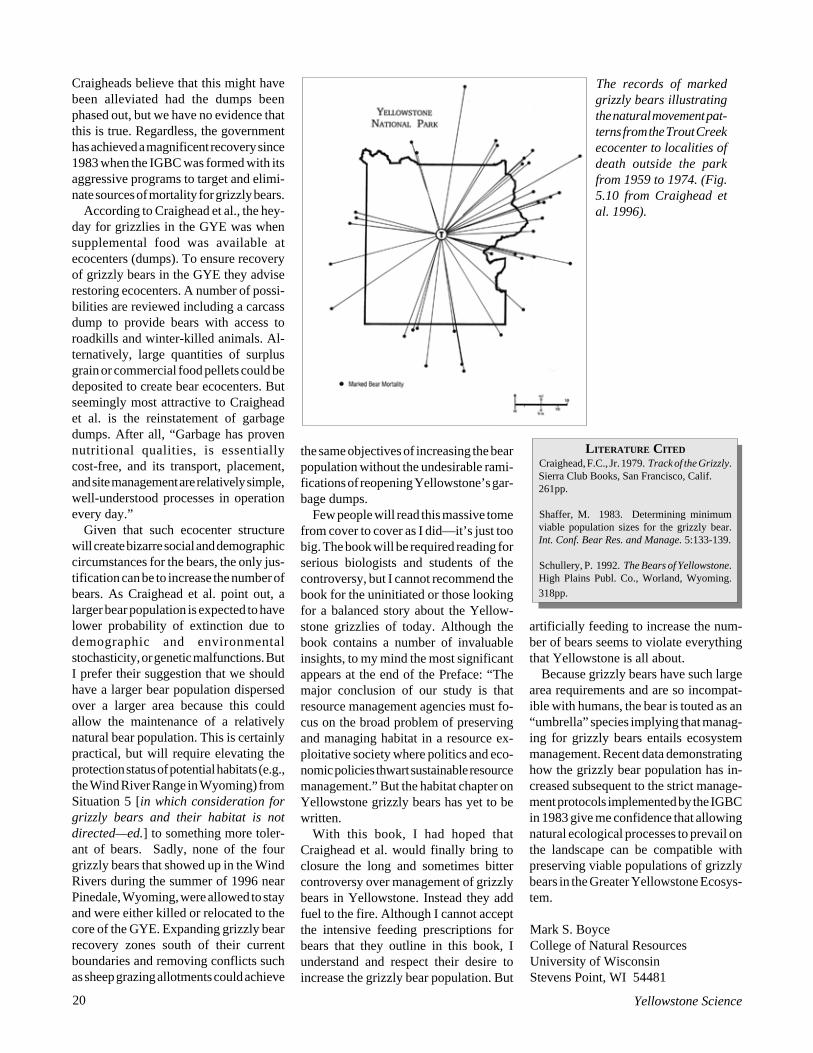
Yellowstone Science20
Craigheads believe that this might havebeen alleviated had the dumps beenphased out, but we have no evidence thatthis is true. Regardless, the governmenthas achieved a magnificent recovery since1983 when the IGBC was formed with itsaggressive programs to target and elimi-nate sources of mortality for grizzly bears.
According to Craighead et al., the hey-day for grizzlies in the GYE was whensupplemental food was available atecocenters (dumps). To ensure recoveryof grizzly bears in the GYE they adviserestoring ecocenters. A number of possi-bilities are reviewed including a carcassdump to provide bears with access toroadkills and winter-killed animals. Al-ternatively, large quantities of surplusgrain or commercial food pellets could bedeposited to create bear ecocenters. Butseemingly most attractive to Craigheadet al. is the reinstatement of garbagedumps. After all, “Garbage has provennutritional qualities, is essentiallycost-free, and its transport, placement,and site management are relatively simple,well-understood processes in operationevery day.”
Given that such ecocenter structurewill create bizarre social and demographiccircumstances for the bears, the only jus-tification can be to increase the number ofbears. As Craighead et al. point out, alarger bear population is expected to havelower probability of extinction due todemographic and environmentalstochasticity, or genetic malfunctions. ButI prefer their suggestion that we shouldhave a larger bear population dispersedover a larger area because this couldallow the maintenance of a relativelynatural bear population. This is certainlypractical, but will require elevating theprotection status of potential habitats (e.g.,the Wind River Range in Wyoming) fromSituation 5 [in which consideration forgrizzly bears and their habitat is notdirected—ed.] to something more toler-ant of bears. Sadly, none of the fourgrizzly bears that showed up in the WindRivers during the summer of 1996 nearPinedale, Wyoming, were allowed to stayand were either killed or relocated to thecore of the GYE. Expanding grizzly bearrecovery zones south of their currentboundaries and removing conflicts suchas sheep grazing allotments could achieve
the same objectives of increasing the bearpopulation without the undesirable rami-fications of reopening Yellowstone’s gar-bage dumps.
Few people will read this massive tomefrom cover to cover as I did—it’s just toobig. The book will be required reading forserious biologists and students of thecontroversy, but I cannot recommend thebook for the uninitiated or those lookingfor a balanced story about the Yellow-stone grizzlies of today. Although thebook contains a number of invaluableinsights, to my mind the most significantappears at the end of the Preface: “Themajor conclusion of our study is thatresource management agencies must fo-cus on the broad problem of preservingand managing habitat in a resource ex-ploitative society where politics and eco-nomic policies thwart sustainable resourcemanagement.” But the habitat chapter onYellowstone grizzly bears has yet to bewritten.
With this book, I had hoped thatCraighead et al. would finally bring toclosure the long and sometimes bittercontroversy over management of grizzlybears in Yellowstone. Instead they addfuel to the fire. Although I cannot acceptthe intensive feeding prescriptions forbears that they outline in this book, Iunderstand and respect their desire toincrease the grizzly bear population. But
artificially feeding to increase the num-ber of bears seems to violate everythingthat Yellowstone is all about.
Because grizzly bears have such largearea requirements and are so incompat-ible with humans, the bear is touted as an“umbrella” species implying that manag-ing for grizzly bears entails ecosystemmanagement. Recent data demonstratinghow the grizzly bear population has in-creased subsequent to the strict manage-ment protocols implemented by the IGBCin 1983 give me confidence that allowingnatural ecological processes to prevail onthe landscape can be compatible withpreserving viable populations of grizzlybears in the Greater Yellowstone Ecosys-tem.
Mark S. BoyceCollege of Natural ResourcesUniversity of WisconsinStevens Point, WI 54481
L ITERATURE CITED
Craighead, F.C., Jr. 1979. Track of the Grizzly.Sierra Club Books, San Francisco, Calif.261pp.
Shaffer, M. 1983. Determining minimumviable population sizes for the grizzly bear.Int. Conf. Bear Res. and Manage. 5:133-139.
Schullery, P. 1992. The Bears of Yellowstone.High Plains Publ. Co., Worland, Wyoming.
318pp.
The records of markedgrizzly bears illustratingthe natural movement pat-terns from the Trout Creekecocenter to localities ofdeath outside the parkfrom 1959 to 1974. (Fig.5.10 from Craighead etal. 1996).

Winter 1997 21
¬esNEWSResearch Proposed on NewBrucellosis Vaccine
A new research project proposed in thepark will provide an Evaluation of Bru-cella Abortus Vaccine Strain RB51 inBison Calves. As part of a commitmenttoward identifying new brucellosis vac-cines for possible use in wildlife, theNational Park Service is proposing towork cooperatively with the WyomingGame and Fish Department (WGFD) toevaluate the effects of a new vaccine onbison calves.
The bacteria Brucella abortus, whichcauses bovine brucellosis, was likely in-troduced to North American wildlifethrough importation of infected livestockfrom Europe. Brucellosis in domesticcattle has been drastically reduced througha nationwide program to eradicate it. Al-though vaccines do not insure 100 per-cent immunity in cattle, they substan-tially reduce the frequency of abortionsin adult animals. Brucella abortus wasfirst detected in Yellowstone in 1917, andconcern exists regarding the potentialtransmission of the bacteria from wildbison to domestic livestock outside thepark. Vaccination of bison in Yellowstonehas been advocated periodically, but clini-cal evaluation of vaccination has not beenconducted on free-ranging bison.
The effectiveness of a vaccination pro-gram is strongly related to the efficacy ofthe vaccine, which may vary by age andsex of the animal vaccinated. Strain 19vaccine has been used on domestic cattlefor several decades; the efficacy of thisstrain varies from 65 to 75 percent inindividual animals. It also often confoundsserological testing because antibody re-sponse to the vaccine is difficult to differ-entiate from field strain infections. Dos-ages of strain 19 suitable for cattle im-parted little or no immunity in femalebison calves and caused abortions in preg-nant adult bison cows.
The study will last two years, and focuson testing strain RB51, a newly devel-oped vaccine approved for use on domes-tic cattle calves. In cattle, RB51 impartsabout the same level of immunity as strain19 but does not confound the serologicaltests. The research proposal calls for cap-
turing 36 bison calves (18 each year)during trapping operations conducted bythe Montana Department of Livestock asbison migrate from the park. The calveswill be card-tested for the presence ofbrucella antibodies; calves testing nega-tive would be transported to the Wyo-ming Game and Fish Department’sSybille Wildlife Research Unit nearWheatland, Wyoming. The proposed re-search will evaluate the physiologic andpathologic effects of administering RB51to bison calves and will determine if livebacteria resulting from the vaccinationsare shed into the environment. The pro-posal indicates that since opportunities tosample wild bison are infrequent, eachanimal will also be tested for the exist-ence of a genetic marker indicative ofresistance to brucellosis.
Moran Paintings in National Display
The Thomas Moran paintings thathelped persuade Congress to create theworld’s first national park will be part ofthe first-ever retrospective exhibition ofthe artist’s work to be seen in 1997 at theNational Gallery of Art. Twenty-onewatercolors by Moran and two of hissketchbooks featuring pencil and water-color sketches of park features are amongthe items from the park’s museum collec-tion approved for loan to the NationalGallery. Most of the watercolors and oneof the sketchbooks were produced byMoran during the 1871 Hayden Survey,which he accompanied, and are consid-ered to be among the finest and mostimportant works of art held by the Na-tional Park Service. Four volumes of rarephotos by William Henry Jackson, pho-tographer of the Hayden Survey, are alsoincluded in the loan and will be incorpo-rated into the part of the show focusing onYellowstone.
In recognition of the importance, value,and fragility of the Moran paintings andJackson photos—and as a way of thank-ing the park for making the works avail-able for the show—the National Gallerywill re-mat and re-frame each watercolorusing the latest museum-quality conser-vation materials, then hermetically sealeach work within its new frame to ex-clude gases from park thermal features
and airborne pollutants. Photographerswill photograph each painting, each pageof the sketchbooks, and each of the nearly200 photographs contained in the fourJackson albums. The park will receivehigh-quality negatives and prints; digi-tized images; and same-size, exhibitablereproductions of the Moran paintings thatcan be displayed in the Albright VisitorCenter while the originals are on loan.Digitized images will be used to improveresearcher access to these materials.
Wolf Project Proceeds Well in FirstTwo Years
The 14 wolves released in Yellow-stone in 1995 bore two litters totallingnine pups. In 1996, 17 more wolves werereleased, and had four litters totalling 14pups. Eleven wolves have died—threewere illegally shot, three killed by ve-hicle collisions, two were killed by otherwolves, one was removed due to depre-dation on livestock, one was burned fa-tally in a hot spring, and one pup died ofunknown causes. Another pup was acci-dentally injured and subsequently sent tolive in a captive facility. Ten pups werebrought to Yellowstone in the summer of1996 from northern Montana and haveyet to be released. The goal to restorewolves to Yellowstone and begin delist-ing them by approximately 2002 appearsto be within reach, perhaps even ahead ofschedule and under budget. ❆
News & Notes

Yell
ow
sto
ne
Sci
en
ceY
ello
wst
one
Cen
ter
for
Res
ourc
esP
. O. B
ox 1
68Y
ello
wst
one
Nat
iona
l Par
k, W
Y 8
2190
-016
8
BU
LK R
AT
EU
.S. P
OS
TA
GE
PA
IDP
erm
it N
o.
G-8
3
Suspended Sediment in the Rivers ofNorthern Yellowstone4
A Grand Experiment10
Leave Only Footprints?16
The Grizzly Bears of Yellowstone20
News & Notes23