yemen arab republic agrcultural strategy paper · for omclfcl use only yemen arab republic...
TRANSCRIPT

*.otN.S574-TAR
Yemen Arab RepublicAgrcultural Strategy Paper
May 1,16
RojeaDepaEurpe meddi Eas ard Nor c a Rein Of fice
FOR OFFICIAL USE ONLY
N; ~ Docomuun of dw II %4 b w
Twis docxment has a restrcted dlsubtrIion and may be used by recipietsonly in the p-o race of the-. o.iadud.. ts co. e may nototherwibedsdaosed witwut VW~d eank aatdwrzatitL-
Pub
lic D
iscl
osur
e A
utho
rized
Pub
lic D
iscl
osur
e A
utho
rized
Pub
lic D
iscl
osur
e A
utho
rized
Pub
lic D
iscl
osur
e A
utho
rized

CURRENCY EQUIVALEN7TS
1 Yemini Rial (YRl) = US$ 0.075i US$ = YRls 5.70
(December 1984)
WEIGHTS AND MEASURES
1 meter (m) = 1.09 yarsd = 3.28 feet (ft.)1 kilometer (km) = 1,000 meters = 0.6214 miles (mi.)1 hectare (ha) = 10,000 square meters = 2.47 acres (ac.)1 square kilometer (km2) = 100 ha = 0.386 square miles (sq. mi.)1 kilogram (kg) = 2,205 pou-ads (lbs.)1 metric ton (t) = 1,000 kilograms = 0.98 long tons (1g. ton)1 liter (1) = 0,264 gallons (gal.)
ABBREVIATIONS
ARA - Agricultural Research and Development AuthroityCACB - Cooperative and Agricultural Credit BankCBY - Central Bank of YemenEDWA - Economic Commission for West AsiaFYP - Five Year PlanGDP - Gross Domestic ProductGNP - Gross National ProductIDA - International Development AssociationIFAD - International Fund for Agricultural DevelopmentMlAF - Ministry of Agriculture and FisheriesNIPA - National Institute for Public AdministratiornPPAR - Project Performance Audit ReportSURDP - Southern Uplands Regional Development ProjectTA - Technical AssistanceTDA - Tihama Development AuthorityUK - United KingdomUNCD - United Nations Development ProgramUSAID - United States Agency for International DevelopmentYAR - Yemen Arab Republic

FOR OMCLFCL USE ONLY
YEMEN ARAB REPUBLIC
AGRICULTURAL STRATEGY PAPER
Table of Content
Page No.
SUMMARY AND CONCLUSIONS (English and Arabic)
I_ BACKGROUND . . . . . . . . . . . . . . . . . . i-vii
A. Introduction . . . . . . . . . . . . . . 1B. Major Development Issues . . . . . . . . 1C. Agriculture in the Economy . . . . . . . 2
ML AGRICULTURAL SECTOR
A. Agricultural Performance . . . . . . . . . 4B. Resources and Constraints . . . . . . . . 7C. Present Sector Strategy . . . . . . . . . 10D. Public Investment Under SFYP . . . . . . . 11E. Sector Policies. . . . . . . . . . . . . . 12F. Food Security. . . . . . . . . . . . . . . 13
DL ISSMES, CONSrRAII AND RECOMMENDATIONS
A. The Economics of Crop Production and PriceIncentives for Different Crops. . . . . . 14
B. Expansion of Wheat and OtherCereal Production . . . . . . . . . . 19
C. Role of Qat . . . . . . . . . . . . . . . 20D. Food Security and Improved Distribution. . 22E. Input Supply . . . . . . . . . . . . . . . 23F. Credit . . . . . . . . . . . . . . . . . . 24C. Research . . . . . , . . . . . . . . . . 25R. Extension . . . . . . . . . . .I I I I I 261. Agricultural Education, Training
and Technical Assistance . . . . . . . 28
IV. PROPOSED STRATEGY
A. Strategy . . . . . . . . . . . . . . . . . 30B. Production. . . . . . . . . . . . 30C. Policies. . . . . . . . . . . . . . . . 32D. Implementation . . . . . . . . . . . . . . 34E. Future Investment Program . . . . . . . . 34
Following a mission to TAR in November/December 1984, this report was writtenby r.F. van der Goot (Bank) and P. Harrison (consultant). Contributions fromMessrs. Eisa, Lewis, Rana, Woldu (IDA) and Basu (consultant) are also included.
This document ha a restrited distbution and may be usd by rcpients only in the pefomancof their oiicial dutiesL Its contents may o otherwise be dbckoed without World Bank authorizatioL

Table of Contents (continued)
Page No.
Annex 1
Tables
1 Total Cropped Area .... . . . ..... . . . . . 372 Production from Main Crops . . . . . . . . . . . . . 383 Yields of Main Crops . . . . . . . . . . . . . . . . 394 Estimates of Land Resources. . . . . . . . . . . . . 405 Sector GOP, Imports and Remittances. . . . . . . . . 416 Sector GDP, Domestic Prices and Boarder Prices . . . 427 Estimated Crop Areas by Source of Water. . . . . . . 438 Per Capita Income by Sector. . . . . . . . . . . . . 449 Estimated Labor Requirements . . . . . . . . . . . . 4510 Agricultural Labor Supply. . . . . . . . . . . . . . 4611 Qat Consumption and Production . . . . . . . . . . . 4712 Agricultural Imports . . . . . . . . . . . . . . . . 4813 Detailed Agricultural Imports. . . . . . . . . . . . 4914 Fertilizer Imports . . . . . . . . . . . . . . . . . 5015 Analysis of Cereal Production. . . . . . . . . . . . 5116 Estimated Pumping Costs . . . . . . . . . . . . . . 5217 - Growth Potential for Fruits and Vegetables . . . . . 5318 Financial Crop Production Data and Analysis. . . . . 5419 Financial Crop Production Data and Analysis. .5520 Financial/Economic Returns to Citrus Growing . . . . 5621 Economic Crop Production Data and Analysis . .. 5722 Economic Crop Production Data and Analysis . .. 58
Appendix A. Economic Prices of Agricultural Crops in YAR . . . . 59
Appendix B. Completed IDA-Assisted Projects in YAR . . . . . . . 65
Text Tables
1.1 Rural and Urban Income Estimates (1982) . . . . . . . 32.1 Food Imports and Agricultural Value Added . . . . . . 52.2 Estimate of Agricultural Value Added (1982)
At Border Prices . . . . . . . . . . . . . . . . . . 62.3 Breakdown of Agricultural Value Added
By Production Area . . . . . . . . . . . . . . . . . 62.4 Distribution of Agricultural Land . . . . . . . . . . 82.5 YAR National Agricultural Land Tenure . . . . . . . . 82.6 Demand for Agricultural Labor . . .. . . . . . . . 92.7 Agricultural Sector Investment Proposal
Under the Second Five-Year Plan (1982-1986) . . . . 113.1 Prices for Agricu tural Products . . . . . . . . . . 143.2 Suimary of Financial Returns for Selected Crops . . . 163.3 Sunary of Economic Returns1for Selected Crops . . . 173.4 Impact of Sharecropping on Financial Returns . . . . 183.5 Economic Retuvns Per Man-Day for Wheat
And Sorghum . . . . . . . . . . . . . . . . . . . . 203.6 Average Farm Family Income Per Capita . . . . . . . . 214.1 Agricultural Sector Growth Potential 1985-1995. . . . 33

*9i .- ~*5 ._ jjI .ujt ..V
j-oLI J1 _L6..J I jI,I Lh- s
L5L....*~II ~ L..auiI 1i OU* C~ 3 Lg.Zj qej_LZI£.J jq...~Jt '&-Si I ;Lw JI s .a. =.#.t ..... JI
;.61 I ' -- R5, I,_~ t- L;& 11 L" -pllIL .,I JS ?iivz Li 'J2 I
- ii v J:s La J.,. &ZIJ ;jJI Y/l ai- *_ JS 1_s % 1 1j I :LijI j I 11 e
L5..J &J,. Lej Ji.I .i y JI 6 >. J.S - iZ.Ilj LAA L.. yi
II_l {r>f l_,_;. L UJ- '1I) J&l . L,J5 'I a% :,.a
Y,k/ lil ,4 1 4_ , ;- .13 LX c1 3)YI si,-, ' 43 ' - 1
_ - ;L . ei~.J & I r s 5; w . _,& jIjJI 11 0 I II j *:I
-L ,JI -J L;e (.jLI%l I &L C ; j
fA/ 15Y ; ZE- {>* S Fl 1 1 JU1 s *JX~~~~~~~~~~~~~~j H v1 *+
' (<9*=-11 3 tH t-6 *)O - j- * -L--:

'~r~-M-i 1r'~ C-. C.- - irx- t 'r'ir - i rnr I - -:
ir-l =H ir-r w-n.- i^ cV sr - rir,r.-ic- -l ism. z-w *
>'5t- II4 Ic- r~ Ir!" ir' 'T--*V -cf-rq fl -1 (:: tr , ' Cr- 1 r i--- v, -CZ
; .-... _--nC ir- -i2 trt Ir f er" Ir-v fl- l"<iy,-' 'fl f
4Y* S w!_ 1Q I 111I~~ ' c1P" 9r'-i ir4 --- 1r--91 -
~ ~r~rn '~-ir-~-~r'Cic -- ri { rrrs. Irfr , ( I -
n- i-rics -r"O irrs K _r I,>s
g~~i- a ? rrvn-J -1r--`1 irc" -snr-v ir"-ir2 ir-sn- i--,
<P Ir7 lfJ ¢ lsrl = 1 >r l[<SK < - on ~~~P rw-, I- J
rIF .; 9 rr' r r 'n-'" I-r' Ir"e lr (r Ilr-- Y rflT
wv3 111; i nr, r I-rn I p Jr-s-, arc, ir- -
il_ rv;1 f_--br ig} r->> --o ->r, i_r- , ?<[ all
f- rm r -e s ---.; O Arr-,, .r'
~~~~s-r igr; s_ <" Ir 1x--- i rk 1 Ir'j ~r^t C1¢. IO..P
Ir4 1ir--L IrP6_ ir>vIrSI9 r'--r -

-r-
,a..a. 11,. L. ,,J^...J) J--.Li LI . L r -L... L L.J
I I LA-kL,. - , JI >t L . J . jz j L..I _i .j. ;6 I ; I
. cL4 -,i ;i.I *L..JIZ Bit-,I JI ,-~A Ou LJ .i~ C - 3 .a. - ~ -L.. * l_t>Al C. ?7W j, I . -e_ J I IAIm1 J '1 -A .- J
A la I- II I jy .; *,S'l * -* &Lsj-I jI1 JI r.iZ C esJ
. yzlt1SE wl. _- S LA Yl
z -A ii.~~~ --~~ &-L_ -
31;L~_XJ ; .LJbJI * f LIJ I 4..L-a ItJl , LLI ..s%.l j - 1 I
I -- LA ~ .(IqJ j) L..i zIJI oL- c 7s _ I.J LA I ,X SIA.&,Jl, >o &z
I _ 11 J .t5P1 ,.st,z , CS _.- -S" ,. -a Im 1 :i JII LI a JI
,=LS L1---~ 1 Lai t 1 I J.L:%{ A ,1 Y L_k1 o.I
. * *-~~~~~IUL _ f t5;. v IJ 5 I a Ij ,J I I sJI 1_5 lc\ -6 a I:
L-1_m_- 1L 1-. I J I oz ;cLe~. *J-o I1 6
I j_g.-J I ,J I %--I 9 ,&:~~~~~~~~~~~~~~~~~~~~~~~~~~~J I 9 iL~~~~~~~~~ LJLJ I F. L.';.- I~~~~~~~~~~~~~Y -
, -A _ _ 1 c,-JI Xo _- b{0s J 1siJ <l*1 1, _J 16 * _ l j-
| _ . j | J tyI A& L, J_- LS _L 0J-. - oJ I
v~~~~ ' * - a- 1 3iJI ,r =I z :f>L1 1 a ISe;
r - . . , ( | ~~S I riL L : , . :-n

'?~~~~~r- .j '1-
-5 s--t IV f-I r-.-m ' r - X1- s d,
i~~r- i& Mm;r ' ̂ <|Xg1
ICr{-, rr S-4 C.4d%F [< <
isr-s fl -r,' I, zmE 1- rs- 1--:-1-
I 1 _ fI;^ C C 1^'n^1 |- .-_ "V 1 S 1 17,," r,' -'iir
|-i * [w1 z to P-- C r--r, -,' i-- -:-cr-rt1 pl --1 1-
ir-r ~ ~ w-w. .O cri-1¢ 1r-_. -n-- JJ w
,--r -4--ir ir--1:-lpfi- : _ Ir IMJ ;yi,j).f
i~~rwr F n--? 1"12 Irlo Iml. ", it1--r-- i-rr r-
rJ-n- el mr;. ir r. s if i' -r! ,rrr. r n
irri- wmi- z r_P -,r, -- .--G- ir.- - ir--ir-' l-. 2
=< '- ~1 ^-¢ l;5irv ,'>bs; ew<:_ -_

If,-swrv r t r¢l-rr Jr--@wFl -:s del-V jrl n -- l b
X-'rr'5 ir ' -' ,rw51, ; 1f!' Is ' w' 5C ICTw1 Ir:!~l K c1 ,
ir-r ir, rr,,,c .!- K <-48 z :'. -- nv
A- IS"'r s
irC,rv. --" irA - a--r- r r irw" ri-' n4r
N?N~~~~~~~~---n -- ;J .tb
--ir l8 1--r ir4l- irrc <nF t-7em,x , I,r n 2 5i.-
-- f e54_;wr 1 - -w I F|^-7f4IXe]2W _
¢n S~~~~~~~~~~r -- i- 1grr2- > m-; 1,[ srr11|----c l.
A-~~~~- irin i-, r--n -rVm- - rr -- i5,
1.. CMr- r,P Ig Ir _< I5'< ."'r 1r9I sl- fW - l& lIT l I rtn--a- is- cr-r6 r rf r4n
~~~~~~~~~~-1 i4-I -.:b iFwr w - Ir;r ---,. __.,
~~~,r ~ ~ r rr IrF c1 -6 R| o Iron Irfl-rw -I- i<n o 51l-r
,v.c .,rT-, o rX.ri, io z-nrs rir irnn? | p -! - r

-T-~~~c
wfr r.r? Iry-l- ~( r-w' Fr ) - u-1r8 r'O - , Ir>r .< irw~n w~| I r~~I- r ' r r m r a r-*
(l) I -irf Ir~i - w "" '> 'r-) irIr u" u f l' "' K r r
.,~.t~I8:% ET6n? ir~' "~" ~ ~Y, I ~rr Thr 'IT'- ir - , -v -,-zI-m--.^V~~~~ 1.-<
!&¢) *srn r Ira,-rA,- 11 x.. - r1 i-r-
1t1 s~--r -¢ Cb rc? ,- 0 4s-lrV ir _vr-Cp jrr rr..jrr,j crr. 'r t- >@-
--i r -l Il I\ r- I P rvr -, fliv n-rrcP
i2 rro_1 1-_1 ir^~ r z rr 1 r- si-_ri rn |t X1 s i0;c-
-irr ir-> n m IV rAycrg"o r r
4-1 , (-- Or Ir Ir;l, AA, '41r.-¢ s . l@
~~~~~~~~~-0 Cr.: irr 1r-* C|'.-¢<IrVro; t 11 tr>¢8 x
V~~~~~~~~ |r-- lf 1- > I rr < femIr ;
V>|¢ irs 7- lr .rrr .rj- t V "rrrlrr-¢,l->^
Ir¢_ ~Ircrilr" [¢ rmrl I1Sm- f. I., 'r r~ r ; Io"
y
jr _) Co *I ).jQ ik. l %L3JL j ""
6 W W L &.L .I L.""h. LJbj , ;>. ".L 3 .&4_96 a,..b . I iza I ~ .~ I i...JI
, 1 :L.LS~JI aim.A A *.J qJ '.4 I 1 .'j.j J
* &aLuJI *jI JYJI cY_ I >. .L,)A.L a..._ I H1 o L.W ,YI L";L% u1; -J LA W 1 5| j..uJJ
;jI al ; U w L. ,lo tJIjJI L.b j,, oj l I I L 1L L
It %Z"~~l tU AS%il *P. &.JLW.aJ l
: ,e,3t - I \II >. 4 ,sI- J J , L , 1L.-i I -* I I I I jl I* a~ L~..JII ~ J,jJLZj * £.JOL..J IjI 0*. z .p.L.J..J LI J46 ~jj' Ij
_--t Jad ,S >1 t I Ie .uY.I 1 li r I3.i dJ 6 I Z. 6 AI
CA iJ "Lm ~*Li64l a± Jj IjJVIrL-..I V. f.o"IAJIL. &~.Ln.-- -kl MII ).4^ ,*, '- La. L1, ' J I aWI, .JL-I-. lI L'- * - l ,> I
I L.> ,A |a | -* J a_; ,; at t J,sYt L|; - I ai>, - 9 - : I - * a. -_ - I ~,I ,_LAyI I.1IJI 1 J.--t. uL -l Ah5. ,^ * r.~lvs J13~. 1 ;J*I_YSt o;;JI9
9:l -xI U4.Z (j) L,~ L .3"JU - -YI J z sJLa. J * C4,4L I E I
L-J- I L_ I I LXJ U JU ; I I _I | | I 3 L I JI t -
II J..Lj (') JAL,J I *I,J I I - 1 I
s - -11 C5.:Y~~~~~~~~~,I u;;JI ..) i.sw;..L() z JI -fl

JAl- Il;r
r eNP I rw --rr-1 -`1 g I r-.r:c r-r Ir I; r- - I wm.I:
I r--1; IP rvrl i--i --r c-i- Ig w6 r-c- I> -5- l-~@ st; -
-F I, I. .16r r0Ir1
^#;z_) -T-- --- r wrr 1;.IE§-Cl--l 1 i > i
,^ ..r_, -Lr 1¢1, 1- --̂ rr 11
ds ' ~ ' ";"' K -r 5-cr -o. ,,-. Il- -o-
I, On o--- ) 1!^- ir-_-IJ I, -_-. .0^* lrtrrrr ir - O r -`_ 5t,
2 l~ lzrrrirr1 -rr-
rr-1 - ,-r Is-R I itrCr I -1 i r I -r I n- _-- I i~ rr-.--'rl I r-r I
IC. .1 1 < 1r--- f- -rlrr . 5_ - 1. r -. ;nrg I-
z- sv 1,, -^ r ,s,i, r. i--J , , ; r--C .r Q

,~r r-~~' r~-V-~ I1 -- r - rvi 1 V - 1C _- '*q2 r i'zS'ans
- -3nrs 7-- -~ C'i s. ,¢ - 5-
~' '--x.i Ir i nc-re Irrj'~~r ~ ~ 1rr-¶-i (5'--jC, ' nr_{>;? ~~- --- ck1- )- - -is 1 -- >r il%1 1- Ir't*
Ir>>l=^' ~~~~~~~~i-- *- i ¢1;wr-- r (r-r
i.c '-' ir'4- r' i& s' - 'rr 2 c r ir-n4- -
¢r-v *f'r^ ^ _ .'^ 1----=. re-- r --- [n g --- rH -rr i -- g i 1 i 11 -7s -I f cr-7
m9_>?_ * !nirci l-Oe r- 16 'n - <* 1m<
I -n It'-w-) I i,;s w - c I" 1 IrCI-~r jjr-.-.s- i,r J! - s
-er 5np t-t i <n, -J 1 ir-~n w%1v< &- z-r 1---= -- q
sP~~~~ gw->-| 1.1 C. ,Klr' crrn n rCrw *r~~ Ife l:'- <@
.-Q I rt 1 | t? I ir<---. * '"1 r4'rw ~ orA- iLri-n ir ) c1
Bl- _ ~ ~ ~ ~ ~ ~ ~ ~ ~ ~ ~ ~ ~~~~~~ircl
I-r-.1--v it~~~~~~~~~~~~~~~~
re~~~~~fcI , -
,n'-4- -_'rHJ < $4 1 r
4 ir I 1 I 1 *. 1rr 1i f -1 ' 1T If n l J I . Y l3 ,
1 IV I 5s- r iW F'.- I T1 -r 1 ', f''-I -.- 1' 1 IT 1 -- -. C 5-
o ¢- . C~., .c,-g .~ rC_ _FI I - IrCc rI --1' Cr. --
Ir -'- - <'~ 11 =1 I ,,1 1IW ,r, If¶ _' c, Icf 1 - -. 1 -- 1
1 'wf 4 C 1 ' * -> - Ir' - i%' 1- P w 11*
!r-~ ~ R(I -4 -r1 I- -4 1 l - '1 ) C| _ - I
C Ir-" Ir i--- 'V r I
incc--,n i-nr i 1- -
~~~~~lr,. i - .. r--- -rir. rl fl ,.4 . ( r sr-s
i r-r s-, i Ir.->1-n-W-- r 1i-- i,r-- r-'1)

_____________> ;A -11 ;iaL tl .1_,1 -cl
:- L.. t_YI ,_ ao1 J c.L. I AS . ,:- ..... L *1 J.u. 1- aj
* ^ Yl* s 1 %--'13,o 4L i bi J..-Lz.&Jtl , cAL ICA 3_
jt I >-- 1 1 I,, I v L , I j)JI -. l * - I I
|~LI~JI~ .,.L..JI cL5t,~.JI 1s a..L..-IJ 1L..I UJS qZ aJ Ijo i J_11j
I x _ .. ,I l _.,. , LZ I . *.Lsy. 11 *±L1 J.6 g .i , ' Jt 1-.-- JL I
* 1 ;8~~LJlI * 3 %J l 6;-1 Is Jl t>e1" Le i-Z Ia &--al*=,9~ U*_n IJ vl t ..W LS;LJ L:. 91 p ,JIs *1 eI L, * LLkJ d^A * - .
*1 1' -~~~~~~~~~; ~L1' J'-"-S ; - 1J-b^SI o 21 -- jl
* .... 1 ... Jt &,4J L; ,___L-- I
I L.* LL . lS1 XI - I I I - (..1
_9.1_1 j)J-I 64 .J.?J i,. I
J_}- PI & - - *.-.-- .IJ.ffL;1l J ,. JLI LjJ,. a>=l JIl
a... L.3 3 . J.?I >. *.. - -I L±..I *... ^J c--L,6;..Z... ..... jJJ Is4 ,a.z 11 .

YEMEN ARAB REPUBLIC
AGRICULTURAL STRATEGY PAPER
SUMMARY AND CONCLUSIONSRecent Performance
{i) Agricultural performance in the Yemen Arab Republic (YAR) in the lastdecade varied by sub-sector, but overall sector growth averaged about 1% p.a.over the period 1970/71-1982 with large interannual variations resultingmainly from fluctuations in rainfall. In the absence of reasonably longtime-series for measuring the performance of the sector or rainfall to whichit is closely related, it is difficult to determine to what extent adverseweather conditions have constrained growth. Further, aggregate figuresconceal large structural changes in the sector. Marginal cereal areas wentpermanently out of production, though simultaneously, a substantialsubstitution of very profitable qat 1/ and fruit and vegetable production tookplace in better-watered areas, generating substantial additional output. Thataggregate sector growth has been lagging behind the growth in demand for foodis also cleaz from the increase of food imports by about 402 between 1976/78and 1981/82 and from the fact that grain imports in each of the last 3 yearswere somewhat above 500,000 tons (including flour).
Strategy
(ii) Overview. Agricultural potential in YAR is severely constrained bylimited water resources; it is estimated that 90% of sector value added isgenerated on only 40t of its cultivated area (i.e. irrigated land and areasreceiving 600 -m rain or more). Consequently, means to increase theefficiency of existing water use (still very low) and to expand knowledge ofthe nation's overall water resources are vital to YAR sector development.High domestic production costs imply that the country's production advantagedoes not lie with a major expansion of grain output, though measures whichhave helped in the past to increase yields of high rainfall areas should bevigorously continued. Rather, the focus should be on growth of products whichare bulky or perishable and hence difficult to import (e.g. fruits, tubercrops), or for which a strong local preference exists. Nevertheless, severeresource constraints do not permit a sustained sector growth rate commensuratewith the expected increase in demand for agricultural products. Given therelative strength of the private sector and the present paucity of Governmentresources (managerial and financial), public sector involvement in agricultureshould continue to focus on providing essential support functions that cannotbe privately supplied, as well as establishing an environment which wouldallow the private sector in agriculture to function vigorously, by ensuringreasonable competition among suppliers and traders. Because of YAR's limitedagricultural potential, the effective functioning of research and extension isof paramount importance. Government action is also needed to assure foodsecurity by overviewing domestic stocks, building up necessary reserve stocksthrough imports and assisting in the smooth functioning of domestic markets.
1/ a mild stimulant.

- ii -
Special promotional actions and programs for agricultural development shouldbe confined to areas and activities in which sound economic returns can beexpected. Because of severe budget constraints, outlays for purposes whichare not directly productive should be kept to a minimum.
(iii) Policies. As producer prices are already high (generally twice thelevel of import prices), there is no need or justification for introducing aprice support system to stimulate domestic production. The policy of costrecovery for irrigation schemes in the public sector, though reasonableconsidering the stage of development at this stage, should be reviewedperiodically. As there is no mechanism to account for the scarcity value ofprivately pumped water, it is reconmended that Government initiate a licensingsystem and controls to preclude overexploitation of groundwater in thecountry. The policy regarding fertilizer supplies should be to continue toavoid subsidization, while aiming at making available a variety of additionaltypes of fertilizer, without which the ones currently used become increasinglyinefficient. Government should also consider whether subsidies on nurserystock have a continued justification and whether practices currently inoperation in some bilateral projects whereby farmers pay for specializedservices may be adopted elsewhere. The actual yield of the excise-tax on qatappears to fall considerably short of its potential. As this tax outweighs inprinciple the sum of all other agricultural taxes, sector resourcemobilization efforts should focus on increasing present collection levels.
(iv) Production. Fruit and vegetable production should be expanded to thelimit of the domestic market. Overall domestic demand is estimated to grow at5c p.a. and the opportunity exists for domestic production to be doubled overthat of the last decade so as to meet this demand, as well as to substitutefor about US$80 million worth of imports (1982). The strategy for developmentof cereal production should be a cautious one, respecting the economics ofproduction and resource constraints. Efforts should be concentrated onraising productivity in the areas of 600 mm rain and more, particularly thosewhich have a cereal deficit. In the low rainfall areas, cereal production ismarginal and risky, while under most pump irrigation conditions high unitwater costs render cereal production uneconomic. Large-scale programs withGovernment support to use irrigated areas for wheat production are, therefore,not justified. Subject to these principles, efforts should be made toincrease cereal production through further intensification, so as to containthe dependence on imports which constitute a substantial drain on scarceforeign exchange resources (about US$80 million in 1984). Opportunities forlivestock growth are limited. As ruminants (cattle and small animals) in YARare utilizers of by-products (e.g. straw), their production will be determinedby the growth of cereal production. Growing irrigated fodder directly for

- iii -
livestock production, on the other hand, is uneconomic. Though substantialincreases in broiler production have occurred, the advanLages of domesticproduction over frozen imports can be expected to diminish as the presentconsumer preference for live birds is likely to erode over time.
(v) The appropriate strategy for qat is problematic. As the value addedin qat production exceeds that of the rest of the sector, its economicimportance is large. Domestic demand is strong, but qat does not provide anynourishment, uses valuable land and does not generate export revenues.Consequently, views have been expressed to limit or eliminate its consumptionand hence production. Qat being a tree crop, its supply is rather inelasticand prices in the short run would fall sharply if consumption wererestricted. In the long run, qat producers would switch to other crops and,in either instance, the impact on average farm incomes would be substantial.The qat issue is complex and it is recommended that the present research befurthered in order to formulate a well articulated qat policy.
(vi) In summary, overall growth potential in the sector (excluding qat) isrelatively limited; it has been estimated here to be about 2.5% - 3%p.a. atthe very maximum and this would call for a further expansion of current goodlevels of adoption of research packages and adequate growth of supportfunctions. About one-half of the increase would be in expanded fruit andvegetable production for which a large production potential exists. Theoutlook for cereals is however, much less promising and realistically,aggregate supply can hardly be expected to keep up with aggregate demand forfood, as generated by an annual population growth rate of 3 percent. YARagriculture will not be able to make an increased contribution to foodselfsufficiency.
(vii) Food Security and Distribution. Given natural conditions andconstraints, a reliable strategy for achieving food security should bedevised. Imported food grains would continue to be needed to supplement thefood supply for commercial (urban) consumption, whereas in the countrysidelocally held on-farm stocks should mainly be relied upon. Commercialregulations governing the management of imports and of domestic freightmarkets need adjustment in order to enhance competition and efficiency. Also,government institutions involved in food distribution should provide a focusfor working with the private sector as well as a standby capacity in the eventof emergencies. A public investment program will be required to improvedistribution infrastructure, including; (i) bulk handling of all imported anddomestically distributed food and feed grains, and (ii) modern wholesalemarket and storage facilities for perishables to be operated by privatemerchants.
Supporting Services and Implementation.
(viii) Input Supplies. Limited availability of quality inputs is a majorconstraint to successful agricultural development in YAR. Examples ofshortages include non-nitrogenous fertilizer, certified seeds, disease freenursery stock, as well as various agrochemicals and medicines. Given therelative strength of the private sector, yet constrained Government resourcesand skills in commercial operations, input supply problems relating toagro-chemicals need solving through private sector initiatives. It is
- iv -
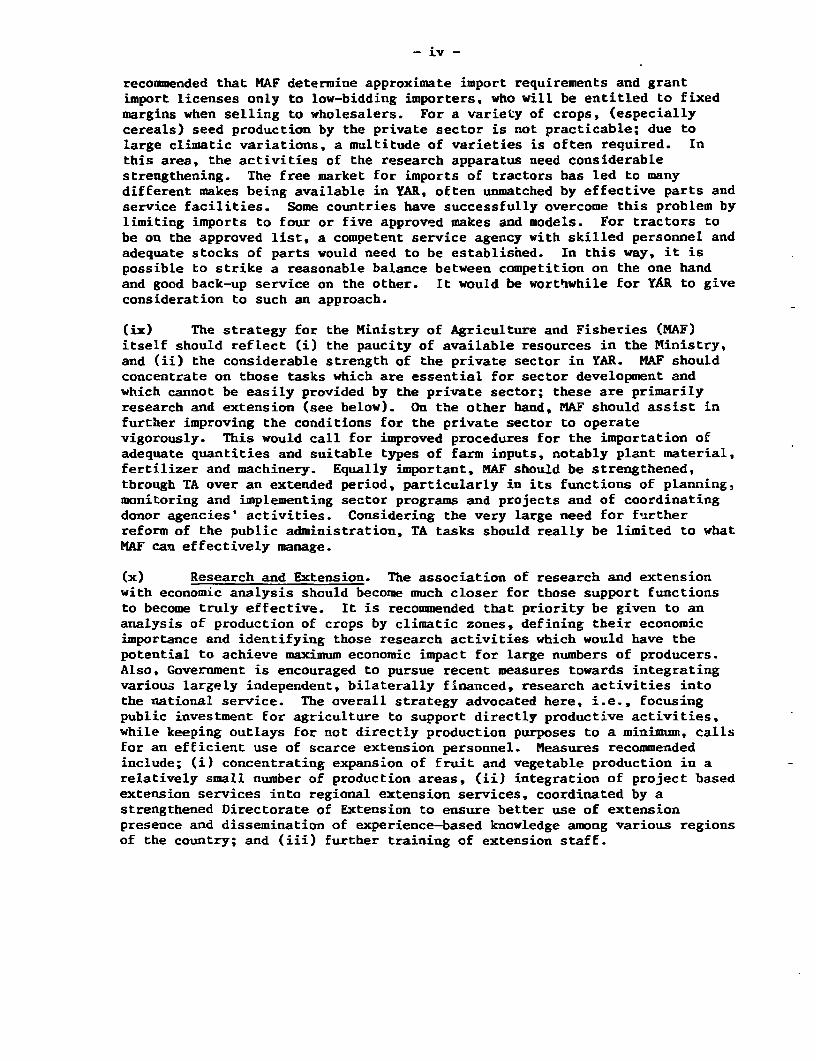
recommended that MAF determine approximate import requirements and grantimport licenses only to low-bidding importers, who will be entitled to fixedmargins when selling to wholesalers. For a variety of crops, (especiallycereals) seed production by the private sector is not practicable; due tolarge climatic variations, a multitude of varieties is often required. Inthis area, the activities of the research apparatus need considerablestrengthening. The free market for imports of tractors has led to manydifferent makes being available in YAR, often unmatched by effective parts andservice facilities. Some countries have successfully overcome this problem bylimiting imports to four or five approved makes and models. For tractors tobe on the approved list, a competent service agency with skilled personnel andadequate stocks of parts would need to be established. In this way, it ispossible to strike a reasonable balance between competition on the one handand good back-up service on the other. It would be worthwhile for YAR to giveconsideration to such an approach.
(ix) The strategy for the Ministry of Agriculture and Fisheries (MAF)itself should reflect (i) the paucity of available resources in the Ministry,and (ii) the considerable strength of the private sector in YAR. MAF shouldconcentrate on those tasks which are essential for sector development andwhich cannot be easily provided by the private sector; these are primarilyresearch and extension (see below). On the other hand, MAF should assist infurther improving the conditions for the private sector to operatevigorously. This would call for improved procedures for the importation ofadequate quantities and suitable types of farm inputs, notably plant material,fertilizer and machinery. Equally important, MAF should be strengthened,through TA over an extended period, particularly in its functions of planning,monitoring and implementing sector programs and projects and of coordinatingdonor agencies' activities. Considering the very large need for fuxrtherreform of the public administration, TA tasks should really be limited to whatMAF can effectively manage.
'x) Research and Extension. The association of research and extensionwith economic analysis should become much closer for those support functionsto become truly effective. It is recommended that priority be given to ananalysis of production of crops by climatic zones, defining their economicimportance and identifying those research activities which would have thepotential to achieve maximum economic impact for large numbers of producers.Also, Government is encouraged to pursue recent measures towards integratingvarious largely independent, bilaterally financed, research activities intothe national service. The overall strategy advocated here, i.e., focusingpublic investment for agriculture to support directly productive activities,while keeping outlays for not directly production purposes to a minimum, callsfor an efEicient use of scarce extension personnel. Measures recommendedinclude; (i) concentrating expansion of fruit and vegetable production in arelatively small number of production areas, (ii) integration of project basedextension services into regional extension services, coordinated by astrengthened Directorate of Extension to ensure better use of extensionpresence and dissemination of experience-based knowledge among various regionsof the country; and (iii) further training of extension staff.

v
(xi) Credit. The main problems are (i) difficulties in loan collection;(ii) shortage of trained manpower; and (iii) lack of coordination betweencredit and extension. Though shortage of lending funds might become aproblem. enhancing the viability of the credit system clearly should precede arapid expansion of its resources- It would also benefit from higher interestrates as this would improve the incentive for borrowers to repay promptly.Also. conmercial banks should be encouraged into agricultural lending byoffering them greater incentives through increased lending interest rates andspreads. Another method of encouraging the commercial banks to get into thissector would be to exclude deposits equal to outstanding agricultural loansfrom the application of the statuLory reserve requirements.
(xii) Training and Technical Assistance. The basic issue in acceleratingthe pace at which local institutional capability can be developed relates to;(a) striking an appropriate balance between the operational tasks and trainingrole of expatriates, and (b) progress made with Yemenization. Given priorityattention by Government, the pace of Yemenization could be greatlyaccelerated. Such priority is warranted, and should be reflected in projectdesign, as for medium- and long-range development, trained Yemeni manpowerwill be essential. It is recommended that MAF establish (with expatriateassistance) a training unit to coordinate manpower and training needs atproject, regional and national levels. This unit should determine, on arolling basis, MAF's medium and longer term man-power needs and plan how thesecan be reasonably met through; (a) project-based training, and; (b)free-standing training programs. Lhis unit should also define priority TAtasks and attempt to enforce accountability as to their execution.
(xiii) Donor Coordination. A large proportion of sector development takesplace under foreign assistance programs. Hence, it is necessary that strategyimplementation be coordinated, and policies pertaining to input prices, usercharges, etc. be harmonized, in order to facilitate integration of individualprojects into the rural economy, once these are completed. The recentlyestablished local donor consultative group chaired by the UNDP residentrepresentative would be a suitable forum for the purpose.
(xiv) Future Investment Program. Government has indicated to the missionthat it intends the new FYP for the sector (1986-92) to reflect, to the extentpossible, the recommendations made here. This paper's main recommendationswere, accordingly, discussed with both the Ministry of Agriculture as well aswith the Central Plan Organization, to ensure a coherent investment program,in which the activities of Government, IDA and other donors are properlycoordinated. Given the proposed strategy and the shortage of Governmentresources, investment priorities should reflect the need for projects whichare not expensive in terms of recurrent costs, and do not place a heavy demandon the small pool of skilled staff. Therefore, support is not recommended formulti-component area development projects but for regional projects with aspecial focus on production support services such as extension, based on pastinstitution building efforts (as under the SURDP or Tihama projects). Low costspate irrigation projects in the Tihama appear to show good returns and shouldbe pursued, provided water charges can be levied to cover operation andmaintenance costs as a minimum. In other regions, development projects with a

- vi-
specific production orientation, e.g. support to production of fruits andvegetables, or of cereals in higher rainfall areas, could be undertaken. MAF'scapacity to plan, execute and monitor its main functions needs considerablestrengthening. MAF and donors should decide on priority areas and necessary TAshould be provided under future projects. Other possible areas for publicinvestment which are consistent with the strategy proposed here would include;(i) bulk handling facilities for imported food and feed grains; (ii) mkdernwholesale market and storage facilities for perishables to be operated byprivate merchants; (iii) support for establishing regional and nationaloperation and maintenance services for completed agricultural projects;(iv) integration of project-based extension services into larger units; (v)increasing irrigation efficiency in areas already under irrigation; (vi)construction of small "check type" dams to retain flash floods for improvinggroundwater recharge; and (vii) preparation of a national water master plan,see below). These components could be included in the regional agriculturaldevelopment projects to be prepared during the Second Five Year plan.
(xv) While these are important elements of agricultural strategy for whichprovision in the Second Five-Year Plan would be justified, it is also necessaryto consider whether some of these issues and tasks should not be tackled on thebasis of a country-wide approach, drawing on the experience gained, andinstitu";-n-building achieved, through the past and on-going efforts made underthe se , of TIHAMA and SURDP projects and other area development, researchand credit projects. There was, undoubtedly, a need in the early phases ofdevelopment to proceed on the basis of specific programs for limited areas, buta stage is now being reached where it would be worthwhile to review thesituation and the strategy in an integrated, country-wide perspective.Illustrative of this approach is the on-going program for institutionalstrengthening of the Cooperative and Agricultural Credit Bank, in variousaspects such as accounting, lending policies and procedures and data processingwith modern techniques including the use of computers, alongside the provisionof funds for on-lending through the Agricultural Credit project. As is alreadyproposed, donors should assist Government in reviewing the agricultural aspectsof the national plan and, on the basis of past project experience and variousstudies carried out under the different projects and with reference to thephysical and institutional constraints affecting the sector, determine theappropriate courses of future action in the fields of water resourcedevelopment, maintenance, agricultural extension and research, marketing ofagricultural produce, training for agricultural staff, and strengthening theAgriculture Ministry so as to enable it to fulfill adequately the planning andleadership functions for the sector. It is on the basis of a carefulexploration of these critical areas from the point of view of the developmentof the sector and with reference to the emerging pattern and priorities ofinvestment in the sector, that Government should decide on the most effectivemeans through which it can further support the development of the sector.

- vii -
(xvi) Water Resources. In view of the limited known water resources in YAR.and the heavy reliance on irrigated agriculture, an in-depth study of the waterresources potential in the country should be carried out to prepare a watermaster plan for future development. Till then, top priority should be given toprojects which include substantial investment for the purpose of increasingirrigation efficiency (presently very low) in both public schemes, as well ason private holdings.

YEMEN ARAB REPUBLICAGRICULTURAL STRATEGY PAPER
L. BACKGROUND
A. Introduction.
1.01 Since the early seventies, the Yemen Arab Republic (YAR) has been inthe process of transformation from a subsistence economy with a small externalsector to a relatively open market economy, propelled by considerableremittances. Recorded remittances peaked in real terms in 1977/8 whencontributing 40Z to GNP. Since then, the volume has fallen off in real terms,and amounted to US$1.3 billion or 26% of GNP in 1983. If non-recordedtransfers of cash and goods were accounted for, remittances would have beensubstantially higher, although the trend of diminishing importance over thelast 5 years would remain unchanged. So YAR's prosperity is presently partlyinfluenced by the economic fortunes of neighboring countries (in whichremittances are generated), particularly Saudi Arabia, and ultimately bythe world oil market. Oil and gas discovered in 1984 in YAR, could improve thecountry's economic prospects, depending on the volume and price of these andthe level of traditional foreign exchange receipts (workers' remittances andofficial aid). However, the uncertainties regarding these key parameters andthe country's great need for more and better public services, both call forefficient use of oil revenue, as well as caution in fixing growth targets andmanaging the external debt.
B. Major Development Issues.
1.02 Overall Performance. Overall economic performance in recent years hasbeen satisfactory; during the period 1976/77 - 1982 GDP growth averaged about51 p.a. Sectoral growth rates differed widely; agriculture which is thelargest single sector, expanded unevenly over the period at an average rate ofabout 11 p.a. (excluding qat). Wholesale and retail trade, and governmentservices, now the second and third largest sectors, registered annual growthrates of 161 and 14Z, respectively. Investment effort was impressive, averagingaround one-third of GNP. Nevertheless, YAR continues to be one of the world'sleast developed countries. Adult literacy and school enrollment rates arestill very low, whereas the shortage of managerial and skilled manpower is anoverriding constraint to development and severely limits the capacity of thepublic administration to implement an increasingly complex developmentprogram. Health indicators depict serious problems that call for increasedvolume and quality of services. YAR's physical infrastructure remainsunderdeveloped despite the fact that it has received the greater share ofpublic investment under the First and Second Five-Year Plans. Thus, althoughthe length of the main road network has tripled over the last decade, manyareas are still without adequate road connections. The rapid population growth(estimated at about 3X p.a.) necessitates that Government should startanalyzing recent demographic trends to reach a better understanding of itseconomic consequences in order to develop an appropriate policy.
1.03 Budget deficit. The budget deficit has emerged as a major concern inrecent years. Over the past five years, Government expenditures have increasedat more than double the pace of revenues. Whereas capital expenditures increasedby about 57%, recurrent expenditures grew by as much as 2801; provisionalestimates for 1983 suggest chat the latter were nearly twice the level ofcapital expenditures. By 1982, revenues represented only about 401 ofexpenditures and the budget deficit increased to 331 of GDP. At the same time,the share of the budget deficit financed by external loans dropped from an
- 2 -
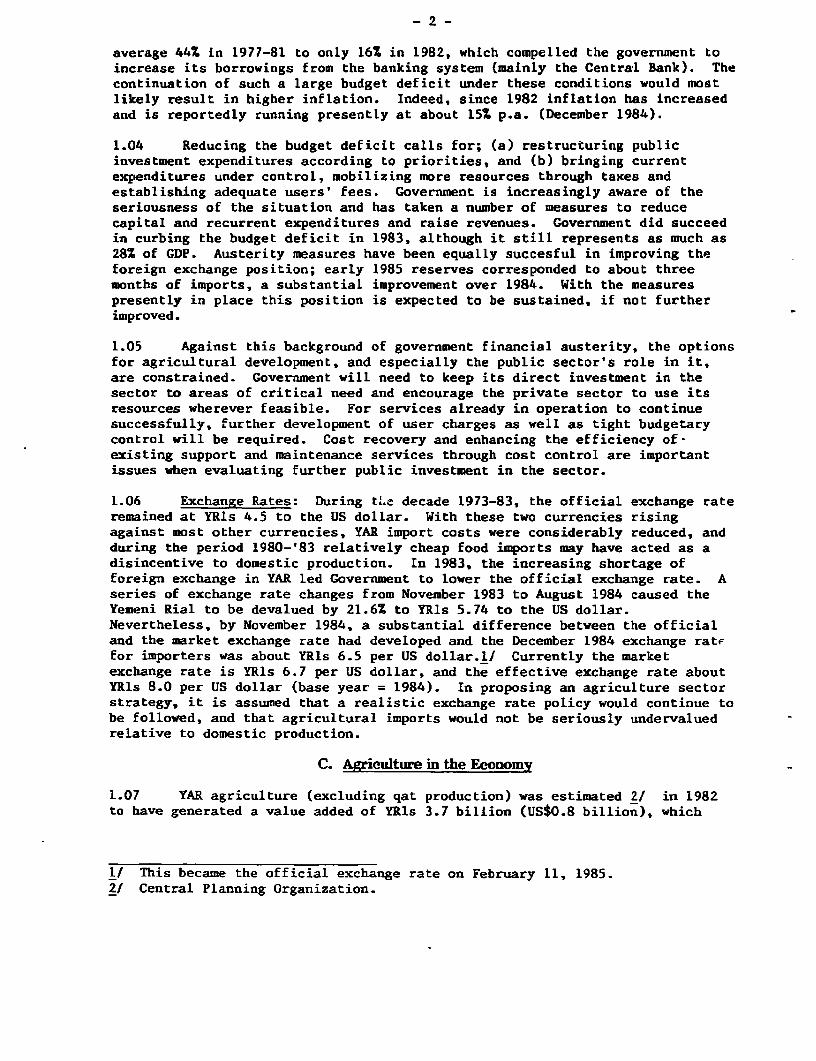
average 44Z in 1977-81 to only 16X in 1982, which compelled the government toincrease its borrowings from the banking system (mainly the Central Bank). Thecontinuation of such a large budget deficit under these conditions would mostlikely result in higher inflation. Indeed, since 1982 inflation has increasedand is reportedly running presently at about 15Z p.a. (December 1984).
1.04 Reducing the budget deficit calls for; (a) restructuring publicinvestment expenditures according to priorities, and (b) bringing currentexpenditures under control, mobilizing more resources through taxes andestablishing adequate users' fees. Government is increasingly aware of theseriousness of the situation and has taken a number of measures to reducecapital and recurrent expenditures and raise revenues. Government did succeedin curbing the budget deficit in 1983, although it still represents as much as28X of GDP. Austerity measures have been equaLly succesful in improving theforeign exchange position; early 1985 reserves corresponded to about threemonths of imports, a substantial improvement over 1984. With the measurespresently in place this position is expected to be sustained, if not furtherimproved.
1.05 Against this background of government financial austerity, the optionsfor agricultural development, and especially the public sector's role in it,are constrained. Government will need to keep its direct investment in thesector to areas of critical need and encourage the private sector to use itsresources wherever feasible. For services already in operation to continuesuccessfully, Lurther development of user charges as well as tight budgetarycontrol will be required. Cost recovery and enhancing the efficiency of-existing support and maintenance services through cost control are importantissues when evaluating further public investment in the sector.
1.06 Exchange Rates: During tL'. decade 1973-83, the official exchange rateremained at YRIs 4.5 to the US dollar. With these two currencies risingagainst most other currencies, YAR import costs were considerably reduced, andduring the period 1980-'83 relatively cheap food imports may have acted as adisincentive to domestic production. In 1983, the increasing shortage offoreign exchange in YAR led Government to lower the official exchange rate. Aseries of exchange rate changes from November 1983 to August 1984 caused theYemeni Rial to be devalued by 21.6Z to YRls 5.74 to the US dollar.Nevertheless, by November 1984, a substantial difference between the officialand the market exchange rate had developed and the December 1984 exchange ratFfor importers was about YRls 6.5 per US dollar.l/ Currently the marketexchange rate is YRls 6.7 per US dollar, and the effective exchange rate aboutYRls 8.0 per US dollar (base year = 1984). In proposing an agriculture sectorstrategy, it is assumed that a realistic exchange rate policy would continue tobe followed, and that agricultural imports would not be seriously undervaluedrelative to domestic production.
C. Agriculture in the Economy
1.07 YAR agriculture (excluding qat production) was estimated 2/ in 1982to have generated a value added of YRls 3.7 billion (US$0.8 billion), which
1/ This became the official exchange rate on February 11, 1985.2/ Central Planning Organization.

accounts for about one-quarter of GDP. Because of relatively high prices fordomestic agricultural products, however, the sector's value added would beless if it were evaluated in economic (border equivalent) prices, perhaps byas much as 60X. According to the mission's estimates, agricultural valueadded at domestic prices of qat production is approximately US$0.9 billion, orabout the same as that of the sector excluding qat (US$0.8 billion). Hence,the sector's share in total GDP is about 40% when qat is included. The factthat this locally produced and consumed stimulant accounts for about half ofsector value added (and is hardly reflected in the national accounts) is oneof the most unusual Eeatures of YAR agriculture; this has been elaboratedbelow (paras 3.17-3.22).
1.08 The sector employs about 701 of the resident work force. As 0.5million males from rural areas are estimated to be abroad (1982), and anadditional 0.1 million males from the agricultural areas work for much of theyear in YAR's urban areas, females predominate in the agricultural labor forceand frequently make important production decisions. However, the overallagricultural labor supply is, in the aggregate, substantially in excess ofrequirements (para 2.15), though at peak times, local shortages certainlyoccur. It follows that, in such circumstances, average labor productivity iscomparatively low.
1.09 Rural and Urban Incomes. Estimates of the overall rural/urban incomestructure are presented below. Of rural income, an estimated 321 comes fromqa., 241 from other agriculture, 301 from remittance and 10i from othersources. Because of the very substantial importance of both qat andremittances in the rural economy, large changes in these sources of revenueswould, of course, alter the present situation significantly.
Tahlp 1 .1 - RURAL AND URBAN INCOME ESTIMATES (1982)
Rural Urban Total- (YRls million) - - - - -
Share of Recorded GDP 3,685 9,110 12,795Qat Value Added /1 4,000 - 4,000Remittances 4,665 1,340 6,005Others 2.850 950 3.800Totals 15,200 11,400 26,600
/1 Annex 1, Table 11Source: Annex 1, Table 8.
1.10 Agricultural Trade. The rapid increase in demand for foodstuffscaused by the high levels of workers' remittances, together with the high rateof population growth, has not been met by a corresponding increase in domesticproduction (para. 2.01). Consequently, food imports rose rapidly during thelast decade to US$450 million in 1982 1/, corresponding to about 301 of allmerchandise imports. Animal products, cereals and cereal products, as well asfruits and vegetables accounted each for about one-fifth of total foodimports, the balance consisting of sugar, vegetable oils etc. (Annex 1,Tables 12 and 13). Agricultural exports, always small, have now fallen to aninsignificant level.
1/ More recent estimates were not available to the mission.

I. AGRICULTURAL SECTOR
A. Agricultural Performance
2.01 In countries like YAR, sector performance is, of course, closelyrelated to rainfall. In the absence of reasonably long time-series for eitherparameter, it cannot be determined to what extent adverse weather conditionsconstrained growth. Agricultural performance In the last decade varied bysubsector, but overall growth averaged only 1Z p.a. over the period1970/71-1982. Over the period 1975/76 to 1983, the absolute level ofagricultural sector GDP (excluding qat) stagnated, and partly as a consequenceof that, reported agricultural sectoral GDP, which excludes qat, fell in thesame period from 452 of total GDP at factor cost to 25X. Comparing thetwo-year period, 197516 and 1976/7, with the two-year period 1982 and 1983,agricultural GDP growth for the six and a half year interval totalled 112 inconstant 1975/76 prices, but declined by 92 if current prices deflated by theGDP deflator are appLied (Table 2.1). This latter figure is probably the moreappropriate, as it expresses agricultural value added in terms of the wholebasket of national goods; it indicates that agricultural prices relative toother prices declined in real terms over that period.
2.02 The agricultural statistics, though perhaps unreliable in absoluteterms, are useful indicators of the direction in which the sector has moved.These indicate that total cropped area increased from the early to the mid'70s, but declined since (see Annex 1, Table 1). The reported cropped area ispresently some 232 below the peak recorded figure of 1974/5. The main areacontraction has been in cereals, with a much smaller area reduction of therather insubstantial export crops, coffee and cotton.
2.03 The major recent shifts in land use were caused by productivitydifferences between crops. Marginal cereal areas went permanently out ofproduction, especially on tenant-operated farms in low rainfall areas.Simultaneously, a substantial substitution of very profitable qat and fruitand vegetable production for cereals took place in high rainfall and irrigatedareas, generating substantial growth in output of these commodities. Togetherwith the contraction in the cereal area planted, estimated production hasfallen (Annex 1, Table 4), although the very low figures for 1983 and theexpected low figures for 1984 are results of extreme drought conditions. Onthe other side, significant improvements in overall yield levels have beenachieved in some instances (Annex 1, Table 3). Cereal yields which were below0.8 ton/ha during the three year period 1971/72 to 1973/74, were above 0.95ton/ha in 1979/80 through 1981. Similarly, potato yields appear to have risenfrom around 11 ton/ha in 1971/72 to 1973/74 to over 12.5 ton/ha. The evidenceof these overall yield figures is supported by information coming from IDAprojects, e.g., the Southern Uplands Regional Development Project and projectsin the Tihama region, which indicates substantial increases in yields on farmsparticipating in those projects. It is therefore quite possible that, once anormal rainfall year occurs, the benefits which are already being seen at theproject level, will be better reflected in the aggregate figures.
2.04 Import figures which are probably much more reliable than sectoralGDP estimates, indicate sharp increases in food imports over the past sevenyears. This confirms that agricultural sector growth has lagged behind thegrowth in demand for food. Table 2.1 shows the trends of both agriculturalvalue added and food imports over the past few years. The average food import

- 5 -
level in 1981 and 1982 was 42Z higher than that in 1976177 and 1977/78. Thevalue of imported foods and live animals in 1981 and 1982 was equivalent toabout 40X of agricultural value added (excluding qat), compared to aboutone-third in 1976/77-1977/78. Grain imports in the last 3 years were somewhatabove 500,000 tons (incl. flour). In 1984, food imports, in relation toagricultural value added, would probably have been still greater.
Table 2.1: FOOD IMPOPTS AND AGRICULTURAL iALUE ADDED /a
1975/6 1976/7 1977/8 1978/79 1979/80 1981 1982 1983(YRis Million)
Food and LiveAnimal Imports
- Current Prices NA 871 1,543 1,305 1,895 2,864 2,033 NA- Deflated by
GDP Deflator NA 698 1,056 777 1,040 1,513 985 NA(to 1975/6 prices)
Agricultural ValueAdded
- Current Prices 2,011 2,313 2,409 3,049 3,458 3,685 3,799 3,596
- Deflated byGDP Deflator 2,011 1,853 1,649 1,815 1,898 1,947 1,840 1,670(to 197;/6 prices) -
la Includes agriculture forestry and fisheries.
Source: CPO
2.05 The above mentioned aggregate numbers do not reveal, in general, theconsiderable pregress made, both at the project level, as well as iu overallsector management and in the provision of supporting services, e.g. research,extension and credit. The PPAR's of both the first Southern Uplands RegionalDevelopment Project and the Tihama I Project indicate that all major objectiveshave been achieved. Most ongoing IDA-assisted projects in agriculture areprogressing satisfactorily. A sumnmnary account of completed IDA-assistedprojects in YAR is in Appendix B.
2.06 Sector Value Added and Qat. Any analysis of the agricultural sectoris incomplete without considering qat. Estimates of rural per capita incomegiven in Annex 1, Table 8, indicate that only about 30Z is generated by non-qatagricultural production, with some 38Z coming from remittances and 32Z fromqat. A re-estimate of agricultural sector GDP for 1982 indicates that, atdomestic prices, sector GDP would more than double if qat were included; viz.an increase from 3.7 billion YRis to 7.7 billion YRis (see Annex 1, Table 6),with qat providing 52X of sector value added. At border prices, however,agricultural GDP would be substantially lower (domestic prices of agriculturalproducts are substantially above border prices, viz. para 3.02). At thoseprices, estimated agricultural sector value added would be as follows.
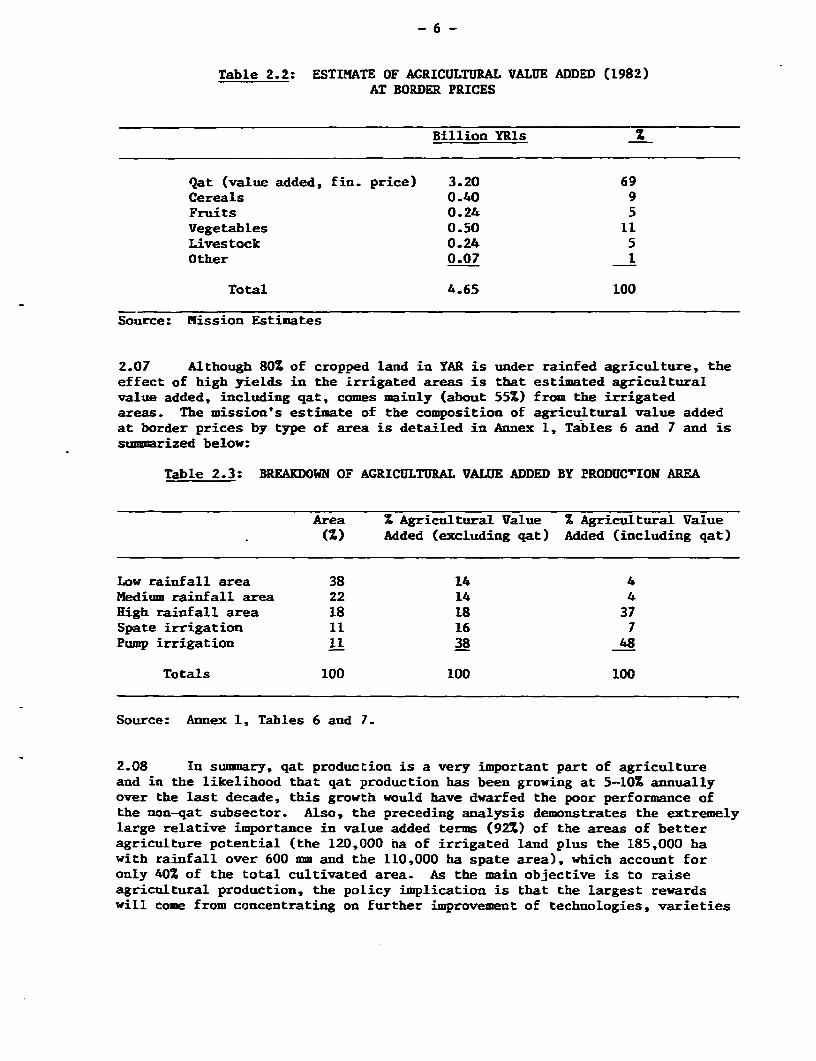
Table 2.2: ESTIMATE OF AGRICULTURAL VALUE ADDED (1982)AT BORDER PRICES
Billion YRls Z
Qat (value added, fin. price) 3.20 69Cereals 0.40 9Fruits 0.24 5Vegetables 0.50 11Livestock 0.24 5Other 0.07 1
Total 4.65 100
Source: Mission Estimates
2.07 Although 80X of cropped land in YAR is under rainfed agriculture, theeffect of high yields in the irrigated areas is that estimated agriculturalvalue added, including qat, comes mainly (about 55Z) from the irrigatedareas. The mission's estimate of the composition of agricultural value addedat border prices by type of area is detailed in Annex 1, Tables 6 and 7 and issuimmarized below:
Table 2.3: BREAKDOWN OF AGRICULTURAL VALUE ADDED BY PRODUC`ION AREA
Area Z Agricultural Value X Agricultural Value(X) Added (excluding qat) Added (including qat)
Low rainfall area 38 14 4Medium rainfall area 22 14 4High rainfall area 18 18 37Spate irrigation 11 16 7Pump irrigation 11 38 48
Totals 100 100 100
Source: Annex 1, Tables 6 and 7.
2.08 In summary, qat production is a very important part of agricultureand in the likelihood that qat production has been growing at 5-10X annuallyover the last decade, this growth would have dwarfed the poor performance ofthe non-qat subsector. Also, the preceding analysis demonstrates the extremelylarge relative importance in value added terms (921) of the areas of betteragriculture potential (the 120,000 na of irrigated land plus the 185,000 hawith rainfall over 600 mm and the 110,000 ha spate area), which account foronly 40% of the total cultivated area. As the main objective is to raiseagricultural production, the policy implication is that the largest rewardswill come from concentrating on further improvement of technologies, varieties

- 7 -
and methods of operation in these very areas (which also have the highestrural population density). For low rainfall areas without irrigationpotential (for which virtually no extension packages are available) supportfrom the standpoint of human well being may be needed. It is unlikely,however, that productive improvements here can make a major contribution torapid sector growth.
B. Resources and Constraints
Land and Water
2.09 Of the 20 million ha of land in YAR, more than three-quarters istotally unsuited to agriculture, and a further 3.5 million ha is not used foragricultural purposes because of the water constraint, although the sparsebush vegetation in this area is utilized to some extent by livestock. Most ofthe cultivated area is owner-occupied, though a significant proportion,estimated at 10-15Z, is operated under some form of share-farmingarrangement.
2.10 Land. The intrinsic quality of agricultural land varies considerablyby region. It is influenced primarily by topography, elevation and soils.However, given the climate of YAR, the overriding factor determining theeconomic usefulness of agricultural land, is the availability of water.According to surveys undertaken during the 1970s, the potential agriculturalarea in TAR appears to have been about 1.5 million ha. However, this isprobably an overestimate of the area effectively available in 1985, asconsiderable abandonment of terraces occurred in the interval, mostly inlow-rainfall areas where cereal production (especially under sharecroppingarrangements) became increasingly unattractive as wages rose. The 1983Statistical Yearbook 1/ figures indicate that the cropped area declined froman average of 1.32 million ha in 1973/4 - 1975/6 to 1.06 million ha in 1981-1983.- Cropped area at any time is, of course, a function of rainfall andfinancia'l incentives, as well as the size of the effective land resource. Themission estimates the aggregate agricultural land area in TAR to bedistributed follows (detailed in Annex 1, Table 7).
1/ CPO publication.
Table 2.4: DISTRIBUTION OF AGRICULTURAL LAND(Million ha)
Rainfedless than 450 mm (incl. fallow
land) 0.71450 - 600 mm 0.22Over 600 mm 0.19
Total rainfed 1.12
IrrigatedSpate Irrigation 0.11Pump Irrigation 0.12
Total Irrigated 0.23
Total Agricultural Land 1.35
Source: Agricultural Census 1983 and mission estimates.

- 8 -
2.11 Land Tenure. It is often observed that the land tenure situation inYAR is a considerable obstacle for sector development; this is not fullysupported by the recent census results which indicate that over 80X of allfarm land is owner-operated (Table 2.5). Holdings are considerably fragmented,with an average of 4.6 parcels per farm. Because of unusually large variationsin microclimates on steep slopes, however, the general disadvantages of suchfragmentation are in many areas of YAR perhaps balanced by the advantage ofrisk spreading.
Table 2.5: YAR NATIONAL AGRICULTURAL LAND TENURE
Number of Holdings(X) Area of Holdings (Z)
Holdings with One Type of Tenure
Owned 66 77Share Cropped 10 3
Holdings with more then One Typeof Tenure
More than 50Z Owned 14 13Less than 50Z Owned 9 6
Others (Rented etc.) 1 1100 100
Source: Agricultural Census 1983
2.12 Water. Water for agriculture comprises: (a) rainfall; (b) spatesduring heavy surface runoff; (c) base flow in wadis generated from saturatedslopes in highlands and springs; and (d) groundwater from the aquifer. Theagricultural development projects undertaken by the Government to date, withIDA's assistance, were designed as a first step to efficiently manage theknown amounts of surEace water at the source as well as groundwater.Considerable scope exists to further decrease water conveyance and applicationlosses, and thus increasing irrigation efficiency by means of improvedpractices and modern techniques.l/ However, additional irrigation developmentrequiring more water than presently known should await the results of studiesleading toward a water master plan (para. 2.14). Such measures should,therefore, continue to be taken until all irrigated areas have been fullydeveloped.
2.13 The impounding and storage of occasional runoffs in high rainfallareas had been practiced in the past as is evidenced by the existence ofseveral old dams in YAR which are intact even today, though not operativeanymore. The reservoirs of these very old dams have been filled up withsediments resulting in fertile lands on the surface. The deposited alluviumhas created a subsurface storage of ground-water used for irrigation which getsrecharged through seepage of the runoff retarded above the dams. Similardams, of small sizes involving low investment costs, could still beconstructed or the existing ones rehabilitated for conservation of water,
1/ 25-30X as estimated for the present to 50-55X in the future.

-9-
provided such projects would be financially viable and economicallyattractive. However, any substantial investment for large storage dams shouldbe considered only after full investigations based on reliable and sufficientdata, on internationally accepted standards, have been made of thehydrological, geological and environmental aspects to prove the technicalsoundness oE a project.
2.14 The potential for the development of water resources in YAR existsin: (a) efficient management of surface water; (b) use of runoff to rechargethose zones of the aquifer which are subjected to pumping; (c) possibletransbasin diversions; and (d) surface detention of the runoff by checkdamsto: (i) reduce erosion in the watershed, (ii) increase base flows in the wadisfor perennial irrigation, and (iii) reduce spillage into the sea and thedesert. The assessment of the above potential requires in-depth studies ofwater resources in all regions of YAR.
2.15 At present, aside from project related studies, the only large-scalewater resources study being carried out concerns the Tihama region. In orderto fully understand the water resources development potential in YAR, it isrecommended that similar studies be carried out for al1 regions of the countryand which should form the basis for a water master plan for futuredevelopment.
2.16 Manpower. The agricultural labor force in YAR has been substantiallyreduced over the past decade by emigration to Saudi Arabia and other oil richstates. The associated flow of remittances has led to high domestic wages,probably as a result of the reservation wage effect, rather than widespreadlabor shortages or relatively high marginal productivity in the sector. Ananalysis of available agricultural labor and of the likely aggregate sectorlabor requirements (Annex 1, Tables 9 and 10), suggests that averageperson-day equivalent requirements for agriculture amount to about 60person-days for every 275 person-day available; even accounting for seasonalpeak labor demands, this is low. It indicates that in the aggregate, laboravailability is not a serious constraint to agricultural development as isoften alleged, though local shortages in peak periods certainly occur.2/ Thisanalysis is summarized below.
Table 2.6: DEMAND FOR AGRICULTURAL LABOR
Total Person-daysCropped Average Person-days needed perArea Requirements needed effective('000 ha) (days/ha) (million) worker/year
Crop production 1040 54 57 41Livestock NA NA 23 16Total Agric. Labor Demand 80 57
Source: Mission estimates (Annex 1, Tables 9 and 10).
2/ The slow-down in the economies of oil countries may also cause theirdemand for labor to ease.

- 10 -
2.17 Agricultural labor supply is estimated at the equivalent of 1.4 millionafter adjusting for; (i) 501 of the agricultural population of 5.4 millionbeing economically active; (ii) 0.6 million males being away; and (iii) thefact that women's work in agriculture is restricted by custom, household dutiesetc., resulting in their being the equivalent of 501 effective for agriculture.The existence of a large number of women and children who could, if necessary,help at peak times, strengthens the argument that labor availability is not amajor constraint to agriculture. However, unless the cost of labor dropssharply, the very high wage rates (US$10 - US$15 per day) relative to the lowlevels of agricultural productivity must be an inhibiting factor in thedevelopment of commercial agriculture. A modest decline in real wages isexpected for the medium-term (para. 4.01).
C. Present Sector Strategy
2.18 The Second Five-Year Plan document describes the thrust of the presentstrategy as to achieve a reasonable level of food security by modernizing theagricultural sector. More specifically, the strategy comprises the followingmain elements:
(i) Emphasizing mult-component rural development as a means ofraising production and improving living conditions of the ruralpopulation;
(ii) Encouraging the establishment of cooperatives that protect theinterest of the farmers by providing them with agriculturalinputs at low cost, and helping them market their products;
(iii) Creating strategic buffer stocks of staple crops and completingbasic infrastructure along with adopting a price policy thatsupports domestic production and rationalizes consumption;
(iv) Developing agricultural services, with special attention tocredit, agricultural research and extension, marketing,veterinary and other services, to assist farmers, particularlysmall farmers; and
(v) Increasing the efficiency of present water use, mobilizing provenpotential water resources and conducting surveys of resources.
2.19 Whereas modifications of this strategy will be proposed in Chapter IV,some main comments can be summarized as follows. First, there appears to be aninclination towards increasing Government intervention which may perhaps extendto input subsidies. This appears undesirable considering; (i) Government'smodest operational capabilities; (ii) the fact that virtually all productprices are well above import parity levels; and (iii) the undesirability ofsubstantially increasing farm subsidies in view of the large Government budgetdeficit. Second, public sector finance constraints constitute a strongargument against emphasizing generally expensive integrated rural development,as opposed to directly productive investments in areas with potential foragricultural development. Third, the present food security measures do notreflect the rapid changes in consumption patterns, nor do these take fullaccount of the fairly efficient traditional food security system in thecountryside (para 2.31). Food security is essentially a public sectorresponsibility; its execution, however, should continue to rely, to the extentpossible, on the private sector.

- 11 -
D. Publie Sector Investment Under the Second Five-Year Plan (SFYP)
2.20 Originally the public sector investments for the SFYP period 1982-'86were planned as follows:
Table 2.7: AGRICULTURAL SECTOR INVESTMENT PROPOSALS UNDERTHE SECOND FIVE-YEAR PLAN (1982-1986)
Subsector YRls million S
Irrigation (mainly spate) 951 39- of which TDA a/ (456) (19)Rural Development 314 13Livestock 300 12Crop Production Projects 279 11Research & Extension 217 9Institution Building 118 5Others 236 11
Totals 2.4 100
a/ Tihama Development Authority
Source: 2nd FYP Document
2.21 Proposed public sector agricultural investment for the SFYPcorresponded to 13Z of total planned public investment. As particularlycategories such as irrigation and rural development often include elements ofinfrastructure, research, extension and institution building, the breakdowngives only very global information about the distribution of planned sectorinvestment.
2.22 In 1982, the growing budget deficit called, among others, forreduced capital expenditure. Government conducted a public investment reviewand requested IDA to assist in this effort (Report No. 4821-YAR). Thereport's major recommendation, viz. to reduce total investment by about 112has, by and large, been accepted by Government. After revision, agriculture'sshare remained at 13X, despite reductions in activities which could beundertaken commercially, deferrals of some of the costly rural developmentprojects, and consolidation of various smaller projects. Approximately 752 ofplanned investments are for IDA-assisted projects. Though actual capitalexpenditures for public sector development have risen rapidly in recent years(doubling between 1981 and 1983), they are still about one-quarter belowplanned amounts, thus reflecting constraints regarding absorptive capacity.In summary, limited absorptive capacity is likely to limit public expendituresfor sector development to levels commensurate with available resources.

- 12 -
E. Sector Policies
2.23 High commodity prices are generally less the result of directGovernment intervention than of high factor prices (e.g. labor, and pumpedvater), as well as of substantial market imperfections generally associatedvith an early development stage (inefficient marketing, high transportcosts). Indeed, direct government intervention in YAR is still limitedcompared to many developing (or developed) countries.
2.24 ReLiance on Private Sector. While the private sector is far fromperfectly competitive (e.g. transportation cartels), the high growth centersin agriculture, such as relatively high technology poultry or vegetableproduction, as well as marketing services, have been the product of private,rather than government, initiatives. Overall, there is a large pool ofentrepreneurial capacity in YAR, as well as a reasonably capitalized andcapable private sector. The latter dominates all aspects of the foodmarketing pipeline, as well as the provision of inputs (including feed andsmall-scale irrigation capital goods). This orientation partly reflects therather limited administrative capacity of the public sector agenciesinvolved. Further, merchants have been important supporters of the regime,and are able to influence policy changes that would affect their livelihood.
2.25 Government and Imports. Government has a direct involvement in atleast one critical aspect of agriculture, i.e., managing the flow of foodimports. The Ministry of Supply has responsibility for overall planning, on arolling annual basis, of strategic commodity imports through tenders that localgovernment agencies or private firms bid on (this system includes a pricestabilization and cross-commodity subsidy element for wheat, rice, flour andcement). The Ministry of Supply controls the prices for all these strategicimports and fixes relatively attractive profit margins for importers, whole-salers and retailers. The actual quantities, and hence profits, are alsoallocated among the various government agencies and private traders by thisMinistry. On food security grounds, 40% of all strategic food imports arereserved for four government companies, which compete with private importersand maintain also their own retail networks (although normally most of theirallocation is ultimately sold through private retailers). In addition tothese controls over strategic commodities, Government supervises feed imports(that arrive in bags, thus adding 20X-402 to their CIF cost), while meat andlivestock imports are subject to restrictions which partially explain highdomestic meat prices.
2.26 Transportation. Market imperfections, associated with poortransport infrastructure, are amplified by private freight controls whichallocate transport service to small owner/drivers on a first-come first-serve,fixed-price basis. In effect, these measures have led to the creation of atransportation cartel, as a consequence of which cost of transport isrelatively high, while creating at the same time excess freight capacity.While there are no data available to estimate the cost of such high tariffsand over-capacity to the nation, it is believed to be significant. In termsof agricultural prices, a more competitive system could significantly increasepurchaser incentives, while reducing prices paid by consumers.
2.27 Taxation. The general principle applicable to the sector is that ofa religious tithe (zakat), corresponding to 5Z of gross value of production

- 13 -
for well-irrigated areas and 10% on all other land (for qat, see next para),Government revenue data indicate that actual revenues fall considerably shortof projected ones (it is estimated that in 1982, receipts were only aboutone-third of what they should have been). Whereas privately pumped water isnot taxed at all, the cost recovery principle in publicly financedspate-irrigation schemes (i.e. the IDA financed Tihama projects) is to recoverfull capital costs in real terms, but with no interest, over 50 years, as wellas to cover full operation and maintenance costs. Collection is generallymeant to be through zakat and a surcharge of abou'l 2% of gross value ofproduction. According to the Tihama Developement Authority (TDA) management,this surcharge has, as yet, not been collected in schemes already completed.However, Government has recently issued a decree to that effect (April 1984).and the Ministry of Finance has been instructed to collect the surcharge tax.
2.28 Though the excise-tax on qat increased by about 150% p.a. in thelast four years, the potential of this tax appears to substantially exceed itsactual yield. The tax is an ad-valorem one of 10% (recently increased to12%), to be collected at central urban markets and check points on roadsleading into major citris. Actually, only part of urban consumption ispresently taxed, while rural consumption remains virtually untaxed.
2.29 Subsidies. At present, agricultural credit through the Cooperativeand Agricultural Credit Bank (CACB) is subsidized to the extent of three tofive percentage points. CACB lowest agricultural loans are at 9-10% comparedwith a market rate of about 15%, whereas inflation in 1984 was about 11%.
F. FoodSecurity
2.30 The recent changes in YAR's economy, particularly the rapid growthin real incomes, have had a substantial impact on food security. Whileimportant nutrient deficiencies still exist, the overall problem is no longerone of inadequate purchasing power, but rather of nutritionally ill-balancedsupplies. Indeed, the overall food consumption pattern and associated tradeflows are now approaching to those found in many middle-income countries,i.e., YAR currently spends more on non-grain imports (particularly animalproducts) than on food grains. This diversification of food imports is, initself, a major factor in reducing real or perceived risks associated withoverall food supply.
2.31 Local structures of production and marketing have, in general, notchanged as dramatically as consumption. In response to often adverse weatherconditions, farming is still organized to minimize risk, rather than maximizeoutput. As a result, on-farm or village carry-over (buffer) stocks are large,up to one year of a good year's harvest; traditional storage facilities aregenerally ample. Existing stocks held outside government control appear tohave been sufficient to prevent serious problems in drought years. This wasclearly demonstrated in recent years, when domestic grain output fell wellbelow the trend because of drought, whereas grain imports remained at aboutthe same level (somewhat above 500,000 ton/yr) and domestic grain prices(ex-farm) remained at about the same levels.

- 14 -
m. ISSUES. CONSrRAEITS AND RECOMMENDATIONS.
A. The Economics of Crop Production and Price Incentivesfor Different Crops
3.01 Overview. In general, the price structure in YAR is such thatreturns to most crops are substantially more attractive in financial termsthan when expressed in economic prices, and hence, existing price incentivesare, in the main, adequate. The fundamental problem is high resource costs,particularly pumped water, while physical performance potential is relativelylow. Hence, it is extremely difficult for agriculture to be profitable in theabsolute sense.
3.02 Product Prices. As a result of various market imperfections (e.g.import regime, freight cartel) and local preferences, prices of agriculturalproducts in YAR are substantially above their estimated border prices. InTable 3.1 below, estimated economic prices (detailed in Appendix A) arecompared with financial prices used in the appraisal reports of the last twoIDA agricultural sector projects in YAR and in the identification report ofthe proposed SURDP III project. During the mission's November field visit, itappeared that financial prices had, in fact, risen from these levels. Thefigures, which typically show domestic prices to be two to three times theborder level, indicate that strong price incentives are already available tothe agriculture sector. In the aggregate, quite modest agricultureperformance appears to have occurred in spite of generally very favorableproduct prices in the sector. Nevertheless, production of some irrigatedcrops (potatoes, vegetables, grapes) was expanded significantly because offavourable prices.
Table 3.1: PRICES FOR AGRICULTURAL PRODUCTS(YRls/kg)
Estimated Financial PricesEconomic Prices /a Wadi Jawf Center. H.L. SURDP III
1984 1984 1983 1983
Sorghum 1.07 2.80 2.40 2.85Maize 1.13 - 2.40 2.42Wheat 1.14 3.30 2.80 2.00Sorghum Stover 0.27 0.50 0.40 0.95Maize Stover 0.28 - 0.50 1.00Wheat Stover 0.28 0.60 0.50 1.07Alfalfa (green) 0.27 /b 0.80 0.60 0.60Potatoes 1.3 2.50 1.50 2.64Oranges 3.0 3.50 4.00 4.00Onions 1.6 NA NA 1.30Vegetables NA NA 2.0 NACotton 3.8Lamb /c 5.6 20Chicken /d 8.0 17
/a At the December 1984 market exchange rate of YRls 6.5 to US$1./b Assumed 25% dry matter (DM): On DM basis worth 80% of wheat./c Live weight assuming 45% carcass weight/d Carcass weight.

- 15 -
3.03 Water Costs. Water costs depend on source. Until now, spate irriga-tion in Government-supported schemes, costing about US$15/l,OOOm3, has beenfree to farmers (para. 2.27); Government, however, recently issued a decree tocollect charges and TDA has been instructed to collect these. For privatelypumped water, costs amount to about US$60/l,OOOm3. or about US$750/ha.Against this cost structure, it is generally not possible to produceprofitably low-value crops, such as cereals or pulses with pumped water.
3.04 Other Input prices. Given the generally low level of physical produc-tivity, daily labor costs at YRls 85 (US$13) are clearly very high. Althoughfamily labor is important, hired labor is used in varying proportions on about80X of the land. It is estimated that, in the aggregate, about half of allagricultural labor is hired, mostly on a daily basis. The price of hiredanimal power is also high at YRls 100-150/day (US$15-22), and is caused by;(i) the high price of labor, which is included in the daily cost of a hiredanimal team and (ii) the high value of livestock brought about by effectiverestrictions on livestock imports and strong domestic demand. The cost oftractor mechanization at YRls 100/hr (US$15) for a 60-horse power tractor plusimplements does not seem excessive, given high maintenance costs and ofteninefficient use. This cost probably reflects the fact that there is anover-supply of agriculture tractors in various parts of YAR.
3.05 Most other inputs, fertilizers, sprays, etc., are generally priced atlevels comparable to import parity prices. Importation of fertilizer byGovernment at negligible cost appears to be offset by excess profits in themarketing chain. Imported animal feeds are expensive, partly because shippingis in bags rather than bulk, and probably because of a monopolistic supplysituation. Input prices vary substantially by region and by project, as someof the hilateral donors sometimes have different policies regarding thepricing of inputs to farmers. This, in itself, has a distortionary effect andit is important to rationalize these procedures through better donorcoordination (para. 4.15).
3.06 Crop budgets. Unit budgets, at both financial and economic prices,have been prepared for major crops in various ecological zones of YAR(Annex 1, Tables 16-21). These budgets are based on with-project assumptionsand taken from Staff Appraisal Reports and Preparation Reports for variousIDA-assisted agricultural projects in YAR. Therefore, the figures representachievable potential, rather than present performance. Analysis of thesebudgets provides useful indicators of what crops in specific ecological zonesare financially attractive and provide acceptable potential economic returns,assuming a reasonable level of technical performance. From the analysesundertaken in the SURDP projects and the various Tihama projects, it wouldappear that present aggregate levels of performance, in terms of laborproductivity and output per hectare, average around 30X below the figures inthe budget estimates presented here.
3.07 Financial Returns A summary of the financial returns for selectedcrops to land, labor and water are set out in Table 3.2 below. (details inAnnex 1, Tables 18-20). As is to be expected under the YAR price structure,these returns are generally substantially more attractive than those based oneconomic prices.

- 16 -
Table 3.2: SUMMARY OF NET FINANCIAL RETURNS FOR SELECTED CROPS
Rainfed Rainfed Upland TihamaArea (450mm-600mm) (600mm & more) Irrigated Well Spate
Returns to Land - …- … i ls/ha…----------------------------
Sorghum 43 2,486 Negative 4,469 1,447Wheat 478 2,774 125 - -Maize - 2,934 1,950 - -
Potato - 3,770 11,970 - -Onion/Tomato - 12,500 (0) 25,240/9,940 12,540 (T) 13,125 'O)Alfalfa - - 11,370 - -Cotton - - - NegativeCitrus - 27,070 - -
Returns to Labor -----… -------- YRls/man-day- ----------
Sorghum 87 168 78 145 107Wheat 109 211 89 - -Maize - 183 134 - -
Potato - 127 205 - -Onion/Tomato - 210 (0) 295/184 210 (T) 199 (0)Cotton - - 33Alfalfa - - 161 - -Citrus - - 424 - -
Returns to Water -- YRls/m 3 ----- …
Sorghum - - 0.35 0.43 0.23Wheat - - 0.39 - -Maize - - 0.56 - -Potato - - 1.38 - -Onion/Tomato - - 1.21/2.48 1.04 2.07Cotton - - - - NegativeAlfalfa - - 0.75 - -
Citrus - - 1.39 - -
Source: Annex 1, Tables 18-20.
3.08 In the 450 mm rainfall belt, where the main crops are cereals, yieldsof 1.3 to 1.4 tons/ha can be achieved under good management. Under such condi-tions, cereal production is financially just attractive, as it gives returnsto labor slightly above the going wage rate of YRls 85/man-day. In areaswhere yield levels are below 1.2 tons/ha, the return to labor would be belowthe wage rate. For wheat and sorghum, this cut-off yield occurs in areas ofaround 400 mm rain. In regions of still lower rainfall, production isfinancially only attractive if unpaid family labor is available, or if produceis being home-consumed and therefore valued at retail prices rather thanfarm-gate prices (para. 3.15).

- 17 -
3.09 In the higher rainfall areas (600 mm and more), most crops arefinancially attractive, with potatoes and vegetables yielding substantiallyhigher potential returns per hectare than cereals, though requiring a higherlevel of management skill. On the other hand, production of the former ismore risky (the magnitude of loss in a drought year is much greater withpotatoes than cereal crops, as cash production costs are about four timeshigher). For irrigated cereals, returns to water, while generally positive(assuming average pumping costs of about YRIs 0.40/.3), are very substantiallylower than for vegetables or citrus. With water being the limifing resourcein these areas, the latter here are clearly more attractive than cereals.Both under spate- and well irrigation in the Tihama, it is financiallyworthwhile to devote a major proportion of irrigated land to cereals. Forcotton, financial returns to all factors are extremely poor; this has almostcertainly caused the decline in domestic cotton production.
3.10 Economic Returns. Table 3.3 below shows the estimated economicreturns of selected crops to Limiting resources.
Table 3.3: SUMMARY OF ECONOMIC RETURNS FOR SELECTED CROPS
Rainfed Rainfed Upland TihamaArea (450mm-600mm) (600mm & more) Irrigated Well Spate
Returns to Land --- YRls/ha-- - ---- -----Sorghum -354 1,022 -2,557 1,691 204Wheat -538 469 -3,288 - -Alfalfa - - -2,455 - -Onion/Tomato - 12,500 (0) 24,340/10,790 13,390 (T) 16,713 (0)Potato - 3,770 11,390 - -Cotton _ - - -40Oranges - - 20,340 - -
Returns to Labor --- ------ --- YRls/man-day -- -- -------
Sorghum 28 77 negative 65 42Wheat 16 64 -51 - -Alfalfa - - 26 - -Onion/Tomato - 192 (0) 245/150 176 (T) 188 (0)Potato - 113 156 - -Cotton - - -Oranges - - 286 -
Returns to Water------ - YRls/m ----------
Sorghum - - 0.15 0.25 0.13Wheat - - 0.10 - -Alfalfa - - 0.30 - -Onion/Tomato - - 2.41/1.28 1.10 (T) 2.19 (0)Potato - - 1.33 - -Cotton - - - 0.10Oranges - - 1.14 -
Source: Annex 1, Tables 21 and 22.
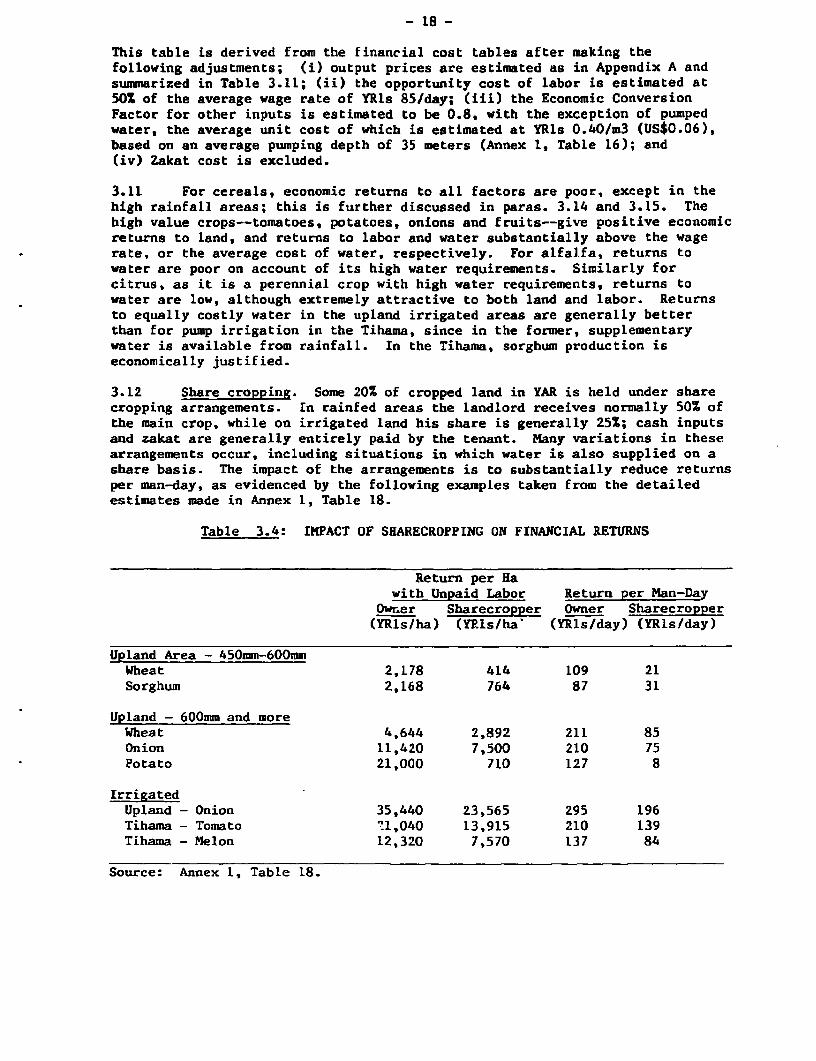
- 18 -
This table is derived from the financial cost tables after making thefollowing adjustments; (i) output prices are estimated as in Appendix A andsummarized in Table 3.11; (ii) the opportunity cost of labor is estimated at50X of the average wage rate of YTIs 85/day; (iii) the Economic ConversionFactor for other inputs is estimated to be 0.8, with the exception of pumpedwater, the average unit cost of which is estimated at YRls 0.40/m3 (US$0.06),based on an average pumping depth of 35 meters (Annex 1, Table 16); and(iv) Zakat cost is excluded.
3.11 For cereals, economic returns to all factors are poor, except in thehigh rainfall areas; this is further discussed in paras. 3.14 and 3.15. Thebigh value crops--tomatoes, potatoes, onions and fruits--give positive economicreturns to land, and returns to labor and water substantially above the wagerate, or the average cost of water, respectively. For alfalfa, returns towater are poor on account of its high water requirements. Similarly forcitrus, as it is a perennial crop with high water requirements, returns towater are low, although extremely attractive to both land and labor. Returnsto equally costly water in the upland irrigated areas are generally betterthan for pump irrigation in the Tihama, since in the former, supplementarywater is available from rainfall. In the Tihama, sorghum production iseconomically justified.
3.L2 Share cropping. Some 20Z of cropped land in YAR is held under sharecropping arrangements. In rainfed areas the landlord receives normally 50Z ofthe main crop, while on irrigated land his share is generally 25X; cash inputsand zakat are generally entirely paid by the tenant. Many variations in thesearrangements occur, including situations in which water is also supplied on ashare basis. The impact of the arrangements is to substantially reduce returnsper man-day, as evidenced by the following examples taken from the detailedestimates made in Annex 1, Table 18.
Table 3.4: IMPACT OF SHARECROPPING ON FINANCIAL RETURNS
Return per Hawith Unpaid Labor Return per Man-Day
Owner Sharecropper Owner Sharecropper(YRls/ha) (YRPus/ha' (YRIs/day) (YRis/day)
Upland Area - 450mm-600mmWheat 2,178 414 109 21Sorghum 2,168 764 87 31
Upland - 600mm and moreWheat 4,644 2,892 211 85Onion 11,420 7,500 210 75Potato 21,000 710 127 8
IrrigatedUpland - Onion 35,440 23,565 295 196Tihama - Tomato 11,040 13,915 210 139Tihama - Melon 12,320 7,570 137 84
Source: Annex 1, Table 18.

- 19 -
3.13 Generally, returns, and particularly marginal re.urns to incrementaluse of inputs, are depressed by present share cropping arrangements. This issignificantly more important with low yielding crops, e.g., wheat in themedium rainfall areas. than with profitable crops, e.g., irrigated on;ons.Indeed, the existence of share cropping arrangements in marginal uplands areasis likely to have been an important cause of the recent decline in cerealarea. On good land, the negative impact of share cropping is substantiallyless than on poor land, as evidenced by comparing the situation for wheat inlow rainfall areas with that for high rainfall zones. In the latter case,though depressed, returns to labor are still close to the wage rate, whereasin the former returns decline from YRIs 109/man-day to YRIs 21/man-day. Asthe proposed strategy is to concentrate development efforts on the good lands,the potentially negative impact of share cropping will be minimized.
B. Expansion of Wheat and Other Cereal Production
3.14 In recent years, YAR has been importing increasing quartities ofcereals (mainly wheat and wheat flour), with the present level being about400,000 tons/per year. A major issue facing Government is whether to expandcereal production substantially to eliminate these imports and if so, whatmeasures should be taken. The foregoing assessment of the potential economicreturns of cereal production, particularly wheat. indicates that under medium-rainfall conditions (less than about 500 am), returns to land and labor arelow and yield substantially less than the average economic opportunity cost oflabor per man-day. In the higher rainfall areas however, where cereals showpositive economic returns, an expansion in production is justified. Underirrigated conditions, the economics are not attractive. Returns to wateryield only about YRls 0.31m3 against an average cost of providing water from a
20-45 meter tubewell of about YRls 0.4/m3, while returns to labor are onlyYRIs 10/man-day. Clearly, under YAR conditions it is generally not advisableto use expensive irrigation water for a low output wheat crop.
3.15 However, the economics are different when wheat is to be produced forfarmers' home consumption. In that situation, the farmers' alternative toproducing wheat is to buy it at the retail price, i.e., in addition to thewholesale price in Sana'a, both transport costs and retailer's margins wouldhave to be covered. The opportunity value of wheat for home consumption isYRls 1.93/kg compared to YRIs 1.14/kg for marketed wheat. Under these circum-stances, returns to rainfed wheat in medium rainfall areas are estimated atabout YRls 71/man-day, or reasonably close to the wage rate. Given theestimated proportion of the rural population to be 80X, yet the proportion ofcereals supplied from domestic sources nearer 60X, it appears that variousrural areas are presently net cereal importers. In such cases, therefore, theeconomic value of marginal increases in production would be the value ofcereals for home consumption, i.e., at retail prices. The above estimates aresummarized in Table 3.5.

- 20 -
Table 3.5: ECONOMIC RETURNS PER MAN-DAY FOR WHEAT AND SORGHUM(YRlsIman-day)
Medium Rainfall High Rainfall Irrigated Tihama(450 mm) (650-800 mm) Upland Pumped Spate
WheatSold 16 64 -51Own Consumption 71 142 16
SorghumSold 28 77 -14 65 46Own Consumption 68 130 33 92 67
Source: Annex 1, Tables 21 and 22
3.16 Summary. The present import regime for cereals, as well as consumerpreferences, has the effect of causing finarezial prices to be significantlyhigher than economic prices, on average by a factor of at least two.Consequently, price signals are already strongly in the direction ofencouraging farmers to produce more cereals; it would be inadvisable todistort these prices further- A policy aiming for controlled expansion ofcereal (mainly sorghum) production needs to be geared to further improvedresearch, extension and input packages, with emphasis on application in highrainfall or cereal deficit areas. Any massive program designed to reduceimports substantially which would involve the use of pump irrigation for wheatproduction, is not endorsed.
C. Role of Qat
3.17 On the basis of the agricultural census, a recent study carried outby the Economic Comission for West Asia (ECWA) and field observations by themission, it is estimated that qat covers an area of 48,000 ha of good land inhigh rainfall areas and irrigated areas (Annex 1, Table 11). Qat is moreprofitable than any alternative crop; the ex-farm value of qat production in1982 is estimated at YRls 5 billion (US$1.1 billion at 1982 exchange rates)(Annex 1, Table 11). On this basis, value added at domestic prices by qatexceeds that of the rest of the agricultural sector; hence it makes a veryimportant contribution to rural incomes.
3.18 However, a view frequently expressed is to reduce the consumption andhence production of qat. The fact that qat (i) is cons'idered to have adversehealth effects; (ii) absorbs resources which could otherwise be used for importsaving or export crops; and (iii) reportedly has some undesirable social conse-quences (qat consuming mothers tend to pay less attention to the propernutrition of their children) are cited as reasons for wishing to curtail itsuse.
3.19 Economically speaking, however, qat is clearly a very attractive cropfor YAR, as it generates substantial income and employment. It is grown onsome 175,000 rural holdings, hence the income benefits from it are widespread,though not extended to the Tihama. Any major reductioa *n qat consumption(hence sales) would have a profound effect on rural incomes. Being a tree

- 21 -
crop, qat supply is quite inelastic. Marginal production costs are lowcompared with average costs, or present market prices. Consequently, ifdemand were suddenly decreased, say by restricting consumption to certaindays, the resulting oversupply would cause prices to fall sharply. In theshort run, ex farm prices would fall close to the marginal cost of production,which is perhaps 30X of the present price level, whereas, in the long run, qatproducers would switch to other remunerative crops and a new equilibrium pricewould eventually be achieved.
3.20 The table below indicates the possible impact of a 50Z reduction indemand for qat on farm incomes (such as might be brought about by restrictingconsumption to specific days per week as in the neighboring People's DemocraticRepublic of Yemen).
Table 3.6: AVERAGE FARM FAMILY INCOME PER CAPITA
Present Situation Equivalent, but with QatEstimate for Demand Reduced by 50% due
1982 to Controls
Short Run Long RunYRIs X YRIs X YRIs X
Qat Income 820 34 60 /a 4 205 lb 10Other Agric. Income 660 27 660 /c 40 825 Id 42Remittances 950 39 950 56 950 48
Total 24'30 100 1670 100 1980 100
/a 60% of present volume at 30% of present price: unit value added there-fore is 12.5Z of present unit value added (Annex 1, Table 11 shows qatvalue added is 80X of gross sales at present prices).
/b Value added assumed to be 50% of present unit level, i.e. long-runequilibrium price is 60% of 1982 price.
/c In the short run qat would not be replaced by other crops./d Assuming value added per ha of the crops which replace qat is 40% of
that of qat at present.
3.21 Short-run consumption of qat would fall lesb than long-run consump-tion, because the short-run supply price would be lower than the long termone. Nevertheless, the impact of curtailing qat consumption or average farmfamily incomes would be very large. The scenario presented in Table 3.6 showstotal income from agricultural activities (qat plus other agriculture) fallingby over 50% in the short run, and by 30% in the long run. This may bepolitically nL.icceptable, particularly if it happened at a time when remit-tances were also falling. The offsetting income eff ect, caused by lower qatprices to farm family members who are also qat consumers, would be relativelysmall on qat producing farms, but would directly make nonqat farmers and urbanqat consumers better off directly. However, the indirect effects, (caused bylower qat income and therefore lower derived demand for other goods andservices) might well offset such advantage.
3.22 Clearly the qat issue is not simple and deeper study of both thesocial and health effects, as well as of the economic and distributional

- 22 -
impact, needs to be made before firm policies can be recommended. Againstthis background it is assumed that, for the time being, Government will followa laissez-faire policy with regard to qat and that production will continue togrow in parallel with population and disposable income growth. However, inorder to be in a position to formulate a qat policy, government should furtherthe necessary researcb.
D. Food Secrity and Emproved Distribution
3.23 Complete food self-sufficiency in YAR is neither economic, nor, givennatural conditions, a reliable strategy for achieving food security objectives.The official objectives of improved dietary quality and reasonable stabilityin domestic food markets are most likely to be achieved through improvementsin the present approach. Imports should continue to provide much of basicurban food grain consumption, with local output and farm level stocksproviding for most of rural requirements. Government action should,therefore, focus on: (i) improving the reliability of the import chain;(ii) reducing any inefficiencies due to inappropriate commercial regulationsor transportation bottlenecks; (iii) contingency planning for emergencies;(iv) rationalization of existing government actions in achieving food securityobjectives; and (v) building on existing traditional food security arrange-ments in rural areas and particularly not to discourage rural food reserves.
3.24 The starting point for a concerted government program to improve foodsecurity would, therefore, focus on distribution infrastructure. Imports ofgrains are sufficiently large to justify major investments in additional bulkhandling systems for port handling, as well as internal movements. TheGovernment Grain Corporation, working with the private sector, could play arole in meeting this requirement, which would also permit better monitoring ofstock levels in urban markets, and hence, dampen speculative price movements.Following the growth in demand and modernization of transport, congestion inYAR's traditional markets has become a serious problem which affects the totalnational marketing system. Consequently, another major priority is improve-ments in urban and central village wholesale markets.
3.25 In parallel with a joint government-private sector investment program,commercial practices could be improv-ed. The present system for awardingimport contracts of strategic commodities and the pricing of their domesticsale provides little incentive for greater efficiency. In particular, ratherthan fixing profit levels and allocating quantities, Government shouldgradually move to a competitive and less controlled system. Commercialpractices would also benefit from better information, standardization ofcontracts and grades as well as less erratic government interventions (e.g.unexpected changes in Government commodity sales or foreign exchangecontrols). The aim would be to reduce the risks of doing business whichwould, in turn, lower transaction costs. Efforts in this direction should beorganized through private merchants controlled by the Chamber of Commerce,which collaborates with Government on policies. This approach should beextended to include improvements on production, stock and price information.More timely and credible information would assist to reduce price instability,protect farmer and consumer interests and prevent market manipulation.
3.26 A major imperfection in the marketing of agricultural produce stemsfrom the organization of domestic freight transport. Ownership and use oflarge trucks is restricted to a cartel of trucking operators. Prices arefixed by the cartel, as is the assignment of freight contracts through a

- 23 -
government transport office. As a consequence, agricultural produce is ofteninefficiently transported in pick-ups outside the cartel, farmers areill-served and food security reduced. This is particularly regrettablebecause, as a result of the many micro climates in YAR, different regions aremajor fruit and vegetable producers at different times of year. For example,in the early spring most vegetables need to be produced in the Tihama, whereasthe major consumption centers are Sana'a and Taiz, several hundred kilometersaway. The transport of such produce would certainly be more cost effective bymedium or large truck rather than by pickup.
3.27 Improvement of the wholesale marketing infrastructure in line withongoing changes in the patterns of consumption is essential. Agreementsregarding financing and operating these would need to be worked out betweenGovernment and the private sector. The urban markets for meat and freshfruits or vegetables are likely to be increasingly important. For importedmeat to be handled cheaply and effectively, chilled or frozen storagefacilities need to be developed at both the wholesale and retail levels.Importing live animals and slaughtering these locally, as is the presentpractice, is an extremely expensive way to supply meat, whereas the domesticpreference for freshly slaughtered meat (which probably results from previoustimes when refrigeration was unavailable) can be expected to diminish overtime.
3.28 The proposed policy to rapidly expand fruit and vegetable production,means that the marketing chain needs to be geared towards urban marketsreceiving produce from domestic supply sources, rather than from imports. Toaccommodate this shift in supply source, wholesale markets capable of handlinglarge supplies inwards and outwards need to be developed in the urban areas(see also para 4.12). A study, funded under the second Tihama Project (Credit805-YAR), has been commissioned to examine fruit and vegetable marketing indetail and its findings should provide the basis for improvements in this area.
E. input Supply
3.29 Limited availability of inputs is a major constraint to successfulagricultural development in YAR. Examples of shortages include potassic andphosphate fertilizers, seeds, particularly of proven vegetable varieties,disease-free nursery stocks, as well as various agrochemicals and medicines.Given the relative strength of the private sector, yet constrained governmentresources and skills in commercial operations, input supply problems relatingto agro-chemicals need solving through private sector initiatives. It isrecommended that MAF determine approximate import requirements and grantsimport licenses only to low-bidding importers, who will be entitled to fixedmargins when selling to wholesalers. The policies of providing free, orsubsidized inputs, to some projects or of para-statal corporations, e.g., theMilitary Economic Corporation (MECO), heavily subsidizing transport, arecounterproductive as competitive traders are discouraged from entering themarket_ In general terms, government policy should be to encourage andfacilitate private trade in input supply. With respect to seed production,however, Government's capacity needs substantial strengthening. Due to largeclimatic variations in YAR, a multitude of variaties is required for manycrops (particularly cereals), thus rendering private seed productionunattractive.
3.30 Farm Machinery, The free market for imports of tractors has led tomany different makes being available in YAR, often unmatched by effective

- 24 -
parts and service facilities. Furthermore, the size of imported tractors inmany cases has been inappropriate, causing comparatively high operatingcosts. Some countries have successfully overcome this problem by limitingimports to four or five approved makes and models. For tractors to be on theapproved list, specific models must have been tested and found suitable forlocal conditions. In addition, a competent service agency with skilledpersonnel and adequate stocks of parts would need to be established. In thisway, it is possible to strike a reasonable balance between competition on theone hand and good back-up service on the other. It would be worthwhile forYAR giving consideration to take such an approach.
F. Credit
3.31 The Cooperative and Agricultural Credit Bank (CACB), presentlyassisted under IDA Credit 1308-YAR, is practically the only source ofinstitutional credit for agricultural development. Loans disbursed increasedfrom YRls 50 million (1979-80) to YRls 140 million in 1983. Investments infarm machinery and on-farm irrigation (mostly pumpsets) absorbed about 70% ofmedium- and long-term loans, followed by poultry projects (14%) and landimprovement works (10%).
3.32 Although lending increased substantially during the last three years,CACB's capacity to maintain this trend is not certain. The major constraintsare: (i) difficulties in loan collection; (ii) shortage of trained manpower;and (iii) lack of coordination between credit and extension. Though CACB'smanagement feels a shortage of lending funds might become a problem, actionto enhance the viability of the credit system clearly should be a preconditionfor the expansion of its resources. In the event existing funds becomeinadequate, CACB should be encouraged to mobilize more of its resourceslocally, so as to reduce the need for reliance on Government funds.
3.34 CACB has not been able to collect a substantial portion of itsmatured loans in recent years. The collection rate dropped from 80%-90% inthe late 1970s to 49% in 1981. It improved to 60% in 1982. but again slippedback to 52% in 1983. This resulted partly from drought, which affectedcertain parts of the country in 1981 and 1983, but other factors also may havecontributed to high overdues. If this situation continues, the image of CACBas a scund financial institution would be damaged, and its efforts at depositmobilization be defeated. An early study of the overdues problem by CACB istherefore recommended to determine the causes of low recovery rate, and todevise suitable remedial measures. Meanwhile CACB should be pressed to takeactive steps to reduce its overdues. It would also benefit from higherinterest rates as this would improve the incentive for borrowers to repaypromptly.
3.34 Nonavailability of adequate numbers of qualified and trained staff toman the bank offices is a serious management problem. Nearly one-third of theexisting CACB staff in 1982 had no previous experience or training in agricul-tural credit. Many of CACB's existing offices are reported to be managed bypersons who are not adequately conversant with the bank's policies andprocedures, and are thus unable to function effectively. The shortage oftrained staff has been a major obstacle to the bank's efforts to extend itsoperations to new areas. The IDA-assisted Agricultural Credit Projectprovides for intensive staff training, but so far no action has been taken toimplement the program.

- 25 -
3.35 Another major factor which affects the effectiveness of institutionalcredit, as well as its expansion, is the lack of meaningful contact betweenagricultural extension staff and the CACB personnel. In the areas outside theexternally financed projects, MAF has limited extension staff, and in manycases these are not in a position to provide technical assistance to CACBborrowers. Even in project areas where a reasonably efficient extensionservice is in operation, hardly any coordination between the extension andcredit staff exists. As a result, the bank's borrowers are deprived oftechnical assistance, and project objectives of maximizing agriculturalproduction are in jeopardy. As a first step toward effective linkage ofcredit with extension, CACB and the management of the externally assistedprojects should jointly prepare a work procedure which would ensurecoordination between the two services; its implementation should be closelymonitored.
3.36 Participation of Commercial Banks. The involvement of commercialbanks in financing investment in agriculture has been minimal. Apart fromlack of expertise, the main restraining factor appears to have been theunfavorable interest rate structure. CBY has fixed the minimum interest rateon one-year deposits at 12Z, while the maximunm interest rate on loans ispegged at 15% (inflation rate is presently 15X p.a.). The margin available isconsidered by them inadequate to cover operational and risk costs. Theshort-term deposits (up to three months) carrying lower interest rates havelow turnover and could be used for agricultural lending, but the banks fearthat, if deposit rates are raised during the life of the loans, they may incurloss. Thus, a situation prevails where commercial banks have large surplusfunds, but are unwilling to use these for financing much needed investment inagriculture. Commercial banks should be encouraged into agricultural bankingby offering them greater incentives by increasing agricultural interest ratesand spreads and by excluding deposits equal to outstanding agricultural loansfrom the operation of the statutory reserve requirement. Both measures shouldbe considered by Government and the CBY.
G. Research
3.37 Research at the national level started in 1973 with FAO/UNDPassistance and is presently organized under the IDA-assisted AgriculturalResearch and Development Project (Cr. 1259-YAR). Research at the local levelis being undertaken by a large number of agencies and donor countries (e.g.USAID, IFAD, West Germany, UK, China, Japan, Netherlands) as well as byGovernment itself. Although under the IDA-assisted national research project,an Agricultural Research and Development Authority (ARA) was established tocoordinate, inter alia, all applied research in YAR, this has proved difficultto achieve. ARA has been in existence for about one year, and has made somenotable advances in integrating various research activities into the nationalprogram. Nevertheless, much remains to be done to increase efficient use ofvery scarce resources. An acute problem, which needs early resolution, is tomaintain funding under ARA, once bilateral research projects are terminated.The further integration of various research efforts should be of highpriority, not only for ARA, but also in meetings of the UNDP-chaired localdonor consultative group.
3.38 As to the IDA-assisted national project, it is difficult to determinewhether its internal resource allocation is consistent with economicpriorities. Aligning the two is no easy task, but it is recommended thatfuture work programming and resource allocation should be justified, whenever
- 26 -
possible, on the basis of estimates of their perceived economic importance.This would require an analysis of crop production by climatic zones, deEiningtheir economic importance and identifying which researcht activities would havethe potential to achieve maximum econumnic impact for large numbers of pro-ducers. Such task would not only call for a much more successful partnershipof research and economic analysis, but would also require close collaborationwith senior extension personnel. It is recommended that, when monitoring thisproject (at three year intervals), considerable attention be given todetermine the economic impact of research on economic sector performance.
3.39 As to the details of the national research program, the followingrecommendations are made. First, while breeding trials are still predominant,the number of agronomic and verification trials should be considerably expandedand, to save researchers' time, maximum use should be made of extensionpersonnel in site selection for verification trials, as well as in themonitoring and evaluation of these. Second, it is considered that thegreatest potential for sector development in the medium-term lies in rapidlyexpanding fruit and vegetable production. Presently, the supply of vegetableseed and plant material (domestic and imported) cannot support such rapidexpansion, either qualitatively or quantitatively. It is important, therefore,that the regulatory role of national research concerning the production andquality control of plant material be clearly determined. Third, as both laborand water in YAR are expensive factors of production, it is recommended thatapplied research on increasing on-farm irrigation efficiency, as well as ontesting farm machinery suited to YAR's particular conditions, be substantiallyincreased. Fourth, regulations for the importation, distribution and use ofpesticides should be formulated and enacted into law as the prolificacy ofthese materials poses increasingly serious health hazards.
H. Extension
3.40 YAR has no national extension service; all extension activities arecarried out within projects or groups of projects (e.g. the Tihama and SURDPprojects). An issue often mentioned is whether or not to integrate all ormost existing activities within a national service. The present situation isthe result of an incremental project-based development approach adopted forTAR, where central management capacity was virtually nonexisting. Generally,the approach has proven to be satisfactory. PPAR's of the two completed IDAprojects (Ti ama I and SURDP I) indicate that though the numbers of extensionagents and .. oervisors were less than estimated at appraisal (often because ofinadequate remuneration), project achievements, by and large, reachedappraisal estimates and exceeded these for input volumes and credit amounts.
3.41 The weakness of the present situation is that it leads to fairlyinefficient linkages between extension and research, particularly where localproject managers have established themselves as strong leaders, or controllocal project-related research activities. The advantages of establishing anational service at this stage are, however not self-evident. First, centralmanagement capacity in MAF is still modest. Second, more than half of theareas receiving 600mm rain and above as well as the irrigated areas, areincluded in on-going and planned IDA projects. Assuming another one-quarterof similar areas being covered by projects of other donor agencies, andconsidering the problem of recruiting and retaining personnel, especially ifhired directly by MAF, there appears to be no good reason to start a nationalservice now. However, as an intermediate step towards ultimate nationalintegration, it is recommended that MAF starts integrating existing project-based extension into regional services (e.g., as already proposed for the

- 27 -
Tihama). Simultaneously, MAF should start coordinating the activities of suchregional services at the center to ensure unity of purpose and execution; TAsupport should be provided toward this end.
3.42 Rationalizing the basic salary structure of extension staff will beone of the main issues while integrating p'.oject-based services, as presently,serious discrepancies prevail due to differing policies in different projectsand locations. Government will have to establish an equitable salary structure,including allowances, if the ongoing loss of experienced extension agents fromthe service is to be stemmed. Also, MAF :eeds to give more attention toproper selection and training of extension agents as, especially in YAR, theseare often the sole Government representatives in rural areas.
3.43 The integration of existing project-based extension services intoregional ones should not burden the recurrent budget of the Government, hence,it should be based on consoLidation of present facilities, better use ofstaff, new extension methodology for mass media comnunication and wideradoption of the farmers' leaders concept. These efforts may result inregrouping of block and extension centers, and in assigning experienced agentsfor high-priority objectives, e.g., supporting fruit and vegetableproduction. Expansion of extension services into new areas would, of course,call for additional expenditures.
3.44 When project-based extension personnel has worked for, say, five ormore years in an area, it can be assumed that most farmers in a position toadopt extension packages would have done so. In such instances, the marginalutility of extension work could be improved by decreasing the extensionworker/farmers ratio and transferring gradually part of the service to newagricultural areas with high potential but low extension coverage. This may,however, not be possible in the case of extension agents who are local personsand in cases where continued intensive extension remains essential.
3.45 The overall sector strategy advocated in this paper, i.e. focussingpublic investment for agriculture to support directly productive activities,especially fruit and vegetable production, calls for relatively specializedextension activities. As suitable personnel is scarce, it follows that such astrategy can only work if fruit and vegetable production is promoted andsupported in only a small number of highly suitable areas, thus ensuringmaximum impact from a limited supply of specialized extension advice.
3.46 The present situation in which various aid agencies often provideidentical inputs and services on different terms will make a future integra-tion of local extension services extremely difficult. It is recommended,therefore, that the establishment of clear and uniform practices in this areabe initiated by MAF and the local donor consultative group in YAR. Also,procedures being introduced under various bilateral projects (e.g., German andDutch) of having farmers pay for specific extension services (e.g.horticultural assistance) should be carefully studied and their applicationelsewhere should be considered in order to keep recurrent costs down.
3.47 A recent IDA survey established that the impact of the all-maleextension service on production decisions made by women is very small. As theproportion of farms managed by women is high, it is essential that seriousefforts be made to start training adequate numbers of women for extensiontasks. Female extension activities should be planned for in an early phase ofproject formulation, when an assessment should be made of the contribution of
- 28 -
men and women to agriculture production in the project area. Such an assess-ment should be based on variables such as age, marital status and absence/presence of men. Based on such information, project design should reflect thetargeting of extension packages to relevant beneficiaries.
1. Agricultural Education, Training and Technical Assistance
3.48 Agriculture Education and Training. Effective manpower developmentcontinues to be a major constraint to sector development. Government stillrelies heavily on expatriate staff, not only for the implementation oE majorinvestment projects, but also for managing many of the sapport services.Gradual replacement of such staff by newly trained Yemenis, as anticipated inthe earlier national plans, has not taken place. Hence, as the performancelevel of Yemeni staff is comparatively modest, the need for expatriate staffcontinues.
3.49 Prospects for rapid improvement are poor. Drop-out rates for YARagricultural students studying abroad are estimated at more than 70%, mainlyon account of changes in fields of study, failure to pass exams or seekingjobs elsewhere. Even more significantly, of the 800 agricultural studentssent abroad between 1974 and 1981, only 80, or 10% were employed by MAF. Nodata are available on those who have been employed in the private sector orunder bilaterally financed activities, but it would be unlikely that more than25% of those sent abroad are actively employed in the sector. This wastage iscaused by; (i) weak selection procedures; (ii) no enforcement of theobligation to undertake Government zcrvice upon return; and (iii) unfavorableremuneration and often adverse work conditions. Obviously, these constraintscan only be relaxed by profound changes in present procedures and will takeconsiderable time to implement. A recent improvement has been theestablishment in 1984 of an agricultural faculty (initial enrollment 16students) in the University of Sana'a.
3.50 At the technician level, medium-term demand is projected for about800 additional positions, mostly for extension personnel. Output from thevarious vocational schools, which suffer from poor facilities as well asunderfunding and ill-defined curricula, could at most provide half of these.Considerable deficits are also projected for medium level support staff, suchas laboratory technicians, veterinary assistants, bookkeepers and stockclerks, for which local training opportunities are equally limited.
3.51 It is essential for MAF to establish (with expatriate assistance) atraining unit to coordinate manpower and training needs at project, regionaland national levels. It should determine, on a rolling basis, MAF's mediumand long-term training needs and plan how these can be reasonably met through(a) project-based training and (b) free-standing training programs.
3.52 Additional recommendations concerning training of Yemenis are asfollows:
(i) Fellowships under IDA-assisted projects should Eocus on trainingneeds not being addressed under the general fellowship program;
(ii) Foreign language training needed for training abroad and toensure effectiveness of proposed on-the-job training should beidentified and provided under TA, as necessary;

- 29 -
(iii) All potential or actual Yemeni managers should receivemanagement training to complement whatever backstopping they mayreceive from expatriates. For this purpose, the activities ofthe National Institute for Public Administration (NIPA) shouldbe extended; and
(iv) For on-the-job training to be meaningful, organized trainingsessions should be conducted by trainers early in the workday(8-10 a.m.) in an organized fashion. This will maximize use ofthe training program, ensure complete freedom from officedisruptions, and give a measure of job security to the trainee.
3.52 Technical Assistance. In spite of the extensive technical assistanceprovided to the sector (IDA alone provided more than 500 man-years in theperiod 1972-'83), technical and managerial capability in the Ministry ofAgriculture is still markedly undeveloped. The main reasons for this are;(i) insufficiei.t suitable or motivated Yemenis available to train; (ii) lackof continuity due to counterparts leaving or being reassigned; and(iii) expatriate experts frequently do not have the necessary background, orare not always adequately motivated, to train Yemenis to take over. Theappointment of large groups of expatriates to work as a team appears tomilitate against dialogue on a one-to-one basis, which is a necessaryingredient of effective staff training. Indeed, an important issue is theabsorption of the large amount of TA being provided. The present environmentin which the possibility exists for indefinite renewal of expatriate staffcontracts, also acts as a disincentive to training Yemeni replacements. Afurther factor is the failure of many expatriates to communicate effectivelywith Yemeni staff, because of either language or cultural reasons. Whiledelays in recruitment of expatriates are comnon, these are not perceived ashaving the same relative adverse impact on institutional development as theother factors mentioned.
3.53 The basic issues in accelerating the pace at which local institu-tional capability can be developed relate to, (i) striking an appropriatebalance between the operational tasks and training role of expatriates, and(ii) the priority given to Yemenization. Given priority attention byGovernment, Yemeni managers and aid agencies, the pace of Yemenization couldbe greatly accelerated. Such priority is crucial, and should be reflected inproject design, because for medium- and long-term development, trained Yemenimanpower will be essential. For this priority to be properly addressed, MAFmanagement needs to be strengthened in order to define TA functions, as wellas enforce accountability in their execution. The IDA-executed, UNDP financedInstitutional Support Project is an important step in that direction. Forthis project to become truly effective, it should thoroughly review, and amendas necessary, the organization, functions and responsibilities of MAF.
3.54 Specific recommendations concerning the design and delivery of TA areas follows: (i) Expatriate's Terms of Reference for institutional TA shouldindicate that training and backstopping of Yemeni staff is their primaryfunction and that the performance in this respect will be monitored regularly;(ii) formulation of TA proposals should reflect not only government commitment,but also include participation and agreement of those who will be involved inimplementation, and/or, who will be recipients of the TA, and (iii) for TAdirected towards institutional support and particularly on-the-job training,expatriates should be located and work directly with their counterpartnational staff rather than as separate teams.

- 30 -
IV. PROPOSED STRATEGY
A. Strategy.
4.01 The main macro-economic assumptions underlying the proposedagricultural strategy for the next five years are as follows: (i) investmentfunds and recurrent cost allocations will remain constrained; (ii) as a resultof the leveling-off of workers' remittances and the rapid natural increase inthe domestic labor force, real wages are expected to decline somewhat; and(iii) Government will continue to implement a realistic foreign exchangepolicy.
4.02 The proposed strategy for agricultural development in YAR shouldreflect the lack of resources and aim for expansion of production of thosecommodities which can be produced profitably for the domestic market. Becauseof a relatively high cost structure (expensive and limited water, costlyinputs which virtually all have to be imported and a high wage rate), yet lowproductivity in a range of crops, YAR should be looking for agriculturalgrowth of those products which are bulky or perishable and thus difficult toimport, or those for which a strong local preference exists. Excluding qat,the best potential for growth appears to be in fruits and vegetables. The aimshould be to increase production of fruit and vegetable crops through improvedtechnical packages as well as expansion in area. In view of the rapidpopulation growth, measures which have helped to increase cereal yields in theareas of high rainfall should be vigorously contined. Indeed because of YAR'slimited agricultural potential, the effective functioning of research andextension is of the greatest importance. Given the relative strength of theprivate sector and the lack of government resources, government activitiesshould be confined to providing those necessary support services and suchenvironment which would allow agriculture to function well, and which wouldensure reasonable competition among private sector suppliers and marketingagencies. Agricultural development should be confined to those areas andactivities where sound economic returns can be expected.
B. Production
X 03 With regard to production, YAR agriculture strategy should aim atgrowth, while respecting the economic viability of the subsectors to beexpanded. The factors limiting expansion vary with the different types ofproduct. Fruits and vegetables, which are economically profitable, even atrelatively high costs of pumped water, should be expanded to the limit of thedomestic market. This market could be expected to grow substantially from itspresent level due to: (i) population growth; and (ii) supplying certain fruitsand vegetables at times of the year during which these are presently notavailable. Overall domestic demand would probably grow by about 5S per year,and the opportunity exists for domestic production to fulfill both thisincrease in demand, as well as to substitute for about US$80 million worth ofimports (1982). In summary, there is scope for fruit and vegetable productionto be doubled over the next ten years (Annex 1, Table 16). Assuming half theincrease would be achieved through better yields on existing areas and halffrom new plantings, an additional 10,000 ha would need to be planted toirrigated fruits o-nd vegetables over that period, a modest increase comparedto the total presently irrigated area of 120,000 ha.

- 11 -
4.04 The strategy for development of cereal production should be acautious one, respecting the economics of production and resource constraints.The opportunities for expanding the area under cereals appear limited. Hence,the strategy should be to concentrate on increasing productivity in the mediumto high rainfall areas through improved input packages, and be aimed particu-larly at those rural areas which experience a cereal deficit. rn the lowrainfall areas (below 450 mm), cereal production is marginal and risky, whileunder most pump irrigation conditions, unit water costs are too high forcereal production to be worthwhile at economic prices (para. 3.16). Massiveprograms designed to reduce cereal imports substantially, and which wouldinvolve the use of pump irrigation for wheat production, are not endorsed.Subject to these principles, efforts should be made to increase cerealproduction so as to contain, as much as possible, the dependence on importswhich constitute a substantial drain on scarce foreign exchange resources(about US$80 million in 1984). Overall, potential for cereal productiongrowth is quite limited, and is estimated to be about 1.22 per annum (Annex 1,Table 15). Hence, continued imports would be required to meet urban(commercial) demand. Imports are expected to increase by about 35S over thenext five years. Consequently, it is vitally important for Government tofocus on appropriate food import policies and procedures (para. 4.L2).
4.05 Opportunities for livestock growth are limited. Ruminants in YAR arebasically utilizers of by-products, thus their production will be constrainedby the growth of these. Growing irrigated forage directly for livestockproduction is uneconomic and should not be part of the agricultural productionstrategy. Substantial production increases in the poultry industry havealready taken place, as domestic broiler production is financially quiteprofitable. However, this is mainly due to the real preferences which Yemeniconsumers have for live chickens compared to imported frozen product (livechickens sell at about twice the price of frozen ones). Aq this tastedifferential is likely to erode over time, the advantages of domesticproduction can be expected to diminish. Meanwhile, however, Government shouldcontinue to improve its extension advice for commercial broiler producers.
4.06 The appropriate production strategy for qat is rather problematic.On the one hand, qat production has a very strong positive effect on ruralincomes which, given the urban/rural income disparities, is desirable. On theother hand, it appears that qat may have negative effects on adult productivityand health, as well as the welfare of children. Furthermore, qat is beingproduced on the better land, some of which could be used for profitableirrigated crops, such as grapes, or perhaps coffee. It is quite possible thatqat production will no longer expand, since the market could be close tosaturation. If so, the incremental production which will result frompresently inmature plantings may be sufficient to depress prices and,consequently, stem expansion of production in the medium term. Governmentintervention in qat production and consumption should only be considered afterhaving assessed the likely consequences of such intervention (para. 3.22), andrealistic alternatives to its production.
4.07 Overall Sector Growth Potential. On the basis of the discussion inthe preceding paragraphs, the overall potential for growth in the agriculturalsector appears to be relatively limited. Even with good levels of uptake ofresearch packages and adequate growth of support functions such as marketing,sector growth is unlikely to do more than keep up with the aggregate growth indemand for food. The table below provides estimates of potential, non-qat,agricultural growth over the next decade for major commodities, as well as forthe sector as a whole.

- 32 -
Taule 4.1: AGRICULTURAL SECTOR GROWTH POTENTIAL 1985-L995
S Value Added Estimated(excl. qat) Growth Potential1985 1995 (% p.a.)
Cereals 40 30 1.2Fruits 12 21 10.0Vegetables 27 32 6.0Livestock 17 14 1.5Other 4 3 2.0
Totals 100 100 3.2
Source: Annex 1. Tables 15 and 17
C. Policies
4.08 Price Support. Any attempts by Government to introduce a pricesupport system to stimulate domestic production should be stronglydiscouraged. Perhaps 80X of cereal production in YAR is Eor on-farmconsumption, hence, price increases would have very little impact as anincentive. At any rate, domestic prices are already more than double importparity levels. Price support for perishable fruits and vegetables is clearlynot practicable, and also not needed, as YAR production is alreadyconsiderably protected by the import regime (ban on fruit imports), the veryperishability of the produce itself, and, in some cases, consumer preference.Price support for potatoes is also not required, as present prices areremunerative and have generated a significant increase in output in recentyears. Reviving coffee and cotton production, which has become quiteinsignificant over the past decade, would be impractical, as the formercompetes directly with much more profitable qat for the same type of land,whereas the latter has become generally unprofitable (in both economic andfinancial terms) on account of high labor costs.
4.09 Subsidies. MTough water charges cover capital and O&M costs, waterin large public spate schemes is subsidized in so far as the charges do notinclude interest. A review of present policies and collection procedures is,therefore, recommended. Also, Government should effectively enforce itspolicy to recover water charges as a surcharge on Zakat without further delay(para. 2.26). For pumped water, there are no licensing fees or othermechanisms to account for its scarcity value, and it is recommended thatGovernment consider initiating a licensing system for tubewells, if the riskof overexploitation of groundwater is to be avoided. Nursery stock isgenerally made available free, or on below-cost basis, and it is recommendedthat, as in several bilateral projects, prices be gradually raised to coverproduction cost. Next to water, fertilizer is by far the most efficient meansto increase productivity. The policy here should be towards making availablea variety of complementary fertilizers (potassium, phosphorus and compoundfertilizers). without which the present nitrogen fertilizers are becomingincreasingly inefficient. It is recommended that Government determinesapproximate import requirements, and grants import licenses only tolow-bidding importers who will be entitled to fixed margins when selling to

- 33 -
wholesalers. Fertilizer coming to the country as bilateral assistance shouldbe made available to wholesalers at import parity price, in order not todisturb the orderly development of the input supply chain.
4.10 It is reco-mended that Government take measures to more effectivelyapply the existing excise tax on qat, as its present yield falls considerablyshort of its potential. Government revenue could also be further enhancedthrough rational user charges. The practice of subsidizing inputs undercertain projects, while not in other situations, is distortionary and unfair.
4.11 A policy of introducing bilateral aid items into the marketing systemat normal prices would have the advantage of providing government revenue, aswell as being equitable to farmers. Other government services or inputs thatare currently provided at low cost or free, but which could and should becharged for in order to provide funds for operation and maintenance, includeveterinary services and water on spate irrigation schemes.
4.12 Food security and Distribution. The aim of government strategyshould be to continue the process of strengthening the food distributionsystn- Ip-portad food grains should provide the basis of food security forcommercial urban consumption. In the countryside, locally held on-farm stocksshould be relied upon, calling for regular monitoring of these. Commercialregulations governing the management of imports and domestic freight marketsshould be adjusted in order to increase competition, efficiency and-flexibility. A joint government/private sector initiative is required toprovide a framework of consumer-oriented grades for foods that would helpimprove nutritional quality, as well as impose price information.Furthermore, a pressing need exists to consolidate the work of the fourdifferent government companies involved with strategic food imports, as wellas the Ministries of Supply (which handles food grains), Industry (responsiblefor feeds), and Transportation (implements internal transport controls andport investments). A central focus for government involvement in fooddistribution would faciliate cooperation with the private sector and betterstandby capacity to deal with emergencies. A major program of publicinvestments will be required to improve distribution infrastructure,including: (i) bulk handling of all imported and domestically distributedfood and feed grains (which can be expected to have a high economic rate ofreturn, as well as increase food security); and (ii) modern wholesale marketand storage facilities for perishable foods to be operated by the privatesector (details about construction, financing and ownership should be workedout in concert with the private sector).
4.13 Water Resources. The availability of water is by far the greatestconstraint in YAR sector development. Information about water resources isbetter than a decade ago, and a regional water resources study for the entireTihama Region is presently under way. Similar studies should be carried outin other hydrological regions of YAR, in addition to ongoing work in certainregions of the country for municipal and industrial water (para. 2.14). Thisshould eventually lead to the formulation of a water master plan for the
- 34 -
country. Until such time, development plans should focus on low costirrigation works including those for water conservation and on watermanagement by increasing system efficiency. Expansion of irrigation shouldonly proceed when and where the availability of water is confirmed on thebasis of detailed investigations. It is recommended that in areas where waterdevelopment agencies already exist (Tihama, Sanaa basin), a licensing systembe developed and enforced regarding the drilling of new private wells.
D. Implementation
4.14 The role of the Ministry of Agriculture should be an enabling one.It should focus on establishing an environment in which the private sector canoperate effectively and concentrate on those activities which cannot be easilyhandled by the YAR private sector. These include: (i) provision of marketinformation; (ii) supervision of quality of agricultural inputs, particularlyseeds and nursery stock, etc.; (iii) assist in coordinating the efforts of themany different donors in a rationrtl way; and (iv) setting up procedures toinsure that adequate quantities and suitable types of inputs are imported,e.g., fertilizers and farm machinery. MAF should also be strengthened,through TA over an extended period, in it_ role of coordinating research,extension, as well as in planning, monitoring and implementation of agricul-tural programs and projects, their subsequent operation and maintenance, andinitiating much needed agricultural legislation. Considering the verysubstantial need for public administrative reform, TA tasks should really belimited to what MAF can effectively manage.
4.15 Donor Coordination. As a large proportion of sector developmenttakes place under foreign assistance programs, it is necessary that strategyimplementation be coordinated, to the extent possible, by the various donors.The UNDP Resident Representative in Sana'a has takun the laudable initiativeto establish a locally organized donor consultative group. This group is tomeet regularly, mostly on a sector-by-sector basis, and would be a suitableforum to discuss agricultural strategy and coordinate donor implementation.
E. Future Investment Program
4.16 Government has indicated to the mission that it intends the new FYPfor the sector (1986-92) to reflect, to the extent possible, therecommendations made here. The main recommendations of this paper were,accordingly, thoroughly discussed with both the Ministry of Agriculture andthe Central Plan Organization to ensure the necessary integration of thenational sector plan, IDA activities and those of other donors. Given theproposed strategy for production and the shortage of government resources,project design should take into account the need for projects to be largelyself-financing in the long run. This militates against multicomponentdevelopment projects in areas without good production potential, as these areexpensive, not only in terms of recurrent cost, but which also place a heavydewand on the small pool of skilled staff. On the other hand, support isrecommended for regional projects with a special focus on production supportservices such as extension, based on past institution-building efforts

- 35 -
(as under the Tihama and SURDP projects). Low-cost spate irrigation projectsin the Tihama appear to show good returns, and should be pursued, providedthat they can become self-funding, i.e., that adequate water charges can belevied to cover operating and maintenance costs as a minimum. In otherregions, development projects with a specific production orientation, e.g.support to production of fruits and vegetables, of cereals in high rainfallareas, could be undertaken.
4.17 Most production investment is expected to come from the privatesector, and an expansion of CACB loan funds should be necessary. MAF'scapacity to plan, implement and coordinate its main functions needsconsiderable strengthening over an extended period of time. MAF should decideon priority areas and, next to the IDA-executed, UNDP-financed InstitutionalSupport Project, substantial additional TA should be provided as part offuture projects. Other projects which are consistent with the strategyproposed here would include: (i) bulk handling facilities for imported foodand Eeed grains; (ii) modern wholesale market and storage facilities forperishables to be operated by private merchants; (iii) support towardestablishing a national operation and maintenance capability for completedagricultural projects (see following paragraph); (iv) integration ofproject-based extension services initially into regional services (as alreadyproposed for the Tihama region); (v) implementation of water conservationmeasures and increasing irrigation efficiency in areas already underirrigation; and (vi) preparation of a master plan for the integrateddevelopment of water resources in the country.
4.18 While these are important elements of agricultural strategy for whichprovision in the Second Five-Year Plan would be justified, it is alsonecessary to consider whether some of these issues and tasks should not betackled on the basis or a country-wide approach, drawing on the experiencegained, and institution-building achieved, through the past and on-goingefforts made under the series of TIKAMA and SURDU projects and other aredevelopment, research and credit projects. There was, undoubtedly, a need inthe early phases of development to proceed on the basis of specific programsfcr limited areas, but a stage is now being reached where it would bewcrthwhile to review the situation and the strategy in an integrated,country-wide perspective. Illustrative of this approach is the on-goingprogram for institutional strengthening of the Cooperative and AgriculturalCredit Bank, in various aspects such as accounting, lending policies andprocedures and data processing with modern techniques including the use ofcomputers, alongside the provision of funds for on-lending through theAgricultural Credit project. As is already proposed, donors should assistGovernment in reviewing the agricultural aspects of the national plan and, onthe basis of past project experience and various studies carried out under thedifferent projects and with reference to the physical and institutionalconstraints affecting the sector, determine the appropriate courses of futureaction in the fields of water resource development, maintenance, agriculturalextension and research, marketing of agricultural produce, training foragricultural staff, and strengthening the Agriculture Ministry so as to enableit to fulfill adequately the planning and leadership functions for thesector. It is on the basis of a careful exploration of these critical areasfrom the point of view of the development of tue sector and with reference tothe emerging pattern and priorities of investment in the sector, thatGoverrment should decide on the most effective means through which it canextend further support the development of the sector.

- 36 -
4.19 Operation and maintenance. In order to ensure continuity afterproject completion and efficient use of resources, particularly skilledmanpower, the operation and maintenance of individual irrigation projectsshould be coordinated at the national level. It is recommended to establishfor this purpose a specialized unit in MAU, with regional branches in theareas where public schemes are concentrated. Upon completion of individualschemes, appropriate equipment and personnel should be transformed to this neworganization. As skills are scarce, substantial technical assistance wouldhave to be provided during the initial stage.

YEMEN ARAB REPIJILIC
AGRICULTURAL SIATFnY PAPEO
TotaI Crampd Area 1liAd hat
rear 11211Z 97271 1971D4 174S1 197fi 111761 hUh 13211 1322 L i nu i2n
CerealsSarghum L Millet 140 520 S70 1,056 1,060 782 644 663 673 61 697 66S 6B9Maize 10 24 25 23 24 s0 31 31 11 31 34 36 36wheat 30 59 as 60 60 6S 60 66 62 63 66 *1 61Barley -2 -A -O -Z .U 41 41 _1 4 42 _U _ ii
Total Cereals 977 1.039 1,033 1,196 1,167 924 763 826 al2 *22 549 836 636
Indistrlal CropsTobacco 4 4 4 4 5 5 6 6 6 6 6 6 6Cotton 1i go 2_ 2A 15 _6 _ A 1 _1 _1 21 _
Total Industrlil Crops 19 24 24 32 20 II 11 12 9 11 11 13 131
Other Annual CropsOry Letiues 60 60 65 71 76 72 76 74 72 75 74 70 70 .jSesame 4 a a 9 10 IC 10 to t0 la 10 la toePotatoes 5 6 6 6 7 9 9 10 II 11 11 12 12vegetables is 16 16 la 20 22 24 27 26 27 29 30 34lerseem (fodderl -1 _1 -3 __| - _1 __1- __-1 __1 4 -A . .
Total Othler Annual Crop 91 93 9B 107 116 116 122 124 1213 127 12B 126 130
TOTAL ANNUAL CROPS 1,057 1,156 1.160 1,335 1,103 1.051 916 962 944 960 9S4 97S gig
Tree Crops - FoodFruIts S 10 10 12 12 13 14 14 14 14 IS Is ISGrapes 7 a a 9 9 10 10 10 11 12 12 13 14Oates lest 100 tr/hal 12 12 12 12 It I2 12 12 I2 l 12 la 12
Tree Crops - StlniulentsQat (mIssion estimatel 17 1s 19 20 21 22 23 25 30 34 35 43 45Coffee 1 .2 4 -A 12 . -A -A -A 4 4 _1 _A
TOTAL PERRENIAL CROPS 50 57 55 61 51 64 67 69 75 50 as 91 94
TOTAL AREA MAIN CROPS 1J1. LW1A Lii LIi LW 1.11 ii 1.01 1411 Low 1.47L 1411 LIIZ
Source: CP0
I- Yt

YEHEN AlAS RrCuILIC
AgRIOiJLTURAL StRATEGY PAPER
Production *r Han CrOOJ '000 tkafli
Year 1971/2 1972n 197314 197415 IS75/6 17fif 7 l47ha 197s1 s 1279111 DU1g 1111 11s1 iln
CerealsSorohwn A MIllet 673 639 145 921 765 613 S15 627 632 636 635 551 265Hl. a 34 39 35 44 43 43 46 4S 49 53 59 31Wheat J0 59 84 67 62 61 45 63 6J 65 70 67 34Barley 109 __4 66. __._.-l __SS__U -Al __U *2 .5 _a3
Total Cereals 720 526 737 1.0o5 949 759 712 776 766 795 £16 700 163
Industrial CropsTobacco *.a 5.0 di 5.0 5.6 6.4 4.9 6.4 7.0 7.0 6.3 6.7 5.7Cotton 15.0 18.5 20.0 27.0 13.5 6.3 3.9 4.8 2.6 5.0 .S 6.5 6.5 OJ
Other Annual CrapsCry Leaumes 60 56 64 71 76 l2 77 79 66 64 so 75 40Sesame S 4 4 a S 6 6 6 6 6 s 5 4Potatoes 56 64 64 71 76 100 107 116 127 131 131 ISO 163Vegetables 137 isa ISO 16a 181 210 226 230 254 261 291 305 326UgrIesm (Fodder) 37 36 3a 39 40 41 41 42 43 44 45 49 49
Tree Crops - Foodfruits 2a 60 60 60 65 72 7 73 76 77 el as asGrapes 35 35 31 40 42 47 Ai 49 SS 56 64 68 72Dates S S S 5 6 6 6 6 6 6 6 6
Tree Crops - StimulaentsOat IMtssion Estimate)n.m. n.m. n.a. na. flaa. nna. na. nfa. n.a. n.a. n.m. na. n.a.Coffee 3.5 3.5 3.5 2.0 3.0 3.4 3.9 3.6 3.5 3.6 3.5 3.3 3.1
Source: CPO
IX

YVMNI ARA1 EPUBLIC
AGRICULTIJRAL STOATEGY PAPER
Hectarel
Year 197212 1972L3 19734S 127415 JiltS 11211 1977/8 11211 1l780 1n1u
CerealsSorghum A MIllet 0.60 0.73 0.67 0.87 0.74 0.78 0.91 0.92 0.94 0.91 0.91 0.14 0.39Kali- . 0.80 1.42 1.56 1.70 1.46 3.47 1.39 1.45 1.55 1.55 1.16 1.64 0.36Wheat 1.00 1.00 1.01 1.12 1.03 0.94 0.75 0.95 1.02 1.03 1.06 1.10 0.56Barley 1.12 1.09 1.10 1.09 2.52 0.39 0.81 0.91 0.93 1.02 1.04 1.06 0.60
Total Cereals 0.74 0.79 0.74 0.91 0.31 0.82 0.91 0.94 0.97 0.97 0.96 0.91 0.43
Zndustrial CropsTobacco 1.25 1.25 1.25 1.21 1.12 1.23 0.77 1.07 1.17 1.17 1.05 1.12 0.95Cotton 1.00 0.93 1.00 0.96 0.90 0.11 0.73 0.30 0.93 1.00 1.00 0.93 0.93
Other Annual CropsDry Legwnes 1.00 0.91 0.98 1.00 1.00 1.14 1.01 1.07 1.11 1.12 1.03 1.07 0.17Sesame 0.63 0.10 0.10 0.16 0.60 0.60 0.60 0.60 0.60 0.60 0.50 0.50 0.40Potatoes 11.60 10.61 10.67 11.83 30.36 11.11 13.89 11.60 11.55 11.91 12.15 12.50 13.53Vegetables 9.13 9.38 9.38 9.33 9.11 9.55 9.42 1.52 9.77 9.67 10.03 10.17 9.59ferseem (todder) 12.13 12.67 12.67 13.00 13.33 13.67 13.67 14.00 10.75 11.00 11.25 12.25 12.25
Tree Crops - FoodFruits 5.60 6.00 6.00 5.00 5.42 5.54 5.50 5.21 5.43 5.50 5.40 5.67 1.67Grapes 5.00 4.38 3.83 4.44 4.70 4.70 4.50 4.90 5.00 4.67 5.33 6.23 5.14Oates 0.42 0.42 0.42 0.42 0.50 0.50 0.10 0.10 0.10 0.50 O.10 0.10 0.10
Tree Crops - StimulantsQat (hisssoil Estimate) n.a. n.a. n.o. n.a. n.a. n.. n.a. n.a. n.a. n.a. n.a. n.a. n.a.Coffee 0.39 0.39 0.39 0.33 0.43 0.49 0.49 0.41 0.44 0.45 0.44 0.41 0.41
I-Pr
c.u
LAIP

YEVIEI AAR REPUBLIC
AGRICULTURAL STRATEGY PAPEO
Estimates of Lun .pra
habmar Mndaidlfl Ha11h ilahhat ZaLa Th Sasadah Al Bavida Sanajl AlJamf MAzr"b TOTALS
1. Cropped Area ( 000 ha) 56 230 95 24 107 97 41 49 267 a 39 1.0112 - of which irrigated l OO ha) 9 80 16 - 14 65 17 30 a 39 2123. - of which rainfed ('000 ha) 47 IS0 79 24 93 91 38 32 2129 - - 753
4. Area 450 - 600 mu rain (1) 30 30 35 is 30 15 50 30 25 - - 256. As above mV000 hal 14 45 28 4 28 14 19 10 17 - - 219
6. Area over 600 n ratn S 20 - 25 75 45 75 - - 25 - - 247. As above (oe ha) 9 - 20 18 42 69 _ 25 - - 155
Sources: Line I Census data.Lines 2 and I mission estimates based an Census data.Lines 4 and 6 mission estimates based on meteorological data.
I I
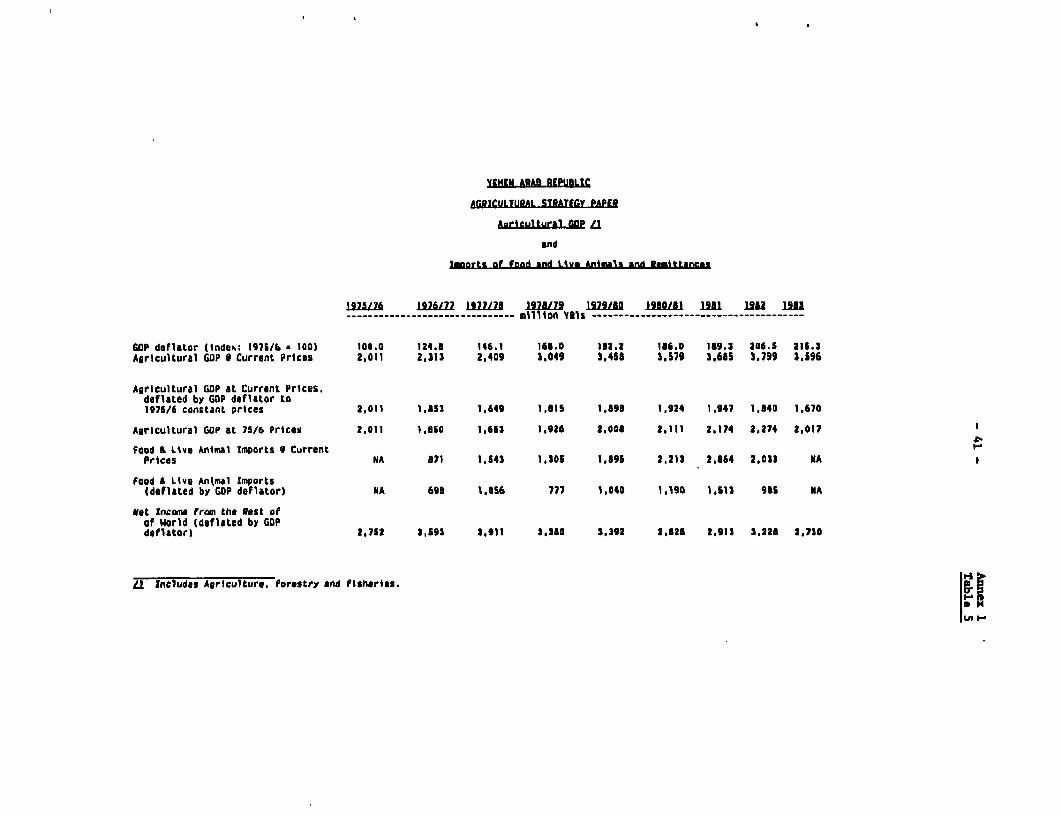
YEHMi ARA9 REPUBLIC
ACRICULTURAL STRATEGY PAPEI
Aaricultural CDP Li
and
lworts of Food and Live Aniu1s *nd MRttancas
1925/76 197ZA77 197U78 127 197 17910 ]IULII 111 iI Ill_ __------------- million Ills ---------------------------------------
GOP deflator (index: 1975/6 100) 100.0 Iz4.a 146.1 163.0 132.2 186.0 139.3 206.5 215.3Agricultural GOP * Current Prices 2,011 2,213 2.409 1.049 3,458 1.,79 3,685 3.799 3.596
Agricultural GOP at Current Prices,deflated by GOP deflator to1975/6 constant prices 2,011 1,853 1,649 1,311 1.,93 1,924 1,947 1,340 1,670
Agricultural GUP at 75/6 Prices 2,011 1,650 1,653 1,926 2,003 2,111 2,174 2,274 2,017
Food * Live Animal Imports 0 CurrentPrices NA 871 1,543 1.305 1.895 2.213 2.864 2,031 NA
food A Live Antmal Imports(deflated by GOP deflator) NA 695 1,056 777 1,040 1,190 1,513 9S NA
Net Income from the Rest oFof World (deflated by GOPdeflator) 2,752 1,593 3,911 3,230 3,192 2,828 2,912 3,223 2,730
YJ Includas Agriculture, forestry and fisheries.

- 42 - Anne 1Table 6
Y!EN MBAM REPUBLIC
AGRICULTURAL STRATEGY PAPER
Sector GDP (1982 prices)
Domestie Prices Border PricesUnit Value /1. VaLue Added 2 Unit Price /3 Total Value 2(YRlsIton) (YRIls mill.) (YRIsIton) (Mls mill.)
Qat n.a. 4,000 /I 52 n.a. 3,200 A1 69Cereals 1.800 l. IaO 19 500 400 9FiuLts 3,300 495 6 1.600 240 5Vegetables 2.200 990 13 1,100 495 11Livestock 15,000 650 8 8,100 245 5other Un.. 110 2 n.a. 70 /5 1Sector GDP, excl. qat 3,685 48 1,450 31Sector GDP, del. qat kIAa2 12 4 2
/I Value added estimates by mission at YAR financial prices./2 Nisaion estimte./3 Unit value added estimted by mission at 1982 economic border prices._ Adjusted by conversion factor of 0.8 to reflect trade distortions./5 Excluding Fisheries./6 Adjusted by weighted average of other co odities; adjusted factors excluding qat.
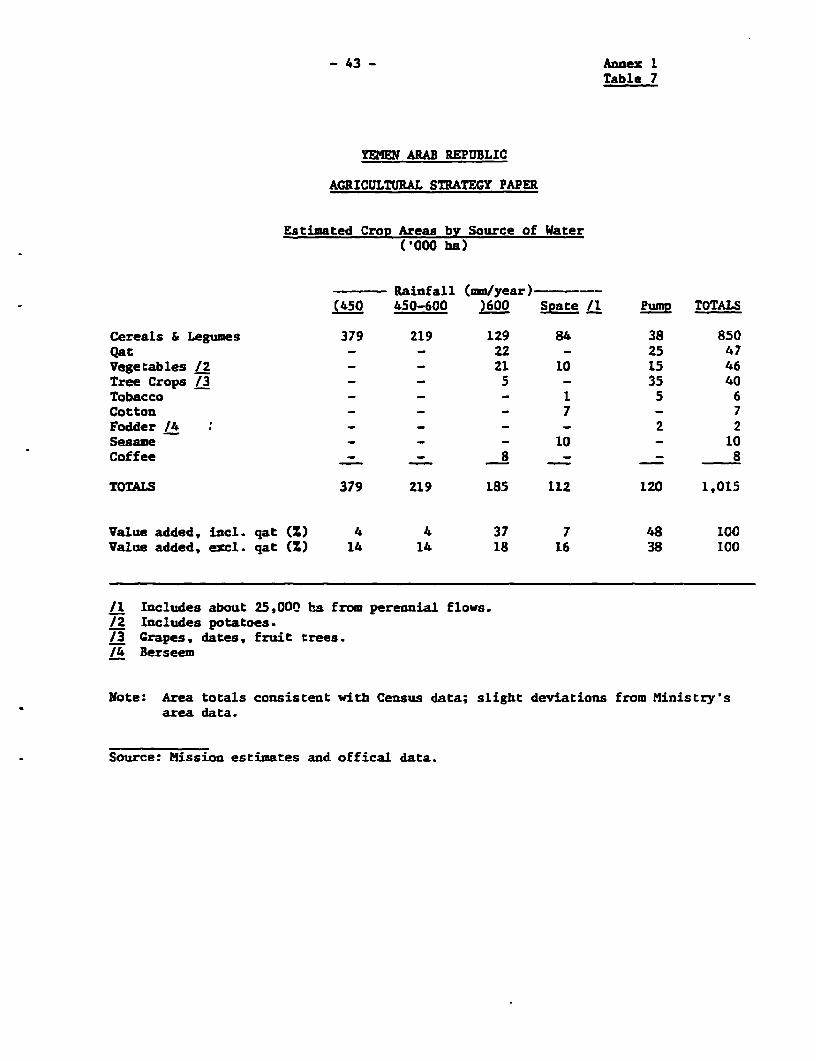
- 43 - Annex ITable 7
YEMEN ARAB REPUBLIC
AGRICULTURAL STRATEGY PAPER
Estimated Crop Areas by Source of Water('000 ha)
Rainfall (mm/year)-(450 450-600 )600 Spate /1 Pump TOTALS
Cereals & Legumes 379 219 129 84 38 850Qat - - 22 - 25 47Vegetables /2 - - 21 10 15 46Tree Crops /3 - - 5 - 35 40Tobacco - - - 1 5 6Cotton - - 7 - 7Fodder /4 - - - - 2 2Sesame - - - 10 - 10Coffee - - 8 - - 8
TOTALS 379 219 185 112 120 1,015
Value added, incl. qat () 4 4 37 7 48 100Value added, excl. qat (X) 14 14 18 16 38 100
/1 Includes about 25,000 ha from perennial flows./2 Includes potatoes./3 Grapes, dates, fruit trees./4 Berseem
Note: Area totals consistent with Census data; slight deviations from Ministry'sarea data.
Source: Mission estimates and offical data.
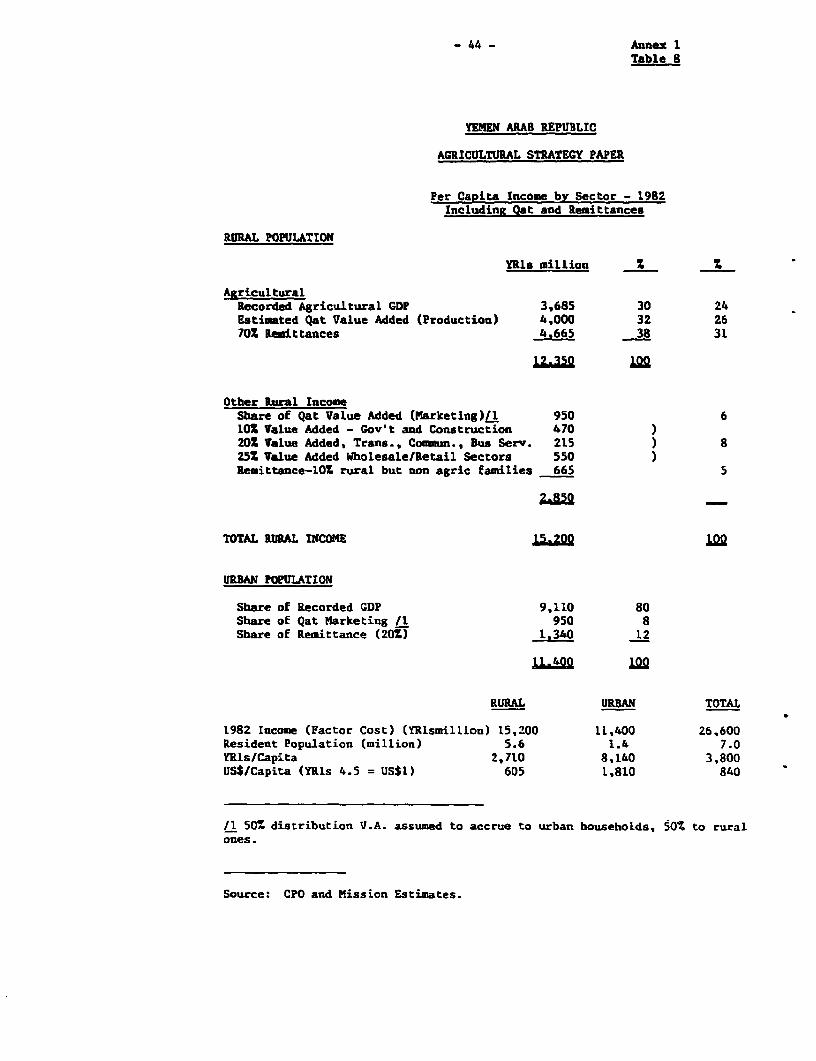
- 44 - Annex ITable 8
YEMEN ARAB REPUBLIC
AGRICULTURAL STRATEGY PAPER
Per Capita Income by Sector - 1982IncludinR Qat and Remittances
RURAL POPULATION
YRls million X S
AgriculturalRecorded Agricultural GDP 3,685 30 24Estimated Qat Value Added (Production) 4,000 32 2670X Remittances 4.665 38 31
1L2.3S2
Other Rural IncomeShare oE Qat Value Added (Marketing)Il 950 6102 Value Added - Gov't and Construction 470 )202 Value Added, Trans., Commun., Bus Serv. 215 ) a25S Value Added Wholesale/Retail Sectors 550 )Remittance-lOS rural but non agric families 665 5
TOTAL RURAL INCOME 15,200
URBAN POPULATION
Share of Recorded GDP 9,110 80Share of Qat Marketing /1 950 8Share of Remittance (201) 1,340 12
1U1r40 122
RURAL URBAN TOTAL
1982 Income (Factor Cost) (YRlsmillion) 15,200 11,400 26,600Resident Population (million) 5.6 1.i 7.0YRls/Capita 2,710 8,140 3,800US$/Capita (YRIs 4.5 = US$I) 605 1,810 840
/1 50% distribution V.A. assumed to accrue to urban households, 50% to ruralones.
Source: CPO and Mission Estimates.

Annex I- 45 - Table 9
YEMEN ARAB REPUBLIC
AGRICULTURAL STRATEGY PAPER
Estimated Labor Requlrements(rounded figures /1)
Crop Area Man-days /3 Total Man-days('000 ha) (per ha) ('000)
Sorghum/Millet 680 45 30,000Maize 35 35 1,225Wheat 60 40 2,400Barley 50 40 2,000Tobacco 5 100 500Cotton 5 75 375Dry Legums 70 35 2,450Sesame 10 35 350Potatoes 10 100 1,000Vegetables 30 150 4,500Berseem 5 125 625Fruits 15 100 1,500Grapes 15 150 2,250Dates 10 50 500Qat 40 /2 130 5,200Cotton 10 75 750
All Crops 1,050 56,225Livestock n.a. 23,300
All Sector Z9.525
Expressed in man-years (250 days) 3j18.4 man-years
Peak demand per month (three-month period) 80,000 man-yearsequivalent/month
/I 1982 as base year./2 Mission estimate of producing area.13 Based on estimates of YAR Sector Memo of 1979.

- 46 - Annez 1Table 10
YEMEN ARAB REPUBLIC
AGRICULTURAL STRATEGY PAPER
Agricultural Labor SUppl1(1982)
millions
Total Population 7.7- of which in agriculture (702) 5.4- of which economically active (502) 2.7 (1.3 males)
(1.4 females)- of which resident males /1 0.7
females 1.4
Sector Labor Supply Estimates:
males 0.7 x 1.0 - 0.7 million man-yearsfemales 1.4 x 0.5 - 0.7 million man-years equivalent
Totals 1.4 million man-years equivalentor 0.12 million man-years equivalent per month.
/1 Total short-term migrants abroad: 700,000, of which 70X (500,000)from the agricultural sector, plus an estimated 100,000 agriculturalmales in towns in YAR.

-47- Annex 1Table 11
YEMEN ARAB REPUBLIC
AGRICULTURAL STRATEGY PAPF.R
Oat and Consumption Production: Same Estimates
Total estimated population: 7.7 million (1982)- over 15 years: 4.2 million
resident males: 2.1 - 0.7 - 1.4 millionresident females: 2.1 million
Consumers Consumers Frequency Expenditures Total Exp.(). (millions) (dayslyr) (YRIs/day) (YRIs billion)
Hales 30 0.42 - - -30 0.42 100 30 1.330 0.42 200 30 2.510 0.14 250 60 2.1100 1.20 5.9
Females 70 1.5 - - -30 0.6 100 25 1.5
3.6
TOTAL CONSUMPTION (retaiL sales value) ^&
TOTAL VALUE ADDED (-201) 11 5.9
TOTAL VALUE ADDED (TS$/capita) 12 170
TOTAL SECTOR VALUE ADDED (farm-gate) - 671 total VA /3 4.0
SALES VALUE FARM GATE (671 of retail sales value)J4 5.0
2 Qat in Production 80
AveragFe Sales/ha (ex-farm) YRIs 125,000
'000 ha
Estimated Area in production ('000 ha) 40
Estimated Area immature ('000 ha) 8
TOTAL AREA ia
/A Value added is estimated at 801 of gross sales (the other 20Z is purchasedinputs from outside the sector).12 Exchange rate in 1982 YRIs 4.5 = US$1./3 Value added estimated to accrue 2/3 to the producer; 1/3 to thedistributor and retailer14 Retail price estimated at 501 above Fatmgate Price; i.e. Farmgate SalesValue is 671 of retail value.
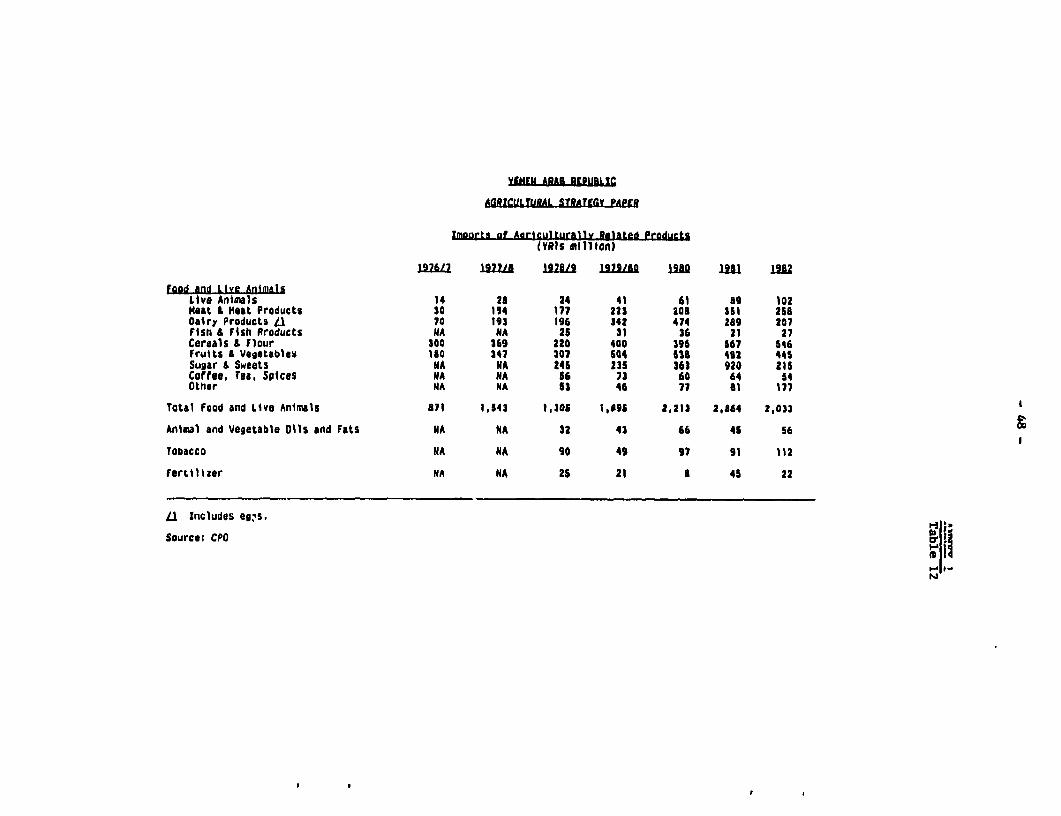
VYMHE ARAB ABPUBLIC
AGRICULTURAL STRATtGY PAPER
Imrarts of AaricultUrally Related Products(YRls mIllton)
197fL 19hh 127 SI9 199/l IA 12B 19t
Food and Live AnimalsLive Animals 14 20 24 41 61 8g 102Heat L HMat Products so 194 177 223 20B 351 258Oairy Products 11 70 193 196 342 474 289 207Fish & fish Products MA NA 25 31 36 21 27Cereals A flour 300 369 220 400 396 567 546Fruits & Vegetables lao 347 307 504 538 452 445Sugar & Sweets NA NA 245 2315 363 920 215Coffee, Tea, Spices NA NA 56 73 60 64 54Other NA NA 57 46 77 el 177
Total Food and Live Animals 871 1,543 1,305 1,;95 2,213 21a64 2,033
Animal and Vegetable Oils and Fats NA NA 32 43 66 45 56
Tobacco NA NA 90 49 97 91 112
fertilizer NA NA 25 21 8 45 22
LI Iuicludes eg*s.
Source: CPO |[
m- .-

I ,~~~~ ~~ ~~~~~~~~~~~~~~~~~~~~~~~~~~~~~~~~~~~~~~~~~~~~~~~~~~~~~~~~~~~~~~~~~~~~~~~~~~~~~~~~~~~~~~~~~~~~~~~~~~~~~~~~~~~~~~~~~~~~~~~~~~~~~~~~~~~~~~~~~~~~~~~~~~~~~~~~~~~~~~~~~~~~~~~~~~~~~~~~~~~~~~~~~~~~~~~
YEMEN AfAB-9geIjQLr
AGRICULTURAL STRATEGY FAPER
Retails of Sallated Aaricultural !mnarts…-- ---- - ---- --1980…-- -- - --- - - -- - -- - -1982…-- -- --- --
Value MillionOuantUty Unt milLtn YPIs Quantity unD YR1S
Live Cattle 18.000 head 14 S0,000 head 55Live Sheep 130,000 head 21 150,000 head 30Live Goats 33,000 head 3 33,000 head 4Live Poultry (day old chicks) - - 22 - - 13Beef - Fresh or Frozen 1,430 tons 12.6 1,360 tons 15.1Sheep Heat 0oo tons 1.1 200 tons 2.1Poultry Heat 15.600 tons 181.2 38,100 ton 228.9Preserved Heat 836 tons 12.4 - - 11.6HMik and Cream 366.4 165.1Butter and Cheese 59.4 4 .7Eggs 9.300 loco Dozen 48.0 13.300 o000 Dozen 47.3Wheat 167.0 292.7Rice 66.7 74,0Haize 13,1 7.6Hillat 1.2 2.0Sorghum 1.3 nilFlour 114.3 162.2Biscuits 28.6 10.7Animal Fodder 34.1 27.7Frozen or Fresh Vegetables 5.9 4.2Preserved Vegetables 49.8 * 78.3Oranges 24,400 tons 65.6 23,500 tons 73.0Mandarins 700 tons 11.6 1,500 tons 4.6Other Citrus 0o0 tons 2.6 300 tans 0.7Bararas 33,300 tons 107.3 38,100 tons 9a.9Apples 29,000 tans 154.5 22,900 tons 82.6Other Fruit 13.0 19.4Juices 17,000 tons 74.3 6,200 tons 22.8Oates 6,600 tons 13.1 24.2Fruits & Nuts 8,800 tons 35.5 35.5Honey 900 tons 7.7 2,700 tons 13.6 2 Peanuts 400 tons 2.6 300 tons 1.4 0 pSesame 11.5 4.9Soybean Ol 24.5 29.3Other Vegetable Oils 38.4 25.4 wTractors 275 number 16.8 208 number 9.2Ag. Machinery 60.6 36.2
Source: Analysis of Customs Statistics.
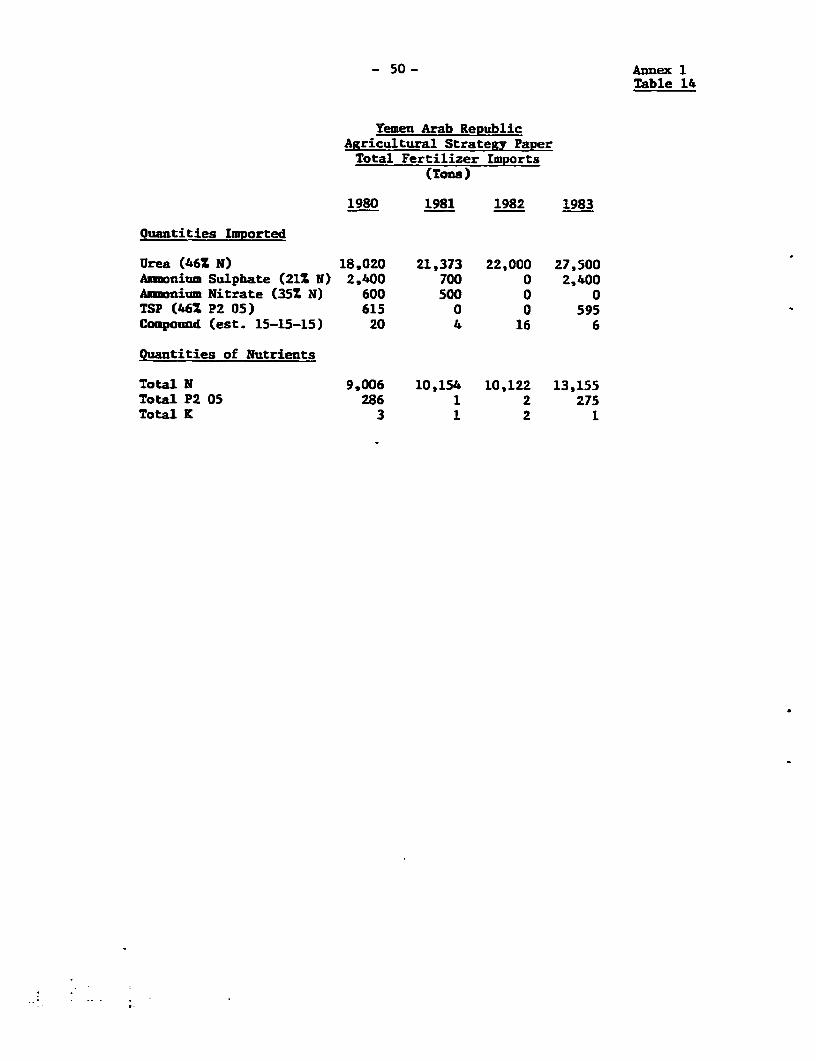
- 50 - Annex 1Table 14
Yemen Arab RepublicAgricultural Strategy PaperTotal Fertilizer Imports
(Tons)
1980 1981 1982 1983
Ouantities Imported
Urea (46S N) 18,020 21,373 22,000 27,500Ammonium Sulphate (211 N) 2,400 700 0 2,400Ammonium Nitrate (351 N) 600 500 0 0TSP (46S P2 05) 615 0 0 595Compound (est. 15-15-15) 20 4 16 6
Quantities of Nutrients
Total N 9,006 10,154 10,122 13,155Total P2 05 286 1 2 275Total K 3 1 2 1

Annex 1Table 15
-51 -
YEMEN ARAB REPUBLIC
AGRICULTURAL STRATEGY PAPER
Analysis of Cereal Production
Cropped Area Yield (ton/ha) Production (million tons)('000 ha) Present Future/i Present Future/i
375 /2 0.5 0.5 O.t85 0.185310 /3 1.0 1.4 0.340 0.435155 /4 1.8 2.2 0.280 0.340
Totals: 24 4' 14
This would correspond to an average rate of increase 1.2% p.a.
/1 1995/2 Less than 450 m rain.13 450-600 - rain and spate irrigation.14 More than 600 m rain and spate irrigation.

Annex I- 52 - Table 16
YEMEN ARAB REPUBLIC
AGRICULTURAL STRATEGY PAPER
Estimated Pumping Costs for Tubevelas
Water Depth 15. 25. 40. 60m
Area Covered aha 4 ba 4ha 4 ha
Pumping Rate 10 llsec 6 1/sec 6 I/sec 61/secDrilling Depth 30s 45m 60. 80mFuel/hr (liters) 0.8 0.8 1.31 1.92Operating Hours/year 2,500 2,500 2,500 2,500
CapitaL Costs -YBI's /1Drilling (YRls 1800/m) 54,000 81.000 108,000 144,000Pumpa 9.000 9 §000 9.000 9 °°°
63.000 90.000 117,000 153,000
Annual CostsFuel YRls 2/liter 4.000 4.000 6.400 9,600Lubricants 400 400 640 960Maint. of Well (YRis 900/10 yrs) 900 900 900 900maint. of Pump (201 of investment
cost) 1.800 1.800 1.800 1.8007,100 7.100 9.740 13.260
Depreciationl/Aortizatiou APump (10 years) 1,160 1,160 1.160 1,160Well & Land Improvements (25 years) 4.300 6.460 8.370 10,930
5,460 7.620 4,530 12,090
Total cost per year 12.560 14.270 L 23
Cost/i." .14 .27 .36 .47
11 Real interest rate = S.

Annex 1Table 17
YEMEN ARAB REPUBLIC
Agricultural Strategy Paper
Estimates of Growth Potential for Fruits and Vegetables
Fruits YR1sMillion
Import Substitution 100,000 tons at YRis 3,300;- annual equivalent over 10 years 33Increased demand;- population grovth (31 p.a.) 15- per capita increase 1/ 8
56
Average annual rate of Increase: 1O.
1/ 21 growth disposable income, and income elasticity of demand of 0.8;total effect 1.6S p.a.
Vegetables YRismillion
Import Substitution 10,000 tons at YTis 2,200;- annual equivalent over 5 years 4Increased demand;- population growth (32 p.a) 30- per capita increase 1/ 16- stabilizing seasonal supplies 10
60
Average annual rate of increase: 6X
1/ as for fruits.
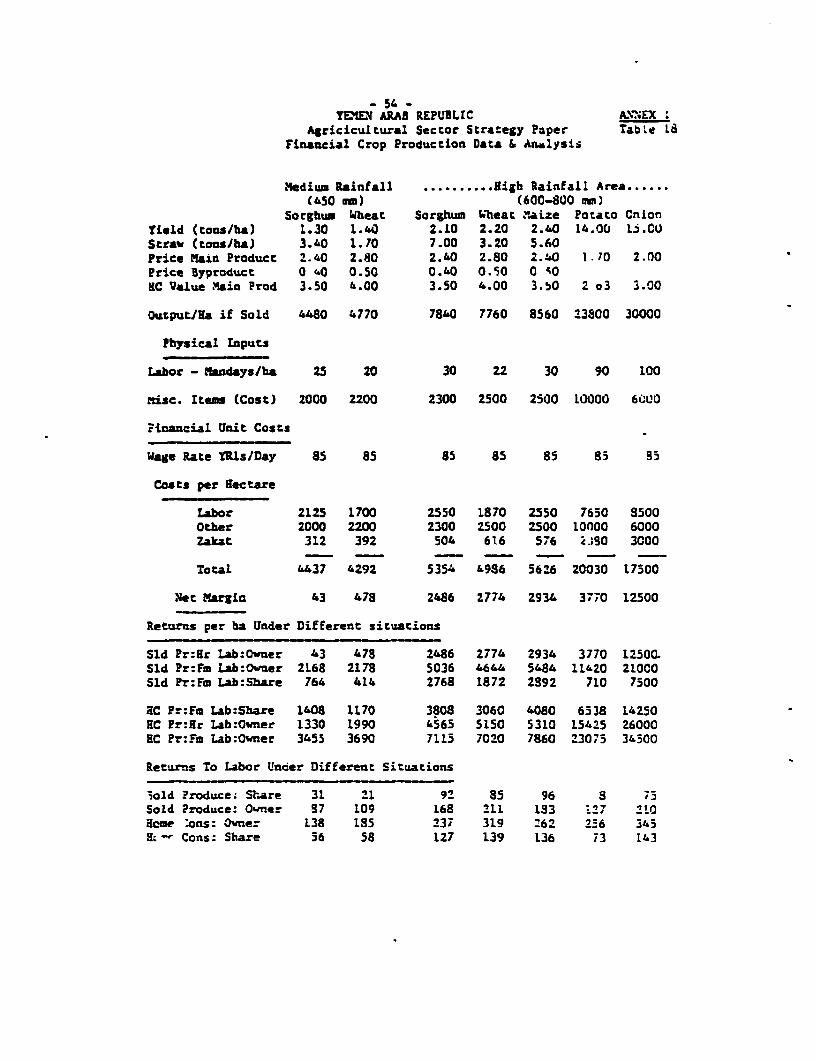
- 5' _YEIEY ARAB REPUBLIc AM EX
Agricicultural Sector Stra:egy Paper Tabte LSFinancial Crop Production Data & Analysis
Medium Rainfall .......... .High Rainfall Area.(450 mn) (600-800 mm)
Sorghum Wheat Sorghum Wheat M.aize Potato CnionYield (tons/ha) L.30 I.iO 2.10 2.20 2.40 14.00 1j.CUStraw (tonsiha) 3.40 1.70 7.00 3.20 5.60Price Main Product 2.40 2.80 2.40 2.80 2.40 1.70 2.00Price Byproduct 0 '0 0.50 0.40 0.90 0 AOKC Value Main Prod 3.50 4.00 3.50 4.00 3.50 2 o3 3.00
Output/la if Sold 4480 4770 7840 7760 8560 23800 30000
Physical Inputs
Labor - fandays/ha 25 20 30 22 30 90 100
Risc. Items (Cost) 2000 2200 2300 2500 2500 LOOO0 6OL0
Financial Unit Costs
Wage Rate YRIs/Day 85 85 85 85 85 85 g5
Costs per Eectare
Labor 2125 1700 2550 1870 2550 7550 8500Other 2000 2200 2300 2500 2500 10000 6000Zakat 312 392 504 616 576 c.:sa 3COO
Total 4437 4292 5354 4986 56'6 20030 17500
Net Margin 43 478 2486 Z774 2934 3770 12500
Returns per ha Under Different situations
Sld Pr:Hr Lab:Owner 43 478 2486 2774 2934 3770 12500.Sld Pr:Fm Lab:Owner 2L68 2178 5036 4644 5486 11420 21000Sld Pr:Fm Lab:Share 764 414 2768 1872 2892 710 7500
EC Pr:F, Lab:Sbare 1408 1170 3808 3060 4080 6538 14250EC Pr:Hr Lab:Owner 1330 1990 4565 5150 5310 15425 26000EC Pr:Fm Lab:Owner 3455 3690 7115 7020 7860 23075 34500
Returns To Labor Utnder Different Situations
,old Produce; Share 31 21 92 85 96 8 75Sold Produce: Owner 87 109 168 '11 183 -IF --0Home 'ons: Owner 138 185 237 319 :62 256 345H;- Cons: Share 56 58 127 139 136 ;3 143

Annex 155 Table 19
rw ARAB RIB ICAgricicultural lctor Strategy Paper
Financial Crap Production Data I Analysis
............. .Uplnd Irrigated Aru ............A.. ................. Tihire Reqgin..... hqA~ Irriqatim ....... ... Spatb Irigation..
Sorgbus SIt routo Alfalfa Potato hien Sorghm Toauto Nielm Sorghum Cottm Onionield (tansihal 2.80 3.00 20.00 70.00 22.00. 25.00 2.60 20.00 20.00 1.90 1.00 17.00
Stra (tans/haJ 10.00 4.00 2.00 16.00 2.25Price han Product 2.40 2.80 1.5 0.6b0 1.70 2.00 2.40 1.50 1.00 2.40 3.90 2.00Prica Byproduct 0.40 0.50 0.40 0.40 0.20NC Value Main Prod 3.50 4.00 2.39 2.63 3.00 3.50 2.38 1.75 3.50 3.00
btput/ll if Sald 10720 10400 30O 42000 37400 SOOO5 17440 30000 20000 10720 7470 34000
Physical Inputs
Labor - andayslha 45 35 100 150 100 120 75 100 90 65 SO 115Iater 000 3 11.00 11.00 12.00 31.00 12.00 12.00 15.60 14.00 12.00 8.00 9.00 8.00Nisc. Etas (Cost) 2700 2700 500 4000 10500 7500 4100 5500 5000 3100 3800 6000
Finacial Unit Costs
Vqe Rfte YRls/Dy 85 85 E5 85 a5 85 95 95 85 85 95 B5Hater per m3 0.39 0.39 0.39 0.39 0.38 0.39 0.14 0.14 0.14 0.00 0.a0 0.00
Csts per Rectare
ater 4180 4180 4560 11790 4560 4560 2184 1960 1680 0 0 0Labor 3825 2975 S500 12750 9500 10200 6M5 8500 7650 352 6100 9775Other 2700 2700 5500 4000 IOO5 7500 4100 5500 5000 3100 3900 6000Zatat 33 420 1500 2100 1970 2500 312 1500 1000 432 102 3400
Total 11041 10275 20060 30630 25430 24760 12971 17460 15 = 9057 11302 19175
Not Hargin -321 125 9940 11370 11970 25240 4469 12540 4670 1663 -3932 14925
Returns per ha Under Differat situations
Sid Pr:Hr Lab:Ouner -321 125 940 11370 11970 25240 4469 12540 4670 1663 -3832 149$5Sld Pr:Fh Lab:kmanr 3504 3100 194U 24120 20470 3540 10844 21040 12320 7188 296b 24600Sld Pr:Fo Lab:Share 1908 110 11'15 14145 11598 23565 9362 13915 7570 6216 1389 16950NC Pr:J4r La:k6ner 2605 3545 26565 n.a. 71l03 49990 7196 29165 18920 3445 n.a. 30125
Returns To Labor Under Differeft Situations
Sold Praduce: Qhner 79 89 184 161 205 295 145 210 137 - 11 :7 2!4Sold Produce: Share 42 32 113 94 :16 196 125 139 94 96 17 :{44ome Cons: Owner 1&3 186 351 n.a. 399 493 1! 377 295 1.8 85 :4
Returns tc Mater
5SId Produce: 0mer 0.35 0.Y9 1.2" 0.75 I.:Z :.46 0.43 1.04 0.53 O.i! -0.i8 1.35Sotd Produce: Dare " .'2! f., 0.61 D *0.bL 2.49 0.33 I.t5 , 0.15 0.13 4.O9 U8d
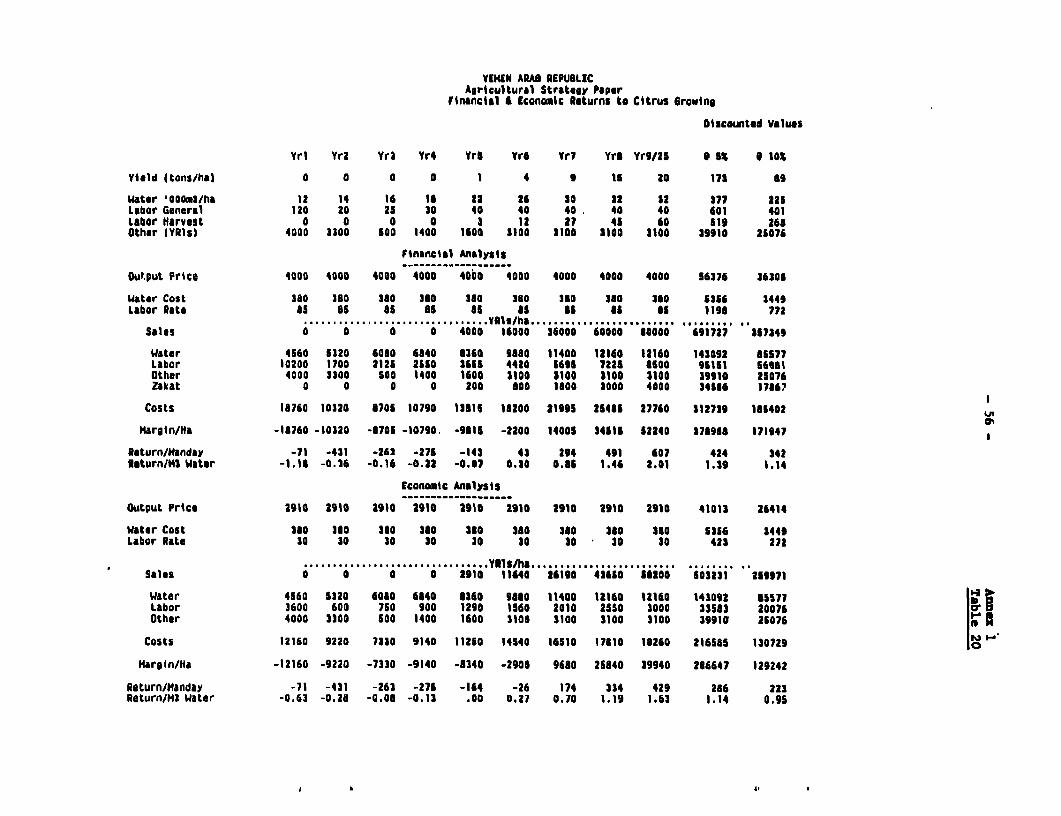
YEHEN ARAB REPUBLICAgricultural Strategy Paper
Financial 6 Economic Returns to Citrus Growing
Discounted Values
Yrl Yr2 Yr2 Yr4 YrS Yr6 Vrl YrS Yr9/25 S 5X 9 lOX
Yield (tons/ha) 0 a a O 1 4 9 la 20 17 a9
Water 00D2/hi 12 14 16 16 22 26 30 22 22 277 225Labor General 120 20 25 30 40 40 40 40 40 601 401Labor Harvest 0 0 0 0 J 12 27 45 60 519 268Other (YRis) 4000 3300 500 1400 1600 3100 3100 2100 3100 39910 25076
financial Analy5si
Output Price 4000 4000 4000 4000 4000 4000 4000 4000 4000 56376 36308
Water Cost sao 300 3ea 3ea ea0 s3a se0 280 380 5254 2449Labor Rate Si as is as is as s s as is 1198 772
...... .... ;YRls/ha.Sales 0 0 0 0 4000 14000 36000 60000 80000 691727 327249
Water 4560 5120 6080 6840 8360 9880 11400 12160 12160 143092 85577Labor 10200 1700 2126 2550 3645 4420 5695 7225 8500 95161 66£01Other 4000 3300 C00 1400 1600 3100 3100 2100 3100 39910 25076Zakat 0 0 0 0 200 800 1800 3000 4000 34168 17867
Costs 18760 10320 8705 10790 13815 18200 21991 21481 27760 212739 185402
Margin/Ha -18760 -10320 -8701 -10790. -9811 -2200 14001 34S1 12240 378988 171947
Return/Handay -71 -431 -242 -275 -143 43 294 491 607 424 342Return/Ml Water -1.18 -0.26 -0.16 -0.22 -0.07 0.30 0.85 1.46 2.01 1.39 1.14
Economic Analysis
Output Price 1910 2910 2910 2910 2910 2910 2910 2910 2910 41013 26414
Wator Cost 380 3 00 380 380 280 300 380 380 380 5356 3449Labor Rate 30 30 20 20 30 30 30 30 30 423 272
YRIs/ha .. .Salas 0 0 0 0 2910 11640 26190 42650 18200 103231 2S9971
Water 4560 5120 6080 6440 8360 9880 11400 12160 12160 141092 55577Labor 3600 600 750 900 1290 1560 2010 2550 3000 3352 3 20076Other 4000 3200 SO 1400 1600 3100 3100 3100 3100 39910 21076 0 7
Costs 12160 9220 7330 9140 11250 14540 16510 17810 18260 216585 130729
Margin/Ha -12160 -9220 -7220 -9140 -8340 -2900 9680 25840 39940 286647 129242
Return/Handay -71 -431 -263 -275 -164 -26 174 334 429 286 223Return/M3 Water -0.63 -0.2a -0.08 -0.13 .00 0.27 0.70 1.19 1.53 1.14 0.95
I .,

- 57 -YEMEN ARAB REPUBLIC ANNEX 1
Agricicultural Sector Strategy Paper Table 21Economic Crop Production Data & Analysis
Medium Rainfall .......... High Rainfall Area.(450 mm) (600-800 mm)
Sorghum Wheat Sorghum Wheat Maize Potato OnionYield (tons/ha) 1.30 1.40 2.10 2.20 2.40 14.00 15.00Straw (tons/ha) 3.40 1.70 7.00 3.20 5.60Price Main Product 1.07 1.14 1.07 1.14 1.13 1.30 1.60Price Byproduct 0.27 0.28 0.27 0.28 0.28SC Value Main Prod 1.84 1.93 1.84 1.93 1.91 2.13 2.50
Output/Ha if Sold 2309 2072 4137 3404 4280 18200 24000
Physical Inputs & Financial Costs
Labor - Mandays/ha 25 20 30 22 30 90 100Misc. Items (Cost) 2000 2200 2300 2500 2500 10000 6000Wage Rate YRls/Day 85 85 85 85 85 85 85
Economic Conversion Factors
Labor 0.50 0.50 0.50 0.50 0.50 0.50 0.50Other Inputs 0.80 0.80 0.80 0.80 0.80 0.80 0.80Z-akat 0.00 0.00 0.00 0.00 0.00 0.00 0.00
Economic Costs Per Hectare
Labor 1063 850 1275 935 1275 3825 4250Other 1600 1760 1840 2000 2000 8000 4800Zakat 0 0 0 0 0 0 0
Total 2663 2610 3115 2935 3275 11825 9050
Net Margin -354 -538 1022 469 1005 6375 14950
Economic Returns per ha Under Different situations
Sold Produce -354 -538 1022 469 1005 6375 14950Home Consumed Prod 644 561 2634 2196 2883 17925 28450
Economic Returns To Labor Under Different Situations
Sold Produce 28 16 77 64 76 113 192Home Consumed Prod 68 71 130 142 139 242 327

58 Annex. 1Table 22
eo Al" REPUILCAgricicultural Sector Strategy Paper
Economic Crop Production Data Analysis
. Upmnd I"ilgt.d Arm.. ... ...a.. Upln In .................... PUP Irrigation... ... Spate Irrigation...
Sorghum meat Tomato Alfalfa Potato Onio Sughun Touato Malm Sorghum Cottn hnimyield Itmoshl) 2.10 3.00 20.00 70.00 22.00. 25.00 2.60 20.00 20.00 1.80 1.80 7.OOStra ItmsJhal 10.00 4.00 28.00 16.00 2.25Price Nain Product 1.07 1.14 1.20 0.27 1.30 1.60 1.07 1.20 0.30 1.07 3.10 1.60Price lyproduct 0.27 0.21 0.27 0.27 0.16NC Valuo Rain Prod 1.14 1.93 2.00 2.13 2.50 1.84 2.00 1.50 1.84 2.S0
Ohtputlh i0 Sold 5696 4540 24000 10900 23600 40000 10342 24000 16000 6246 7200 27200
Physical Inputs I Financial Costs
Laeor - Nrdays/ha 45 35 100 150 100 120 75 100 90 65 0 115later '000 3 11.00 11.00 1L00 31.00 12.00 12.00 15.60 14.00 12.00 3.00 9.00 9.00Nisc. Itmus (Cost) 2700 2700 5500 4000 10500 7500 4100 5500 5000 3100 3900 6000alle ateY lslay 0S K5 S5 S5 85 85 35 95 05 85 35 05
Econoic Conversion FactorslCnts
ECF for Lebor 0.50 0.50 0.50 0.50 0.50 0.50 0.50 0.5 0.50 0.50 0.50 0.50ECF for Other Inputs 0.80 0.80 0.80 0.00 0.30 0.90 0.30 0.30 0.90 0.00 0.80 0.10ECF fr Zakat 0.00 0.00 0.00 0.00 0.00 0.00 0.00 0.00 0.00 0.00 0.00 0.00Mater per d3 YRIs Cast 0.33 0.33 0.39 0. 0 0.39 0.39 0.14 0.14 0.14 0.10 0.10 0.10
Costs per NMctare
Matar 4190 4190 4560 11700 4560 4560 2184 1960 1690 goo 0OO o0oLabor 1913 1499 4250 6375 4250 5100 3133 4250 3825 2763 3400 4989Other 2160 2160 4400 3200 9400 6000 3280 4400 4000 2480 3040 4900Zakat 0 0 0 0 0 0 0 0 0 0 0 0
Total 9253 7929 13210 21355 17210 15660 0652 10610 9505 6043 7240 10498
Not Margin -2557 -329 1070 -2455 11390 24340 1691 13390 6495 204 -40 16713
Economic Returns per ha Under Different situatians
Sold Produce -2557 -3298 10790 -2455 11390 24340 1691 13390 6495 204 -40 16713Hoew Consued Produce -407 -933 26790 n.a. 29540 46840 3696 29390 20495 1595 n.a. 32013
Ecanomic Returns To Labor Under Different Situations
Sold Produce -14 -51 150 26 156 245 65 176 115 46 42 218Howe Consumed Produce '3 16 310 n.a. 329 433 92 336 270 67 n.a. ;21
Economic Returns to Mater Under Different Situations
Sold Produce 0.15 0.08 1.21 0.30 1.33 2.41 0.25 1.10 0.69 0.13 0.10 2.19heoe Consumed Proauce 0.34 0.'0 2.61 n.a. 2.34 4.29 0.39 2.24 1.95 0.0 n.a. 4.10

59 Appendix APage 1
YEMEN ARAB REPUBLIC
AGRICULTURAL STRATEGY PAPER
ECONOMIC PRICES OF AGRICULTURALPRODUCTS IN YAR
1. The border prices for agriculture products in YAR should, whereposaible, be calculated on the basis of internationally traded prices adjustedfor external freight differentials and internal port charges, handling, etc.to the main wholesale market center. From this should be deducted the localcost of moving equivalent produce from farm gate to the wholesale market.With cereals this computation is relatively easy to do in that YAR is asignificant importer of wheat, therefore external freight differentials andinternal freight charges are well known. The internal costs of moving grainfrom individual farmers plots to the wholesale market are more difficult toestimate however.
2. In the analysis presented in Table 1 it has been assumed that farmersliving;an average of 75 km from Sana'a would bring their own grain to thewholesale market using pick-up trucks. An alternative assumption, whichperhaps would be more costly, is that a local assembly merchant would arrangeto buy grain in rural areas, involving trading costs (perhaps in the order oflOS of the value of the grain itself), but incurring lower transport costsfrom the rural areas to Sana'a because trucks rather than pick-ups would beused. Table 2 estimates the economic cost per ton kilometer of moving producearound YAR both in pick-ups and in 15 ton trucks. It is clear that pick-uptransportation is very expensive in terms of cost per ton kilometer. This isprobably one of the reasons for the high prices of produce throughout YAR aspick-up trucks are widelv used as a means of transporting produce to market.There may however be some unquantified offsetting benefits from using pick-uptrucks as the latter often transport passengers at the same time as produce.
3. Estimated economic output prices of animal fodder, fruits, vegetablesand other agricultural items are shown in Table 3. The basis for theseestimates is discussed in the following paragraphs.
Cereal by-Products. Straw, or stover from wheat, maize and sorhgumis widely traded in Yemen. Financial prices of these products, however, donot give a good indication of their economic value. The domestic price forthese animal feeds is derived from the demand for feed of the livestockindustry. As a result of severe droughts in recent years and an effectivelimitation on livestock and meat imports, livestock prices and hence the priceof animal feeds, have been pushed up well above the import parity price foranimal food of equivalent quality which is traded (tradeable livestock feedse.g. maize is not imported as animal feed and wheat imports have to bedelivered to urban markets, thus little actual substitution of importedcereals for domestic fodder takes place). The upper bound for the economicvalue of straw could be based on its nutrient value which can amount to up to45Z of the value of grain. However, because of bulkiness and indigestibility,straws and stovers in most countries are worth substantially less than this.For example, wheat straw in the UK is currently sold, ex-farm at 15-20X of the

- 60 - Appendix A-60- ~~~~~~~~Page 2
grain price. Overall, it is estimated that a reasonable economic. value ofwheat, maize or sorghum straw in YAR would be in the order of 60-702 of itstheoretical nutrient value equivalent, i.e. on a dry weight basis should bevalued at about 25S of the price of the grain itself.
5. Green alfalfa which is highly digestible and palatable to livestockshould be valued at at least its nutrient value and possibly higher, in thatthere is a distinct shortage of good quality green fodder which is importantin ruminant nutrition.
6. Potatoes, while not widely traded certainly can be. A number ofcountries export significant quantities. These include Holland, which exportsmain crop potatoes and Cyprus, Egypt, Malta, the Canaries and Spain which areall exporters of "new potatoes". Prices of potatoes vary substantially fromseason to season. In 1983 farm gate potato prices in Europe were around $250per ton whilst at the present they are only about $50 per ton. A realisticlong run FOB Europe price would probably average $100 per ton. After allowing$85 per ton for shipment to Hodeidah, and making adjustments for unloading andtransport, the economic value of potatoes is estimated, ex-farm, at YRls 1.3per kilo.
7. :Vegetables comprise a whole range of different items, somt of whichare tradable and some are not. Onions are a widely internationally tradedvegetable and November 1984 UK wholesale prices for imported onions were about£160 per ton for Spanish onions, £110 per ton for Dutch and £140 per ton forPolish. These prices average about $165 per ton. After allowing for thegreater shipping distance and cost from supply countries to YAR compared withthe UK, a realistic FOB import price would probably be around $200-250 perton, giving a import parity farm gate value of around $250 per ton, or YRls1.6 per kilo.
8. Oranges are an item of the World Bank Commodities Division PriceProjections and current prices are expected to stay relatively stable in realterms at around $380 per ton. This price is the unit import price to France.Assuming that the unit import price to YAR would be about $50 per ton higherand after allowing for unloading and freight adjustments, the farm gateequivalent price in Yemen would be about $450 per ton, or YRls 2.9 per kilo.
9. The main meats consumed in YAR are chicken and lamb. The landed FOBprice of frozen chickens is around $1,200 per ton. After allowing for thecost of refrigerated transport to Sana'a and deducting the cost of gettinglive chickens from the farm to the town, the estimated farm gate value of livechickens in Yemen is the equivalent of about YRls 8 per kilo on a carcassweight basis.
10. Frozen New Zealand lamb could be imported into YAR at about $1,900per ton on a carcass weight basis. This would also need to be transportedfrozen for distribution and would give a farm-gate equivalent price ofYRls 12.5 per kilo on a carcass weight basis or YRls 5.6 on a live weightbasis. These prices assume that the value of the pelt and offals directlyoffset the costs of slaughtering.
- -'* - '' ! ' ' ....

-61 - Appendix APage 3
11. It is important to distinguish between the .o,azomic value ofincremental produce produced for sale by farmers and the economic value ofincremental produce for home consumption. In the former case, the valueex-farm is essentially the producer price of the commodity, whilst in thelatter case the opportunity cost of not producing would be for the farmer tobuy the produce (which he didn't produce) at retail prices. The calculationfor grains shown in Table 1 indicates a very substantial difference in theeconomic price under the two different scenarios. Assuming no premium for -domestically produced wheat over international wheat of the same apparentquality, the economic price in 1984 for production which moves into thewholesale market, is about $175 per ton ex-farm, while wheat produced forconsumption within the farmer's own household has an economic value about $300per ton. Table 3 shows the economic value of various crops other thancereals, as well as livestock for home consumption as well as for sales.

YEMEN ARAB REPUBLIC
AGRICULTURAL STRATEGY PAPER
Ettimated Barder Price& of Sam Cond'ttas
Pntatoes gnn OrangsM Chiokn Lamb
Estimated C+F Price ($/ton) 1865 230 430 1,200 1.900---------------------- YRIs/ton ------------------------
Estimated C+F Price (YRl/ton)ll 1,200 1.500 2.800 7,800 12.300
Coest from C+F to Sana*a 280 Li 300 t2 360 11 710 900 1
Sana a Value (Wholesale) 1.480 1,800 3,160 8,510 13,200- less
Costs from farmgate to Sana&a 200 200 200 500 50o
Estimated Economic Farm Gate Price 1,280 1,600 2.960 8.010 Li 12.700 /L
Economic Value for Home Consumption Li 2,100 2,500 4,200 11,260 17,120 1
/1 Conversion rate: YRls 6.6 8 US$1.LZ Importers cost and margins 5% Unloading and port charge YRls 150/ton, transport to Sana'a YRls
70/ton.Li Importers costs and margins 4S, Unloading and port charge YRls 200/ton; transport to Sana'a YRls
200/ton.11 On carcass weight basis.Li Sana'a price plus transport to rural area, plus 25X retail margin.
Po
. . $ .~~~~~~~~~~~~~~~~~~~~~~

YEMEN ARAB REPUBLrC
AGRICULTURAL STRATEGY EAPER
Estimates of Border Pricui - Cereals
..... ~ ~ ~ ~ ~ ~ ~ ~ ~ ~ .. taL.~ a 0 aaaWheat _MA1 ae Snrchum
lilA i192 hf1 1a 1211 U 1984/5 Jil----------------- ~~~U S s-------- --- --- --- --- --- ---
World Bank International Price Estimate 139 la 134 Li 138 117 128 112
International Freight Differential LI 22 22 22 22 22 22
Sconomic Cost CAF Hodeida 161 156 160 139 150 134
Conversion to Rials LI 5.5:1 6.5:1 6.5:1 6.5:1 6.5:1 6.5:1
-------------------- 1984 YRls ------------------------- C&f Value in YRls. 1,046 1,014 1.040 904 975 871
.mporters economic costs Li 42 41 42 16 39 35
Ragging Li 41 41 41 41 41 41Port charges and handling Li 100 100 100 100 100 10OLoading 'L 40 40 40 40 40 40
Loaded Value on Truck Hodeida 1,269 1,236 1,263 1,121 .,195 1,087
Transport to Sana's (210 km) 71 71 71 71 71 71
Value at Sana a Wholesale 1,340 1,307 1,334 1,112 1,216 l,118
Less:
Pick-up Transport Li farm to Sana'a (76 km)/Z 200 200 200 200 200 200
Ex-Farm Value (for sale) 1,140 1,107 1,134 992 1l066 958USt 175 170 174 153 164 147 cr I
Ex-Farm Value for Own Cansumnntian Wholesale Value 1,340 1,307 1,334 1,192 1,266 1,158Transport to rural area a_ 200 200 200 200 200 200Retail margin (+25%) __85n_ 377 384 34836 34fp
1,925 1,884 1,918 1,740 1,832 1,698US$ 296 290 295 268 282 261
jJ Soft red wheat f.o.b. US Gulf Ports (this is the type of wheat presently imported by YAR).11 Observed price differential between f.o.b. US Gulf Ports and CIF contract price Hodeidah for
eqluivalent quality wheat in September 1984,LI Estimated market rate.
r Insurance, Admin Costs and Costs associated with LC's estimated at 4X of value. --
1 Port changes YRls 30, storage and handling YRls 70.Li Estimated at US$0.05/ton-km for trucks--see attached Table 2.12 Estimated at Yrs 2.6/ton km or US$0.40/ton-km--see attached Table 2.

Appendix A
-64- Table 3
YEMEN ARAB REPUBLIC
AGRICULTURAL STRATEGY PAPER
Estimated Vehicle Operating Cost
15 Ton Truck 1 Ton Pick-up
Capital Costs (economic) $40,000 $7,000
Annual Distance Covered 75,000 km 20,000 km
Life 4 years 5 years
Load Factor 60Z 50Z
Fuel Use (km/1) 2.5 7
*000 YRls/per year
Annual Costs
Driver 30 15 (Part time)Fuel ( Price 1.7/1) 51 5Repairs /1 39 7Deprec./Finance Charges /2 73 11Overheads /3 38 -
A-nual Cost 231 38
Annual Ton-km moved 675,000 10,000
Cost/Ton-km (YRls) 0.14 2.63
Cost/Ton-km ($) 0.05 0.40
/1 152 of capital cost annully./2 No residual value. Vehicle is paid for over full life with 5Z real
interest./3 202 of cost for truck; zero for farmer's pick-up.
; . . ...
- 65 - APPENDIX BPage 1
PERFORMANCE OF COMPLETED IDA-ASSISTED AGRICULTURAL PROJECTS 1/
This section highlights the performance of completed IDA assistedagricultural projects in YAR summarizing the major features, projectobjectives, problems, and achievements. It also identifies some of thelessons learned which could be relevant to future projects in YAR involvingthe introduction of new technology and/or the establishment of newinstitutions in a traditional sociopolitical environment.
This summary is based on (i) Project Completion Report (PCR),(ii) PPAM prepared by the Operations Evaluation Department (OED),(iii) Project Completion Overview (PCO) prepared by the EMENA ProjectsDepartment, and (iv) information obtained from discussion with Bank staff whohave been associated with these projects.
1/ Tihama Development Project I (Credit 376-YAR).Southern Uplands Rural Development Project (Credit 545-YAR).Grain Storage and Processing Project (Credit 636-YAR).

- 66 - APPENDIX B
Page 2
L. Tihama Development Project I (Credit 376-YAR)
1.01 This project, approved in 1973, was the first IDA-assistedagricultural project in YAR. It was conceived as the first of a series ofprojects to develop the Tihama area, as the coastal region of YAR is commonlyknown. The objective of the project was to develop 17,000 ha in Wadi Zabid byimproving existing irrigation systems, increasing agricultural production andpromoting institutional development through establishing a regionaldevelopment authority. The major components included (i) irrigationimprovement, (ii) infrastructure improvements, (iii) agricultural extensionand services, (iv) credit and (v) feasibility study for developing ground andsurface water resources in Wadi Mawr (now being executed as Tihama ProjectIII).
Main Achievements
1.02 This project provided the first organized extension service in YAR.The project has been quite successful in terms of agricultural extension andresearch and improvement of existing irrigation systems. The TihamaDevelopment Authority (TDA) was established as the implementing organizationfor the project and it has become a reasonably effective organization. Atpresent it is the implementing agency for three follow-up IDA-assistedagricultural projects in the area. Extension staff trained under this projecthave been a source of recruitment for other projects as well.
Major Problems
1.03 Shortage of skilled personnel continued to affect the project'simplementation. For instance, at the end of 1977 there was not even a singleYemeni civil engineer working in the project and the posts of Yemeni Directorsof Engineering, Agriculture, Finance and Administrat!on in the TDA which werevacant had to be filled belatedly by expatriates. Although extension workproceeded well, links with the Agricultural Credit Fund (ACF) were not wellcoordinated. The ACF itself, established in 1975 as an independent entity,applied too rigid standard of lendingg This was later rectified, and farmersin the project area began to utilize credit for inputs and equipment. Theproject management had difficulty in timely expenditure of project funds,hiring of staff and provision of budget. Delays in recruitment and increasingrecurrent costs due to inflation affected project implementation.
Lessons Learned
1.04 The project was developed at the early stages of YAR's developmentprocess when there was a lack of strong institutions, know-how and manpowernecessary to implement a major development program. Given these constraints,a strategy for a stage-by-stage development of the whole Tihama region wasdevised. This strategy provided a learning experience useful in a series ofprojects that followed (Tihama II, III and IV).

- 67 -
APPENDIX BPage 3
1.05 The lessons learned from the design and implementation of thisproject have been considered in the designing of the subsequent projects. Inparticular, the agricultural development and irrigation schemes of Tihama II,III and IV are based on knowledge learned in the design, construction andoperation of the first project (Tihama I).
1.06 Another lesson learned was the coordination between the moderntechnology of irrigation supply systems and the centuriee-old existingdistribution patterns. The Tihama region already had centuries-old system fordistributing water through simple, temporary earthen dikes. Water rights weregoverned by the Jeberti decree which set very specific patterns ofdistribution. Therefore, sensitivity to the traditional water rights andirrigation practices is essential, and a less risky and less drastic approachshould be devised in every phase of planning and implementation. Furthermore,the involvement of a sociologist who is knowledgeable of the area customs andtraditions in the identification and preparation of the project is veryuseful.
1.07 Changes in the scope of the project are well reflected in the seriesof Tihama Development Projects. Whereas Tihama I Project contained verylittle investment in social infrastructure, the follow-up projects includeinvestments in access roads and rural water supply schemes.
Conclusion
1.08 The improvement of existing spate irrigation and the provision ofagriculturaL extension services, applied research and demonstration andagricultural credit for modern inputs resulted in a substantial increase inproduction. with, consequent higher income for farm families. The goal ofestablishing TD* as an institution for agricultural development has been wellachieved by the project and this institution in carrying out the follow-upIDA-assisted projects in the Tihama region.
2. Southern Uplands Rural Development Project (Cr. 545)
2.01 This was the second IDA-assisted agricultural project. This firstintegrated rural development project in YAR was started in 1979 and completedin 1982. The main objectives were: (a) to raise agricultural productivity on50,000 ha of land in the Southern Uplands region of the country in the
* Governorates of Ibb and Taiz, and (b) to improve the condition of rural lifeof about 21,000 farm families.
2.02 The project components were: (1) provision of agriculturalcredit, (ii) establishment and training of an extension service(iii) improvement of livestock production through disease control,(iv) improvement of existing small gravity irrigation systems,(v) construction of feeder roads, and (vi) installation of village watersupply systems.
- 68 -APPENDIX BPage 4
Major Problems
2.03 Labor migration to neighboring oil-rich countries led to an acutelabor shortage, thereby resulting in a considerable increase in wages. Thehigh rate of inflation escalated the costs of civil works, drilling andmaterials much faster than anticipated. Consequently, project costs increasedsubstantially above the appraisal estimates and this necessitated the scalingdown of the scope of the project components.
2.04 Initially, recruitment of capable staff was difficult and thib ladto a major weakness of project management especially in organizational andfinancial matters thereby, limiting project progress. Efforts to attractqualified Yenaenis from abroad and to retain the ones already on the staff werefurther hampered by Government salaries which were substantially lower thanthose offered in alternative employment. Some of the problems that delayedexecution of the project (i.e., labor shortages, wage escalation, high rate ofinflation and low salaries for local staff) were attributed to countrysituations and not project specific.
2.05 Major achievements include: (i) the provision of credit, (ii) theconstruction of minor irrigation and land protection works, (iii) theestablishment of an agricultural extension service ard provision of plantprotection and veterinary services and (iv) the establishment of a ruraldevelopment unit (SURDUI/). SURDU has developed into a reasonably effectiveorganization capable of sustaining development momentum. It is the executingagency for a follow-up project, i.e. SURDP II.
2.06 The project made an important impact on the development ofagriculture and infrastructure; although the 30,000 ha included was small inrelation to the needs and agricultural potential of Ibb and TaizGovernorates. With the completion of SURDP I, the conditions were created
1/ Southern Uplands Rural Development Unit.

- 69 -
APPENDIX BPage 5
for replicating and expanding the efforts started under this project and asecond phase project at an estimated cost of about US$82 million was launchedin 1981 to extend the agricultural services to about 86,000 ha.
Lessons Learned
2.07 Subsequent projects have been designed taking into accountconditions of labor shortage, rapidly expanding markets for high-value crops(e.g., fruits and vegetables), high financial liquidity ir. rural areas and apositive attitude to innovation among farmers, and some of the activities ofthe Local Development Association (LDA's) are complementary to the objectivesand activities of agricultural development.
2.08 Another lesson learned was that, even under adverse managerial and* financial conditions and with shortages of trained national staff, with
continued Government support and an innovative farm population, it is possibleto execute a relatively complex rural development project.
2.09 Management and technical personnel development under the project wasweak because: (1) the training program was not sufficiently integrated withthe personnel development needs of the project; and (2) more importantly,there was considerable staff turnover, largely due to low levels of salariesoffered in contrast to rapid inflation and more remunerative employmentopportunities elsewhere. However, recently, salaries of staff working inexternally funded projects have been raised above those of the regularMinistry staff to make the scales sufficiently attractive to retain staff.
2.10 In sum, despite its many problems which necessitated the scalingdown of project scope, generally the project has achieved its majorobjectives. Sound project design, continued Government support and farmersreceptivity to extension advice were the major factors for success. Theproject has also been successful in meeting Government objectives by launchingdevelopment in the most productive agricultural area in YAR whereenvironmental conditions and farmers receptivity were favorable. The projectfurther fulfilled IDA's objectives of contributing to the agriculturaldevelopment in YAR through institution building and filling the financialresource gap.
3. Grain Storage and Processing (Credit 636-YAR)
3.01 This project represents the first phase of a long-term program aimedat improving and expanding grain handling, and improving processing of largequantities of grain being imported by YAR. Major project components included(i) the construction of a modern port silo complex, six regional grainwarehouses, and two government-operated bakeries; (ii) credit for theimprovement and development of private bakeries; (iii) a study of nationwidestorage r .quirements and (iv) a nutrition improvement program. The YemenGeneral Grain Corporation (YGGC) was established by the Government toimplement and subsequently operate the project facilities.
Achievements
3.02 The most successful component of the project is the port silo. Theactual performance of the silo has exceeded appraisal expectations with totalgrain imports handled in 1982 exceeding 350,000 tons. The silo has provided

-70 -APPENDIX BPage 6
superior storage facilities. Significant benefits were also derived byreducing the number of days to unload grain shipments and thereby reducingfreight rates and port congestion.
3.03 The two government bakeries and the regional warehouses werecompleted substantially as planned. Only six subloans for new bakeries weremade mainly because of lack of services for installation and maintenance ofbakery equipment. The warehouses and the bakeries did not achieve theobjectives for which they were established. Three of the warehouses are usedby the bakeries as storage while the remainder are used by other institutionsand organizations; none for grain storage as originally intended.
Major Problems
3.04 The major problems were:
(i) Poor project design. The consulting engineers 'esigned a highlyautomated bakery which was difficult to maintai£i. It also reducedthe flexibility of the plant to produce types of bread acceptable tothe public.
(ii) The performance of the expatriate project manager was not up to thestandard. The project manager failed to delegate authority andfocused most of his attention on the silo complex.
(iii) Training under the project was not well coordinated to meet thetechnical and managerial needs of the project; there was no means toensure that those who received training continued to be employedunder the project.
3.05 Lessons Learned:
(a) Project design should take into account the local environment, stageof development and desires of target groups;
(b) demand for services and goods to be produced by the project shouldbe carefully evaluated before components are formulated and theirdesigns completed; and
(c) the assignment of bakery extension work and nutrition functions toan organization that was mainly established to carry out commercialactivities was inappropriate.
3.06 In view of the projected increase in grain imports, the problems ofsignificant grain losses due to inefficient handling, high import costs duL.high freight rates and the expected aggravation of port cong--;tion, IDA wasjustified in supporting the project.

- 71 -
APPENDIX BPage 7
Conclusion
3.07 The project's main component was meant to address specific needsconsidered paramount at that time. It however, fell short where the need forstudies and preparation was circumvented to save time. The management ofYGGC, which has now been in place for about two years, has recently carriedout a study in bread consumption and is in the process of recruitingconsultants to advise on and initiate the necessary changes in the productionof bread.
