yfy inc. (formerly yuen foong yu paper mfg. co., ltd.) and ... · yfy inc. (formerly yuen foong yu...
TRANSCRIPT
YFY Inc. (Formerly Yuen Foong Yu Paper Mfg. Co., Ltd.) and Subsidiaries Consolidated Financial Statements for the Years Ended December 31, 2015 and 2014 and Independent Auditors’ Report

- 1 -
DECLARATION OF CONSOLIDATION OF FINANCIAL STATEMENTS OF AFFILIATES
The companies required to be included in the consolidated financial statements of affiliates in accordance
with the “Criteria Governing Preparation of Affiliation Reports, Consolidated Business Reports and
Consolidated Financial Statements of Affiliated Enterprises” for the year ended December 31, 2015 are
all the same as the companies required to be included in the consolidated financial statements of parent
and subsidiary companies as provided in International Financial Reporting Standard No. 10,
“Consolidated Financial Statements.” Relevant information that should be disclosed in the consolidated
financial statements of affiliates has all been disclosed in the consolidated financial statements of parent
and subsidiary companies. Hence, we have not prepared a separate set of consolidated financial
statements of affiliates.
Very truly yours,
YFY INC.
(Formerly Yuen Foong Yu Paper Mfg. Co., Ltd.)
By:
MELODY CHIU
Chairman
March 18, 2016

- 2 -
INDEPENDENT AUDITORS’ REPORT
The Board of Directors and Shareholders
YFY Inc.
We have audited the accompanying consolidated balance sheets of YFY Inc. (the “Company,”
formerly Yuen Foong Yu Paper Mfg. Co., Ltd.) and its subsidiaries as of December 31, 2015 and
2014, and the related consolidated statements of comprehensive income, changes in equity and
cash flows for the years then ended. These consolidated financial statements are the responsibility
of the Company’s management. Our responsibility is to express an opinion on these consolidated
financial statements based on our audits. However, we did not audit the financial statements for
2015 and 2014 of Jupiter Prestige Group Holdings Limited and its subsidiaries, Lotus Ecoscings &
Engineering Co., Ltd., Cupid InfoTech Co., Ltd., YFY Biotech Management Company, Systax
Communication (H.K.) Ltd. and Ever Growing Agriculture Biotech Co., Ltd., and the financial
statements for 2014 of CHP International (BVI) Corporation and its subsidiaries, and Hwa Fong
Investment Co.; all of these companies are consolidated subsidiaries. The financial statements of
these subsidiaries were audited by other auditors, whose reports have been furnished to us, and our
opinion, insofar as it relates to the amounts included for these subsidiaries, is based solely on the
reports of the other auditors. The assets of these subsidiaries as of December 31, 2015 and 2014
were about 1% (NT$1,145,190 thousand) and 9% (NT$10,163,884 thousand), respectively, of total
consolidated assets. The net sales of these subsidiaries for 2015 and 2014 were about 1%
(NT$696,948 thousand) and 5% (NT$2,750,272 thousand), respectively, of total consolidated net
sales. In addition, the financial statements as of and for the years ended December 31, 2015 and
2014 of Taiwan Genome Sciences Co., Ltd., an equity-method investee of the Company, were
audited by other auditors. Thus, our opinion, insofar as it relates to the calculation of the
Company’s share in this investee’s profit or loss and other comprehensive income, is based solely
on the report of the other auditors. As of December 31, 2015 and 2014, the aggregate carrying
values of this investee were NT$3,962 thousand and NT$3,864 thousand, respectively. Included
in the Company’s net comprehensive income for 2015 and 2014 were the Company’s equity of
NT$97 thousand in this investee’s net profit and an equity of NT$553 thousand in its net loss,
respectively.
We conducted our audits in accordance with the Regulations Governing the Auditing and
Attestation of Financial Statements by Certified Public Accountants and auditing standards
generally accepted in the Republic of China. Those rules and standards require that we plan and
perform the audit to obtain reasonable assurance about whether the consolidated financial
statements are free of material misstatement. An audit includes examining, on a test basis,
evidence supporting the amounts and disclosures in the consolidated financial statements. An
audit also includes assessing the accounting principles used and significant estimates made by
management, as well as evaluating the overall consolidated financial statement presentation. We
believe that our audits and the reports of the other auditors provide a reasonable basis for our
opinion.

- 3 -
In our opinion, based on our audits and the reports of the other auditors, the consolidated financial
statements referred to above present fairly, in all material respects, the consolidated financial
position of YFY Inc. and its subsidiaries as of December 31, 2015 and 2014, and their consolidated
financial performance and their consolidated cash flows for the years then ended, in conformity
with the Regulations Governing the Preparation of Financial Reports by Securities Issuers and
International Financial Reporting Standards, International Accounting Standards, IFRIC
Interpretations, and SIC Interpretations endorsed by the Financial Supervisory Commission of the
Republic of China.
We have also audited the financial statements of the parent company, YFY Inc., as of and for the
years ended December 31, 2015 and 2014, on which we have issued a modified unqualified report.
March 25, 2016
Notice to Readers
The accompanying consolidated financial statements are intended only to present the financial
position, financial performance and cash flows in accordance with accounting principles and
practices generally accepted in the Republic of China and not those of any other jurisdictions.
The standards, procedures and practices to audit such consolidated financial statements are those
generally accepted and applied in the Republic of China.
For the convenience of readers, the auditors’ report and the accompanying consolidated financial
statements have been translated into English from the original Chinese version prepared and used
in the Republic of China. If there is any conflict between the English version and the original
Chinese version or any difference in the interpretation of the two versions, the Chinese-language
auditors’ report and consolidated financial statements shall prevail.
- 4 -
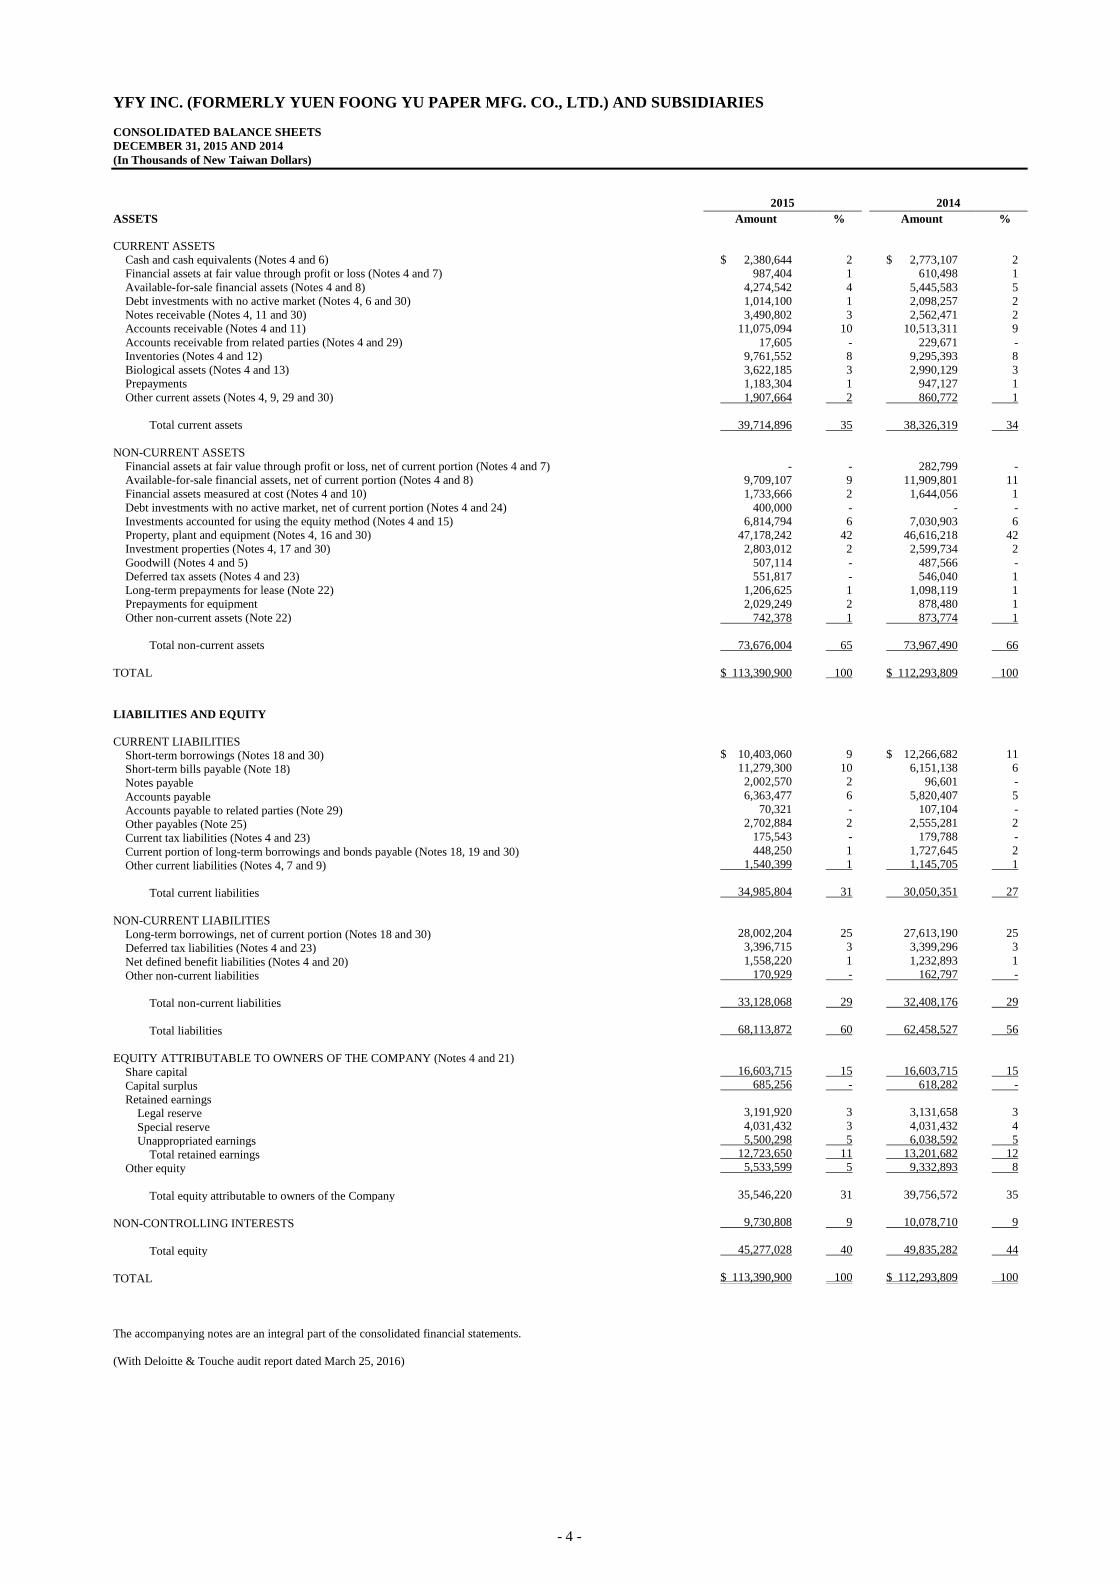
YFY INC. (FORMERLY YUEN FOONG YU PAPER MFG. CO., LTD.) AND SUBSIDIARIES
CONSOLIDATED BALANCE SHEETS
DECEMBER 31, 2015 AND 2014
(In Thousands of New Taiwan Dollars)
2015 2014
ASSETS Amount % Amount %
CURRENT ASSETS
Cash and cash equivalents (Notes 4 and 6) $ 2,380,644 2 $ 2,773,107 2
Financial assets at fair value through profit or loss (Notes 4 and 7) 987,404 1 610,498 1
Available-for-sale financial assets (Notes 4 and 8) 4,274,542 4 5,445,583 5
Debt investments with no active market (Notes 4, 6 and 30) 1,014,100 1 2,098,257 2
Notes receivable (Notes 4, 11 and 30) 3,490,802 3 2,562,471 2
Accounts receivable (Notes 4 and 11) 11,075,094 10 10,513,311 9
Accounts receivable from related parties (Notes 4 and 29) 17,605 - 229,671 -
Inventories (Notes 4 and 12) 9,761,552 8 9,295,393 8
Biological assets (Notes 4 and 13) 3,622,185 3 2,990,129 3
Prepayments 1,183,304 1 947,127 1
Other current assets (Notes 4, 9, 29 and 30) 1,907,664 2 860,772 1
Total current assets 39,714,896 35 38,326,319 34
NON-CURRENT ASSETS
Financial assets at fair value through profit or loss, net of current portion (Notes 4 and 7) - - 282,799 -
Available-for-sale financial assets, net of current portion (Notes 4 and 8) 9,709,107 9 11,909,801 11
Financial assets measured at cost (Notes 4 and 10) 1,733,666 2 1,644,056 1
Debt investments with no active market, net of current portion (Notes 4 and 24) 400,000 - - -
Investments accounted for using the equity method (Notes 4 and 15) 6,814,794 6 7,030,903 6
Property, plant and equipment (Notes 4, 16 and 30) 47,178,242 42 46,616,218 42
Investment properties (Notes 4, 17 and 30) 2,803,012 2 2,599,734 2
Goodwill (Notes 4 and 5) 507,114 - 487,566 -
Deferred tax assets (Notes 4 and 23) 551,817 - 546,040 1
Long-term prepayments for lease (Note 22) 1,206,625 1 1,098,119 1
Prepayments for equipment 2,029,249 2 878,480 1
Other non-current assets (Note 22) 742,378 1 873,774 1
Total non-current assets 73,676,004 65 73,967,490 66
TOTAL $ 113,390,900 100 $ 112,293,809 100
LIABILITIES AND EQUITY
CURRENT LIABILITIES
Short-term borrowings (Notes 18 and 30) $ 10,403,060 9 $ 12,266,682 11
Short-term bills payable (Note 18) 11,279,300 10 6,151,138 6
Notes payable 2,002,570 2 96,601 -
Accounts payable 6,363,477 6 5,820,407 5
Accounts payable to related parties (Note 29) 70,321 - 107,104 -
Other payables (Note 25) 2,702,884 2 2,555,281 2
Current tax liabilities (Notes 4 and 23) 175,543 - 179,788 -
Current portion of long-term borrowings and bonds payable (Notes 18, 19 and 30) 448,250 1 1,727,645 2
Other current liabilities (Notes 4, 7 and 9) 1,540,399 1 1,145,705 1
Total current liabilities 34,985,804 31 30,050,351 27
NON-CURRENT LIABILITIES
Long-term borrowings, net of current portion (Notes 18 and 30) 28,002,204 25 27,613,190 25
Deferred tax liabilities (Notes 4 and 23) 3,396,715 3 3,399,296 3
Net defined benefit liabilities (Notes 4 and 20) 1,558,220 1 1,232,893 1
Other non-current liabilities 170,929 - 162,797 -
Total non-current liabilities 33,128,068 29 32,408,176 29
Total liabilities 68,113,872 60 62,458,527 56
EQUITY ATTRIBUTABLE TO OWNERS OF THE COMPANY (Notes 4 and 21)
Share capital 16,603,715 15 16,603,715 15
Capital surplus 685,256 - 618,282 -
Retained earnings
Legal reserve 3,191,920 3 3,131,658 3
Special reserve 4,031,432 3 4,031,432 4
Unappropriated earnings 5,500,298 5 6,038,592 5
Total retained earnings 12,723,650 11 13,201,682 12
Other equity 5,533,599 5 9,332,893 8
Total equity attributable to owners of the Company 35,546,220 31 39,756,572 35
NON-CONTROLLING INTERESTS 9,730,808 9 10,078,710 9
Total equity 45,277,028 40 49,835,282 44
TOTAL $ 113,390,900 100 $ 112,293,809 100
The accompanying notes are an integral part of the consolidated financial statements.
(With Deloitte & Touche audit report dated March 25, 2016)
- 5 -
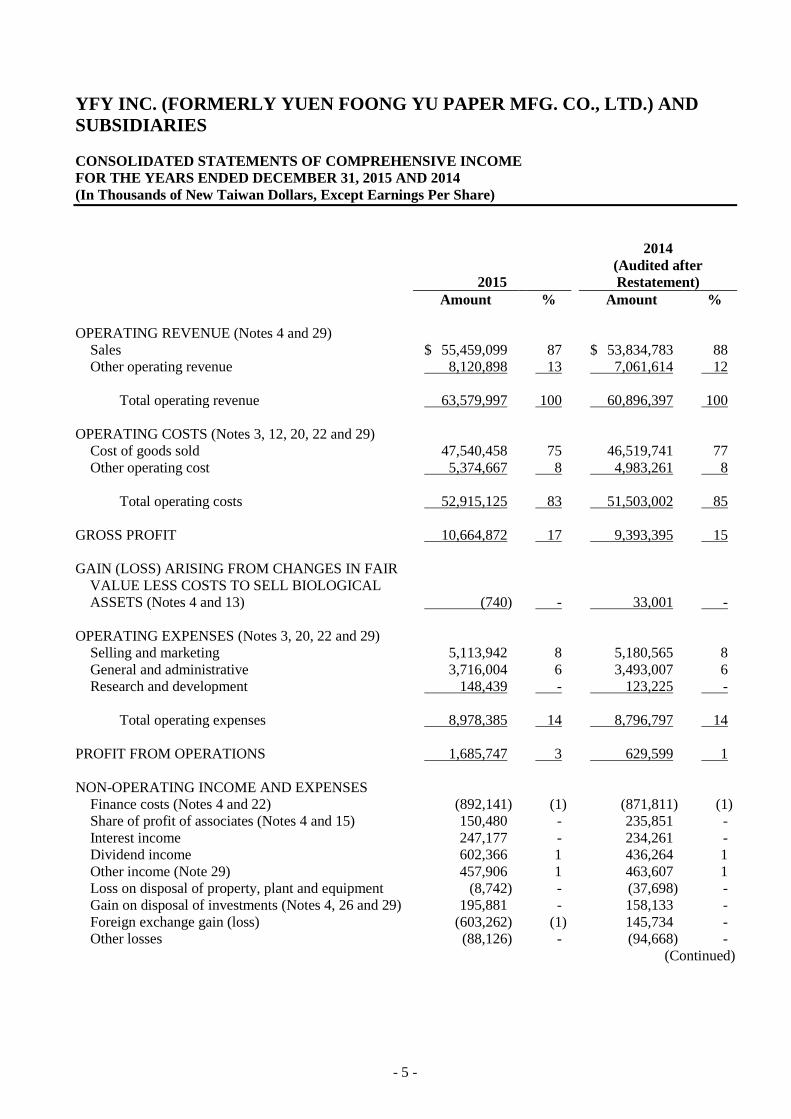
YFY INC. (FORMERLY YUEN FOONG YU PAPER MFG. CO., LTD.) AND
SUBSIDIARIES
CONSOLIDATED STATEMENTS OF COMPREHENSIVE INCOME
FOR THE YEARS ENDED DECEMBER 31, 2015 AND 2014
(In Thousands of New Taiwan Dollars, Except Earnings Per Share)
2015
2014
(Audited after
Restatement)
Amount % Amount %
OPERATING REVENUE (Notes 4 and 29)
Sales $ 55,459,099 87 $ 53,834,783 88
Other operating revenue 8,120,898 13 7,061,614 12
Total operating revenue 63,579,997 100 60,896,397 100
OPERATING COSTS (Notes 3, 12, 20, 22 and 29)
Cost of goods sold 47,540,458 75 46,519,741 77
Other operating cost 5,374,667 8 4,983,261 8
Total operating costs 52,915,125 83 51,503,002 85
GROSS PROFIT 10,664,872 17 9,393,395 15
GAIN (LOSS) ARISING FROM CHANGES IN FAIR
VALUE LESS COSTS TO SELL BIOLOGICAL
ASSETS (Notes 4 and 13) (740) - 33,001 -
OPERATING EXPENSES (Notes 3, 20, 22 and 29)
Selling and marketing 5,113,942 8 5,180,565 8
General and administrative 3,716,004 6 3,493,007 6
Research and development 148,439 - 123,225 -
Total operating expenses 8,978,385 14 8,796,797 14
PROFIT FROM OPERATIONS 1,685,747 3 629,599 1
NON-OPERATING INCOME AND EXPENSES
Finance costs (Notes 4 and 22) (892,141) (1) (871,811) (1)
Share of profit of associates (Notes 4 and 15) 150,480 - 235,851 -
Interest income 247,177 - 234,261 -
Dividend income 602,366 1 436,264 1
Other income (Note 29) 457,906 1 463,607 1
Loss on disposal of property, plant and equipment (8,742) - (37,698) -
Gain on disposal of investments (Notes 4, 26 and 29) 195,881 - 158,133 -
Foreign exchange gain (loss) (603,262) (1) 145,734 -
Other losses (88,126) - (94,668) -
(Continued)

- 6 -
YFY INC. (FORMERLY YUEN FOONG YU PAPER MFG. CO., LTD.) AND
SUBSIDIARIES
CONSOLIDATED STATEMENTS OF COMPREHENSIVE INCOME
FOR THE YEARS ENDED DECEMBER 31, 2015 AND 2014
(In Thousands of New Taiwan Dollars, Except Earnings Per Share)
2015
2014
(Audited after
Restatement)
Amount % Amount %
Loss arising on financial instruments at FVTPL
(Notes 4 and 28) $ (71,842) - $ (41,786) -
Impairment loss recognized on financial assets
(Notes 4 and 10) (48,206) - (9,955) -
Total non-operating income and expenses (58,509) - 617,932 1
PROFIT BEFORE INCOME TAX 1,627,238 3 1,247,531 2
INCOME TAX EXPENSE (Notes 3, 4 and 23) (445,044) (1) (383,474) (1)
NET PROFIT FOR THE YEAR 1,182,194 2 864,057 1
OTHER COMPREHENSIVE INCOME (LOSS)
(Notes 3, 4 and 21)
Items that will not be reclassified subsequently to
profit or loss:
Remeasurement of defined benefit plans (306,598) (1) (114,623) -
Share of the other comprehensive income (loss) of
associates (3,798) - 6,638 -
(310,396) (1) (107,985) -
Items that may be reclassified subsequently to profit
or loss:
Exchange differences on translating foreign
operations (258,802) - 1,742,460 3
Unrealized gain (loss) on available-for-sale
financial assets (3,402,530) (5) 3,955,972 7
Cash flow hedges 16,221 - (2,999) -
Share of the other comprehensive income (loss) of
associates (306,049) (1) 825,688 1
(3,951,160) (6) 6,521,121 11
Other comprehensive income (loss) for the year,
net of income tax (4,261,556) (7) 6,413,136 11
TOTAL COMPREHENSIVE INCOME (LOSS) FOR
THE YEAR $ (3,079,362) (5) $ 7,277,193 12
(Continued)

- 7 -
YFY INC. (FORMERLY YUEN FOONG YU PAPER MFG. CO., LTD.) AND
SUBSIDIARIES
CONSOLIDATED STATEMENTS OF COMPREHENSIVE INCOME
FOR THE YEARS ENDED DECEMBER 31, 2015 AND 2014
(In Thousands of New Taiwan Dollars, Except Earnings Per Share)
2015
2014
(Audited after
Restatement)
Amount % Amount %
NET PROFIT ATTRIBUTABLE TO:
Owners of the Company $ 501,904 1 $ 594,779 1
Non-controlling interests 680,290 1 269,278 -
$ 1,182,194 2 $ 864,057 1
TOTAL COMPREHENSIVE INCOME (LOSS)
ATTRIBUTABLE TO:
Owners of the Company $ (3,611,713) (6) $ 6,685,733 11
Non-controlling interests 532,351 1 591,460 1
$ (3,079,362) (5) $ 7,277,193 12
EARNINGS PER SHARE (New Taiwan dollars;
Note 24)
Basic $ 0.30 $ 0.36
Diluted $ 0.30 $ 0.36
The accompanying notes are an integral part of the consolidated financial statements.
(With Deloitte & Touche audit report dated March 25, 2016) (Concluded)

- 8 -
YFY INC. (FORMERLY YUEN FOONG YU PAPER MFG. CO., LTD.) AND SUBSIDIARIES
CONSOLIDATED STATEMENTS OF CHANGES IN EQUITY
FOR THE YEARS ENDED DECEMBER 31, 2015 AND 2014
(In Thousands of New Taiwan Dollars)
Equity Attributable to Owners of the Company
Other Equity
Exchange Unrealized
Differences on Gain (Loss) on
Share Capital Retained Earnings Translating Available-for-
Share Capital Surplus Unappropriated Foreign sale Financial Cash Flow Non-controlling
(Thousands) Amount Treasury Stock Form Merger Other Total Legal Reserve Special Reserve Earnings Total Operations Assets Hedges Total Interests Total Equity
BALANCE AT JANUARY 1, 2014 1,660,372 $ 16,603,715 $ 14,947 $ 293,124 $ 150,814 $ 458,885 $ 3,070,603 $ 4,031,432 $ 6,252,108 $ 13,354,143 $ 1,247,564 $ 1,935,199 $ (4,074 ) $ 33,595,432 $ 9,973,410 $ 43,568,842
Appropriation of the 2013 earnings
Legal reserve - - - - - - 61,055 - (61,055 ) - - - - - - -
Cash dividends distributed by the Company - - - - - - - - (664,148 ) (664,148 ) - - - (664,148 ) - (664,148 )
Cash dividends distributed by subsidiaries - - - - - - - - - - - - - - (196,020 ) (196,020 )
Adjustments for the changes in equity in associates - - - - 2,959 2,959 - - (19,805 ) (19,805 ) - - - (16,846 ) (988 ) (17,834 )
Partial acquisition of interests in subsidiaries - - - - 63,990 63,990 - - - - - - - 63,990 125,229 189,219
Adjustments for the changes in equity in subsidiaries - - - - 92,448 92,448 - - (37 ) (37 ) - - - 92,411 (414,381 ) (321,970 )
Net profit for the year ended December 31, 2014 - - - - - - - - 594,779 594,779 - - - 594,779 269,278 864,057
Other comprehensive income for the year ended December 31,
2014, net of income tax - - - - - - - - (63,250 ) (63,250 ) 1,756,546 4,399,331 (1,673 ) 6,090,954 322,182 6,413,136
Total comprehensive income for the year ended December 31,
2014 - - - - - - - - 531,529 531,529 1,756,546 4,399,331 (1,673 ) 6,685,733 591,460 7,277,193
BALANCE AT DECEMBER 31, 2014 1,660,372 16,603,715 14,947 293,124 310,211 618,282 3,131,658 4,031,432 6,038,592 13,201,682 3,004,110 6,334,530 (5,747 ) 39,756,572 10,078,710 49,835,282
Appropriation of the 2014 earnings
Legal reserve - - - - - - 60,262 - (60,262 ) - - - - - - -
Cash dividends distributed by the Company - - - - - - - - (664,148 ) (664,148 ) - - - (664,148 ) - (664,148 )
Cash dividends distributed by subsidiaries - - - - - - - - - - - - - - (296,799 ) (296,799 )
Adjustments for the changes in equity of associates - - - - 42,082 42,082 - - (1,465 ) (1,465 ) - - - 40,617 2,644 43,261
Partial acquisition of interests in subsidiaries - - - - 19,287 19,287 - - - - - - - 19,287 (577,930 ) (558,643 )
Adjustments for the changes in equity of subsidiaries - - - - 5,605 5,605 - - - - - - - 5,605 (8,168 ) (2,563 )
Net profit for the year ended December 31, 2015 - - - - - - - - 501,904 501,904 - - - 501,904 680,290 1,182,194
Other comprehensive income for the year ended December 31,
2015, net of income tax - - - - - - - - (314,323 ) (314,323 ) (280,019 ) (3,532,903 ) 13,628 (4,113,617 ) (147,939 ) (4,261,556 )
Total comprehensive loss for the year ended December 31, 2015 - - - - - - - - 187,581 187,581 (280,019 ) (3,532,903 ) 13,628 (3,611,713 ) 532,351 (3,079,362 )
BALANCE AT DECEMBER 31, 2015 1,660,372 $ 16,603,715 $ 14,947 $ 293,124 $ 377,185 $ 685,256 $ 3,191,920 $ 4,031,432 $ 5,500,298 $ 12,723,650 $ 2,724,091 $ 2,801,627 $ 7,881 $ 35,546,220 $ 9,730,808 $ 45,277,028
The accompanying notes are an integral part of the consolidated financial statements.
(With Deloitte & Touche audit report dated March 25, 2016)
- 9 -
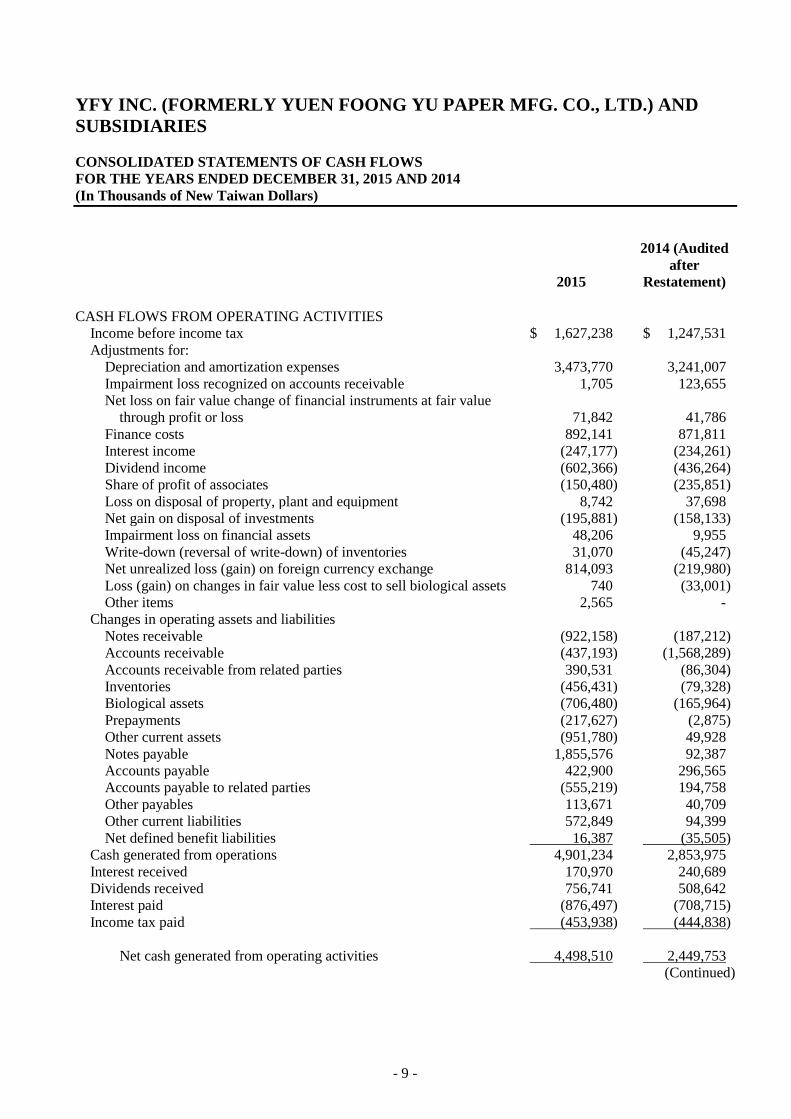
YFY INC. (FORMERLY YUEN FOONG YU PAPER MFG. CO., LTD.) AND
SUBSIDIARIES
CONSOLIDATED STATEMENTS OF CASH FLOWS
FOR THE YEARS ENDED DECEMBER 31, 2015 AND 2014
(In Thousands of New Taiwan Dollars)
2015
2014 (Audited
after
Restatement)
CASH FLOWS FROM OPERATING ACTIVITIES
Income before income tax $ 1,627,238 $ 1,247,531
Adjustments for:
Depreciation and amortization expenses 3,473,770 3,241,007
Impairment loss recognized on accounts receivable 1,705 123,655
Net loss on fair value change of financial instruments at fair value
through profit or loss 71,842 41,786
Finance costs 892,141 871,811
Interest income (247,177) (234,261)
Dividend income (602,366) (436,264)
Share of profit of associates (150,480) (235,851)
Loss on disposal of property, plant and equipment 8,742 37,698
Net gain on disposal of investments (195,881) (158,133)
Impairment loss on financial assets 48,206 9,955
Write-down (reversal of write-down) of inventories 31,070 (45,247)
Net unrealized loss (gain) on foreign currency exchange 814,093 (219,980)
Loss (gain) on changes in fair value less cost to sell biological assets 740 (33,001)
Other items 2,565 -
Changes in operating assets and liabilities
Notes receivable (922,158) (187,212)
Accounts receivable (437,193) (1,568,289)
Accounts receivable from related parties 390,531 (86,304)
Inventories (456,431) (79,328)
Biological assets (706,480) (165,964)
Prepayments (217,627) (2,875)
Other current assets (951,780) 49,928
Notes payable 1,855,576 92,387
Accounts payable 422,900 296,565
Accounts payable to related parties (555,219) 194,758
Other payables 113,671 40,709
Other current liabilities 572,849 94,399
Net defined benefit liabilities 16,387 (35,505)
Cash generated from operations 4,901,234 2,853,975
Interest received 170,970 240,689
Dividends received 756,741 508,642
Interest paid (876,497) (708,715)
Income tax paid (453,938) (444,838)
Net cash generated from operating activities 4,498,510 2,449,753
(Continued)

- 10 -
YFY INC. (FORMERLY YUEN FOONG YU PAPER MFG. CO., LTD.) AND
SUBSIDIARIES
CONSOLIDATED STATEMENTS OF CASH FLOWS
FOR THE YEARS ENDED DECEMBER 31, 2015 AND 2014
(In Thousands of New Taiwan Dollars)
2015
2014 (Audited
after
Restatement)
CASH FLOWS FROM INVESTING ACTIVITIES
Purchase of financial instruments at fair value through profit or loss $ (18,660,044) $ (14,810,185)
Proceeds of the sale of financial instruments at fair value through profit
or loss 18,502,089 14,800,791
Purchase of available-for-sale financial assets (32,588) (1,639,635)
Proceeds on sale of available-for-sale financial assets 88,582 1,260,984
Purchase of debt investments with no active market (400,000) (734,935)
Proceeds on sale of debt investments with no active market 1,053,998 -
Purchase of financial assets measured at cost (261,237) (530,306)
Proceeds on sale of financial assets measured at cost 157,156 30,104
Proceeds of the return of capital upon investees’ capital reduction on
financial assets measured at cost 23,670 29,386
Payments to acquire financial assets for hedging (7,205) -
Proceeds on sale of financial assets for hedging - 3,828
Proceeds on sale of investments accounted for using the equity method 574 -
Acquisition of subsidiaries (50,092) (85,608)
Net cash outflow on disposal of subsidiaries (6,775) (87,059)
Proceeds on return of capital on investments accounted for using the
equity method - 1,400
Payments for property, plant and equipment (4,602,832) (4,886,516)
Proceeds from disposal of property, plant and equipment 55,502 237,621
Payments for investment properties (13,219) (17,344)
Proceeds from the disposal of investment properties 89,075 113,215
Increase in prepayments for equipment (1,439,026) (441,997)
Increase in prepayments for lease (188,715) (113,099)
Decrease (increase) in other non-current assets 158,566 (271,760)
Net cash used in investing activities (5,532,521) (7,141,115)
CASH FLOWS FROM FINANCING ACTIVITIES
Repayments of short-term borrowings (1,717,438) (1,085,975)
Proceeds from short-term bills payable 5,108,369 687,341
Repayments of bond payables (1,250,000) (1,250,000)
Proceeds of long-term borrowings 140,186 6,646,695
Decrease in other non-current liabilities (16,870) (8,571)
Cash dividends paid (664,148) (664,148)
Decrease in non-controlling interest (953,395) (525,203)
Net cash generated from financing activities 646,704 3,800,139
(Continued)

- 11 -
YFY INC. (FORMERLY YUEN FOONG YU PAPER MFG. CO., LTD.) AND
SUBSIDIARIES
CONSOLIDATED STATEMENTS OF CASH FLOWS
FOR THE YEARS ENDED DECEMBER 31, 2015 AND 2014
(In Thousands of New Taiwan Dollars)
2015
2014 (Audited
after
Restatement)
EFFECTS OF EXCHANGE RATE CHANGES ON THE BALANCE
OF CASH HELD IN FOREIGN CURRENCIES $ (5,156) $ 97,764
NET DECREASE IN CASH AND CASH EQUIVALENTS (392,463) (793,459)
CASH AND CASH EQUIVALENTS AT THE BEGINNING OF THE
YEAR 2,773,107 3,566,566
CASH AND CASH EQUIVALENTS AT THE END OF THE YEAR $ 2,380,644 $ 2,773,107
The accompanying notes are an integral part of the consolidated financial statements.
(With Deloitte & Touche audit report dated March 25, 2016) (Concluded)

- 12 -
YFY INC. (FORMERLY YUEN FOONG YU PAPER MFG. CO., LTD.) AND
SUBSIDIARIES
NOTES TO CONSOLIDATED FINANCIAL STATEMENTS
FOR THE YEARS ENDED DECEMBER 31, 2015 AND 2014
(In Thousands of New Taiwan Dollars, Unless Stated Otherwise)
1. GENERAL INFORMATION
YFY Inc. (the “Company,” formerly Yuen Foong Yu Paper Mfg. Co., Ltd.) was incorporated in Kaohsiung
in February 1950. The Company’s shares have been listed on the Taiwan Stock Exchange (TSE) since
February 1977.
The Company originally manufactured, packaged, tested and sold various integrated circuit products. To
increase its competitiveness and sales through organization restructuring and specialization, the Company
spun off the assets, liabilities, and operations of its consumer products and packaging segments to its
subsidiaries, YFY Consumer Products Co., Ltd. in October 2007 and YFY Packaging Inc. in September
2005.
In addition, the Company spun off the assets, liabilities and operations of its paper and cardboard business
segment to Chung Hwa Pulp Co., Ltd. (CHPC) and acquired the shares issued by CHPC on October 1,
2012. After this transaction, CHPC became a subsidiary of the Company, and the Company became an
investment holding company, with investment and holding as its main business.
The consolidated financial statements are presented in the Company’s functional currency, the New Taiwan
dollar.
2. APPROVAL OF FINANCIAL STATEMENTS
The consolidated financial statements were approved by the Company’s board of directors on March 18,
2016.
3. APPLICATION OF NEW, AMENDED AND REVISED STANDARDS AND INTERPRETATIONS
a. Initial application of the amendments to the Regulations Governing the Preparation of Financial Reports
by Securities Issuers and the 2013 version of the International Financial Reporting Standards (IFRS),
International Accounting Standards (IAS), Interpretations of IFRS (IFRIC), and Interpretations of IAS
(SIC) endorsed by the FSC
Rule No. 1030029342 and Rule No. 1030010325 issued by the Financial Supervisory Commission
(FSC) on April 3, 2014 stipulated that the Group should apply the 2013 version of IFRS, IAS, IFRIC
and SIC (collectively, the “IFRSs”) endorsed by the FSC and the related amendments to the
Regulations Governing the Preparation of Financial Reports by Securities Issuers starting January 1,
2015.
- 13 -
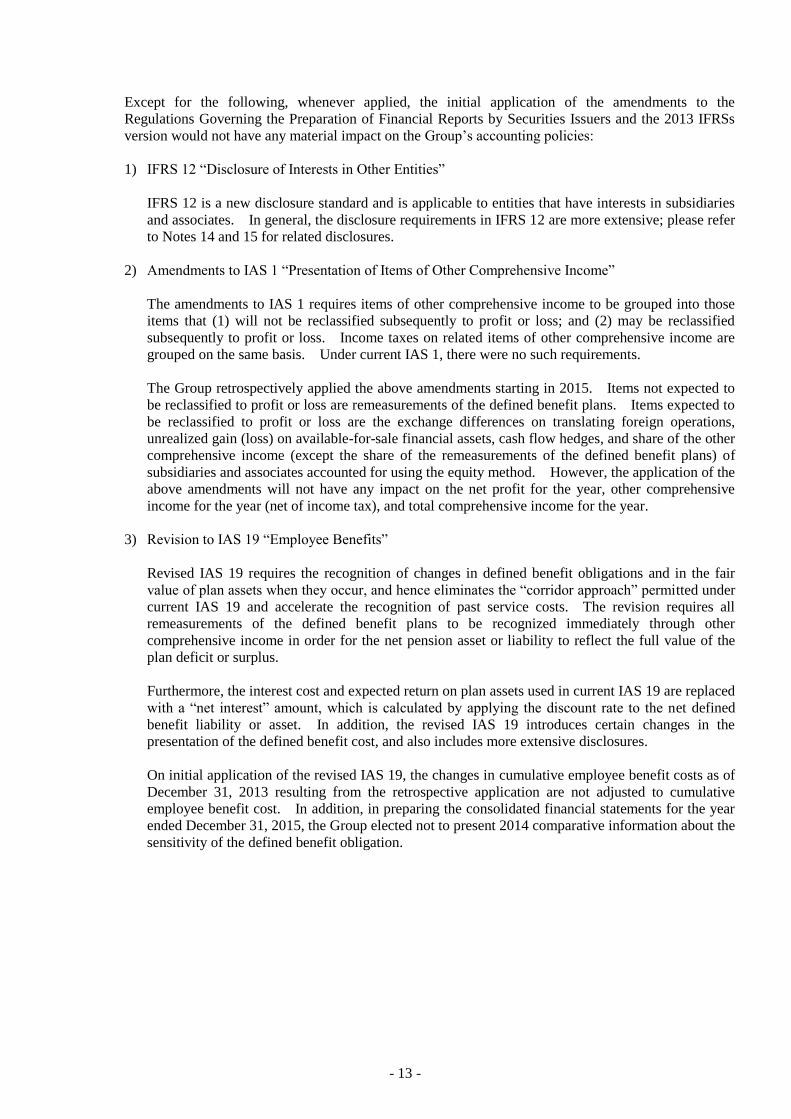
Except for the following, whenever applied, the initial application of the amendments to the
Regulations Governing the Preparation of Financial Reports by Securities Issuers and the 2013 IFRSs
version would not have any material impact on the Group’s accounting policies:
1) IFRS 12 “Disclosure of Interests in Other Entities”
IFRS 12 is a new disclosure standard and is applicable to entities that have interests in subsidiaries
and associates. In general, the disclosure requirements in IFRS 12 are more extensive; please refer
to Notes 14 and 15 for related disclosures.
2) Amendments to IAS 1 “Presentation of Items of Other Comprehensive Income”
The amendments to IAS 1 requires items of other comprehensive income to be grouped into those
items that (1) will not be reclassified subsequently to profit or loss; and (2) may be reclassified
subsequently to profit or loss. Income taxes on related items of other comprehensive income are
grouped on the same basis. Under current IAS 1, there were no such requirements.
The Group retrospectively applied the above amendments starting in 2015. Items not expected to
be reclassified to profit or loss are remeasurements of the defined benefit plans. Items expected to
be reclassified to profit or loss are the exchange differences on translating foreign operations,
unrealized gain (loss) on available-for-sale financial assets, cash flow hedges, and share of the other
comprehensive income (except the share of the remeasurements of the defined benefit plans) of
subsidiaries and associates accounted for using the equity method. However, the application of the
above amendments will not have any impact on the net profit for the year, other comprehensive
income for the year (net of income tax), and total comprehensive income for the year.
3) Revision to IAS 19 “Employee Benefits”
Revised IAS 19 requires the recognition of changes in defined benefit obligations and in the fair
value of plan assets when they occur, and hence eliminates the “corridor approach” permitted under
current IAS 19 and accelerate the recognition of past service costs. The revision requires all
remeasurements of the defined benefit plans to be recognized immediately through other
comprehensive income in order for the net pension asset or liability to reflect the full value of the
plan deficit or surplus.
Furthermore, the interest cost and expected return on plan assets used in current IAS 19 are replaced
with a “net interest” amount, which is calculated by applying the discount rate to the net defined
benefit liability or asset. In addition, the revised IAS 19 introduces certain changes in the
presentation of the defined benefit cost, and also includes more extensive disclosures.
On initial application of the revised IAS 19, the changes in cumulative employee benefit costs as of
December 31, 2013 resulting from the retrospective application are not adjusted to cumulative
employee benefit cost. In addition, in preparing the consolidated financial statements for the year
ended December 31, 2015, the Group elected not to present 2014 comparative information about the
sensitivity of the defined benefit obligation.
- 14 -
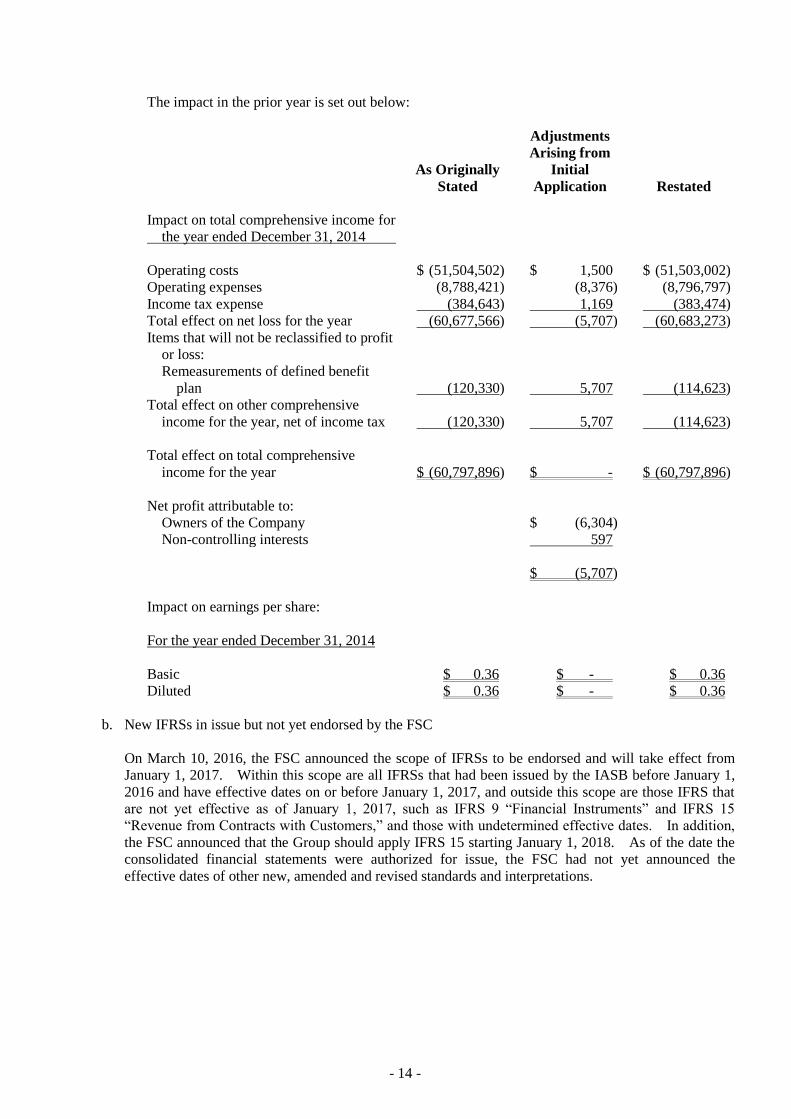
The impact in the prior year is set out below:
As Originally
Stated
Adjustments
Arising from
Initial
Application Restated
Impact on total comprehensive income for
the year ended December 31, 2014
Operating costs $ (51,504,502) $ 1,500 $ (51,503,002)
Operating expenses (8,788,421) (8,376) (8,796,797)
Income tax expense (384,643) 1,169 (383,474)
Total effect on net loss for the year (60,677,566) (5,707) (60,683,273)
Items that will not be reclassified to profit
or loss:
Remeasurements of defined benefit
plan (120,330) 5,707 (114,623)
Total effect on other comprehensive
income for the year, net of income tax (120,330) 5,707 (114,623)
Total effect on total comprehensive
income for the year $ (60,797,896) $ - $ (60,797,896)
Net profit attributable to:
Owners of the Company $ (6,304)
Non-controlling interests 597
$ (5,707)
Impact on earnings per share:
For the year ended December 31, 2014
Basic $ 0.36 $ - $ 0.36
Diluted $ 0.36 $ - $ 0.36
b. New IFRSs in issue but not yet endorsed by the FSC
On March 10, 2016, the FSC announced the scope of IFRSs to be endorsed and will take effect from
January 1, 2017. Within this scope are all IFRSs that had been issued by the IASB before January 1,
2016 and have effective dates on or before January 1, 2017, and outside this scope are those IFRS that
are not yet effective as of January 1, 2017, such as IFRS 9 “Financial Instruments” and IFRS 15
“Revenue from Contracts with Customers,” and those with undetermined effective dates. In addition,
the FSC announced that the Group should apply IFRS 15 starting January 1, 2018. As of the date the
consolidated financial statements were authorized for issue, the FSC had not yet announced the
effective dates of other new, amended and revised standards and interpretations.
- 15 -
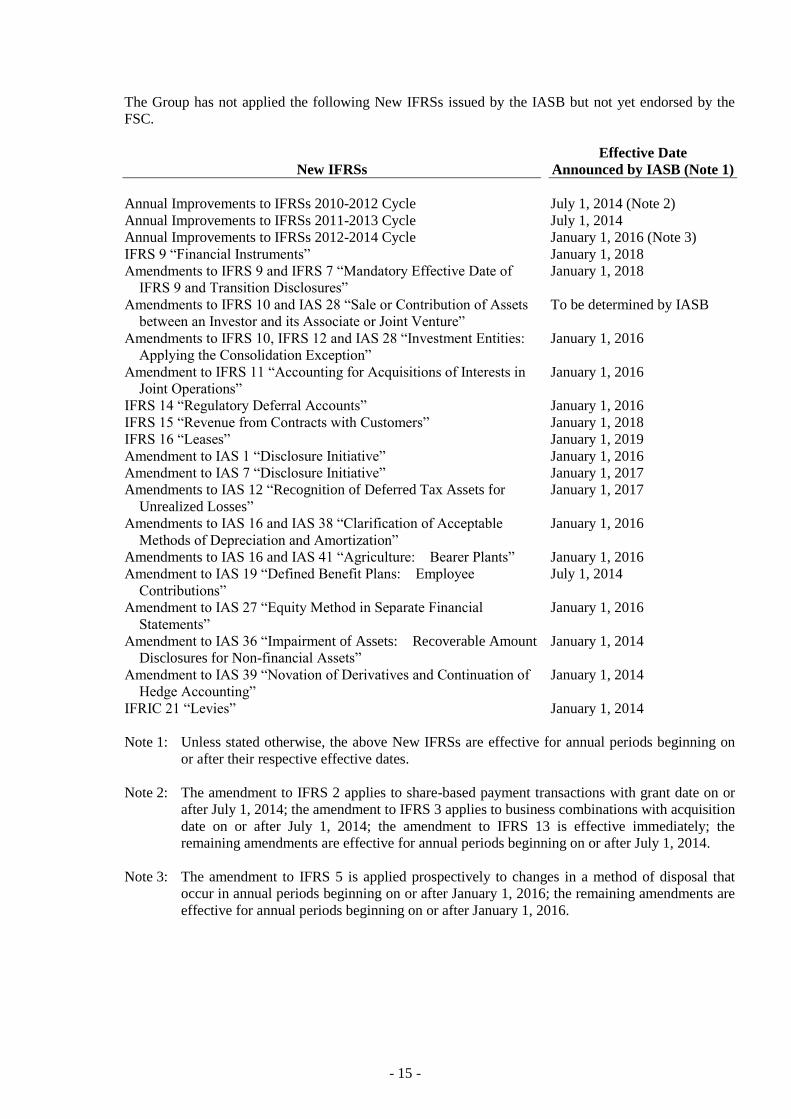
The Group has not applied the following New IFRSs issued by the IASB but not yet endorsed by the
FSC.
New IFRSs
Effective Date
Announced by IASB (Note 1)
Annual Improvements to IFRSs 2010-2012 Cycle July 1, 2014 (Note 2)
Annual Improvements to IFRSs 2011-2013 Cycle July 1, 2014
Annual Improvements to IFRSs 2012-2014 Cycle January 1, 2016 (Note 3)
IFRS 9 “Financial Instruments” January 1, 2018
Amendments to IFRS 9 and IFRS 7 “Mandatory Effective Date of
IFRS 9 and Transition Disclosures”
January 1, 2018
Amendments to IFRS 10 and IAS 28 “Sale or Contribution of Assets
between an Investor and its Associate or Joint Venture”
To be determined by IASB
Amendments to IFRS 10, IFRS 12 and IAS 28 “Investment Entities:
Applying the Consolidation Exception”
January 1, 2016
Amendment to IFRS 11 “Accounting for Acquisitions of Interests in
Joint Operations”
January 1, 2016
IFRS 14 “Regulatory Deferral Accounts” January 1, 2016
IFRS 15 “Revenue from Contracts with Customers” January 1, 2018
IFRS 16 “Leases” January 1, 2019
Amendment to IAS 1 “Disclosure Initiative” January 1, 2016
Amendment to IAS 7 “Disclosure Initiative” January 1, 2017
Amendments to IAS 12 “Recognition of Deferred Tax Assets for
Unrealized Losses”
January 1, 2017
Amendments to IAS 16 and IAS 38 “Clarification of Acceptable
Methods of Depreciation and Amortization”
January 1, 2016
Amendments to IAS 16 and IAS 41 “Agriculture: Bearer Plants” January 1, 2016
Amendment to IAS 19 “Defined Benefit Plans: Employee
Contributions”
July 1, 2014
Amendment to IAS 27 “Equity Method in Separate Financial
Statements”
January 1, 2016
Amendment to IAS 36 “Impairment of Assets: Recoverable Amount
Disclosures for Non-financial Assets”
January 1, 2014
Amendment to IAS 39 “Novation of Derivatives and Continuation of
Hedge Accounting”
January 1, 2014
IFRIC 21 “Levies” January 1, 2014
Note 1: Unless stated otherwise, the above New IFRSs are effective for annual periods beginning on
or after their respective effective dates.
Note 2: The amendment to IFRS 2 applies to share-based payment transactions with grant date on or
after July 1, 2014; the amendment to IFRS 3 applies to business combinations with acquisition
date on or after July 1, 2014; the amendment to IFRS 13 is effective immediately; the
remaining amendments are effective for annual periods beginning on or after July 1, 2014.
Note 3: The amendment to IFRS 5 is applied prospectively to changes in a method of disposal that
occur in annual periods beginning on or after January 1, 2016; the remaining amendments are
effective for annual periods beginning on or after January 1, 2016.

- 16 -
The initial application of the above New IFRSs, whenever applied, would not have any material impact
on the Group’s accounting policies, except for the following:
IFRS 9 “Financial Instruments”
Recognition and measurement of financial assets
With regards to financial assets, all recognized financial assets that are within the scope of IAS 39
“Financial Instruments: Recognition and Measurement” are subsequently measured at amortized
cost or fair value. Under IFRS 9, the requirement for the classification of financial assets is stated
below.
For the Group’s debt instruments that have contractual cash flows that are solely payments of
principal and interest on the principal amount outstanding, their classification and measurement are
as follows:
1) For debt instruments, if they are held within a business model whose objective is to collect the
contractual cash flows, the financial assets are measured at amortized cost and are assessed for
impairment continuously with impairment loss recognized in profit or loss, if any. Interest
revenue is recognized in profit or loss by using the effective interest method;
2) For debt instruments, if they are held within a business model whose objective is achieved by
both the collecting of contractual cash flows and the selling of financial assets, the financial
assets are measured at fair value through other comprehensive income (FVTOCI) and are
assessed for impairment. Interest revenue is recognized in profit or loss by using the effective
interest method, and other gain or loss shall be recognized in other comprehensive income,
except for impairment gains or losses and foreign exchange gains and losses. When the debt
instruments are derecognized or reclassified, the cumulative gain or loss previously recognized
in other comprehensive income is reclassified from equity to profit or loss.
Except for above, all other financial assets are measured at fair value through profit or loss.
However, the Group may make an irrevocable election to present subsequent changes in the fair
value of an equity investment (that is not held for trading) in other comprehensive income, with
only dividend income generally recognized in profit or loss. No subsequent impairment
assessment is required, and the cumulative gain or loss previously recognized in other
comprehensive income cannot be reclassified from equity to profit or loss.
The impairment of financial assets
IFRS 9 requires that impairment loss on financial assets is recognized by using the “Expected Credit
Losses Model”. The credit loss allowance is required for financial assets measured at amortized
cost, financial assets mandatorily measured at FVTOCI, lease receivables, contract assets arising
from IFRS 15 “Revenue from Contracts with Customers”, certain written loan commitments and
financial guarantee contracts. A loss allowance for the 12-month expected credit losses is required
for a financial asset if its credit risk has not increased significantly since initial recognition. A loss
allowance for full lifetime expected credit losses is required for a financial asset if its credit risk has
increased significantly since initial recognition and is not low. However, a loss allowance for full
lifetime expected credit losses is required for accounts receivable that do not constitute a financing
transaction.
For purchased or originated credit-impaired financial assets, the Group takes into account the
expected credit losses on initial recognition in calculating the credit-adjusted effective interest rate.
Subsequently, any changes in expected losses are recognized as a loss allowance with a
corresponding gain or loss recognized in profit or loss.
- 17 -
Hedge accounting
The main changes in hedge accounting amended the application requirements for hedge accounting
to better reflect the entity’s risk management activities. Compared with IAS 39, the main changes
include: (1) enhancing types of transactions eligible for hedge accounting, specifically broadening
the risk eligible for hedge accounting of non-financial items; (2) changing the way hedging
derivative instruments are accounted for to reduce profit or loss volatility; and (3) replacing
retrospective effectiveness assessment with the principle of economic relationship between the
hedging instrument and the hedged item.
Except for the above impact, as of the date the consolidated financial statements were authorized for
issue, the Group is continuously assessing the possible impact that the application of other standards
and interpretations will have on the Group’s financial position and financial performance, and will
disclose the relevant impact when the assessment is completed.
4. SUMMARY OF SIGNIFICANT ACCOUNTING POLICIES
a. Statement of compliance
The consolidated financial statements have been prepared in accordance with the Regulations
Governing the Preparation of Financial Reports by Securities Issuers and IFRSs as endorsed by the
FSC.
b. Basis of preparation
The consolidated financial statements have been prepared on the historical cost basis except for
financial instruments that are measured at fair values.
The fair value measurements are grouped into Levels 1 to 3 on the basis of the degree to which the fair
value measurement inputs are observable and the significance of the inputs to the fair value
measurement in its entirety; inputs by level are described as follows:
1) Level 1 inputs are quoted prices (unadjusted) in active markets for identical assets or liabilities.
2) Level 2 inputs are inputs other than quoted prices included within Level 1 that are observable for
the asset or liability, either directly (i.e., as prices) or indirectly (i.e., derived from prices).
3) Level 3 inputs are unobservable inputs on the asset or liability.
c. Classification of current and non-current assets and liabilities
Current assets include:
1) Assets held primarily for the purpose of trading;
2) Assets expected to be realized within twelve months after the reporting period; and
3) Cash and cash equivalents, unless the asset is restricted from being exchanged or used to settle a
liability for at least 12 months after the reporting period.
Current liabilities include:
1) Liabilities held primarily for the purpose of trading;

- 18 -
2) Liabilities due to be settled within twelve months after the reporting period, even if an agreement to
refinance, or to reschedule payments, on a long-term basis is completed after the reporting period
and before the consolidated financial statements are authorized for issue; and
3) Liabilities for which the Group does not have an unconditional right to defer settlement for at least
twelve months after the reporting period. Terms of a liability that could, at the option of the
counterparty, result in its settlement by the issue of equity instruments do not affect its
classification.
Assets and liabilities that are not classified as current are classified as non-current.
d. Basis of consolidation
Principles for preparing consolidated financial statements
The consolidated financial statements incorporate the financial statements of the Company and the
entities controlled by the Company.
Income and expenses of subsidiaries acquired or disposed of during the period are included in the
consolidated statement of profit or loss and other comprehensive income from the effective date of
acquisition or up to the effective date of disposal, as appropriate.
When necessary, adjustments are made to the financial statements of subsidiaries to bring their
accounting policies into line with those used by the Company.
All intra-group transactions, balances, income and expenses are eliminated in full upon consolidation.
The total comprehensive income of subsidiaries is attributed to the owners of the Company and to the
non-controlling interests even if this attribution results in the non-controlling interests having a deficit
balance.
Changes in the Group’s ownership interests in subsidiaries that do not result in the Group losing control
over the subsidiaries are accounted for as equity transactions. The carrying amounts of the Group’s
interests and the noncontrolling interests are adjusted to reflect the changes in their relative interests in
the subsidiaries. Any difference between the amount by which the noncontrolling interests are
adjusted and the fair value of the consideration paid or received is recognized directly in equity and
attributed to the owners of the Company.
When the Group loses control of a subsidiary, a gain or loss is recognized in profit or loss and is
calculated as the difference between (i) the aggregate of the fair value of the consideration received and
any investment retained in the former subsidiary at its fair value at the date when control is lost and (ii)
the assets (including any goodwill) and liabilities and any noncontrolling interests of the former
subsidiary at their carrying amounts at the date when control is lost. The Group accounts for all
amounts recognized in other comprehensive income in relation to that subsidiary on the same basis as
would be required if the Group had directly disposed of the related assets or liabilities.
The fair value of any investment retained in the former subsidiary at the date when control is lost is
regarded as the fair value on initial recognition for subsequent accounting under IAS 39 “Financial
Instruments: Recognition and Measurement,” or, when applicable, as the cost on initial recognition of
an investment in an associate.
See Note 14 and Tables 8 and 9 for more information on subsidiaries (including the percentage of
ownership and main business).

- 19 -
e. Business combinations
Acquisitions of businesses are accounted for using the acquisition method. Acquisition-related costs
are generally recognized in profit or loss as incurred.
Goodwill is measured as the excess of the sum of the consideration transferred, the amount of any
noncontrolling interests in the acquiree, and the fair value of the acquirer’s previously held equity
interest in the acquiree over the net of the acquisition-date amounts of the identifiable assets acquired
and the liabilities assumed. If, after re-assessment, the net of the acquisition-date amounts of the
identifiable assets acquired and liabilities assumed exceeds the sum of the consideration transferred, the
amount of any noncontrolling interests in the acquiree and the fair value of the acquirer’s previously
held interest in the acquiree, the excess are recognized immediately in profit or loss as a bargain
purchase gain.
Non-controlling interests that are present ownership interests and entitle their holders to a proportionate
share of the entity’s net assets in the event of liquidation may be initially measured either at fair value
or at the non-controlling interests’ proportionate share of the recognized amounts of the acquiree’s
identifiable net assets. The choice of measurement basis is made on a transaction-by-transaction basis.
Other types of non-controlling interests are measured at fair value.
Where the consideration the Group transfers in a business combination includes assets or liabilities
resulting from a contingent consideration arrangement, the contingent consideration is measured at its
acquisition-date fair value and considered as part of the consideration transferred in a business
combination. Changes in the fair value of the contingent consideration that qualify as measurement
period adjustments are adjusted retrospectively, with the corresponding adjustments being made against
goodwill or gain on bargain purchase. Measurement period adjustments are adjustments that arise
from additional information obtained during the measurement period about facts and circumstances that
existed as of the acquisition date. Measurement period does not exceed one year from the acquisition
date.
f. Foreign currencies
In preparing the financial statements of each individual group entity, transactions in currencies other
than the entity’s functional currency (foreign currencies) are recognized at the rates of exchange
prevailing at the dates of the transactions.
At the end of each reporting period, monetary items denominated in foreign currencies are retranslated
at the rates prevailing at that date. Exchange differences on monetary items arising from settlement or
translation are recognized in profit or loss in the period in which they arise.
Non-monetary items measured at fair value that are denominated in foreign currencies are retranslated
at the rates prevailing at the date when the fair value was determined. Exchange differences arising on
the retranslation of non-monetary items are included in profit or loss for the period except for exchange
differences arising from the retranslation of non-monetary items in respect of which gains and losses are
recognized directly in other comprehensive income, in which case, the exchange differences are also
recognized directly in other comprehensive income.
Non-monetary items that are measured at historical cost in a foreign currency are not retranslated.
For the purposes of presenting consolidated financial statements, the assets and liabilities of the Group’s
foreign operations (including of the subsidiaries and associates operations in other countries or
currencies used different with the Company) are translated into New Taiwan dollars using exchange
rates prevailing at the end of each reporting period. Income and expense items are translated at the
average exchange rates for the period. Exchange differences arising are recognized in other
comprehensive income attributed to the owners of the Company and noncontrolling interests as
appropriate.

- 20 -
On the disposal of a foreign operation involving loss of control over a subsidiary or loss of significant
influence over an associate, all of the exchange differences accumulated in equity in respect of that
operation attributable to the owners of the Company are reclassified to profit or loss.
In relation to a partial disposal of a subsidiary that does not result in the Company losing control over
the subsidiary, the proportionate share of accumulated exchange differences is re-attributed to
noncontrolling interests of the subsidiary and is not recognized in profit or loss. For all other partial
disposals, the proportionate share of the accumulated exchange differences recognized in other
comprehensive income is reclassified to profit or loss.
g. Inventories
Inventories consist of raw materials, supplies, finished goods and work-in-process and are stated at the
lower of cost or net realizable value. Inventory write-downs are made by item, except where it may be
appropriate to group similar or related items. Net realizable value is the estimated selling price of
inventories less all estimated costs of completion and costs necessary to make the sale. Inventories are
recorded at weighted-average cost on the balance sheet date.
h. Investments in subsidiaries
The Company uses the equity method to account for its investments in subsidiaries.
A subsidiary is an entity that is controlled by the Company.
Under the equity method, an investment in a subsidiary is initially recognized at cost and adjusted
thereafter to recognize the Company’s share of the profit or loss and other comprehensive income of the
subsidiary. The Company also recognizes the changes in the Company’s share of the equity of
subsidiaries.
Changes in the Company’s ownership interest in a subsidiary that do not result in the Company’s losing
control over the subsidiary are equity transactions. The Company recognizes directly in equity any
difference between the carrying amount of the investment and the consideration paid or received.
When the Company’s share of losses of a subsidiary exceeds its interest in that subsidiary (which
includes any carrying amount of the investment accounted for by the equity method and long-term
interests that, in substance, form part of the Company’s net investment in the subsidiary), the Company
continues recognizing its share of further losses.
Any acquisition cost in excess of the Company’s share of the net fair value of the identifiable assets and
liabilities of a subsidiary at the date of acquisition is recognized as goodwill, which is included within
the carrying amount of the investment and is not amortized. If the Company’s share of the net fair
value of the identifiable assets and liabilities exceeds the acquisition cost, this excess is recognized
immediately in profit or loss.
The Company assesses its investment for any impairment by comparing the carrying amount with the
recoverable amount as estimated on the basis of the a subsidiary’s entire financial statements.
Impairment loss is recognized when the carrying amount exceeds the recoverable amount. If the
recoverable amount of the investment subsequently increases, the Company recognizes a reversal of
impairment loss; the adjusted post-reversal carrying amount should not exceed the carrying amount that
would have been recognized (net of amortization or depreciation) had no impairment loss been
recognized in prior years. An impairment loss recognized on goodwill cannot be reversed in a
subsequent period.

- 21 -
When the Company loses control of a subsidiary, it recognizes the investment retained in the former
subsidiary at its fair value at the date when control is lost. The difference between the fair value of the
retained investment plus any consideration received and the carrying amount of previous investment at
the date when control is lost is recognized as gain or loss in profit or loss. In addition, the Company
accounts for all amounts previously recognized in other comprehensive income in relation to that
subsidiary on the same basis as would have been required had the Company directly disposed of the
related assets or liabilities.
Profits or losses resulting from downstream transactions are fully eliminated only in the parent
company’s financial statements. Profits and losses resulting from upstream transactions and
transactions between subsidiaries are also recognized only in the parent company’s financial statements
to the extent of interests in the subsidiaries that are not related to the Company.
i. Investment in associates
An associate is an entity over which the Group has significant influence and that is not a subsidiary.
Under the equity method, investments in an associate are initially recognized at cost and adjusted
thereafter to recognize the Group’s share of the profit or loss and other comprehensive income of the
associate. The Group also recognizes the changes in the Group’s share of equity of associates.
Any acquisition cost in excess of the Group’s share of the net fair value of the identifiable assets and
liabilities of an associate at the date of acquisition is recognized as goodwill, which is included within
the carrying amount of the investment and is not amortized. If the Group’s share of the net fair value
of the identifiable assets and liabilities exceeds acquisition cost, after reassessment, this excess is
recognized immediately in profit or loss.
When the Group subscribes for additional new shares of the associate at a percentage different from its
existing ownership percentage, the resulting carrying amount of the investment differs from the amount
of the Group’s proportionate interest in the associate. The Group records such a difference as an
adjustment to investments, with the corresponding amount charged or credited to capital surplus -
changes in the Group’s share of equity of associates. If the Group’s ownership interest is reduced due
to the additional subscription of the new shares of associate, the proportionate amount of the gains or
losses previously recognized in other comprehensive income in relation to that associate is reclassified
to profit or loss on the same basis as would be required if the investee had directly disposed of the
related assets or liabilities. When the adjustment should be debited to capital surplus, but the capital
surplus recognized from investments accounted for by the equity method is insufficient, the shortage is
debited to retained earnings.
When the Group’s share of losses of an associate and a joint venture equals or exceeds its interest in
that associate (which includes any carrying amount of the investment accounted for by the equity
method and long-term interests that, in substance, form part of the Group’s net investment in the
associate), the Group discontinues recognizing its share of further losses. Additional losses and
liabilities are recognized only to the extent that the Group has incurred legal obligations, or constructive
obligations, or made payments on behalf of that associate.
The entire carrying amount of the investment (including goodwill) is tested for impairment as a single
asset by comparing its recoverable amount with its carrying amount. Any impairment loss recognized
forms part of the carrying amount of the investment. Any reversal of that impairment loss is
recognized to the extent that the recoverable amount of the investment subsequently increases.
The Group discontinues the use of the equity method from the date on which its investment ceases to be
an associate. Any retained investment is measured at fair value at that date and the fair value is
regarded as its fair value on initial recognition as a financial asset. The difference between the
previous carrying amount of the associate attributable to the retained interest and its fair value is
included in the determination of the gain or loss on disposal of the associate. The Group accounts for

- 22 -
all amounts previously recognized in other comprehensive income in relation to that associate on the
same basis as would be required if that associate had directly disposed of the related assets or liabilities.
When a group entity transacts with its associate, profits and losses resulting from the transactions with
the associate are recognized in the Group’ consolidated financial statements only to the extent of
interests in the associate that are not related to the Group.
j. Property, plant and equipment
Property, plant and equipment are stated at cost, less subsequent accumulated depreciation and
subsequent accumulated impairment loss.
Properties, plant and equipment in the course of construction are carried at cost, less any recognized
impairment loss. Cost includes professional fees and borrowing costs eligible for capitalization.
Such assets are depreciated and classified to the appropriate categories of property, plant and equipment
when completed and ready for intended use.
Depreciation on property, plant and equipment is recognized using the straight-line method. Each
significant part is depreciated separately. The estimated useful lives, residual values and depreciation
method are reviewed at the end of each reporting period, with the effect of any changes in estimate
accounted for on a prospective basis.
On derecognition of an item of property, plant and equipment, the difference between the sales proceeds
and the carrying amount of the asset is recognized in profit or loss.
k. Investment properties
Investment properties are properties held to earn rentals or for capital appreciation. Investment
properties also include land held for a currently undetermined future use.
Investment properties are measured initially at cost, including transaction costs. Subsequent to initial
recognition, investment properties are measured at cost less accumulated depreciation and accumulated
impairment loss. Depreciation is recognized using the straight-line method.
On derecognition of an investment property, the difference between the net disposal proceeds and the
carrying amount of the asset is included in profit or loss.
l. Goodwill
Goodwill arising from the acquisition of a business is carried at cost as established at the date of
acquisition of the business less accumulated impairment loss.
For the purposes of impairment testing, goodwill is allocated to each of the Group’s cash-generating
units or groups of cash-generating units (referred to as cash-generating units) that is expected to benefit
from the synergies of the combination.
A cash-generating unit to which goodwill has been allocated is tested for impairment annually, or more
frequently when there is an indication that the unit may be impaired, by comparing its carrying amount,
including the attributed goodwill, with its recoverable amount. However, if the goodwill allocated to a
cash-generating unit was acquired in a business combination during the current annual period, that unit
shall be tested for impairment before the end of the current annual period. If the recoverable amount
of the cash-generating unit is less than its carrying amount, the impairment loss is allocated first to
reduce the carrying amount of any goodwill allocated to the unit and then to the other assets of the unit
pro rata based on the carrying amount of each asset in the unit. Any impairment loss is recognized
directly in profit or loss. An impairment loss recognized for goodwill is not reversed in subsequent
periods.
- 23 -
m. Impairment of tangible and intangible assets other than goodwill
At the end of each reporting period, the Group reviews the carrying amounts of its tangible and
intangible assets, excluding goodwill, to determine whether there is any indication that those assets
have suffered an impairment loss. If any such indication exists, the recoverable amount of the asset is
estimated in order to determine the extent of the impairment loss. When it is not possible to estimate
the recoverable amount of an individual asset, the Company estimates the recoverable amount of the
cash-generating unit to which the asset belongs. Corporate assets are allocated to the individual
cash-generating units on a reasonable and consistent basis of allocation.
Intangible assets with indefinite useful lives and intangible assets not yet available for use are tested for
impairment at least annually, and whenever there is an indication that the asset may be impaired.
Recoverable amount is the higher of fair value less costs to sell and value in use. If the recoverable
amount of an asset or cash-generating unit is estimated to be less than its carrying amount, the carrying
amount of the asset or cash-generating unit is reduced to its recoverable amount, and the resulting
impairment loss recognized in profit or loss.
When an impairment loss is subsequently reversed, the carrying amount of the asset or cash-generating
unit is increased to the revised estimate of its recoverable amount, but only to the extent of the carrying
amount that would have been determined had no impairment loss been recognized for the asset or
cash-generating unit in prior years. A reversal of an impairment loss is recognized in profit or loss.
n. Financial instruments
Financial assets and financial liabilities are recognized when a group entity becomes a party to the
contractual provisions of the instruments.
Financial assets and financial liabilities are initially measured at fair value. Transaction costs that are
directly attributable to the acquisition or issue of financial assets and financial liabilities (other than
financial assets and financial liabilities at fair value through profit or loss) are added to or deducted
from the fair value of the financial assets or financial liabilities, as appropriate, on initial recognition.
Transaction costs directly attributable to the acquisition of financial assets or financial liabilities at fair
value through profit or loss are recognized immediately in profit or loss.
1) Financial assets
All regular way purchases or sales of financial assets are recognized and derecognized on a trade
date basis.
a) Measurement category
Financial assets are classified into the following categories: Financial assets at fair value
through profit or loss, available-for-sale financial assets, and loans and receivables.
i. Financial assets at fair value through profit or loss
Financial assets at fair value through profit or loss are stated at fair value, with any gains or
losses arising on remeasurement recognized in profit or loss. The net gain or loss
recognized in profit or loss does not incorporate any dividend on the financial asset. Fair
value determination is described in Note 28.
- 24 -
Investments in equity instruments under financial assets at fair value through profit or loss
that do not have a quoted market price in an active market and whose fair value cannot be
reliably measured and derivatives that are linked to and must be settled by delivery of such
unquoted equity instruments are subsequently measured at cost less any identified
impairment loss at the end of each reporting period and are presented in a separate line item
as financial assets carried at cost. If, in a subsequent period, the fair value of the financial
assets can be reliably measured, the financial assets are remeasured at fair value. The
difference between the carrying amount and the fair value is recognized in profit or loss.
ii. Available-for-sale financial assets
Available-for-sale financial assets are nonderivatives that are either designated as
available-for-sale or are not classified as loans and receivables or financial assets at fair
value through profit or loss.
Available-for-sale financial assets are measured at fair value. Dividends on
available-for-sale equity investments are recognized in profit or loss. Other changes in the
carrying amount of available-for-sale financial assets are recognized in other comprehensive
income and will be reclassified to profit or loss when the investment is disposed of or is
determined to be impaired.
Dividends on available-for-sale equity instruments are recognized in profit or loss when the
Group’s right to receive the dividends is established.
Available-for-sale equity investments that do not have a quoted market price in an active
market and whose fair value cannot be reliably measured and derivatives that are linked to
and must be settled by delivery of such unquoted equity investments are measured at cost
less any identified impairment loss at the end of each reporting period and are presented in a
separate line item as financial assets carried at cost. If, in a subsequent period, the fair
value of the financial assets can be reliably measured, the financial assets are remeasured at
fair value. The difference between carrying amount and fair value is recognized in other
comprehensive income on financial assets. Any impairment losses are recognized in profit
and loss.
iii. Loans and receivables
Loans and receivables (including notes receivables, accounts receivable, cash and cash
equivalent and debt investments with no active market) are measured at amortized cost
using the effective interest method, less any impairment, except for short-term receivables
when the effect of discounting is immaterial.
Cash equivalent includes time deposits and repurchase agreements collateralized by bonds
with original maturities within three months from the date of acquisition, highly liquid,
readily convertible to a known amount of cash and be subject to an insignificant risk of
changes in value. These cash equivalents are held for the purpose of meeting short-term
cash commitments.
b) Impairment of financial assets
Financial assets, other than those at fair value through profit or loss, are assessed for indicators
of impairment at the end of each reporting period. Financial assets are considered to be
impaired when there is objective evidence that, as a result of one or more events that occurred
after the initial recognition of the financial asset, the estimated future cash flows of the
investment have been affected.

- 25 -
For financial assets carried at amortized cost, such as notes receivable and accounts receivable,
assets are assessed for impairment on a collective basis even if they were assessed not to be
impaired individually. Objective evidence of impairment for a portfolio of receivables could
include the Group’s past experience of collecting payments, as well as observable changes in
national or local economic conditions that correlate with default on receivables.
For financial assets carried at amortized cost, the amount of the impairment loss recognized is
the difference between the asset’s carrying amount and the present value of estimated future
cash flows, discounted at the financial asset’s original effective interest rate.
For financial assets measured at amortized cost, if, in a subsequent period, the amount of the
impairment loss decreases and the decrease can be related objectively to an event occurring after
the impairment was recognized, the previously recognized impairment loss is reversed through
profit or loss to the extent that the carrying amount of the investment at the date the impairment
is reversed does not exceed what the amortized cost would have been had the impairment not
been recognized.
For available-for-sale equity investments, a significant or prolonged decline in the fair value of
the security below its cost is considered to be objective evidence of impairment.
For all other financial assets, objective evidence of impairment could include significant
financial difficulty of the issuer or counterparty, breach of contract, such as a default or
delinquency in interest or principal payments, it becoming probable that the borrower will enter
bankruptcy or financial re-organization, or the disappearance of an active market for that
financial asset because of financial difficulties.
When an available-for-sale financial asset is considered to be impaired, cumulative gains or
losses previously recognized in other comprehensive income are reclassified to profit or loss in
the period.
In respect of available-for-sale equity securities, impairment loss previously recognized in profit
or loss are not reversed through profit or loss. Any increase in fair value subsequent to an
impairment loss is recognized in other comprehensive income. In respect of available-for-sale
debt securities, the impairment loss is subsequently reversed through profit or loss if an increase
in the fair value of the investment can be objectively related to an event occurring after the
recognition of the impairment loss.
For financial assets that are carried at cost, the amount of the impairment loss is measured as the
difference between the asset’s carrying amount and the present value of the estimated future
cash flows discounted at the current market rate of return for a similar financial asset. Such
impairment loss will not be reversed in subsequent periods.
The carrying amount of the financial asset is reduced by the impairment loss directly for all
financial assets with the exception of notes receivable and accounts receivable, where the
carrying amount is reduced through the use of an allowance account. When a notes receivable
and accounts receivable are considered uncollectible, it is written off against the allowance
account. Subsequent recoveries of amounts previously written off are credited against the
allowance account. Changes in the carrying amount of the allowance account are recognized
in profit or loss except for uncollectible notes receivable and accounts receivable that are written
off against the allowance account.
c) Derecognition of financial assets
The Group derecognizes a financial asset only when the contractual rights to the cash flows
from the asset expire, or when it transfers the financial asset and substantially all the risks and
rewards of ownership of the asset to another party.

- 26 -
On derecognition of a financial asset in its entirety, the difference between the asset’s carrying
amount and the sum of the consideration received and receivable and the cumulative gain or
loss that had been recognized in other comprehensive income is recognized in profit or loss.
2) Financial liabilities
a) Subsequent measurement
Except for financial liabilities at fair value through profit or loss, all the financial liabilities are
measured at amortized cost using the effective interest method. Financial liabilities are
classified as at fair value through profit or loss when the financial liability is either held for
trading or it is designated as at fair value through profit or loss.
Financial liabilities at fair value through profit or loss are stated at fair value, with any gains or
losses arising on remeasurement recognized in profit or loss. The net gain or loss recognized
in profit or loss does not incorporate any interest or dividend paid on the financial liability.
Fair value is determined in the manner described in Note 28.
b) Derecognition of financial liabilities
The difference between the carrying amount of the financial liability derecognized and the
consideration paid, including any non-cash assets transferred or liabilities assumed, is
recognized in profit or loss.
3) Derivative financial instruments
The Group enters into derivative financial instruments to manage its exposure to foreign exchange
rate risks, including foreign exchange contracts.
Derivatives are initially recognized at fair value at the date the derivative contracts are entered into
and are subsequently remeasured to their fair value at the end of each reporting period. The
resulting gain or loss is recognized in profit or loss immediately unless the derivative is designated
and effective as a hedging instrument, in which event the timing of the recognition in profit or loss
depends on the nature of the hedge relationship. When the fair value of derivative financial
instruments is positive, the derivative is recognized as a financial asset; when the fair value of
derivative financial instruments is negative, the derivative is recognized as a financial liability.
o. Hedge accounting
The Group designates certain hedging instruments as cash flow hedges. Hedges of foreign exchange
risk on firm commitments are accounted for as cash flow hedges.
The effective portion of changes in the fair value of derivatives that are designated and qualify as cash
flow hedges is recognized in other comprehensive income. The gain or loss relating to the ineffective
portion is recognized immediately in profit or loss.
The associated gains or losses that were recognized in other comprehensive income are reclassified
from equity to profit or loss as a reclassification adjustment in the line item relating to the hedged item
in the same period when the hedged item affects profit or loss. If a hedge of a forecast transaction
subsequently results in the recognition of a non-financial asset or a non-financial liability, the associated
gains and losses that were recognized in other comprehensive income are removed from equity and are
included in the initial cost of the non-financial asset or non-financial liability.

- 27 -
Hedge accounting is discontinued prospectively when the Group revokes the designated hedging
relationship, or when the hedging instrument expires or is sold, terminated, or exercised, or when it no
longer meets the criteria for hedge accounting. The cumulative gain or loss on the hedging instrument
that has been previously recognized in other comprehensive income from the period when the hedge
was effective remains separately in equity until the forecast transaction occurs. When a forecast
transaction is no longer expected to occur, the gain or loss accumulated in equity is recognized
immediately in profit or loss.
p. Provisions
Provisions, including those arising from the contractual obligation at the best estimate of the discounted
cash flow of the consideration required to settle the present obligation at the end of the reporting period,
taking into account the risks and uncertainties surrounding the obligation.
q. Revenue recognition
Revenue is measured at the fair value of the consideration received or receivable. Revenue is reduced
for estimated customer returns, rebates and other similar allowances. Sales returns are recognized at
the time of sale provided the seller can reliably estimate future returns and recognizes a liability for
returns based on past experience and other relevant factors.
1) Sale of goods
Revenue from the sale of goods is recognized when all the following conditions are satisfied:
a) The Group has transferred to the buyer the significant risks and rewards of ownership of the
goods;
b) The Group retains neither continuing managerial involvement to the degree usually associated
with ownership nor effective control over the goods sold;
c) The amount of revenue can be measured reliably;
d) It is probable that the economic benefits associated with the transaction will flow to the Group;
and
e) The costs incurred or to be incurred in respect of the transaction can be measured reliably.
The Group does not recognize sales revenue on materials delivered to subcontractors because this
delivery does not involve a transfer of risks and rewards of materials ownership.
2) Rendering of services
Revenue from a contract to provide services is recognized by reference to the stage of completion of
the contract or when services are provided.
3) Dividend and interest income
Dividend income from investments is recognized when the shareholder’s right to receive payment
has been established provided that it is probable that the economic benefits will flow to the Group
and the amount of income can be measured reliably.
Interest income from a financial asset is recognized when it is probable that the economic benefits
will flow to the Group and the amount of income can be measured reliably. Interest income is
accrued on a time basis, by reference to the principal outstanding and at the effective interest rate
applicable.
- 28 -
r. Borrowing costs
Borrowing costs directly attributable to the acquisition, construction or production of qualifying assets
are added to the cost of those assets, until such time as the assets are substantially ready for their
intended use or sale.
Other than stated above, all other borrowing costs are recognized in profit or loss in the period in which
they are incurred.
s. Employee benefits
1) Short-term employee benefits
Liabilities recognized for short-term employee benefits are measured at the undiscounted amount of
the benefits expected to be paid in exchange for the related service.
2) Retirement benefits
Payments to defined contribution retirement benefit plans are recognized as an expense when
employees have rendered service entitling them to the contributions.
Defined benefit costs (including service cost, net interest and remeasurement) under the defined
benefit retirement benefit plans are determined using the projected unit credit method. Service
cost (including current service cost) and net interest on the net defined benefit liability (asset) are
recognized as employee benefits expense in the period they occur. Remeasurement, comprising
actuarial gains and losses and the return on plan assets (excluding interest), is recognized in other
comprehensive income in the period in which they occur. Remeasurement recognized in other
comprehensive income is reflected immediately in retained earnings and will not be reclassified to
profit or loss.
Net defined benefit liability (asset) represents the actual deficit (surplus) in the Group’s defined
benefit plan. Any surplus resulting from this calculation is limited to the present value of any
refunds from the plans or reductions in future contributions to the plans.
t. Taxation
Income tax expense represents the sum of the tax currently payable and deferred tax.
1) Current tax
According to the Income Tax Law, an additional tax at 10% of unappropriated earnings is provided
for as income tax in the year the shareholders approve to retain the earnings.
Adjustments of prior years’ tax liabilities are added to or deducted from the current year’s tax
provision.
2) Deferred tax
Deferred tax is recognized on temporary differences between the carrying amounts of assets and
liabilities and the corresponding tax bases used in the computation of taxable profit.
Deferred tax liabilities are generally recognized for all taxable temporary differences. Deferred tax
assets are generally recognized for all deductible temporary differences and unused loss carry
forward to the extent that it is probable that taxable profits will be available against which those
deductible temporary differences can be utilized.

- 29 -
Deferred tax liabilities are recognized for taxable temporary differences associated with investments
in subsidiaries and associates, except where the Group is able to control the reversal of the
temporary difference and it is probable that the temporary difference will not reverse in the
foreseeable future. Deferred tax assets arising from deductible temporary differences associated
with such investments and interests are only recognized to the extent that it is probable that there
will be sufficient taxable profits against which to utilize the benefits of the temporary differences
and they are expected to reverse in the foreseeable future.
The carrying amount of deferred tax assets is reviewed at the end of each reporting period and
reduced to the extent that it is no longer probable that sufficient taxable profits will be available to
allow all or part of the asset to be recovered. A previously unrecognized deferred tax asset is also
reviewed at the end of each reporting period and recognized to the to the extent that it has become
probable that future taxable profit will allow the deferred tax asset to be recovered.
Deferred tax liabilities and assets are measured at the tax rates that are expected to apply in the
period in which the liability is settled or the asset realized, based on tax rates (and tax laws) that
have been enacted or substantively enacted by the end of the reporting period. The measurement
of deferred tax liabilities and assets reflects the tax consequences that would follow from the
manner in which the Group expects, at the end of the reporting period, to recover or settle the
carrying amount of its assets and liabilities.
3) Current and deferred tax for the year
Current and deferred tax are recognized in profit or loss, except when they relate to items that are
recognized in other comprehensive income or directly in equity, in which case, the current and
deferred tax are also recognized in other comprehensive income or directly in equity respectively.
u. Biological assets
Biological assets are measured at cost plus transaction costs on initial recognition, and subsequently
measured at fair value less costs to sell. The gains and losses arising from the change in fair value less
costs to sell are recognized in profit or loss when they are incurred.
Agricultural produce harvested from biological assets is initially measured at fair value less costs to sell
at the point of harvest, subsequently transferred to inventory and accounted for accordingly.
5. CRITICAL ACCOUNTING JUDGMENTS AND KEY SOURCES OF ESTIMATION
UNCERTAINTY
In the application of the Group's accounting policies, management is required to make judgments, estimates
and assumptions about the carrying amounts of assets and liabilities that are not readily apparent from other
sources. The estimates and associated assumptions are based on historical experience and other factors
that are considered relevant. Actual results may differ from these estimates.
The estimates and underlying assumptions are reviewed on an ongoing basis. Revisions to accounting
estimates are recognized in the period in which the estimate is revised if the revision affects only that period
or in the period of the revision and future periods if the revision affects both current and future periods.
- 30 -
a. Impairment of goodwill
Determining whether goodwill is impaired requires an estimation of the value in use of the
cash-generating units to which goodwill has been allocated. The value in use calculation requires
management to estimate the future cash flows expected to arise from the cash-generating unit and a
suitable discount rate in order to calculate present value. Where the actual future cash flows are less
than expected, a material impairment loss may arise.
As of December 31, 2015 and 2014, the book value of goodwill are $507,114 thousand and $487,566
thousand, respectively.
b. Income taxes
Due to the unpredictability of future profit streams, the carrying amount of deferred tax assets in
relation to unused tax losses, unused tax credits and deductible temporary differences are not
recognized as deferred tax assets, please refer to Note 23.
The realizability of the deferred tax asset mainly depends on whether sufficient future profits or taxable
temporary differences will be available. In cases where the actual future profits generated are less than
expected, a material reversal of deferred tax assets may arise, which would be recognized in profit or
loss for the period in which such a reversal takes place.
c. Fair value of financial instruments
As described in Note 28, the Group’s management uses its judgment in selecting an appropriate
valuation technique for financial instruments that do not have quoted market price in an active market.
Valuation techniques commonly used by market practitioners are applied. For derivative financial
instruments, assumptions were based on quoted market rates adjusted for specific features of the
instruments. The Group’s management believes that the chosen valuation techniques and assumptions
used are appropriate in determining the fair value of financial instruments.
d. Impairment of property, plant and equipment
The impairment of equipment in relation to the production of was based on the recoverable amount of
those assets, which is the higher of fair value less costs to sell or value-in-use of those assets. Any
changes in the market price or future cash flows will affect the recoverable amount of those assets and
may lead to recognition of additional or reversal of impairment losses.
e. Recognition and measurement of defined benefit plans
Net defined benefit liabilities (assets) and the resulting defined benefit costs under defined benefit
pension plans are calculated using the projected unit credit method. Actuarial assumptions comprise
the discount rate, rate of employee turnover, and future salary increase, etc. Changes in economic
circumstances and market conditions will affect these assumptions and may have a material impact on
the amount of the expense and the liability.
f. Biological assets
On initial recognition and at the end of the reporting period, biological assets are measured at fair value
less costs to sell. Fair value is the amount at which an asset could be exchanged, or a liability settled,
between knowledgeable, willing parties in an arm’s-length transaction. Costs to sell refer to transport
and other costs incurred to take the assets to the market. Estimations of fair value and costs to sell
may be significantly influenced by changes in market conditions.
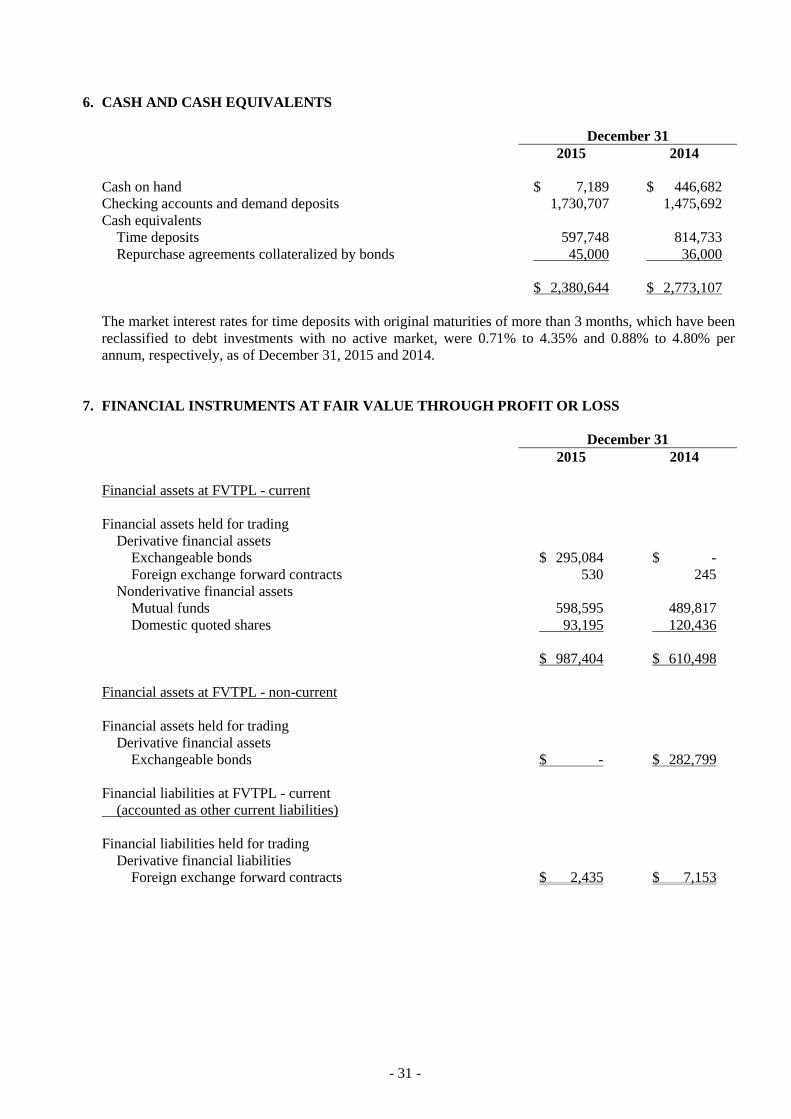
- 31 -
6. CASH AND CASH EQUIVALENTS
December 31
2015 2014
Cash on hand $ 7,189 $ 446,682
Checking accounts and demand deposits 1,730,707 1,475,692
Cash equivalents
Time deposits 597,748 814,733
Repurchase agreements collateralized by bonds 45,000 36,000
$ 2,380,644 $ 2,773,107
The market interest rates for time deposits with original maturities of more than 3 months, which have been
reclassified to debt investments with no active market, were 0.71% to 4.35% and 0.88% to 4.80% per
annum, respectively, as of December 31, 2015 and 2014.
7. FINANCIAL INSTRUMENTS AT FAIR VALUE THROUGH PROFIT OR LOSS
December 31
2015 2014
Financial assets at FVTPL - current
Financial assets held for trading
Derivative financial assets
Exchangeable bonds $ 295,084 $ -
Foreign exchange forward contracts 530 245
Nonderivative financial assets
Mutual funds 598,595 489,817
Domestic quoted shares 93,195 120,436
$ 987,404 $ 610,498
Financial assets at FVTPL - non-current
Financial assets held for trading
Derivative financial assets
Exchangeable bonds $ - $ 282,799
Financial liabilities at FVTPL - current
(accounted as other current liabilities)
Financial liabilities held for trading
Derivative financial liabilities
Foreign exchange forward contracts $ 2,435 $ 7,153
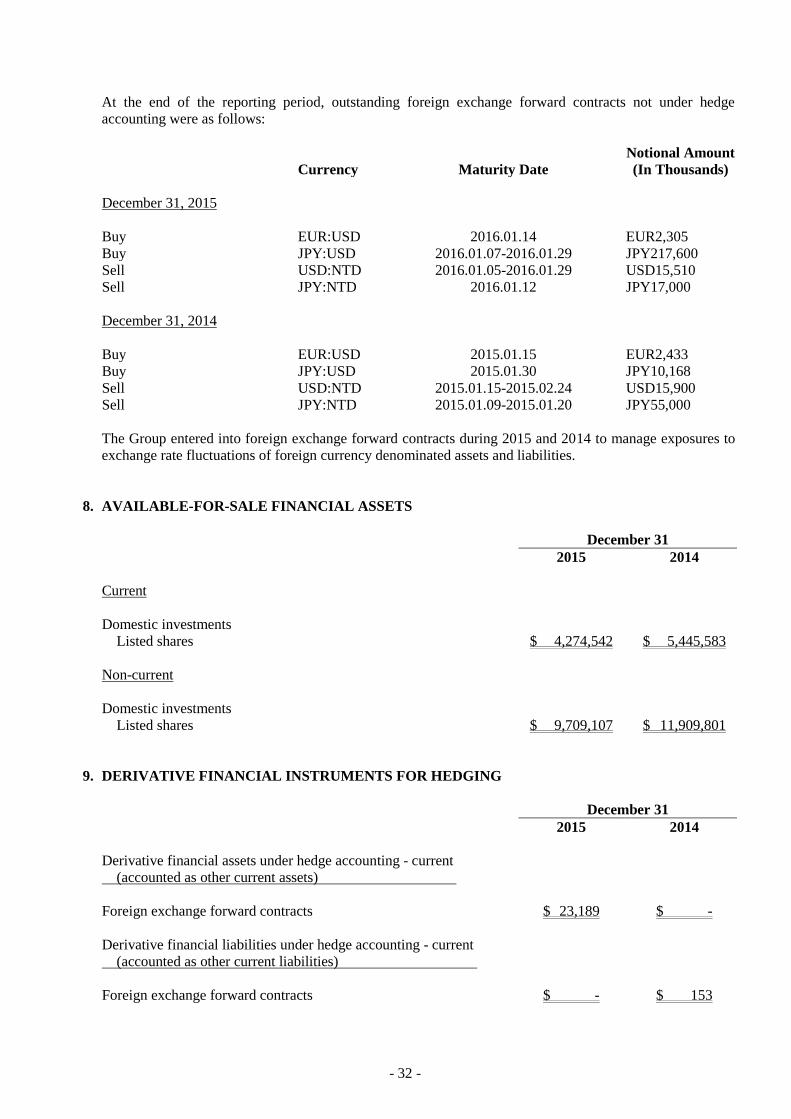
- 32 -
At the end of the reporting period, outstanding foreign exchange forward contracts not under hedge
accounting were as follows:
Currency Maturity Date
Notional Amount
(In Thousands)
December 31, 2015
Buy EUR:USD 2016.01.14 EUR2,305
Buy JPY:USD 2016.01.07-2016.01.29 JPY217,600
Sell USD:NTD 2016.01.05-2016.01.29 USD15,510
Sell JPY:NTD 2016.01.12 JPY17,000
December 31, 2014
Buy EUR:USD 2015.01.15 EUR2,433
Buy JPY:USD 2015.01.30 JPY10,168
Sell USD:NTD 2015.01.15-2015.02.24 USD15,900
Sell JPY:NTD 2015.01.09-2015.01.20 JPY55,000
The Group entered into foreign exchange forward contracts during 2015 and 2014 to manage exposures to
exchange rate fluctuations of foreign currency denominated assets and liabilities.
8. AVAILABLE-FOR-SALE FINANCIAL ASSETS
December 31
2015 2014
Current
Domestic investments
Listed shares $ 4,274,542 $ 5,445,583
Non-current
Domestic investments
Listed shares $ 9,709,107 $ 11,909,801
9. DERIVATIVE FINANCIAL INSTRUMENTS FOR HEDGING
December 31
2015 2014
Derivative financial assets under hedge accounting - current
(accounted as other current assets)
Foreign exchange forward contracts $ 23,189 $ -
Derivative financial liabilities under hedge accounting - current
(accounted as other current liabilities)
Foreign exchange forward contracts $ - $ 153

- 33 -
The Group’s hedge strategy is to enter foreign exchange forward contracts to avoid its foreign currency
exposure to certain foreign currency receipts and payments and to manage its foreign currency exposure in
relation to foreign currency forecast sales and purchases. When forecast sales and purchases actually take
place, the carrying amounts of the non-financial hedged items will be adjusted accordingly.
The terms of the foreign exchange forward contracts were negotiated to match the terms of the respective
designated hedged items. The outstanding foreign exchange forward contracts at the end of the reporting
period were as follows:
Currency Maturity Date
Notional Amount
(In Thousands)
December 31, 2015
Buy EUR:NTD 2016.01.04-2016.03.09 EUR22,613
Buy USD:NTD 2016.01.14-2016.03.17 USD15,713
December 31, 2014
Buy EUR:NTD 2015.01.15 EUR375
10. FINANCIAL ASSETS MEASURED AT COST
December 31
2015 2014
Non-current
Domestic and foreign unlisted shares $ 1,616,258 $ 1,559,519
Domestic emerging market shares 78,176 46,451
Foreign beneficiary certificates 39,232 38,086
$ 1,733,666 $ 1,644,056
Classified according to financial asset measurement categories
Available-for-sale financial assets $ 1,733,666 $ 1,644,056
Management believed that the above unlisted equity investments held by the Group, whose fair value
cannot be reliably measured due to the range of reasonable fair value estimates was so significant; therefore
they were measured at cost less impairment at the end of reporting period.
The Group recognized impairment losses on financial assets measured at cost of $48,206 thousand in 2015
and $9,955 thousand in 2014.
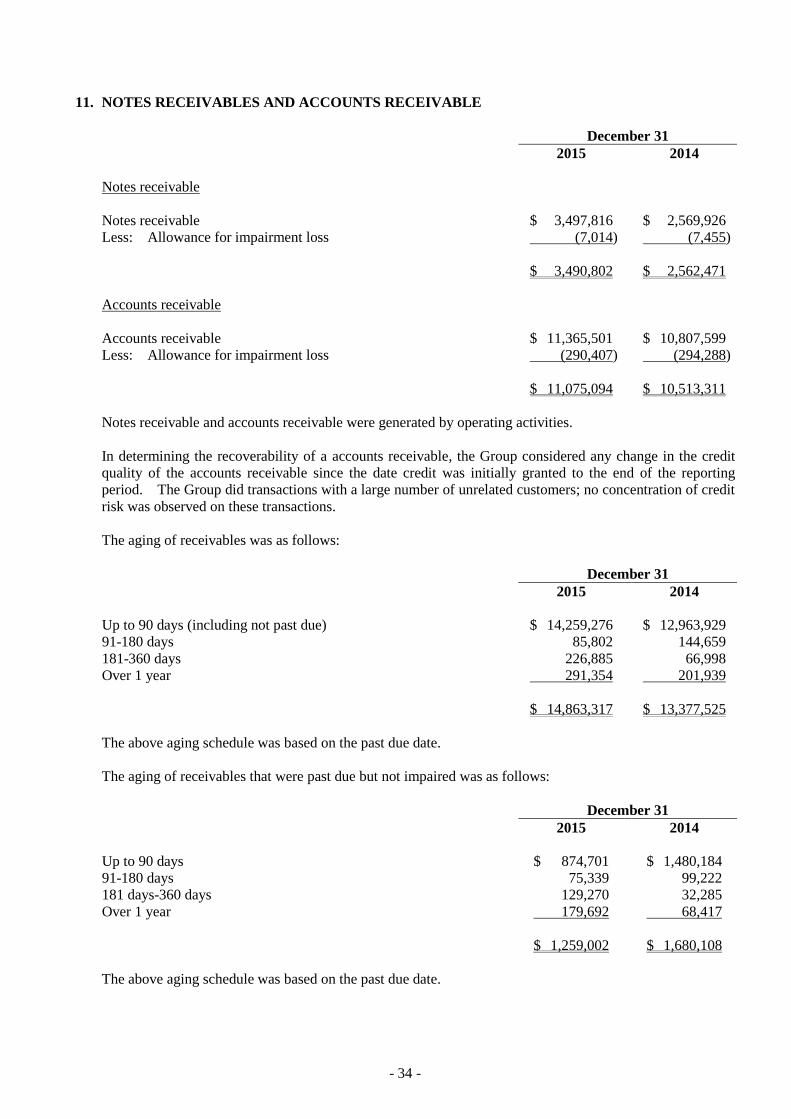
- 34 -
11. NOTES RECEIVABLES AND ACCOUNTS RECEIVABLE
December 31
2015 2014
Notes receivable
Notes receivable $ 3,497,816 $ 2,569,926
Less: Allowance for impairment loss (7,014) (7,455)
$ 3,490,802 $ 2,562,471
Accounts receivable
Accounts receivable $ 11,365,501 $ 10,807,599
Less: Allowance for impairment loss (290,407) (294,288)
$ 11,075,094 $ 10,513,311
Notes receivable and accounts receivable were generated by operating activities.
In determining the recoverability of a accounts receivable, the Group considered any change in the credit
quality of the accounts receivable since the date credit was initially granted to the end of the reporting
period. The Group did transactions with a large number of unrelated customers; no concentration of credit
risk was observed on these transactions.
The aging of receivables was as follows:
December 31
2015 2014
Up to 90 days (including not past due) $ 14,259,276 $ 12,963,929
91-180 days 85,802 144,659
181-360 days 226,885 66,998
Over 1 year 291,354 201,939
$ 14,863,317 $ 13,377,525
The above aging schedule was based on the past due date.
The aging of receivables that were past due but not impaired was as follows:
December 31
2015 2014
Up to 90 days $ 874,701 $ 1,480,184
91-180 days 75,339 99,222
181 days-360 days 129,270 32,285
Over 1 year 179,692 68,417
$ 1,259,002 $ 1,680,108
The above aging schedule was based on the past due date.

- 35 -
For the accounts receivable that were past due at the end of the reporting period, the Group did not
recognize an allowance for impairment loss, because there was no significant change in credit quality and
the amounts were still considered recoverable. The Group held collaterals or other credit enhancements
for these receivables.
The movements of the allowance for doubtful accounts receivable were as follows:
Balance at January 1, 2015 $ 301,743
Add: Impairment losses recognized on receivables 1,705
Deduct: Amounts written off during the period as uncollectible (11,027)
Foreign exchange translation gains and losses 5,000
Balance at December 31, 2015 $ 297,421
Balance at January 1, 2014 $ 212,920
Add: Impairment losses recognized on receivables 123,655
Deduct: Amounts written off during the period as uncollectible (39,845)
Foreign exchange translation gains and losses 5,013
Balance at December 31, 2014 $ 301,743
The aging of individually impaired receivables was as follows:
December 31
2015 2014
Up to 90 days $ 26,112 $ 52,469
91-180 days 10,463 45,437
181-360 days 97,615 34,713
Over 1 year 111,662 133,522
$ 245,852 $ 266,141
The above aging of accounts receivable before deducting the allowance for impairment was presented
based on the past due date.
The carrying amount of notes receivable pledged as collateral for the portion of guarantees provided on
certain commitments was disclosed in Note 30.
12. INVENTORIES
December 31
2015 2014
Finished and purchased goods $ 4,827,539 $ 4,757,803
Work in process 3,858,927 3,614,580
Materials 1,073,469 916,551
Construction-in-progress 1,617 6,459
$ 9,761,552 $ 9,295,393
The cost of inventories recognized as cost of goods sold for the years ended December 31, 2015 and 2014
included inventory write-downs of $31,070 thousand and reversal of inventory write-downs of $45,247
thousand, respectively. Previous write-downs were reversed as a result of increased selling prices.

- 36 -
13. BIOLOGICAL ASSETS
For the Year Ended December 31
2015 2014
Balance at January 1 $ 2,990,129 $ 2,842,999
Increases due to planting 845,818 165,964
Gain (loss) arising from changes in fair value less costs to sell (740) 33,001
Decreases due to harvest (139,338) (216,091)
Net exchange differences (73,684) 164,256
Balance at December 31 $ 3,622,185 $ 2,990,129
The Group’s biological assets are eucalyptus located in Guangdong Province, Zhaoqing city. The
eucalyptus is mainly grown for paper manufacturing.
The fair values of biological assets (before deducting costs to sell) were as follows:
Eucalyptus
(Level 3)
Balance at January 1, 2015 $ 3,072,341
Recognized in profit or loss - unrealized (770)
Net exchange differences - recognized in other comprehensive income (75,781)
Increases due to planting 879,610
Decreases due to harvest (144,905)
Balance at December 31, 2015 $ 3,730,495
14. SUBSIDIARIES
a. Subsidiaries included in the consolidated financial statements (diagram of investment structure of the
Group in December 31, 2015, please refer to Table 1):
Proportion of Ownership
December 31
Investor Investee Main Business 2015 2014 Remark
YFY Inc. Chung Hwa Pulp Corporation Manufacture and sale of pulp 56.90 56.90
YFY International BVI Corp. Investment and holding 100.00 100.00
YFY Global Investment BVI Corp. Investment and holding 100.00 100.00
YFY Consumer Products Co., Ltd. Production and sale of high quality paper and
paper - related merchandise
100.00 100.00
Shin Foong Chemical Industry Co.,
Ltd.
Production and sale of SBR (styrene butadiene
rubber) latex
56.70 56.70
China Color Printing Co., Ltd. Design and print of magazines, posters and
books
49.70 49.70 7)
YFY Venture Capital Investment Co.,
Ltd.
Investment and holding 100.00 100.00
Effion Enertech Co., Ltd. To operate cogeneration and provide power
technology
49.00 49.00
YFY Capital Co., Ltd. Sale of paper and paper-related merchandise 100.00 100.00
YFY Operation Management
Consulting Co., Ltd.
Consulting 100.00 100.00
Union Paper Co., Ltd. Manufacture and sale of paper 18.90 18.90 7)
YFY Paradigm Investment Co., Ltd. Investment and holding 100.00 100.00
San Ying Enterprise Co., Ltd. Design and construct water processing
construction and environmental facilities
100.00 100.00
Lotus Ecoscings & Engineering Co.,
Ltd.
Construction of sewage treatment plants and
incinerators
100.00 100.00
Eihoyo Shoji Co., Ltd. Trade of paper, chemical material and
machinery
100.00 100.00
(Continued)

- 37 -
Proportion of Ownership
December 31
Investor Investee Main Business 2015 2014 Remark
Yuen Yan Paper Container Co., Ltd. Sale and manufacture of corrugated paper and
materials
50.90 50.90
Cupid InfoTech Co., Ltd. a. To provide service in information software
and information processing.
b. Wholesale of information software and
electric appliance.
100.00 100.00
YFY International BVI YFY Cayman Co., Ltd. Investment and holding 100.00 100.00
Corp. Guangdong Ding Feng Pulp & Paper
Co., Ltd.
The marketing business of pulp, writing and
printing paper, and wood free.
40.00 40.00
Zhaoqing Ding Feng Forestry Ltd. Seedling cultivation and sales, reforestation,
sales-cum-forest logging and other forestry,
processing and transportation.
13.50 13.50
Hwa Fong Paper (H.K.) Ltd. Sale and print of paper merchandise 100.00 100.00
YFY BioTechnology (Kunshan) Co.,
Ltd.
To promote agriculture skills and operate in
trade of agriculture products
- 52.20 8)
Systax Communication (H.K.) Ltd. Sale and print of paper merchandise 100.00 100.00
YFY Paper Mfg. (Jiangyin) Co., Ltd. Manufacture, sale and print of cardboard and
paper
94.00 94.00
Yuen Foong Yu Blue Economy
Natural Resource (Yangzhou) Co.,
Ltd.
Development the technology of agricultural
resource recycling
100.00 100.00
YFY Biopulp Technology Limited Investment and holding 60.00 60.00
Yuen Foong Yu Blue
Economy Natural
Resource (Yangzhou)
Co., Ltd.
YFY Firstpak Packaging (YangZhou)
Co., Ltd.
General trade 70.00 70.00 1)
YFY Mauritius Corp. YFY Paper Mfg. (Yangzhou) Co.,
Ltd.
Manufacture and sale of paper 85.50 85.50
YFY Packaging (Yangzhou)
Investment Co., Ltd.
Investment and holding 100.00 100.00
YFY Paper Enterprise (Qingdao) Co.,
Ltd.
Manufacture and sale of paper and card board 100.00 100.00
YFY Paper Enterprise (Kunshan) Co.,
Ltd.
Manufacture and sale of paper and card board 100.00 100.00
YFY Paper Enterprise (Zhongshan)
Co., Ltd.
Manufacture and sale of paper and card board 100.00 100.00
YFY Paper Enterprise (Guangzhou)
Co., Ltd.
Manufacture and sale of paper and card board 93.80 93.80
YFY Paper Enterprise (Dongguan)
Co., Ltd.
Manufacture and sale of paper and card board 100.00 100.00
YFY Paper Enterprise (Tianjin) Co.,
Ltd.
Manufacture and sale of paper and card board 100.00 100.00
YFY Paper Enterprise (Suzhou) Co.,
Ltd.
Manufacture and sale of paper and card board 100.00 100.00
YFY Paper Enterprise (Xiamen) Co.,
Ltd.
Manufacture and sale of paper and card board 100.00 100.00
YFY Paper Enterprise (Shanghai)
Co., Ltd.
Manufacture and sale of paper and card board 100.00 100.00
YFY Paper Enterprise (Jiaxing) Co.,
Ltd.
Manufacture and sale of paper and card board 100.00 100.00
YFY Paper Enterprise (Nanjing) Co.,
Ltd.
Manufacture and sale of paper and card board 90.00 90.00
YFY Paper Enterprise (Fuzhou) Co.,
Ltd.
Manufacture and sale of paper and card board 100.00 100.00
YFY Packaging
(Yangzhou)
Investment Co., Ltd.
YFY Paper Mfg. (Yangzhou) Co.,
Ltd.
Manufacture and sale of paper 14.50 14.50
Hwa Fong Paper (H.K.)
Ltd.
Shenzhen Systax Paper Co., Ltd. Sale of paper merchandise and import/export
business
100.00 100.00
YFY Cayman Co., Ltd. YFY International Labuan Co., Ltd. Investment and holding 100.00 100.00
YFY Mauritius Corp. Investment and holding 60.00 60.00
YFY Packaging Capital Corp. Investment and holding 100.00 - 2)
YFY International Labuan YFY Jupiter (BVI) Inc. Investment and holding 38.62 39.15
Co., Ltd. YFY Packaging Inc. Production and sale of high-quality craft paper
and corrugated paper
100.00 100.00
YFY Jupiter (BVI) Inc. Mobius 105 Ltd. Investment and holding 100.00 100.00
YFY Jupiter Ltd. Design of packaging and sale of paper 100.00 100.00
Jupiter Prestige Group Holdings
Limited
Investment and holding 57.00 57.00
YFY Jupiter US, Inc. Design of packaging and sale of paper 100.00 100.00
Mobius 105 (HK) Ltd. Design of packaging and sale of paper 100.00 100.00
YFY Jupiter US, Inc. Innovativ Packaging Worldwide, LLC Design of packaging and sale of paper 51.00 - 3)
Mobius 105 Ltd. YFY Jupiter (Shenzhen) Ltd. Design of packaging and sale of paper 100.00 100.00
YFY Jupiter (Shenzhen)
Ltd.
Kunshan YFY Jupiter Green
Packaging Ltd.
Design of packaging and sale of paper 100.00 100.00
YFY Jupiter Supply Chain
Management Services (Shenzhen)
Limited
Design of packaging and sale of paper 100.00 - 10)
(Continued)

- 38 -
Proportion of Ownership
December 31
Investor Investee Main Business 2015 2014 Remark
Jupiter Prestige Group Rimagine Limited Investment and holding 100.00 100.00
Holdings Limited Jupiter Prestige Group Europe Ltd. Graphic design 100.00 100.00
Jupiter Prestige Group Australia PTY
Ltd.
Graphic design 100.00 100.00
Opal BPM Limited Design of process system and assistance of
graphic design
82.50 82.50
Foster and Balyis (Prestige) Ltd. Graphic design - 33.30 9)
Jupiter Prestige Group North America
Inc. (formerly YFY Jupiter Inc.)
Design of packaging and sale of paper 100.00 100.00
Rimagine Limited Rimagine Group Limited Investment and holding 100.00 100.00
Rimagine Design (Shanghai) Co.,
Ltd.
Photograph 100.00 100.00
Jupiter Prestige Group
Europe Ltd.
Jupiter Prestige Group Asia Ltd. Graphic design 100.00 100.00
Opal BPM Limited Opal BPM India Private Limited Workflow system coding 100.00 - 12)
YFY Paper Enterprise
(Guangzhou) Co., Ltd.
Kunshan YFY Advertising and
Printing Co., Ltd.
Design and print of advertisements 50.00 50.00
YFY Paper Enterprise
(Xiamen) Co., Ltd.
Kunshan YFY Advertising and
Printing Co., Ltd.
Design and print of advertisements 50.00 50.00
Kunshan YFY Advertising
and Printing Co., Ltd.
Shanghai YFY Advertising and
Printing Co., Ltd.
Printing service of publications 51.00 51.00
YFY Packaging Inc. YFY Packaging (BVI) Corp. Investment and holding 100.00 100.00
Pek Crown Paper Co., Ltd. Manufacture and sale of containers 66.80 66.80
YFY Packaging (BVI)
Corp.
YFY Mauritius Corp. Investment and holding 40.00 40.00
YFY Global Investment YFY RFID Co., Ltd. Investment and holding 100.00 100.00
BVI Corp. YFY Jupiter (BVI) Inc. Investment and holding 38.62 39.15
YFY RFID Technologies Co., Ltd. Investment and holding 100.00 100.00
YFY RFID Co., Ltd. Arizon RFID Technology (Yangzhou)
Co., Ltd.
Sale and design RFID (radio frequency
identification) products
100.00 100.00
Arizon RFID Technology
(Yangzhou) Co., Ltd.
Yeon Technologies (Yang Zhou) Co.,
Ltd.
Sale and design RFID (radio frequency
identification) products
100.00 - 4)
YFY RFID Technologies
Co., Ltd.
Yeon Technologies Co., Ltd. Sale and design of RFID (radio frequency
identification) products
100.00 100.00
YFY Consumer Products
Co., Ltd.
Yuen Foong Yu Comsumer Products
Investment Limited (formerly
Trifaith Ltd.)
Investment and holding 100.00 100.00
Ever Growing Agriculture Biotech
Co., Ltd.
Wholesale of agriculture products 55.40 55.40
Livebricks Inc. Information processing services 75.00 75.00
Yuen Foong Shop Company Limited Sale of paper 50.00 100.00 5)
Yuen Foong Yu
Comsumer Products
Investment Limited
(formerly Trifaith Ltd.)
YFY Investment Co., Ltd. Investment and holding and sale of paper 100.00 100.00
YFY Investment Co., Ltd. YFY Family Paper (Beijing) Co., Ltd. Manufacture and sale of tissue paper and
napkins
100.00 100.00
YFY Family Care (Kunshan) Co.,
Ltd.
Manufacture and sale of tissue paper and
napkins
100.00 100.00
Yuen Foong Yu Consumer Product
(Yangzhou) Co., Ltd.
Manufacture and sale of high quality tissue
paper and napkin
100.00 100.00
YFY Capital Co., Ltd. Chung Hwa Pulp Corporation Manufacture and sale of pulp 0.10 0.10
YFY Venture Capital Effion Enertech Co., Ltd. Sale and manufacture of TFT-LCD 1.00 1.00
Investment Co., Ltd. Chung Hwa Pulp Corporation Manufacture and sale of pulp 0.64 - 11)
Effion Enertech Co., Ltd. YFY Capital Holdings Corp. Investment and holding 100.00 100.00
YFY Capital Holdings
Corp.
YFY (Shanghai) Financial Services
Co., Ltd.
Export factoring, domestic factoring, business
factoring and related consulting services,
develop credit risk management platform.
100.00 100.00
YFY Paradigm Investment Union Paper Co., Ltd. Manufacture and sale of paper 4.00 4.00 7)
Co., Ltd. YFY Biotech Management Company Consulting 100.00 100.00
Chung Hwa Pulp Corporation Pulp and paper production, trading and forestry
business
0.70 0.70
Yuen Foong Shop Company Limited Sale of paper 50.0 - 5)
Yuen Foong Shop
Company Limited
Shanghai YFY International Trade
Co., Ltd.
General trade 100.0 - 6)
Lotus Ecoscings &
Engineering Co., Ltd.
Yuen Yan Paper Container Co., Ltd. Sale and manufacture of corrugated paper and
materials
0.07 0.07
Shin Foong Chemical Industry Co.,
Ltd.
Production and sale of SBR (styrene butadiene
rubber) latex
0.01 0.01
Pek Crown Paper Co., Ltd. Manufacture and sale of containers 0.03 0.03
Chung Hwa Pulp Corporation Pulp and paper production, trading and forestry
business
0.01 0.01
San Ying Enterprise Co.,
Ltd.
Kunshan Actview Carbon
Technology Co., Ltd.
Manufacture and sale of active carbon 66.40 66.40
Chung Hwa Pulp CHP International (BVI) Corporation Investment and holding 100.00 100.00
Corporation Effion Enertech Co., Ltd. To operate cogeneration and provide power
technology
49.00 49.00
Hwa Fong Investment Co., Ltd. Investment and holding 100.00 100.00
(Continued)
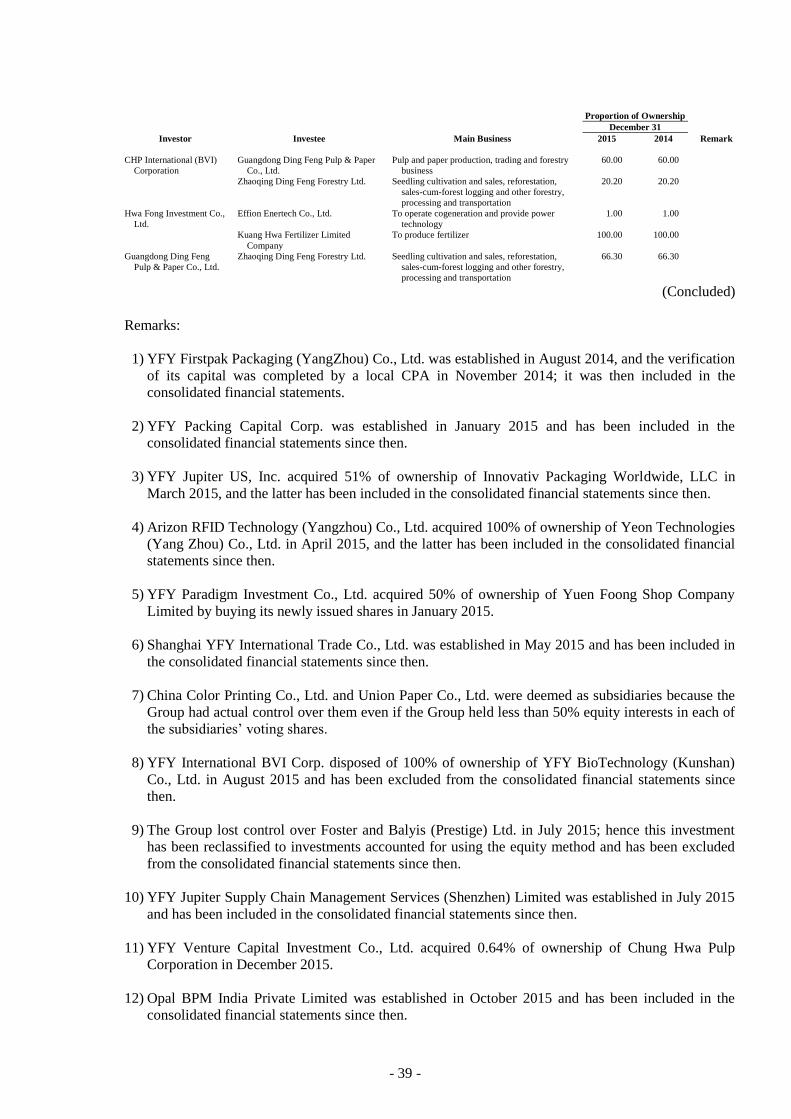
- 39 -
Proportion of Ownership
December 31
Investor Investee Main Business 2015 2014 Remark
CHP International (BVI)
Corporation
Guangdong Ding Feng Pulp & Paper
Co., Ltd.
Pulp and paper production, trading and forestry
business
60.00 60.00
Zhaoqing Ding Feng Forestry Ltd. Seedling cultivation and sales, reforestation,
sales-cum-forest logging and other forestry,
processing and transportation
20.20 20.20
Hwa Fong Investment Co.,
Ltd.
Effion Enertech Co., Ltd. To operate cogeneration and provide power
technology
1.00 1.00
Kuang Hwa Fertilizer Limited
Company
To produce fertilizer 100.00 100.00
Guangdong Ding Feng
Pulp & Paper Co., Ltd.
Zhaoqing Ding Feng Forestry Ltd. Seedling cultivation and sales, reforestation,
sales-cum-forest logging and other forestry,
processing and transportation
66.30 66.30
(Concluded)
Remarks:
1) YFY Firstpak Packaging (YangZhou) Co., Ltd. was established in August 2014, and the verification
of its capital was completed by a local CPA in November 2014; it was then included in the
consolidated financial statements.
2) YFY Packing Capital Corp. was established in January 2015 and has been included in the
consolidated financial statements since then.
3) YFY Jupiter US, Inc. acquired 51% of ownership of Innovativ Packaging Worldwide, LLC in
March 2015, and the latter has been included in the consolidated financial statements since then.
4) Arizon RFID Technology (Yangzhou) Co., Ltd. acquired 100% of ownership of Yeon Technologies
(Yang Zhou) Co., Ltd. in April 2015, and the latter has been included in the consolidated financial
statements since then.
5) YFY Paradigm Investment Co., Ltd. acquired 50% of ownership of Yuen Foong Shop Company
Limited by buying its newly issued shares in January 2015.
6) Shanghai YFY International Trade Co., Ltd. was established in May 2015 and has been included in
the consolidated financial statements since then.
7) China Color Printing Co., Ltd. and Union Paper Co., Ltd. were deemed as subsidiaries because the
Group had actual control over them even if the Group held less than 50% equity interests in each of
the subsidiaries’ voting shares.
8) YFY International BVI Corp. disposed of 100% of ownership of YFY BioTechnology (Kunshan)
Co., Ltd. in August 2015 and has been excluded from the consolidated financial statements since
then.
9) The Group lost control over Foster and Balyis (Prestige) Ltd. in July 2015; hence this investment
has been reclassified to investments accounted for using the equity method and has been excluded
from the consolidated financial statements since then.
10) YFY Jupiter Supply Chain Management Services (Shenzhen) Limited was established in July 2015
and has been included in the consolidated financial statements since then.
11) YFY Venture Capital Investment Co., Ltd. acquired 0.64% of ownership of Chung Hwa Pulp
Corporation in December 2015.
12) Opal BPM India Private Limited was established in October 2015 and has been included in the
consolidated financial statements since then.

- 40 -
b. Details of subsidiaries that have material non-controlling interests
Proportion of Ownership and
Voting Rights Held by
Non-controlling Interests
December 31
Name of Subsidiary 2015 2014
Chung Hwa Pulp Corporation 41.62% 42.26%
See Table 8 and Table 9 for the information on place of incorporation and principal place of business.
The summarized financial information below represents amounts before intragroup eliminations:
Chung Hwa Pulp Corporation and subsidiaries
December 31
2015 2014
Current assets $ 13,080,307 $ 13,785,306
Non-current assets 17,345,832 15,698,716
Current liabilities (7,770,394) (6,257,192)
Non-current liabilities (3,553,031) (3,274,549)
Equity 19,102,714 19,952,281
Consolidated adjustments 94,109 94,109
Adjusted equity $ 19,196,823 $ 20,046,390
Equity attributable to:
Owners of Chung Hwa Pulp Corporation $ 9,692,265 $ 10,070,031
Non-controlling interests of Chung Hwa Pulp Corporation 6,911,301 7,371,359
Non-controlling interests of Chung Hwa Pulp Corporation’s
subsidiaries 2,593,257 2,605,000
$ 19,196,823 $ 20,046,390
For the Year Ended December 31
2015 2014
Revenue $ 20,990,843 $ 21,144,930
Profit for the year $ 845,778 $ 11,677
Other comprehensive income for the year (379,152) 851,116
Total comprehensive income for the year $ 466,626 $ 862,793
Profit attributable to:
Owners of Chung Hwa Pulp Corporation $ 450,202 $ 18,044
Non-controlling interests of Chung Hwa Pulp Corporation 329,515 9,452
Non-controlling interests of Chung Hwa Pulp Corporation’s
subsidiaries 66,061 (15,819)
$ 845,778 $ 11,677
(Continued)

- 41 -
For the Year Ended December 31
2015 2014
Total comprehensive income attributable to:
Owners of Chung Hwa Pulp Corporation $ 276,197 $ 424,668
Non-controlling interests of Chung Hwa Pulp Corporation 202,172 310,836
Non-controlling interests of Chung Hwa Pulp Corporation’s
subsidiaries (11,743) 127,289
$ 466,626 $ 862,793
Net cash inflow (outflow) from:
Operating activities $ 1,559,761 $ 734,265
Investing activities (1,609,449) (1,038,206)
Financing activities 21,066 300,665
Effects of exchange rate changes (2,811) 6,773
Net cash inflow (outflow) $ (31,433) $ 3,497
Dividends paid to non-controlling interest $ 51,681 $ -
Return of capital reduction paid to non-controlling interest $ 504,137 $ -
(Concluded)
15. INVESTMENTS ACCOUNTED FOR USING THE EQUITY METHOD
December 31
2015 2014
Material associates
E Ink Holdings Inc. $ 4,573,588 $ 4,572,971
Associates that are not individually material 2,241,206 2,457,932
$ 6,814,794 $ 7,030,903
a. Material associates
Proportion of Ownership and
Voting Rights
December 31
Name of Associate 2015 2014
E Ink Holdings Inc. 16.2% 16.2%
Refer to Table 8 “Information on Investees” for the nature of activities, principal place of business and
country of incorporation of the associates.
The investments in E Ink Holdings Inc. was accounted for by the equity method since the Group had
significant influence over E Ink Holdings Inc. even if the Company held less than 20% of the investee’s
voting shares.

- 42 -
In 2013, the Group increased its investment in E Ink Holdings Inc. by buying 40,000 thousand shares of
the investee’s privately placed common shares for $658,000 thousand. Under related regulations,
privately placed common shares should not be transferred within three years from the date of
acquisition. The other rights and obligations are the same as those of common stocks.
Fair values of investments in associates for which there are published price quotation are summarized as
follows (exclude the privately placed common shares), based on the closing price of those investments
at the balance sheet date:
December 31
Name of Associate 2015 2014
E Ink Holdings Inc. $ 2,664,104 $ 2,112,000
The summarized financial information below represents amounts shown in the associates’ financial
statements prepared in accordance with IFRSs adjusted by the Group for equity accounting purposes:
E Ink Holdings Inc.
December 31
2015 2014
Current assets $ 13,730,805 $ 15,882,253
Non-current assets 19,694,421 23,114,071
Current liabilities (6,036,805) (9,112,824)
Non-current liabilities (804,891) (3,328,026)
Equity 26,583,530 26,555,474
Non-controlling interests 96,281 120,524
$ 26,679,811 $ 26,675,998
Proportion of the Group’s ownership 16.2% 16.2%
Equity attributable to the Group $ 4,320,128 $ 4,319,511
Goodwill 253,460 253,460
Carrying amount $ 4,573,588 $ 4,572,971
For the Year Ended December 31
2015 2014
Operating revenue $ 13,306,503 $ 13,498,720
Profit from continuing operations $ 2,429,173 $ 1,942,431
Loss from discontinued operations (1,861,568) (1,888,222)
Net profit for the year 567,605 54,209
Other comprehensive income (481,085) 934,274
Total comprehensive income for the year $ 86,520 $ 988,483
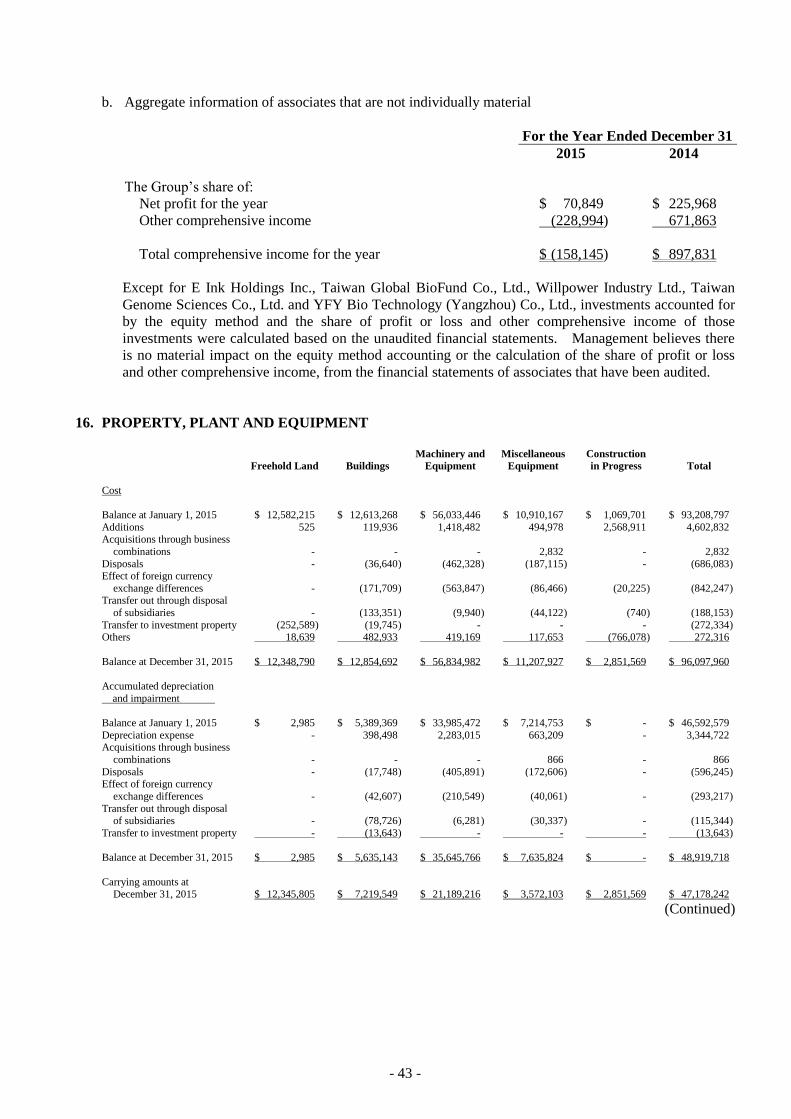
- 43 -
b. Aggregate information of associates that are not individually material
For the Year Ended December 31
2015 2014
The Group’s share of:
Net profit for the year $ 70,849 $ 225,968
Other comprehensive income (228,994) 671,863
Total comprehensive income for the year $ (158,145) $ 897,831
Except for E Ink Holdings Inc., Taiwan Global BioFund Co., Ltd., Willpower Industry Ltd., Taiwan
Genome Sciences Co., Ltd. and YFY Bio Technology (Yangzhou) Co., Ltd., investments accounted for
by the equity method and the share of profit or loss and other comprehensive income of those
investments were calculated based on the unaudited financial statements. Management believes there
is no material impact on the equity method accounting or the calculation of the share of profit or loss
and other comprehensive income, from the financial statements of associates that have been audited.
16. PROPERTY, PLANT AND EQUIPMENT
Freehold Land Buildings
Machinery and
Equipment
Miscellaneous
Equipment
Construction
in Progress Total
Cost
Balance at January 1, 2015 $ 12,582,215 $ 12,613,268 $ 56,033,446 $ 10,910,167 $ 1,069,701 $ 93,208,797
Additions 525 119,936 1,418,482 494,978 2,568,911 4,602,832 Acquisitions through business
combinations - - - 2,832 - 2,832
Disposals - (36,640 ) (462,328 ) (187,115 ) - (686,083 ) Effect of foreign currency
exchange differences - (171,709 ) (563,847 ) (86,466 ) (20,225 ) (842,247 ) Transfer out through disposal
of subsidiaries - (133,351 ) (9,940 ) (44,122 ) (740 ) (188,153 )
Transfer to investment property (252,589 ) (19,745 ) - - - (272,334 ) Others 18,639 482,933 419,169 117,653 (766,078 ) 272,316
Balance at December 31, 2015 $ 12,348,790 $ 12,854,692 $ 56,834,982 $ 11,207,927 $ 2,851,569 $ 96,097,960
Accumulated depreciation
and impairment
Balance at January 1, 2015 $ 2,985 $ 5,389,369 $ 33,985,472 $ 7,214,753 $ - $ 46,592,579
Depreciation expense - 398,498 2,283,015 663,209 - 3,344,722 Acquisitions through business
combinations - - - 866 - 866
Disposals - (17,748 ) (405,891 ) (172,606 ) - (596,245 ) Effect of foreign currency
exchange differences - (42,607 ) (210,549 ) (40,061 ) - (293,217 )
Transfer out through disposal of subsidiaries - (78,726 ) (6,281 ) (30,337 ) - (115,344 )
Transfer to investment property - (13,643 ) - - - (13,643 )
Balance at December 31, 2015 $ 2,985 $ 5,635,143 $ 35,645,766 $ 7,635,824 $ - $ 48,919,718
Carrying amounts at December 31, 2015 $ 12,345,805 $ 7,219,549 $ 21,189,216 $ 3,572,103 $ 2,851,569 $ 47,178,242
(Continued)

- 44 -
Freehold Land Buildings
Machinery and
Equipment
Miscellaneous
Equipment
Construction
in Progress Total
Cost
Balance at January 1, 2014 $ 12,606,756 $ 10,181,431 $ 47,427,418 $ 9,199,041 $ 7,724,618 $ 87,139,264 Additions - 2,093,947 7,938,354 1,602,384 (6,748,169 ) 4,886,516
Disposals (24,033 ) (50,520 ) (639,727 ) (124,196 ) - (838,476 )
Effect of foreign currency exchange differences (508 ) 388,742 1,314,569 324,769 93,252 2,120,824
Others - (332 ) (7,168 ) (91,831 ) - (99,331 )
Balance at December 31, 2014 $ 12,582,215 $ 12,613,268 $ 56,033,446 $ 10,910,167 $ 1,069,701 $ 93,208,797
Accumulated depreciation
and impairment
Balance at January 1, 2014 $ 2,985 $ 4,958,546 $ 31,831,167 $ 6,470,635 $ - $ 43,263,333
Depreciation expense - 359,695 2,136,047 591,167 - 3,086,909
Disposals - (25,302 ) (413,034 ) (107,367 ) - (545,703 ) Effect of foreign currency
exchange differences - 96,762 438,183 280,992 - 815,937
Others - (332 ) (6,891 ) (20,674 ) - (27,897 )
Balance at December 31, 2014 $ 2,985 $ 5,389,369 $ 33,985,472 $ 7,214,753 $ - $ 46,592,579
Carrying amounts at
December 31, 2014 $ 12,579,230 $ 7,223,899 $ 22,047,974 $ 3,695,414 $ 1,069,701 $ 46,616,218
(Concluded)
The above items of property, plant and equipment were depreciated on a straight-line basis over the
estimated useful life of the asset:
Buildings
Main buildings 15-55 years
Others 3-50 years
Machinery and equipment 3-20 years
Miscellaneous equipment 3-50 years
17. INVESTMENT PROPERTIES
Cost
Balance at January 1, 2015 $ 2,762,311
Transfer from property, plant and equipment 272,334
Transfer from prepayment for equipment 4,017
Additions 13,219
Disposals (78,514)
Balance at December 31, 2015 $ 2,973,367
Accumulated depreciation and impairment
Balance at January 1, 2015 $ 162,577
Transfer from property, plant and equipment 13,643
Depreciation expense 6,603
Disposals (12,468)
Balance at December 31, 2015 $ 170,355
Carrying amounts at December 31, 2015 $ 2,803,012
(Continued)

- 45 -
Cost
Balance at January 1, 2014 $ 2,840,629
Additions 17,344
Disposals (96,174)
Other 512
Balance at December 31, 2014 $ 2,762,311
Accumulated depreciation and impairment
Balance at January 1, 2014 $ 155,812
Depreciation expense 7,178
Disposals (413)
Balance at December 31, 2014 $ 162,577
Carrying amounts at December 31, 2014 $ 2,599,734
(Concluded)
The fair values of the investment properties owned by the Group were $7,119,275 thousand and $6,827,195
thousand as of December 31, 2015 and 2014, respectively. The valuation was made by the Company
using market transaction prices for similar properties and not by independent qualified professional valuers.
The rental incomes were $39,279 thousand for 2014 and $33,482 thousand for 2015.
The investment properties held by the Group were depreciated over their estimated useful lives of 20 to 55
years, using the straight-line method.
The Group owns freehold interests in all of its investment property.
18. BORROWINGS
a. Short-term borrowings
December 31
2015 2014
Bank credit loans and letter of credit loans $ 10,107,635 $ 10,779,132
Bank mortgage loans 295,425 1,487,550
$ 10,403,060 $ 12,266,682
As of December 31, 2015 and 2014, the interest rate of short-term borrowings was 0.80%-4.37% per
annum and 1.06%-6.41% per annum, respectively.
b. Short-term bills payable
Short-term bills payable are commercial papers due within one year. Interest rates on these bills
payable were 0.46%-1.54% and 0.66%-1.41% as of December 31, 2015 and 2014, respectively.

- 46 -
c. Long-term borrowings
December 31
2015 2014
Long-term bank loans $ 28,450,454 $ 27,771,440
Long-term bills payable - 319,828
28,450,454 28,091,268
Less: Current portion 448,250 478,078
$ 28,002,204 $ 27,613,190
Long-term bank loans included secured, credit and syndicated loans. Credit and secured loans are
repayable in one lump-sum payment. Interests on these loans were 1.11%-3.78% and 1.16%-3.61% as
of December 31, 2015 and 2014, respectively; syndicated loan are repayable at a certain percentage
from April 2011 to December 2019. Interest is payable monthly, with the interest rate were
1.45%-1.93% and 1.63%-1.93% as of December 31, 2015 and 2014, respectively.
Long-term bills payable in December 31, 2014 will due in February 2015. Interest rates on these bills
payable were 1.41%.
19. BONDS PAYABLE
The Company issued five-year secured bonds amounting to $2,500,000 thousand in June 2010, with
principal repayment at 50 percent each on the fourth and fifth years of the issue date. Interest is payable
yearly, at a fixed rate of 1.4%.
The Group issued three-year bonds amounting to RMB300 million in November 2011, with 3.10% interest
rate. Interest payments are paid off on a half-year basis. The principal repayment was made in February
2014.
The carrying amount of current portion of bonds payable was $1,249,567 thousand as of December 31,
2014.
20. RETIREMENT BENEFIT PLANS
a. Defined contribution plans
The Company and certain subsidiaries of the Group adopted a pension plan under the Labor Pension
Act (the “LPA”), which is a state-managed defined contribution plan. Under the LPA, an entity makes
monthly contributions to employees’ individual pension accounts at 6% of monthly salaries and wages.
b. Defined benefit plans
The Company and certain subsidiaries of the Group have defined benefit plans based on the Labor
Standards Law are operated by the government. Pension benefits are calculated on the basis of the
length of service and average monthly salaries of the six months before retirement. The Company and
certain subsidiaries contribute certain percentages to salaries and wages to a pension fund administered
by the pension fund monitoring committee. Pension contributions are deposited in the Bank of
Taiwan in the committee’s name. The pension fund is managed by the Bureau of Labor Funds (the
“Bureau”) under the Ministry of Labor; the Group has no right to influence the fund investment policy
and strategy.
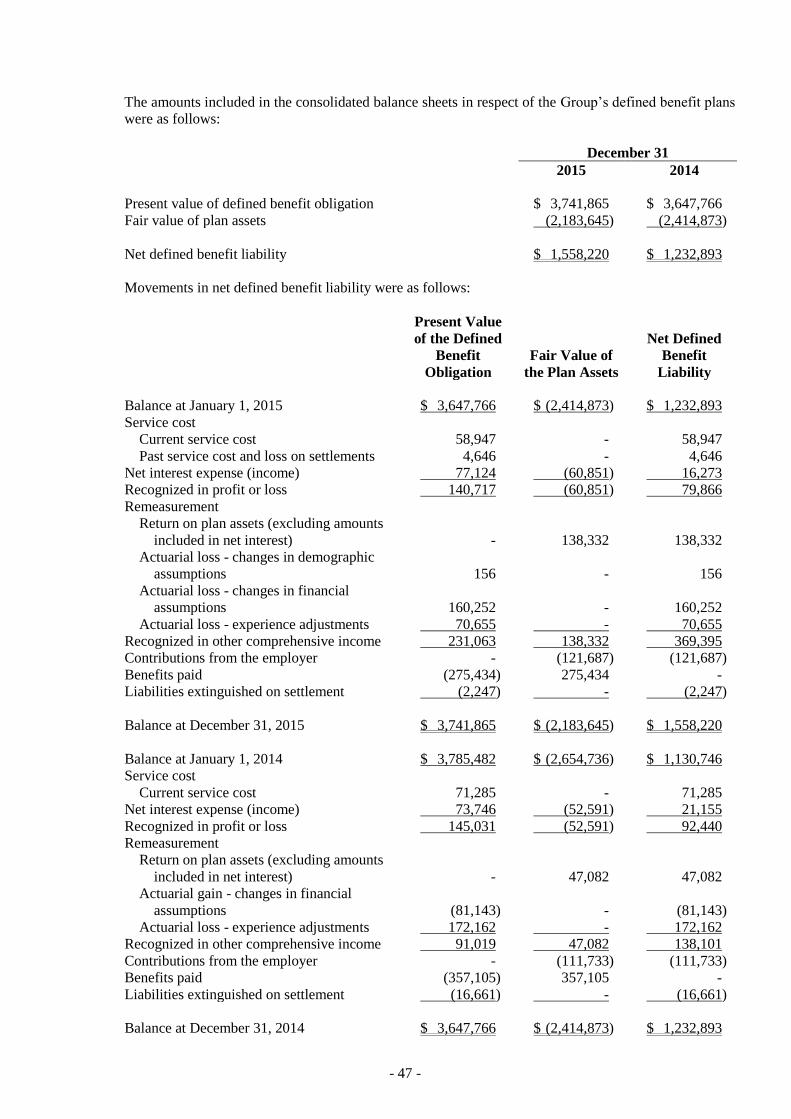
- 47 -
The amounts included in the consolidated balance sheets in respect of the Group’s defined benefit plans
were as follows:
December 31
2015 2014
Present value of defined benefit obligation $ 3,741,865 $ 3,647,766
Fair value of plan assets (2,183,645) (2,414,873)
Net defined benefit liability $ 1,558,220 $ 1,232,893
Movements in net defined benefit liability were as follows:
Present Value
of the Defined
Benefit
Obligation
Fair Value of
the Plan Assets
Net Defined
Benefit
Liability
Balance at January 1, 2015 $ 3,647,766 $ (2,414,873) $ 1,232,893
Service cost
Current service cost 58,947 - 58,947
Past service cost and loss on settlements 4,646 - 4,646
Net interest expense (income) 77,124 (60,851) 16,273
Recognized in profit or loss 140,717 (60,851) 79,866
Remeasurement
Return on plan assets (excluding amounts
included in net interest) - 138,332 138,332
Actuarial loss - changes in demographic
assumptions 156 - 156
Actuarial loss - changes in financial
assumptions 160,252 - 160,252
Actuarial loss - experience adjustments 70,655 - 70,655
Recognized in other comprehensive income 231,063 138,332 369,395
Contributions from the employer - (121,687) (121,687)
Benefits paid (275,434) 275,434 -
Liabilities extinguished on settlement (2,247) - (2,247)
Balance at December 31, 2015 $ 3,741,865 $ (2,183,645) $ 1,558,220
Balance at January 1, 2014 $ 3,785,482 $ (2,654,736) $ 1,130,746
Service cost
Current service cost 71,285 - 71,285
Net interest expense (income) 73,746 (52,591) 21,155
Recognized in profit or loss 145,031 (52,591) 92,440
Remeasurement
Return on plan assets (excluding amounts
included in net interest) - 47,082 47,082
Actuarial gain - changes in financial
assumptions (81,143) - (81,143)
Actuarial loss - experience adjustments 172,162 - 172,162
Recognized in other comprehensive income 91,019 47,082 138,101
Contributions from the employer - (111,733) (111,733)
Benefits paid (357,105) 357,105 -
Liabilities extinguished on settlement (16,661) - (16,661)
Balance at December 31, 2014 $ 3,647,766 $ (2,414,873) $ 1,232,893
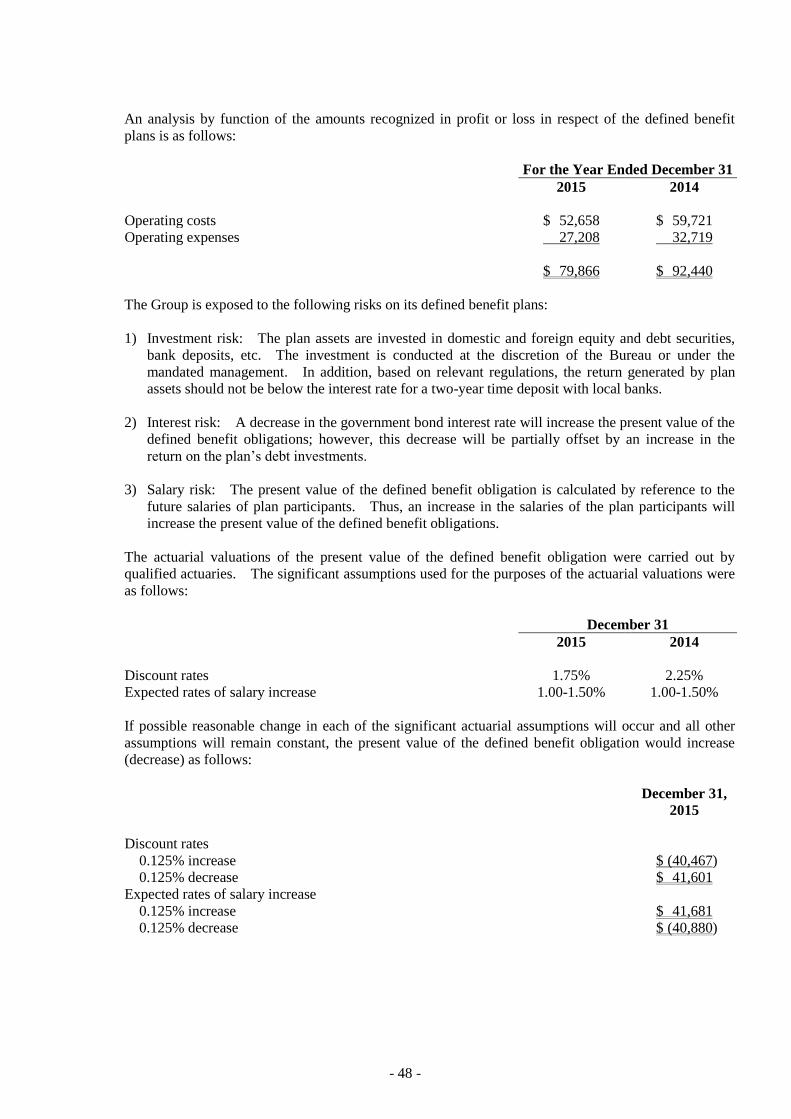
- 48 -
An analysis by function of the amounts recognized in profit or loss in respect of the defined benefit
plans is as follows:
For the Year Ended December 31
2015 2014
Operating costs $ 52,658 $ 59,721
Operating expenses 27,208 32,719
$ 79,866 $ 92,440
The Group is exposed to the following risks on its defined benefit plans:
1) Investment risk: The plan assets are invested in domestic and foreign equity and debt securities,
bank deposits, etc. The investment is conducted at the discretion of the Bureau or under the
mandated management. In addition, based on relevant regulations, the return generated by plan
assets should not be below the interest rate for a two-year time deposit with local banks.
2) Interest risk: A decrease in the government bond interest rate will increase the present value of the
defined benefit obligations; however, this decrease will be partially offset by an increase in the
return on the plan’s debt investments.
3) Salary risk: The present value of the defined benefit obligation is calculated by reference to the
future salaries of plan participants. Thus, an increase in the salaries of the plan participants will
increase the present value of the defined benefit obligations.
The actuarial valuations of the present value of the defined benefit obligation were carried out by
qualified actuaries. The significant assumptions used for the purposes of the actuarial valuations were
as follows:
December 31
2015 2014
Discount rates 1.75% 2.25%
Expected rates of salary increase 1.00-1.50% 1.00-1.50%
If possible reasonable change in each of the significant actuarial assumptions will occur and all other
assumptions will remain constant, the present value of the defined benefit obligation would increase
(decrease) as follows:
December 31,
2015
Discount rates
0.125% increase $ (40,467)
0.125% decrease $ 41,601
Expected rates of salary increase
0.125% increase $ 41,681
0.125% decrease $ (40,880)

- 49 -
The sensitivity analysis presented above might not have been representative of the actual change in the
present value of the defined benefit obligation because it was unlikely that the changes in assumptions
had occurred in isolation of one another, i.e., some of the assumptions might have been correlated.
December 31
2015 2014
The expected contributions to the plan for the next year $ 1,177,308 $ 493,325
The average duration of the defined benefit obligation 6.8-12.0 years 7.4-12.1 years
21. EQUITY
a. Ordinary shares
December 31
2015 2014
Numbers of shares authorized (in thousand) 2,200,000 2,200,000
Shares authorized $ 22,000,000 $ 22,000,000
Number of shares issued and fully paid (in thousand) 1,660,372 1,660,372
Shares issued $ 16,603,715 $ 16,603,715
Fully paid ordinary shares, which have a par value of $10, carry one vote per share and carry a right to
dividends.
b. Capital surplus
Depending on the source, capital surplus may be used in these ways: (1) arising from shares issued in
excess of par (including share premium from issuance of common shares for merger, treasury share
transactions, and excess of the consideration received over the carrying amount of the subsidiaries’ net
assets during disposal or acquisition) - may be used to offset a deficit; in addition, when the Company
has no deficit, this capital surplus may be distributed as cash dividends, or may be transferred to share
capital once a year within a certain percentage of the Company’s capital surplus; (2) arising from the
effect of changes in ownership interest in a subsidiary due to equity transactions other than actual
disposal or acquisition - may be used to offset a deficit.; (3) arising from changes in equity in associates
- may be used in compliance with related regulations if the capital surplus source is either of the
foregoing two sources.
c. Retained earnings and dividend policy
The Company’s Articles of Incorporation provide that annual net income, less any prior years’ deficit,
should be appropriated as follows:
1) 10% as legal reserve;
2) Special capital reserve in accordance with relevant laws or regulations, if needed;
3) Dividends, less than 10%;
4) No more than 2% as remuneration to directors and supervisors; and no less than 1‰ as bonus to
employees; and
5) The remainder to be distributed to the shareholders.
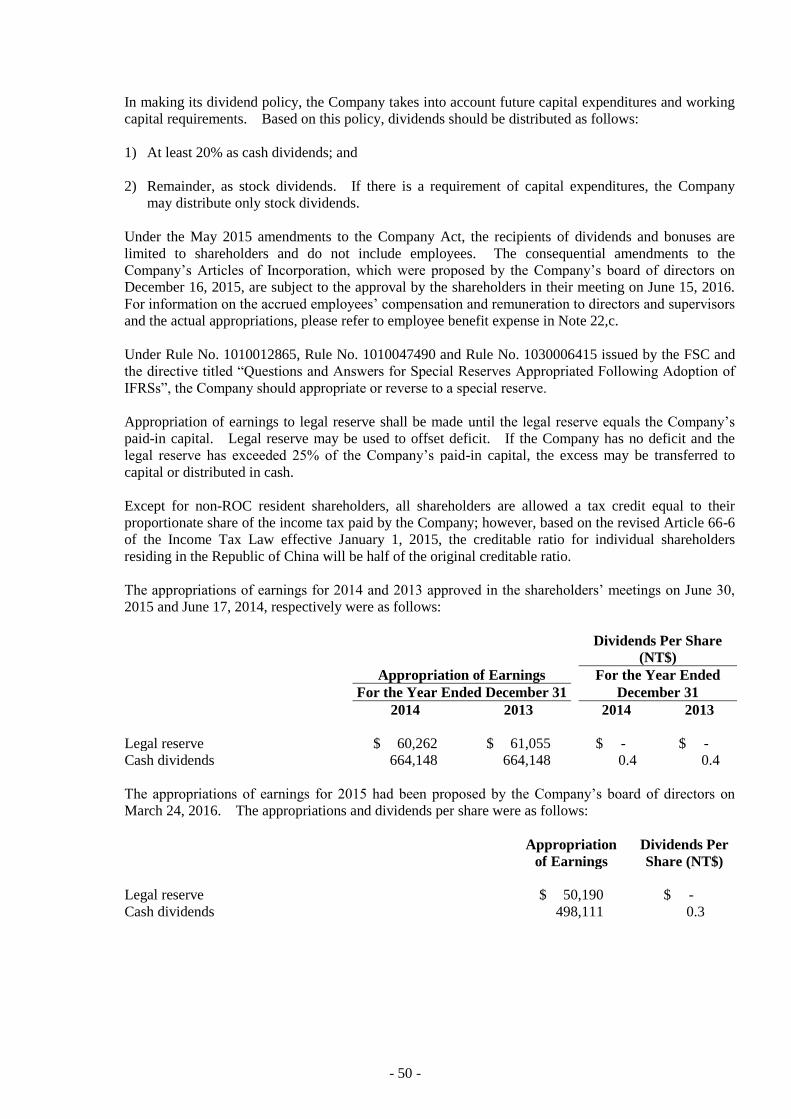
- 50 -
In making its dividend policy, the Company takes into account future capital expenditures and working
capital requirements. Based on this policy, dividends should be distributed as follows:
1) At least 20% as cash dividends; and
2) Remainder, as stock dividends. If there is a requirement of capital expenditures, the Company
may distribute only stock dividends.
Under the May 2015 amendments to the Company Act, the recipients of dividends and bonuses are
limited to shareholders and do not include employees. The consequential amendments to the
Company’s Articles of Incorporation, which were proposed by the Company’s board of directors on
December 16, 2015, are subject to the approval by the shareholders in their meeting on June 15, 2016.
For information on the accrued employees’ compensation and remuneration to directors and supervisors
and the actual appropriations, please refer to employee benefit expense in Note 22,c.
Under Rule No. 1010012865, Rule No. 1010047490 and Rule No. 1030006415 issued by the FSC and
the directive titled “Questions and Answers for Special Reserves Appropriated Following Adoption of
IFRSs”, the Company should appropriate or reverse to a special reserve.
Appropriation of earnings to legal reserve shall be made until the legal reserve equals the Company’s
paid-in capital. Legal reserve may be used to offset deficit. If the Company has no deficit and the
legal reserve has exceeded 25% of the Company’s paid-in capital, the excess may be transferred to
capital or distributed in cash.
Except for non-ROC resident shareholders, all shareholders are allowed a tax credit equal to their
proportionate share of the income tax paid by the Company; however, based on the revised Article 66-6
of the Income Tax Law effective January 1, 2015, the creditable ratio for individual shareholders
residing in the Republic of China will be half of the original creditable ratio.
The appropriations of earnings for 2014 and 2013 approved in the shareholders’ meetings on June 30,
2015 and June 17, 2014, respectively were as follows:
Dividends Per Share
(NT$)
Appropriation of Earnings For the Year Ended
For the Year Ended December 31 December 31
2014 2013 2014 2013
Legal reserve $ 60,262 $ 61,055 $ - $ -
Cash dividends 664,148 664,148 0.4 0.4
The appropriations of earnings for 2015 had been proposed by the Company’s board of directors on
March 24, 2016. The appropriations and dividends per share were as follows:
Appropriation
of Earnings
Dividends Per
Share (NT$)
Legal reserve $ 50,190 $ -
Cash dividends 498,111 0.3

- 51 -
The appropriations of earnings are subject to the resolution of the shareholders’ meeting to be held on
June 15, 2016.
Information on the appropriations of earning for 2015, employees’ compensation, and remuneration to
directors were proposed by the Company’s board of directors is available on the Market Observation
Post System website of the Taiwan Stock Exchange.
d. Others equity items
Exchange
Differences
Arising on
Translating
the Foreign
Operations
Unrealized
Gain (Loss) on
Available-for-
sale Financial
Assets
Cash Flow
Hedge Total
2015
Balance at January 1 $ 3,004,110 $ 6,334,530 $ (5,747) $ 9,332,893
Exchange differences arising on
translating the foreign
operations (261,449) - - (261,449)
Unrealized gain on
available-for-sale financial
assets - (3,263,942) - (3,263,942)
Cash flow hedge - - 13,628 13,628
Share of associates accounted
for using the equity method (18,570) (268,961) - (287,531)
Balance at December 31 $ 2,724,091 $ 2,801,627 $ 7,881 $ 5,533,599
2014
Balance at January 1 $ 1,247,564 $ 1,935,199 $ (4,074) $ 3,178,689
Exchange differences arising on
translating the foreign
operations 1,594,086 - - 1,594,086
Unrealized gain on
available-for-sale financial
assets - 3,789,904 - 3,789,904
Cash flow hedge - - (1,673) (1,673)
Share of associates accounted
for using the equity method 162,460 609,427 - 771,887
Balance at December 31 $ 3,004,110 $ 6,334,530 $ (5,747) $ 9,332,893

- 52 -
e. Noncontrolling interests
For the Year Ended December 31
2015 2014
Balance at January 1 $ 10,078,710 $ 9,973,410
Attributable to noncontrolling interests:
Share of profit (loss) for the year 680,290 269,278
Cash Dividend (296,799) (196,020)
Exchange difference arising on translation of foreign entities 2,647 148,374
Unrealized gains on available-for-sale financial assets (138,588) 166,068
Loss on fair value changes of cash flow hedges 2,593 (1,326)
Actuarial loss on defined benefit plans 4,100 (45,040)
Share of other comprehensive income of associates accounted
for using the equity method (18,691) 54,106
Adjustment relating to changes in equity of associates
accounted for using the equity method 2,644 (988)
Adjustment for the changes in equity of subsidiaries (8,168) (414,381)
Proceed of the return of capital on investments accounted for
using the equity method (510,737) -
Disposal or acquisition of subsidiaries (67,193) 125,229
Balance at December 31 $ 9,730,808 $ 10,078,710
22. NET PROFIT
a. Finance costs
For the Year Ended December 31
2015 2014
Interest on bank loans $ 905,574 $ 874,843
Less: Amounts included in the cost of qualifying assets (13,433) (3,032)
$ 892,141 $ 871,811
Information about capitalized interest was as follows:
For the Year Ended December 31
2015 2014
Capitalization rate 1.30-2.16% 0.96-1.66%
b. Depreciation and amortization
For the Year Ended December 31
2015 2014
Property, plant and equipment $ 3,344,722 $ 3,086,909
Investment property 6,603 7,178
$ 3,351,325 $ 3,094,087
Long-term prepayments for lease and other non-current assets $ 122,445 $ 146,920
(Continued)
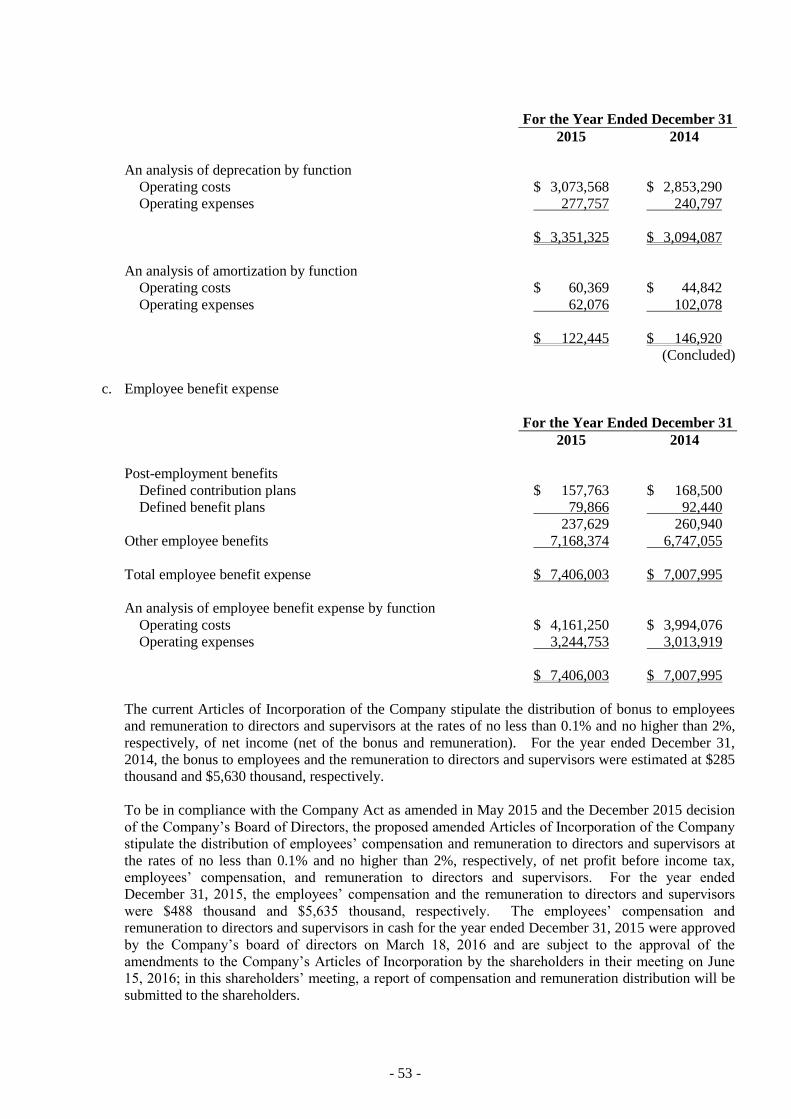
- 53 -
For the Year Ended December 31
2015 2014
An analysis of deprecation by function
Operating costs $ 3,073,568 $ 2,853,290
Operating expenses 277,757 240,797
$ 3,351,325 $ 3,094,087
An analysis of amortization by function
Operating costs $ 60,369 $ 44,842
Operating expenses 62,076 102,078
$ 122,445 $ 146,920
(Concluded)
c. Employee benefit expense
For the Year Ended December 31
2015 2014
Post-employment benefits
Defined contribution plans $ 157,763 $ 168,500
Defined benefit plans 79,866 92,440
237,629 260,940
Other employee benefits 7,168,374 6,747,055
Total employee benefit expense $ 7,406,003 $ 7,007,995
An analysis of employee benefit expense by function
Operating costs $ 4,161,250 $ 3,994,076
Operating expenses 3,244,753 3,013,919
$ 7,406,003 $ 7,007,995
The current Articles of Incorporation of the Company stipulate the distribution of bonus to employees
and remuneration to directors and supervisors at the rates of no less than 0.1% and no higher than 2%,
respectively, of net income (net of the bonus and remuneration). For the year ended December 31,
2014, the bonus to employees and the remuneration to directors and supervisors were estimated at $285
thousand and $5,630 thousand, respectively.
To be in compliance with the Company Act as amended in May 2015 and the December 2015 decision
of the Company’s Board of Directors, the proposed amended Articles of Incorporation of the Company
stipulate the distribution of employees’ compensation and remuneration to directors and supervisors at
the rates of no less than 0.1% and no higher than 2%, respectively, of net profit before income tax,
employees’ compensation, and remuneration to directors and supervisors. For the year ended
December 31, 2015, the employees’ compensation and the remuneration to directors and supervisors
were $488 thousand and $5,635 thousand, respectively. The employees’ compensation and
remuneration to directors and supervisors in cash for the year ended December 31, 2015 were approved
by the Company’s board of directors on March 18, 2016 and are subject to the approval of the
amendments to the Company’s Articles of Incorporation by the shareholders in their meeting on June
15, 2016; in this shareholders’ meeting, a report of compensation and remuneration distribution will be
submitted to the shareholders.
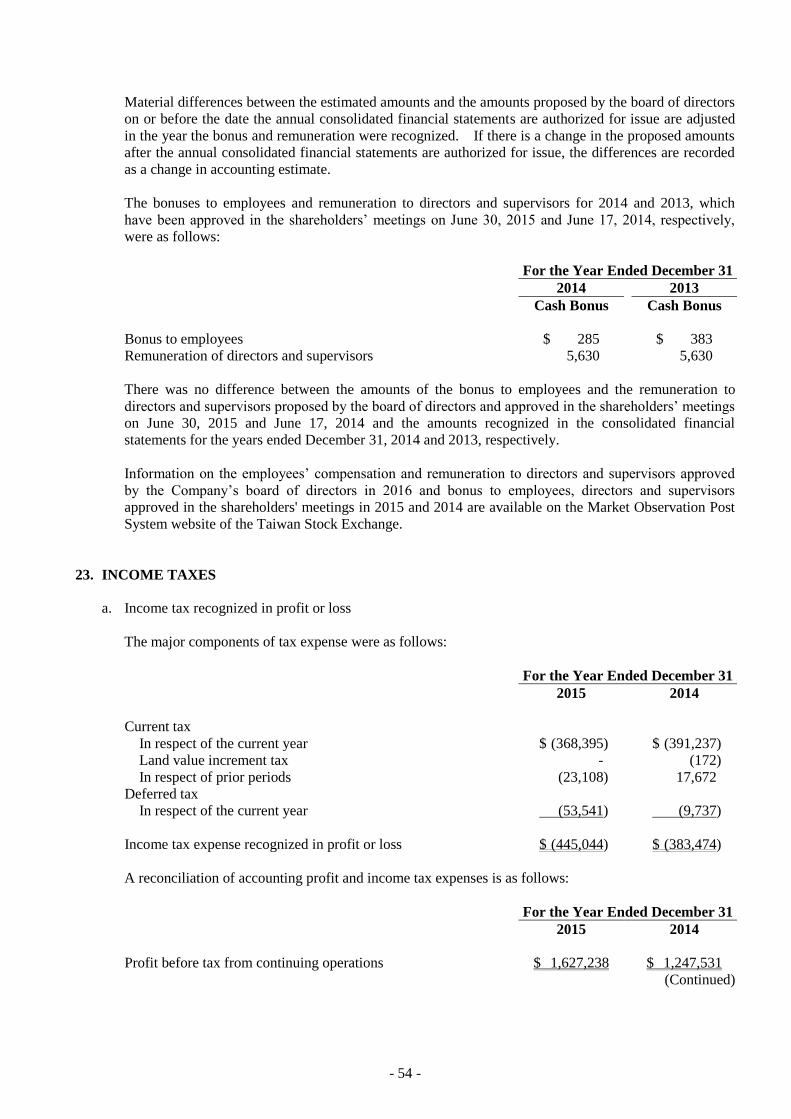
- 54 -
Material differences between the estimated amounts and the amounts proposed by the board of directors
on or before the date the annual consolidated financial statements are authorized for issue are adjusted
in the year the bonus and remuneration were recognized. If there is a change in the proposed amounts
after the annual consolidated financial statements are authorized for issue, the differences are recorded
as a change in accounting estimate.
The bonuses to employees and remuneration to directors and supervisors for 2014 and 2013, which
have been approved in the shareholders’ meetings on June 30, 2015 and June 17, 2014, respectively,
were as follows:
For the Year Ended December 31
2014 2013
Cash Bonus Cash Bonus
Bonus to employees $ 285 $ 383
Remuneration of directors and supervisors 5,630 5,630
There was no difference between the amounts of the bonus to employees and the remuneration to
directors and supervisors proposed by the board of directors and approved in the shareholders’ meetings
on June 30, 2015 and June 17, 2014 and the amounts recognized in the consolidated financial
statements for the years ended December 31, 2014 and 2013, respectively.
Information on the employees’ compensation and remuneration to directors and supervisors approved
by the Company’s board of directors in 2016 and bonus to employees, directors and supervisors
approved in the shareholders' meetings in 2015 and 2014 are available on the Market Observation Post
System website of the Taiwan Stock Exchange.
23. INCOME TAXES
a. Income tax recognized in profit or loss
The major components of tax expense were as follows:
For the Year Ended December 31
2015 2014
Current tax
In respect of the current year $ (368,395) $ (391,237)
Land value increment tax - (172)
In respect of prior periods (23,108) 17,672
Deferred tax
In respect of the current year (53,541) (9,737)
Income tax expense recognized in profit or loss $ (445,044) $ (383,474)
A reconciliation of accounting profit and income tax expenses is as follows:
For the Year Ended December 31
2015 2014
Profit before tax from continuing operations $ 1,627,238 $ 1,247,531
(Continued)

- 55 -
For the Year Ended December 31
2015 2014
Income tax expense calculated at the statutory rate $ (276,630) $ (212,080)
Nondeductible expenses in determining taxable income (123,655) (67,889)
Five-year tax-exempt 30,564 15,208
Tax-exempt income 210,140 166,063
Adjustment items in determining taxable income (347,375) (157,052)
Land value increment tax - (172)
Additional income tax on unappropriated earnings (403) (30,955)
Investment tax credits 22,578 17,390
Effect of different tax rate of group entities operating in other
jurisdictions 62,845 (131,659)
Adjustments for prior years’ tax (23,108) 17,672
Income tax expense recognized in profit or loss $ (445,044) $ (383,474)
(Concluded)
The applicable tax rate used above is the corporate tax rate of 17% payable by the Group in ROC, while
the applicable tax rate used by subsidiaries in China is 25%. Tax rates used by other group entities
operating in other jurisdictions are based on the tax laws in those jurisdictions.
As the status of 2016 appropriations of earnings is uncertain, the potential income tax consequences of
2015 unappropriated earnings are not reliably determinable.
b. Income tax recognized in other comprehensive income
For the Year Ended December 31
2014 2013
Deferred tax
In respect of the current year:
Related to remeasurement of defined benefit obligation $ 62,797 $ 23,478
Related to share of the other comprehensive income of
associates 778 (1,360)
Share of other comprehensive income $ 63,575 $ 22,118
c. Current tax assets and liabilities
December 31
2015 2014
Deferred tax assets
Defined benefit obligation $ 257,007 $ 211,571
Loss carryforwards 168,738 175,150
Allowance for doubtful accounts 22,182 15,809
Investment credits 20,059 39,600
Payable for annual leave 15,683 13,792
Unrealized loss on investments 10,642 6,805
Others 57,506 83,313
$ 551,817 $ 546,040
(Continued)
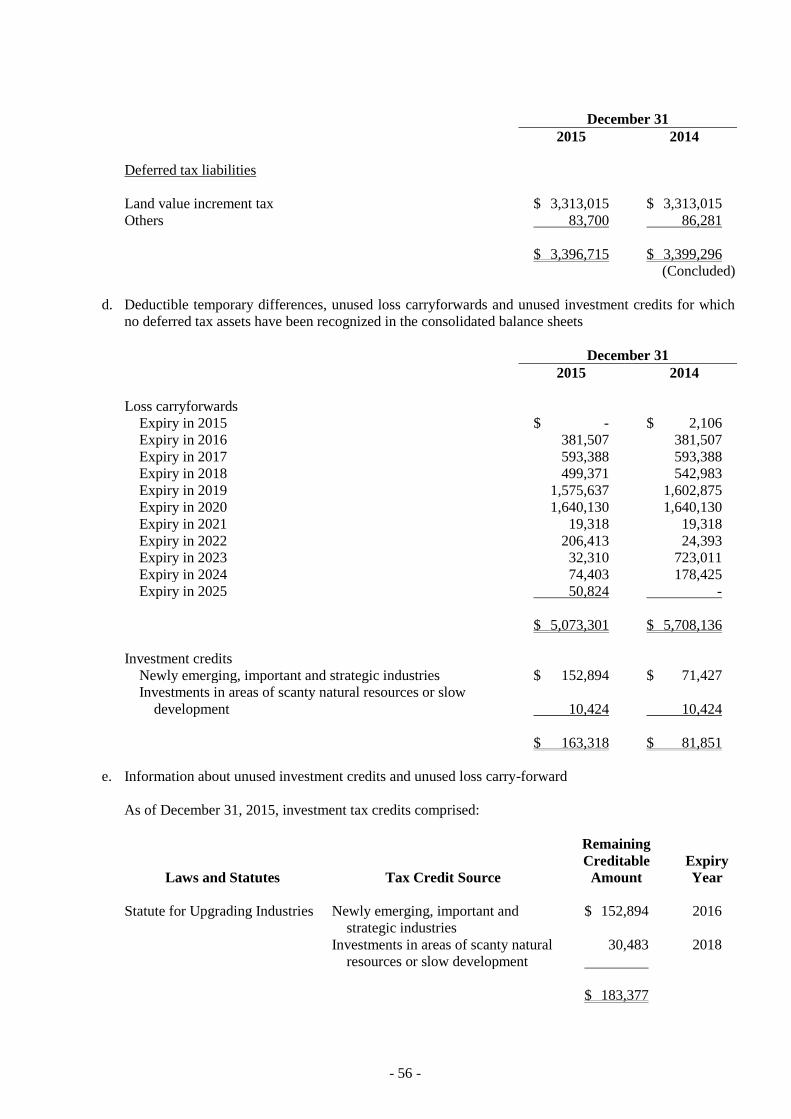
- 56 -
December 31
2015 2014
Deferred tax liabilities
Land value increment tax $ 3,313,015 $ 3,313,015
Others 83,700 86,281
$ 3,396,715 $ 3,399,296
(Concluded)
d. Deductible temporary differences, unused loss carryforwards and unused investment credits for which
no deferred tax assets have been recognized in the consolidated balance sheets
December 31
2015 2014
Loss carryforwards
Expiry in 2015 $ - $ 2,106
Expiry in 2016 381,507 381,507
Expiry in 2017 593,388 593,388
Expiry in 2018 499,371 542,983
Expiry in 2019 1,575,637 1,602,875
Expiry in 2020 1,640,130 1,640,130
Expiry in 2021 19,318 19,318
Expiry in 2022 206,413 24,393
Expiry in 2023 32,310 723,011
Expiry in 2024 74,403 178,425
Expiry in 2025 50,824 -
$ 5,073,301 $ 5,708,136
Investment credits
Newly emerging, important and strategic industries $ 152,894 $ 71,427
Investments in areas of scanty natural resources or slow
development 10,424 10,424
$ 163,318 $ 81,851
e. Information about unused investment credits and unused loss carry-forward
As of December 31, 2015, investment tax credits comprised:
Laws and Statutes Tax Credit Source
Remaining
Creditable
Amount
Expiry
Year
Statute for Upgrading Industries Newly emerging, important and
strategic industries
$ 152,894 2016
Investments in areas of scanty natural
resources or slow development
30,483
2018
$ 183,377

- 57 -
Loss carryforwards as of December 31, 2015 comprised of:
Unused Amount Expiry Year
$ 381,507 2016
593,388 2017
499,371 2018
1,575,637 2019
1,650,590 2020
23,367 2021
229,941 2022
854,334 2023
192,478 2024
60,342 2025
$ 6,060,955
f. Integrated income tax
December 31
2015 2014
Unappropriated earnings
Generated on and after January 1, 1998 $ 5,500,298 $ 6,038,592
Imputation credits accounts $ 628,445 $ 498,174
For the Year Ended December 31
2015
(Expected) 2014
Creditable ratio for distribution of earning 11.43% 8.75%
Under the Income Tax Law, for distribution of earnings generated after January 1, 1998, the imputation
credits allocated to ROC resident shareholders of the Company was calculated based on the creditable
ratio as of the date of dividend distribution. The actual imputation credits allocated to shareholders of
the Company was based on the balance of the Imputation Credit Accounts (ICA) as of the date of
dividend distribution. Therefore, the expected creditable ratio for the 2015 earnings may differ from
the actual creditable ratio to be used in allocating imputation credits to the shareholders.
g. Income tax assessments
Final Approved Year
The Company 2010
Chung Hwa Pulp Co., Ltd. 2013
Hwa Fong Investments Co., Ltd. 2013
Effion Enertech Co., Ltd. 2013
YFY Packaging Inc. 2013
YFY Consumer Products Co., Ltd. 2010
Shin Foong Chemical Industry Co., Ltd. 2013
China Color Printing Co., Ltd. 2013
YFY Capital Co., Ltd. 2012
Union Investment Co., Ltd. 2012
(Continued)

- 58 -
Final Approved Year
YFY Venture Capital Investment Co., Ltd. 2013
YFY Paradigm Investment Co., Ltd. 2013
Lotus Ecoscings & Engineering Co., Ltd. 2013
Yuen Yan Paper Container Co., Ltd. 2013
San Ying Enterprise Co., Ltd. 2013
Cupid InfoTech Co., Ltd. 2013
Ever Growing Agriculture Biotech Co., Ltd. 2012
Pek Crown Paper Co., Ltd. 2013
Yeon Technologies Co., Ltd. 2013
YFY Biotech Management Company 2013
Kuang Hwa Fertilizer Limited Company 2013
YFY Operation Management Consulting Co., Ltd. 2013
Livebricks Inc. 2014
(Concluded)
24. EARNINGS PER SHARE
Unit: NT$ Per Share
For the Year Ended December 31
2015 2014
Basic earnings per share $ 0.30 $ 0.36
Diluted earnings per share $ 0.30 $ 0.36
The earnings and weighted average number of ordinary shares outstanding in the computation of earnings
per share from continuing operations were as follows:
Net Profit for the Year
For the Year Ended December 31
2015 2014
Profit for the period attributable to owners of the Company $ 501,904 $ 594,779
Earnings used in the computation of diluted earnings per share $ 501,904 $ 594,779
Weighted average number of ordinary shares outstanding (in thousand shares):
For the Year Ended December 31
2015 2014
Weighted average number of ordinary shares in computation of basic
earnings per share 1,660,372 1,660,372
Effect of potentially dilutive ordinary shares:
Bonus issue to employees 58 33
Weighted average number of ordinary shares used in the
computation of diluted earnings per share 1,660,430 1,660,405

- 59 -
If the Group offered to settle bonuses paid to employees in cash or shares, the Group assumed the entire
amount of the bonus would be settled in shares and the resulting potential shares were included in the
weighted average number of shares outstanding used in the computation of diluted earnings per share, if the
effect is dilutive. Such dilutive effect of the potential shares was included in the computation of diluted
earnings per share until the shareholders resolve the number of shares to be distributed to employees at their
meeting in the following year.
25. BUSINESS COMBINATIONS
a. Subsidiaries acquired
Principal Activity
Date of
Acquisition
Proportion of
Voting
Equity
Interests
Acquired (%)
Consideration
Transferred
Innovativ Packaging
Worldwide, LLC
Design of packaging and
sale of paper
March 2015 51.0 $ 7,199
Yeon Technologies (Yang
Zhou) Co., Ltd.
Sale and design of RFID
(radio frequency
identification) products
April 2015 100.0 $ 45,076
Jupiter Prestige Group
Holdings Limited and
its subsidiaries
Design of packaging, sale
of paper, and graphic
design
May 2014 57.0 $ 293,717
In 2014 and 2015, the Group acquired Innovativ Packaging Worldwide, LLC, Yeon Technologies
(Yang Zhou) Co., Ltd., and Jupiter Prestige Group Holdings Limited and its subsidiaries in order to
continue the expansion of the Group’s operation.
b. Considerations transferred
For the Year Ended December 31
2015 2014
Innovativ
Packaging
Worldwide,
LLC
Yeon
Technologies
(Yang Zhou)
Co., Ltd.
Jupiter Prestige
Group Holdings
Limited and Its
Subsidiaries
Cash $ 7,199 $ 45,076 $ 106,803
Spin-off of the subsidiaries’ net assets at fair
value (Note 1) - - 82,134
Contingent consideration arrangement
(Note 2) - - 104,780
$ 7,199 $ 45,076 $ 293,717
Note 1: Rimagine Group Limited and Jupiter Prestige Group North America Inc.
Note 2: Under the acquisition contract, the Group should pay an additional US$3,471 thousand if all
the terms of the agreement were met by Jupiter Prestige Group Holdings Limited and its
subsidiaries during a certain period. Management thought it was probable that this payment
would be required.

- 60 -
As of December 31, 2015, the unpaid consideration was $53,570 thousand (US$1,632 thousand,
accounted for as other payables, used the exchange rate as of December 31, 2015).
c. Assets acquired and liabilities incurred at the date of acquisition
Innovativ
Packaging
Worldwide,
LLC
Yeon
Technologies
(Yang Zhou)
Co., Ltd.
Jupiter Prestige
Group Holdings
Limited and Its
Subsidiaries
Current assets
Cash $ 1,873 $ 310 $ 21,195
Accounts receivable 3,969 30,113 104,842
Inventories 1,834 26,035 91,554
Other current assets 19,537 20,485 10,949
Non-current assets
Property, plant and equipment 1,309 657 33,327
Current liabilities
Short-term borrowings (15,739) - - -
Accounts and other payables (11,265) (34,914) (35,680)
Other current liabilities (1,518) (34,525) (59,632)
$ - $ 8,161 $ 166,555
d. Non-controlling interests
The non-controlling interest (43% ownership interest) recognized at the acquisition date was measured
at the fair value of assets acquired and liabilities incurred and the book value of the net assets of the
subsidiaries that were spun off.
e. Goodwill arising on acquisition
Innovativ
Packaging
Worldwide,
LLC
Yeon
Technologies
(Yang Zhou)
Co., Ltd.
Jupiter Prestige
Group Holdings
Limited and Its
Subsidiaries
Consideration transferred $ 7,199 $ 45,076 $ 293,717
Plus: Non-controlling interests (43% in
Jupiter Prestige Group Holdings Limited
and its subsidiaries) - - - 91,430
Less: Fair value of identifiable net assets
acquired - (8,161) (166,555)
Goodwill arising on acquisition $ 7,199 $ 36,915 $ 218,592
Goodwill arose in the acquisition of Innovativ Packaging Worldwide, LLC, Yeon Technologies (Yang
Zhou) Co., Ltd., and Jupiter Prestige Group Holdings Limited and its subsidiaries because the cost of
the combination included a control premium. In addition, the consideration paid for the combination
effectively included amounts in relation to the benefit of expected synergies, revenue growth, and future
market development. These benefits were not recognized separately from goodwill because they did
not meet the recognition criteria for identifiable intangible assets.
The total amount of acquisition goodwill was not deductible for tax purposes.
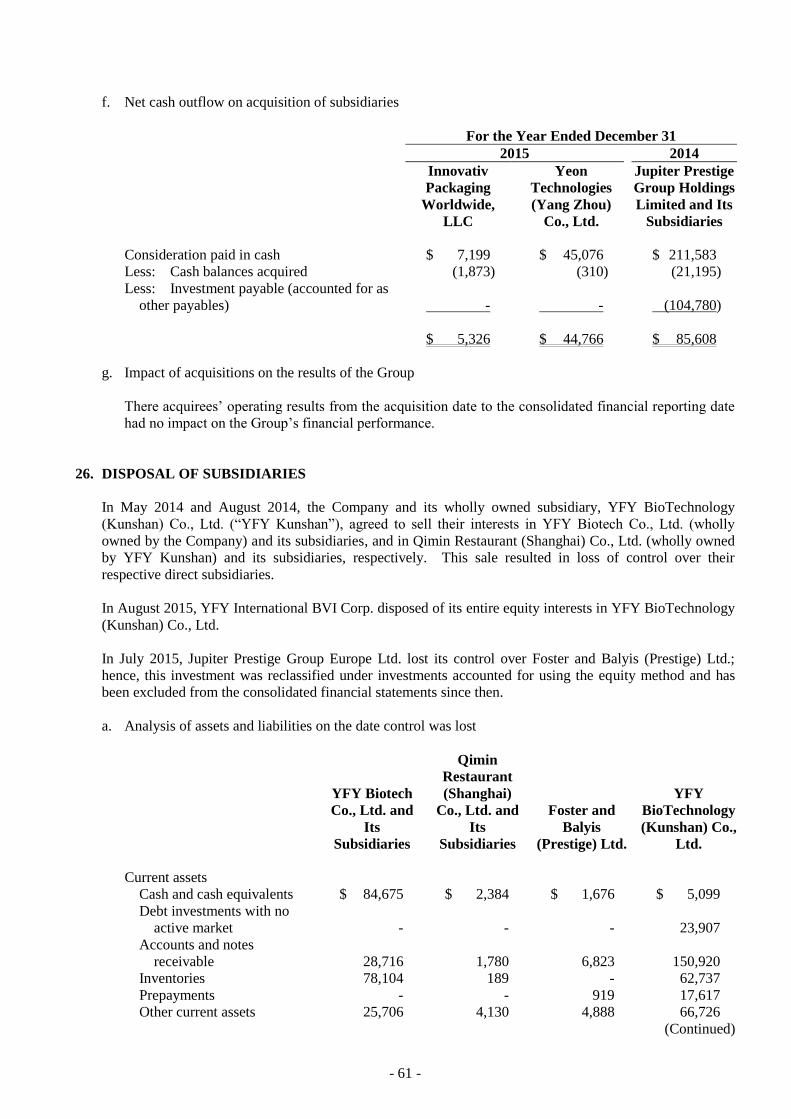
- 61 -
f. Net cash outflow on acquisition of subsidiaries
For the Year Ended December 31
2015 2014
Innovativ
Packaging
Worldwide,
LLC
Yeon
Technologies
(Yang Zhou)
Co., Ltd.
Jupiter Prestige
Group Holdings
Limited and Its
Subsidiaries
Consideration paid in cash $ 7,199 $ 45,076 $ 211,583
Less: Cash balances acquired (1,873) (310) (21,195)
Less: Investment payable (accounted for as
other payables) - - (104,780)
$ 5,326 $ 44,766 $ 85,608
g. Impact of acquisitions on the results of the Group
There acquirees’ operating results from the acquisition date to the consolidated financial reporting date
had no impact on the Group’s financial performance.
26. DISPOSAL OF SUBSIDIARIES
In May 2014 and August 2014, the Company and its wholly owned subsidiary, YFY BioTechnology
(Kunshan) Co., Ltd. (“YFY Kunshan”), agreed to sell their interests in YFY Biotech Co., Ltd. (wholly
owned by the Company) and its subsidiaries, and in Qimin Restaurant (Shanghai) Co., Ltd. (wholly owned
by YFY Kunshan) and its subsidiaries, respectively. This sale resulted in loss of control over their
respective direct subsidiaries.
In August 2015, YFY International BVI Corp. disposed of its entire equity interests in YFY BioTechnology
(Kunshan) Co., Ltd.
In July 2015, Jupiter Prestige Group Europe Ltd. lost its control over Foster and Balyis (Prestige) Ltd.;
hence, this investment was reclassified under investments accounted for using the equity method and has
been excluded from the consolidated financial statements since then.
a. Analysis of assets and liabilities on the date control was lost
YFY Biotech
Co., Ltd. and
Its
Subsidiaries
Qimin
Restaurant
(Shanghai)
Co., Ltd. and
Its
Subsidiaries
Foster and
Balyis
(Prestige) Ltd.
YFY
BioTechnology
(Kunshan) Co.,
Ltd.
Current assets
Cash and cash equivalents $ 84,675 $ 2,384 $ 1,676 $ 5,099
Debt investments with no
active market - - - 23,907
Accounts and notes
receivable 28,716 1,780 6,823 150,920
Inventories 78,104 189 - 62,737
Prepayments - - 919 17,617
Other current assets 25,706 4,130 4,888 66,726
(Continued)
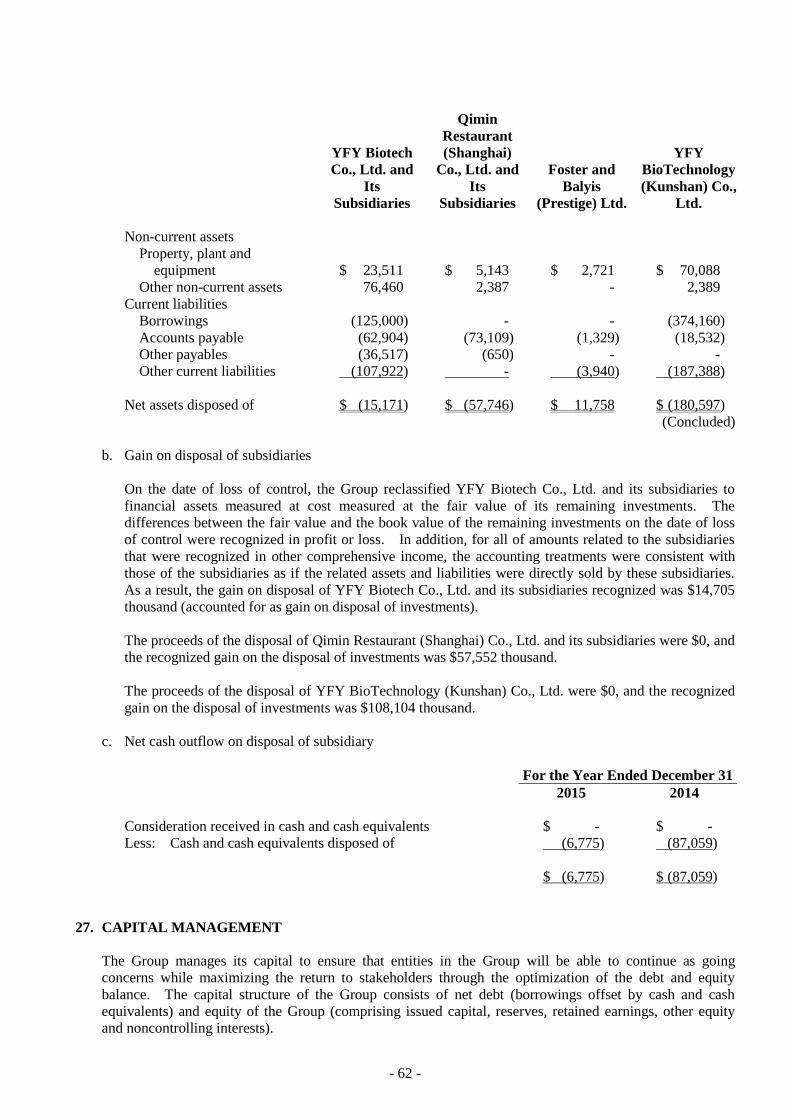
- 62 -
YFY Biotech
Co., Ltd. and
Its
Subsidiaries
Qimin
Restaurant
(Shanghai)
Co., Ltd. and
Its
Subsidiaries
Foster and
Balyis
(Prestige) Ltd.
YFY
BioTechnology
(Kunshan) Co.,
Ltd.
Non-current assets
Property, plant and
equipment $ 23,511 $ 5,143 $ $ 2,721 $ 70,088
Other non-current assets 76,460 2,387 - 2,389
Current liabilities
Borrowings (125,000) - - (374,160)
Accounts payable (62,904) (73,109) (1,329) (18,532)
Other payables (36,517) (650) - -
Other current liabilities (107,922) - (3,940) (187,388)
Net assets disposed of $ (15,171) $ (57,746) $ 11,758 $ (180,597)
(Concluded)
b. Gain on disposal of subsidiaries
On the date of loss of control, the Group reclassified YFY Biotech Co., Ltd. and its subsidiaries to
financial assets measured at cost measured at the fair value of its remaining investments. The
differences between the fair value and the book value of the remaining investments on the date of loss
of control were recognized in profit or loss. In addition, for all of amounts related to the subsidiaries
that were recognized in other comprehensive income, the accounting treatments were consistent with
those of the subsidiaries as if the related assets and liabilities were directly sold by these subsidiaries.
As a result, the gain on disposal of YFY Biotech Co., Ltd. and its subsidiaries recognized was $14,705
thousand (accounted for as gain on disposal of investments).
The proceeds of the disposal of Qimin Restaurant (Shanghai) Co., Ltd. and its subsidiaries were $0, and
the recognized gain on the disposal of investments was $57,552 thousand.
The proceeds of the disposal of YFY BioTechnology (Kunshan) Co., Ltd. were $0, and the recognized
gain on the disposal of investments was $108,104 thousand.
c. Net cash outflow on disposal of subsidiary
For the Year Ended December 31
2015 2014
Consideration received in cash and cash equivalents $ - $ -
Less: Cash and cash equivalents disposed of (6,775) (87,059)
$ (6,775) $ (87,059)
27. CAPITAL MANAGEMENT
The Group manages its capital to ensure that entities in the Group will be able to continue as going
concerns while maximizing the return to stakeholders through the optimization of the debt and equity
balance. The capital structure of the Group consists of net debt (borrowings offset by cash and cash
equivalents) and equity of the Group (comprising issued capital, reserves, retained earnings, other equity
and noncontrolling interests).

- 63 -
28. FINANCIAL INSTRUMENTS
a. Fair value of financial instruments that are not measured at fair value
The management of the Group considers that the carrying amounts of financial assets and financial
liabilities recognized in the consolidated financial statements approximate their fair values or their fair
values cannot be reliably measured.
b. Fair value of financial instruments that are measured at fair value on a recurring basis
1) Fair value hierarchy
December 31, 2015
Level 1 Level 2 Level 3 Total
Financial assets at FVTPL
Derivative financial
assets $ - $ 530 $ 295,084 $ 295,614
Nonderivative financial
assets held for trading 691,790 - - 691,790
$ 691,790 $ 530 $ 295,084 $ 987,404
Financial assets held for
hedging $ - $ 23,189 $ - $ 23,189
Available-for-sale financial
assets
Securities listed in ROC
Equity securities $ 13,983,649 $ - $ - $ 13,983,649
Financial liabilities at
FVTPL
Derivative financial
liabilities $ - $ 2,435 $ - $ 2,435
December 31, 2014
Level 1 Level 2 Level 3 Total
Financial assets at FVTPL
Derivative financial
assets $ - $ 245 $ 282,799 $ 283,044
Nonderivative financial
assets held for trading 610,253 - - 610,253
$ 610,253 $ 245 $ 282,799 $ 893,297
Available-for-sale financial
assets
Securities listed in ROC
Equity securities $ 17,355,384 $ - $ - $ 17,355,384
(Continued)
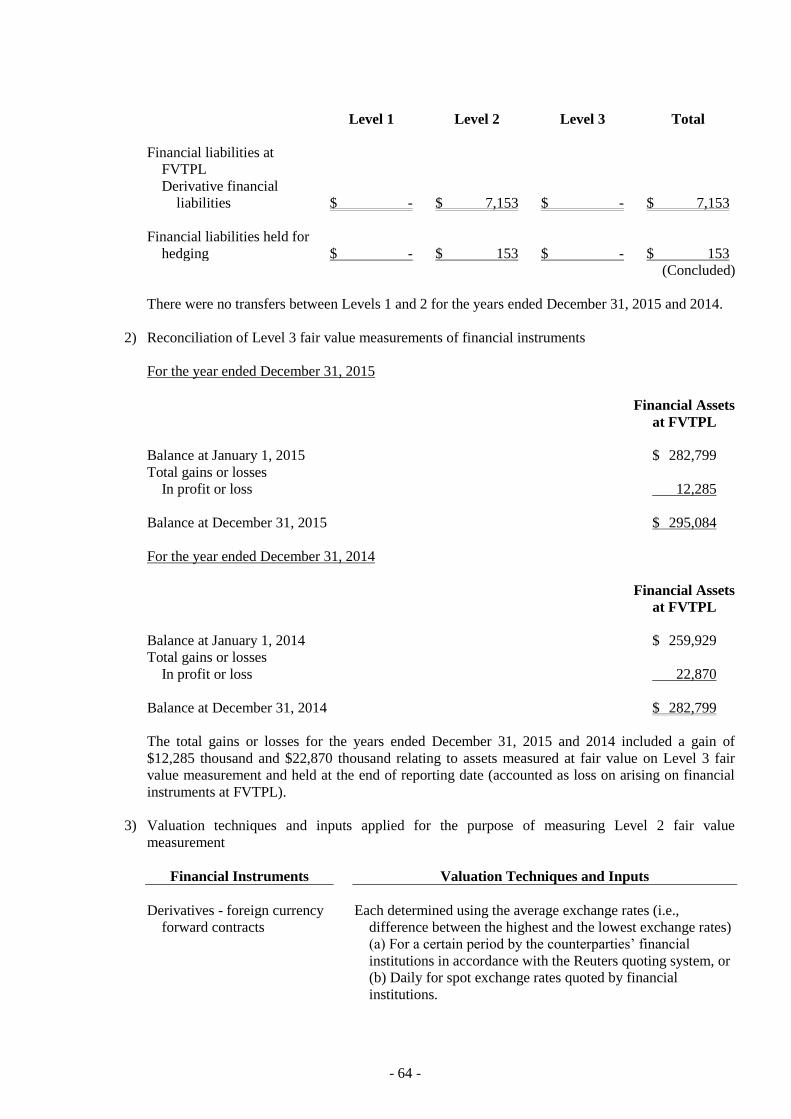
- 64 -
Level 1 Level 2 Level 3 Total
Financial liabilities at
FVTPL
Derivative financial
liabilities $ - $ 7,153 $ - $ 7,153
Financial liabilities held for
hedging $ - $ 153 $ - $ 153
(Concluded)
There were no transfers between Levels 1 and 2 for the years ended December 31, 2015 and 2014.
2) Reconciliation of Level 3 fair value measurements of financial instruments
For the year ended December 31, 2015
Financial Assets
at FVTPL
Balance at January 1, 2015 $ 282,799
Total gains or losses
In profit or loss 12,285
Balance at December 31, 2015 $ 295,084
For the year ended December 31, 2014
Financial Assets
at FVTPL
Balance at January 1, 2014 $ 259,929
Total gains or losses
In profit or loss 22,870
Balance at December 31, 2014 $ 282,799
The total gains or losses for the years ended December 31, 2015 and 2014 included a gain of
$12,285 thousand and $22,870 thousand relating to assets measured at fair value on Level 3 fair
value measurement and held at the end of reporting date (accounted as loss on arising on financial
instruments at FVTPL).
3) Valuation techniques and inputs applied for the purpose of measuring Level 2 fair value
measurement
Financial Instruments Valuation Techniques and Inputs
Derivatives - foreign currency
forward contracts
Each determined using the average exchange rates (i.e.,
difference between the highest and the lowest exchange rates)
(a) For a certain period by the counterparties’ financial
institutions in accordance with the Reuters quoting system, or
(b) Daily for spot exchange rates quoted by financial
institutions.
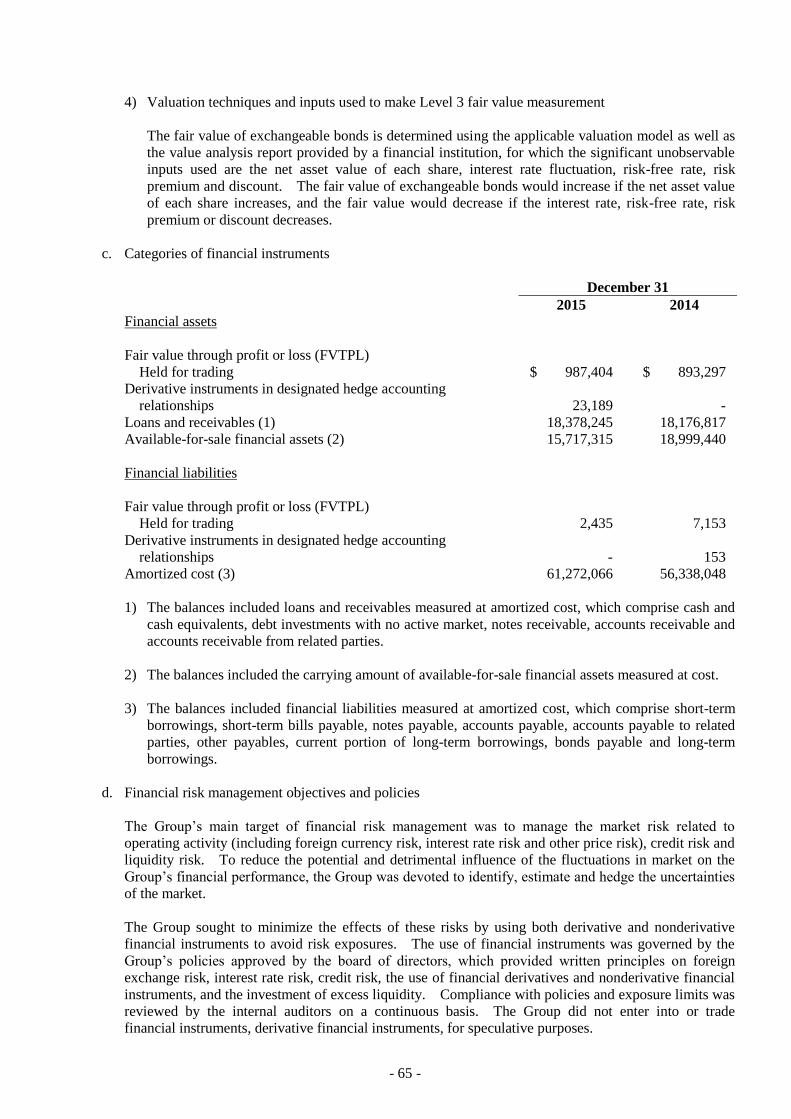
- 65 -
4) Valuation techniques and inputs used to make Level 3 fair value measurement
The fair value of exchangeable bonds is determined using the applicable valuation model as well as
the value analysis report provided by a financial institution, for which the significant unobservable
inputs used are the net asset value of each share, interest rate fluctuation, risk-free rate, risk
premium and discount. The fair value of exchangeable bonds would increase if the net asset value
of each share increases, and the fair value would decrease if the interest rate, risk-free rate, risk
premium or discount decreases.
c. Categories of financial instruments
December 31
2015 2014
Financial assets
Fair value through profit or loss (FVTPL)
Held for trading $ 987,404 $ 893,297
Derivative instruments in designated hedge accounting
relationships 23,189 -
Loans and receivables (1) 18,378,245 18,176,817
Available-for-sale financial assets (2) 15,717,315 18,999,440
Financial liabilities
Fair value through profit or loss (FVTPL)
Held for trading 2,435 7,153
Derivative instruments in designated hedge accounting
relationships - 153
Amortized cost (3) 61,272,066 56,338,048
1) The balances included loans and receivables measured at amortized cost, which comprise cash and
cash equivalents, debt investments with no active market, notes receivable, accounts receivable and
accounts receivable from related parties.
2) The balances included the carrying amount of available-for-sale financial assets measured at cost.
3) The balances included financial liabilities measured at amortized cost, which comprise short-term
borrowings, short-term bills payable, notes payable, accounts payable, accounts payable to related
parties, other payables, current portion of long-term borrowings, bonds payable and long-term
borrowings.
d. Financial risk management objectives and policies
The Group’s main target of financial risk management was to manage the market risk related to
operating activity (including foreign currency risk, interest rate risk and other price risk), credit risk and
liquidity risk. To reduce the potential and detrimental influence of the fluctuations in market on the
Group’s financial performance, the Group was devoted to identify, estimate and hedge the uncertainties
of the market.
The Group sought to minimize the effects of these risks by using both derivative and nonderivative
financial instruments to avoid risk exposures. The use of financial instruments was governed by the
Group’s policies approved by the board of directors, which provided written principles on foreign
exchange risk, interest rate risk, credit risk, the use of financial derivatives and nonderivative financial
instruments, and the investment of excess liquidity. Compliance with policies and exposure limits was
reviewed by the internal auditors on a continuous basis. The Group did not enter into or trade
financial instruments, derivative financial instruments, for speculative purposes.

- 66 -
1) Market risk
The Group’s activities exposed it primarily to the financial risks of changes in foreign currency
exchange rates, interest rates and equity prices.
a) Foreign currency risk
The Group and most subsidiaries had foreign currency assets and liabilities, which exposed it
primarily to the financial risks of changes in foreign currency exchange rates. The Group used
foreign exchange forward contracts to eliminate currency exposure. These foreign exchange
forward contracts could reduce the influence of the exchange rate fluctuations on the Group’s
income.
Sensitivity analysis
For the position of financial assets and liabilities that had significant influence on the Group, the
risk was measured by considering the net position of foreign currency forward contract that is
undue.
The Group was mainly exposed to the USD and RMB.
The following table details the Group’s sensitivity to a 5% increase and decrease in the
functional currency against the relevant foreign currencies. 5% represents management’s
assessment of the reasonably possible change in foreign exchange rate. The sensitivity
analysis included only outstanding foreign currency denominated monetary items and adjusts
their translation at the end of the reporting period for a 5% change in foreign currency rates. A
positive number below indicates an increase in pre-tax profit associated with New Taiwan
dollars strengthen 5% against the relevant currency. For a 5% weakening of New Taiwan
dollars against the relevant currency, there would be an equal and opposite impact on pre-tax
profit and the balances below would be negative.
For the Year Ended December 31
2015 2014
Influence to profit or loss at 5% variance
USD $ 254,261 $ 835,592
RMB $ 120,350 $ (113,314)
b) Interest rate risk
The Group was exposed to interest rate risk arising from borrowing at both fixed and floating
interest rates.
The carrying amount of the Group’s financial assets and financial liabilities with exposure to
interest rates at the end of the reporting period were as follows:
December 31
2015 2014
Fair value interest rate risk
Financial assets $ 2,056,848 $ 2,948,990
Financial liabilities 11,279,300 7,720,533
Cash flow interest rate risk
Financial assets 1,730,707 1,475,692
Financial liabilities 38,853,514 40,038,122

- 67 -
Sensitivity analysis
The sensitivity analysis below were determined based on the Group’s floating interest rate
financial assets and liabilities at the end of the reporting period. Management adjusted the
sensitivity rate of 0.25% for assessing interest rate risk after considering the impact of the
volatile financial market conditions. The future cash flows of the Group’s floating interest rate
financial assets and financial liabilities will change by the variance of market interest.
For the Group’s portion of floating interest rate financial assets, if interest rates had been 0.25%
higher/lower and all other variables were held constant, the Group’s pre-tax profit for the years
ended December 31, 2015 and 2014 would increase/decrease by $4,327 thousand and $3,689
thousand, respectively.
For the Group’s portion of floating interest rate financial liabilities, if interest rates had been
0.25% higher/lower and all other variables were held constant, the Group’s pre-tax profit for the
years ended December 31, 2015 and 2014 would decrease/increase by $97,134 thousand and
$100,095 thousand, respectively.
c) Other price risk
The Group was exposed to equity price risk through its investments in listed equity securities
and mutual funds.
Sensitivity analysis
The sensitivity analyses below were determined based on the exposure to equity price risks at
the end of the reporting period.
If equity prices had been 5% higher/lower, the changes in fair value of held-for-trading
investments and available-for-sale investments for the years ended December 31, 2015 and
2014 would increase/decrease by $733,772 thousand and $898,282 thousand, respectively.
2) Credit risk
Credit risk refers to the risk that counterparty will default on its contractual obligations resulting in
financial loss to the Group. As at the end of the reporting period, the Group’s maximum exposure
to credit risk which will cause a financial loss to the Group due to failure to discharge an obligation
by the counterparties is arising from the carrying amount of the respective recognized financial
assets which comprise receivables from operating activities and financial assets from investing
activities as stated in the consolidated balance sheets.
The Group did transactions with a large number of unrelated customers and various industries.
The Group continuously evaluated the financial conditions of those customers.
To maintain the quality of the accounts receivable, the Group has built a credit risk management
procedure to reduce the credit risk from specific customer. The credit evaluation of individual
customer includes considering factors that will affect its payment ability such as financial condition,
past transaction records and current economic conditions. Credit risk of bank deposits,
fixed-income investments and other financial instruments with banks is evaluated and monitored by
the Group’s financial department. Since the counterparties are creditworthy banks and financial
institutions with good credit rating, thus, there’s no significant credit risk.

- 68 -
3) Liquidity risk
The objective of liquidity risk management is to maintain adequate cash and cash equivalents with
high liquidity and sufficient bank facilities that business operation requires and to ensure the Group
has sufficient financial flexibility.
As of December 31, 2015 and 2014, the amount of unused financing facilities were $31,771,649
thousand and $34,962,960 thousand.
The following table details the Group’s remaining contractual maturity for its non-derivative
financial liabilities with agreed repayment periods by financial institutions. The tables had been
drawn up based on the undiscounted cash flows of financial liabilities from the earliest date on
which the Group can be required to pay. The tables included both interest and principal cash
flows. Specifically, loans with a repayment on demand clause were included in the earliest time
band regardless of the probability of the financial institutes choosing to exercise their rights.
To the extent that interest flows are floating rate, the undiscounted amount was derived from the
interest rate curve at the end of the reporting period.
December 31, 2015
Less than
1 Year 1-5 Years 5+ Years
Non-derivative financial liabilities
Variable interest rate liabilities $ 10,885,523 $ 29,209,925 $ -
Fixed interest rate liabilities 11,289,000 - -
$ 22,174,523 $ 29,209,925 $ -
December 31, 2014
Less than
1 Year 1-5 Years 5+ Years
Non-derivative financial liabilities
Variable interest rate liabilities $ 13,081,304 $ 28,456,272 $ -
Fixed interest rate liabilities 7,734,582 - -
$ 20,815,886 $ 28,456,272 $ -
29. TRANSACTIONS WITH RELATED PARTIES
Balances and transactions between the Company and its subsidiaries, which are related parties of the
Company, have been eliminated on consolidation and are not disclosed in this note. Details of
transactions between the Group and other related parties are disclosed below.
a. Sales of goods
For the Year Ended December 31
Related Parties Types 2015 2014
Associates and others $ 178,626 $ 396,568
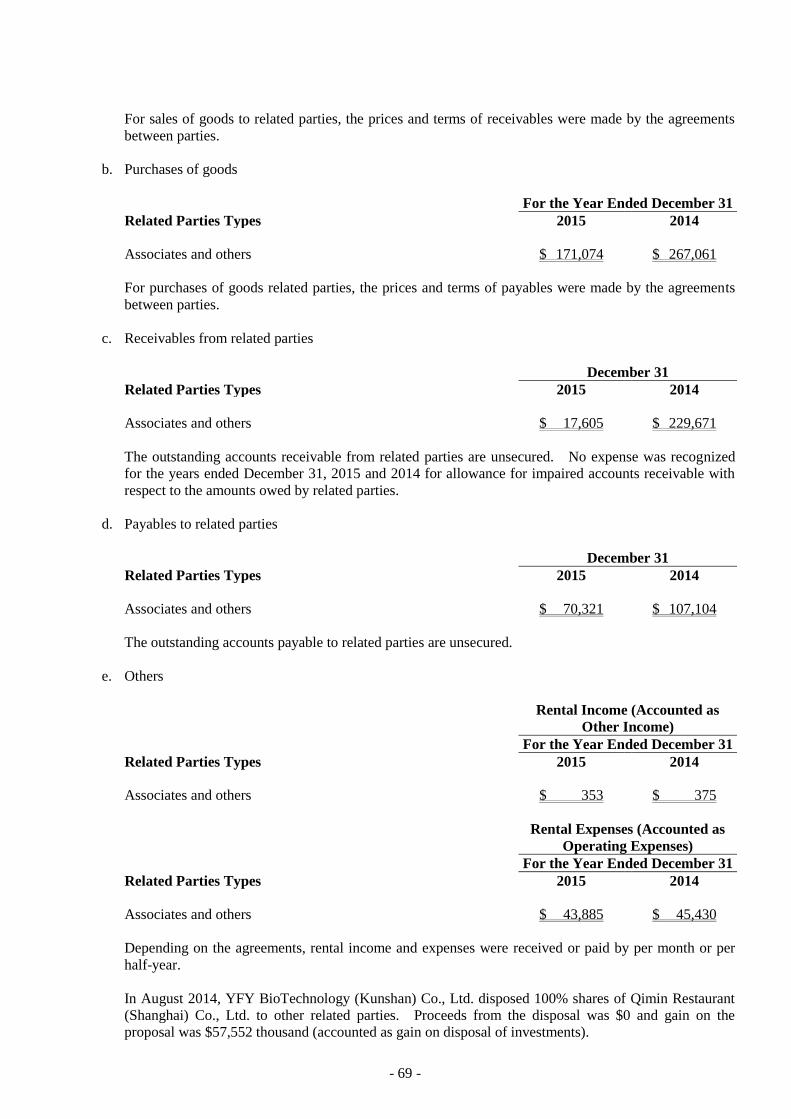
- 69 -
For sales of goods to related parties, the prices and terms of receivables were made by the agreements
between parties.
b. Purchases of goods
For the Year Ended December 31
Related Parties Types 2015 2014
Associates and others $ 171,074 $ 267,061
For purchases of goods related parties, the prices and terms of payables were made by the agreements
between parties.
c. Receivables from related parties
December 31
Related Parties Types 2015 2014
Associates and others $ 17,605 $ 229,671
The outstanding accounts receivable from related parties are unsecured. No expense was recognized
for the years ended December 31, 2015 and 2014 for allowance for impaired accounts receivable with
respect to the amounts owed by related parties.
d. Payables to related parties
December 31
Related Parties Types 2015 2014
Associates and others $ 70,321 $ 107,104
The outstanding accounts payable to related parties are unsecured.
e. Others
Rental Income (Accounted as
Other Income)
For the Year Ended December 31
Related Parties Types 2015 2014
Associates and others $ 353 $ 375
Rental Expenses (Accounted as
Operating Expenses)
For the Year Ended December 31
Related Parties Types 2015 2014
Associates and others $ 43,885 $ 45,430
Depending on the agreements, rental income and expenses were received or paid by per month or per
half-year.
In August 2014, YFY BioTechnology (Kunshan) Co., Ltd. disposed 100% shares of Qimin Restaurant
(Shanghai) Co., Ltd. to other related parties. Proceeds from the disposal was $0 and gain on the
proposal was $57,552 thousand (accounted as gain on disposal of investments).
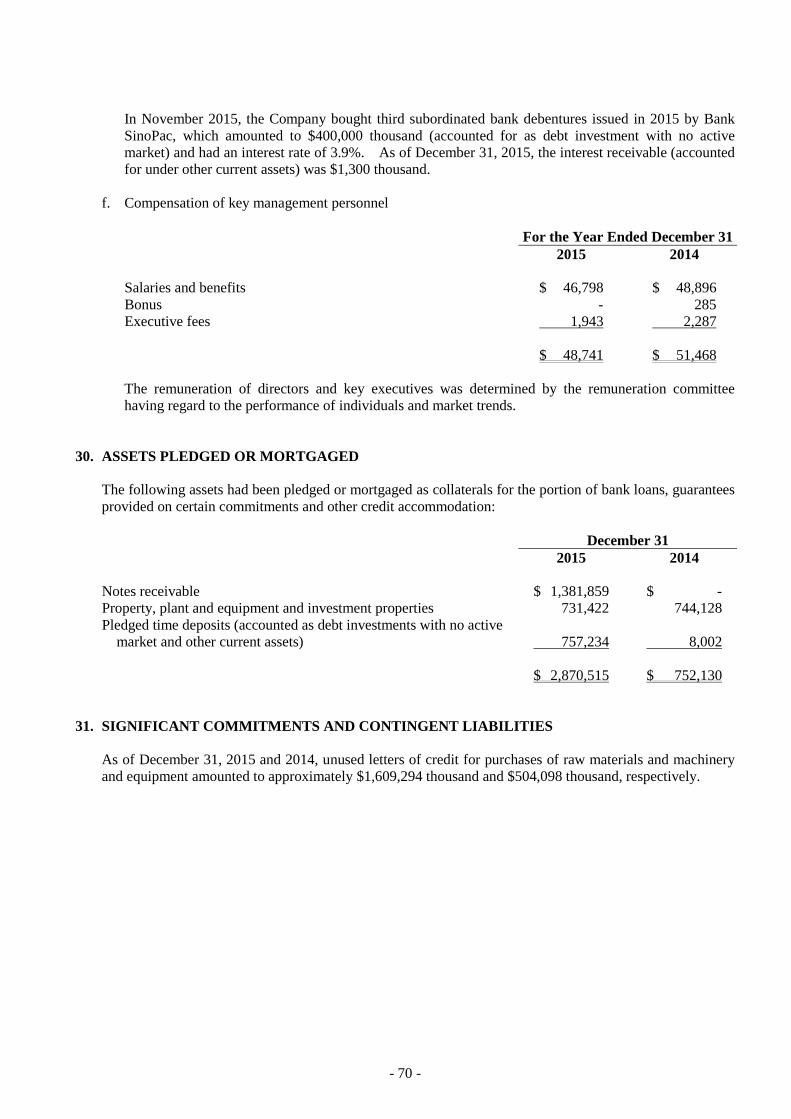
- 70 -
In November 2015, the Company bought third subordinated bank debentures issued in 2015 by Bank
SinoPac, which amounted to $400,000 thousand (accounted for as debt investment with no active
market) and had an interest rate of 3.9%. As of December 31, 2015, the interest receivable (accounted
for under other current assets) was $1,300 thousand.
f. Compensation of key management personnel
For the Year Ended December 31
2015 2014
Salaries and benefits $ 46,798 $ 48,896
Bonus - 285
Executive fees 1,943 2,287
$ 48,741 $ 51,468
The remuneration of directors and key executives was determined by the remuneration committee
having regard to the performance of individuals and market trends.
30. ASSETS PLEDGED OR MORTGAGED
The following assets had been pledged or mortgaged as collaterals for the portion of bank loans, guarantees
provided on certain commitments and other credit accommodation:
December 31
2015 2014
Notes receivable $ 1,381,859 $ -
Property, plant and equipment and investment properties 731,422 744,128
Pledged time deposits (accounted as debt investments with no active
market and other current assets) 757,234 8,002
$ 2,870,515 $ 752,130
31. SIGNIFICANT COMMITMENTS AND CONTINGENT LIABILITIES
As of December 31, 2015 and 2014, unused letters of credit for purchases of raw materials and machinery
and equipment amounted to approximately $1,609,294 thousand and $504,098 thousand, respectively.

- 71 -
32. EXCHANGE RATE OF FINANCIAL ASSETS AND LIABILITIES DENOMINATED IN
FOREIGN CURRENCIES
The significant financial assets and liabilities denominated in foreign currencies were as follows:
December 31, 2015
Foreign
Currencies Exchange Rate
New Taiwan
Dollars
Financial assets
Monetary items
USD $ 52,163 32.825 (USD:NTD) $ 1,712,239
USD 29,994 6.49 (USD:RMB) 984,567
RMB 208,551 5.05 (RMB:NTD) 1,054,221
RMB 500,917 0.154 (RMB:USD) 2,532,126
Non-monetary items
USD 8,990 32.825 (USD:NTD) 295,084
Investments accounted for using equity
method
USD 20,235 32.825 (USD:NTD) 664,222
Financial liabilities
Monetary items
USD 21,931 32.825 (USD:NTD) 719,881
USD 215,348 6.49 (USD:RMB) 7,068,797
RMB 1,185,633 0.154 (RMB:USD) 5,993,346
December 31, 2014
Foreign
Currencies Exchange Rate
New Taiwan
Dollars
Financial assets
Monetary items
USD $ 60,056 31.65 (USD:NTD) $ 1,900,762
USD 42,837 6.12 (USD:RMB) 1,355,791
RMB 159,333 5.17 (RMB:NTD) 824,135
RMB 598,993 0.1634 (RMB:USD) 3,098,238
Non-monetary items
USD 8,935 31.65 (USD:NTD) 282,799
Investments accounted for using equity
method
USD 17,992 31.65 (USD:NTD) 569,449
Financial liabilities
Monetary items
USD 24,652 31.65 (USD:NTD) 780,248
USD 622,298 6.12 (USD:RMB) 19,695,718
RMB 320,178 0.1634 (RMB:USD) 1,656,092
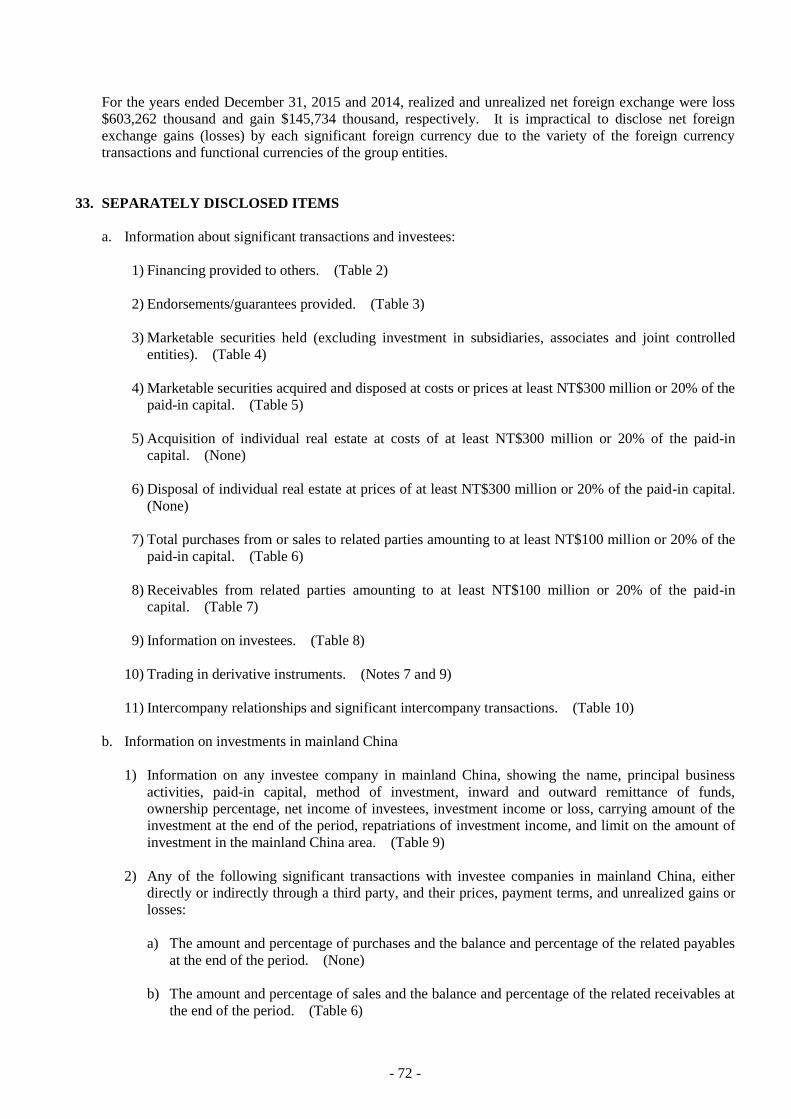
- 72 -
For the years ended December 31, 2015 and 2014, realized and unrealized net foreign exchange were loss
$603,262 thousand and gain $145,734 thousand, respectively. It is impractical to disclose net foreign
exchange gains (losses) by each significant foreign currency due to the variety of the foreign currency
transactions and functional currencies of the group entities.
33. SEPARATELY DISCLOSED ITEMS
a. Information about significant transactions and investees:
1) Financing provided to others. (Table 2)
2) Endorsements/guarantees provided. (Table 3)
3) Marketable securities held (excluding investment in subsidiaries, associates and joint controlled
entities). (Table 4)
4) Marketable securities acquired and disposed at costs or prices at least NT$300 million or 20% of the
paid-in capital. (Table 5)
5) Acquisition of individual real estate at costs of at least NT$300 million or 20% of the paid-in
capital. (None)
6) Disposal of individual real estate at prices of at least NT$300 million or 20% of the paid-in capital.
(None)
7) Total purchases from or sales to related parties amounting to at least NT$100 million or 20% of the
paid-in capital. (Table 6)
8) Receivables from related parties amounting to at least NT$100 million or 20% of the paid-in
capital. (Table 7)
9) Information on investees. (Table 8)
10) Trading in derivative instruments. (Notes 7 and 9)
11) Intercompany relationships and significant intercompany transactions. (Table 10)
b. Information on investments in mainland China
1) Information on any investee company in mainland China, showing the name, principal business
activities, paid-in capital, method of investment, inward and outward remittance of funds,
ownership percentage, net income of investees, investment income or loss, carrying amount of the
investment at the end of the period, repatriations of investment income, and limit on the amount of
investment in the mainland China area. (Table 9)
2) Any of the following significant transactions with investee companies in mainland China, either
directly or indirectly through a third party, and their prices, payment terms, and unrealized gains or
losses:
a) The amount and percentage of purchases and the balance and percentage of the related payables
at the end of the period. (None)
b) The amount and percentage of sales and the balance and percentage of the related receivables at
the end of the period. (Table 6)
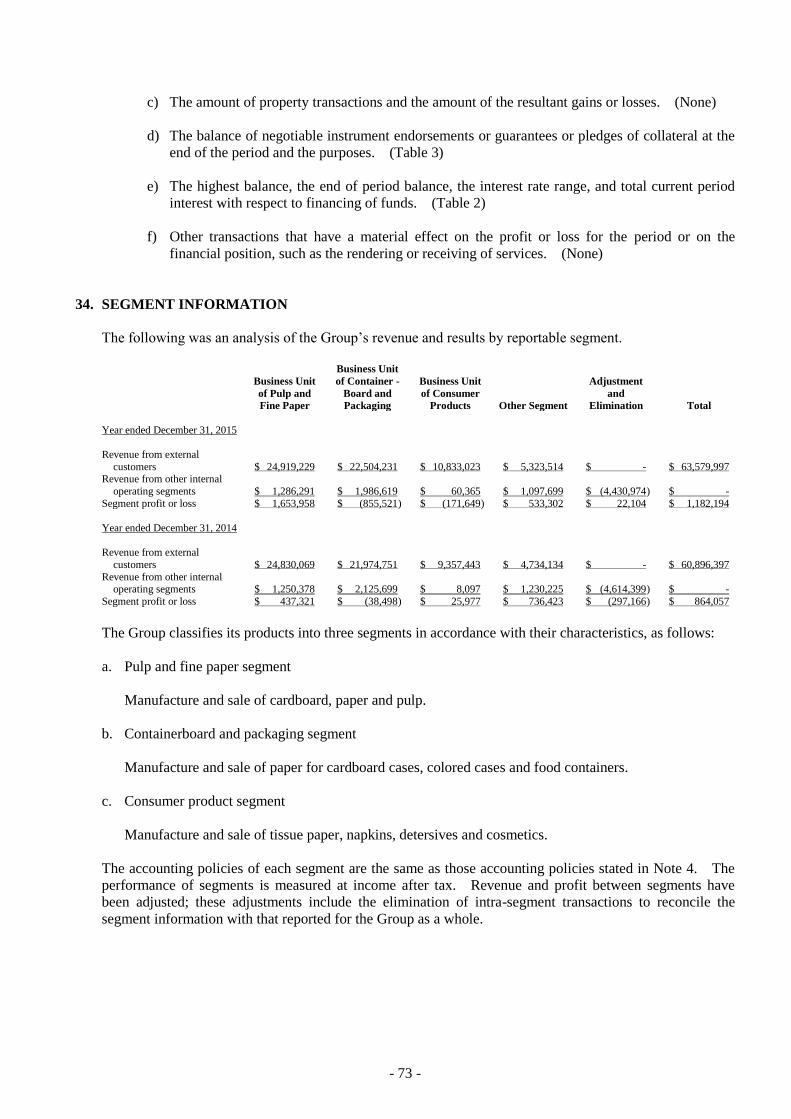
- 73 -
c) The amount of property transactions and the amount of the resultant gains or losses. (None)
d) The balance of negotiable instrument endorsements or guarantees or pledges of collateral at the
end of the period and the purposes. (Table 3)
e) The highest balance, the end of period balance, the interest rate range, and total current period
interest with respect to financing of funds. (Table 2)
f) Other transactions that have a material effect on the profit or loss for the period or on the
financial position, such as the rendering or receiving of services. (None)
34. SEGMENT INFORMATION
The following was an analysis of the Group’s revenue and results by reportable segment.
Business Unit
of Pulp and
Fine Paper
Business Unit
of Container -
Board and
Packaging
Business Unit
of Consumer
Products Other Segment
Adjustment
and
Elimination Total
Year ended December 31, 2015
Revenue from external
customers $ 24,919,229 $ 22,504,231 $ 10,833,023 $ 5,323,514 $ - $ 63,579,997 Revenue from other internal
operating segments $ 1,286,291 $ 1,986,619 $ 60,365 $ 1,097,699 $ (4,430,974 ) $ -
Segment profit or loss $ 1,653,958 $ (855,521 ) $ (171,649 ) $ 533,302 $ 22,104 $ 1,182,194
Year ended December 31, 2014
Revenue from external
customers $ 24,830,069 $ 21,974,751 $ 9,357,443 $ 4,734,134 $ - $ 60,896,397
Revenue from other internal operating segments $ 1,250,378 $ 2,125,699 $ 8,097 $ 1,230,225 $ (4,614,399 ) $ -
Segment profit or loss $ 437,321 $ (38,498 ) $ 25,977 $ 736,423 $ (297,166 ) $ 864,057
The Group classifies its products into three segments in accordance with their characteristics, as follows:
a. Pulp and fine paper segment
Manufacture and sale of cardboard, paper and pulp.
b. Containerboard and packaging segment
Manufacture and sale of paper for cardboard cases, colored cases and food containers.
c. Consumer product segment
Manufacture and sale of tissue paper, napkins, detersives and cosmetics.
The accounting policies of each segment are the same as those accounting policies stated in Note 4. The
performance of segments is measured at income after tax. Revenue and profit between segments have
been adjusted; these adjustments include the elimination of intra-segment transactions to reconcile the
segment information with that reported for the Group as a whole.
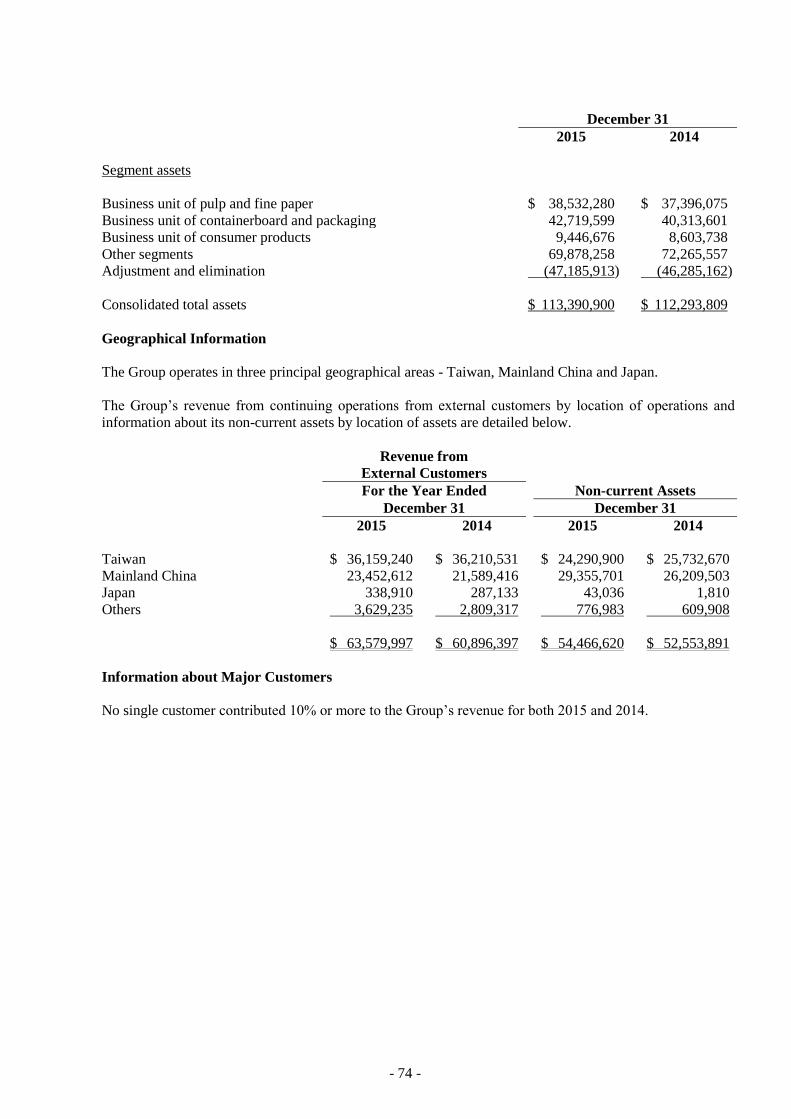
- 74 -
December 31
2015 2014
Segment assets
Business unit of pulp and fine paper $ 38,532,280 $ 37,396,075
Business unit of containerboard and packaging 42,719,599 40,313,601
Business unit of consumer products 9,446,676 8,603,738
Other segments 69,878,258 72,265,557
Adjustment and elimination (47,185,913) (46,285,162)
Consolidated total assets $ 113,390,900 $ 112,293,809
Geographical Information
The Group operates in three principal geographical areas - Taiwan, Mainland China and Japan.
The Group’s revenue from continuing operations from external customers by location of operations and
information about its non-current assets by location of assets are detailed below.
Revenue from
External Customers
For the Year Ended Non-current Assets
December 31 December 31
2015 2014 2015 2014
Taiwan $ 36,159,240 $ 36,210,531 $ 24,290,900 $ 25,732,670
Mainland China 23,452,612 21,589,416 29,355,701 26,209,503
Japan 338,910 287,133 43,036 1,810
Others 3,629,235 2,809,317 776,983 609,908
$ 63,579,997 $ 60,896,397 $ 54,466,620 $ 52,553,891
Information about Major Customers
No single customer contributed 10% or more to the Group’s revenue for both 2015 and 2014.
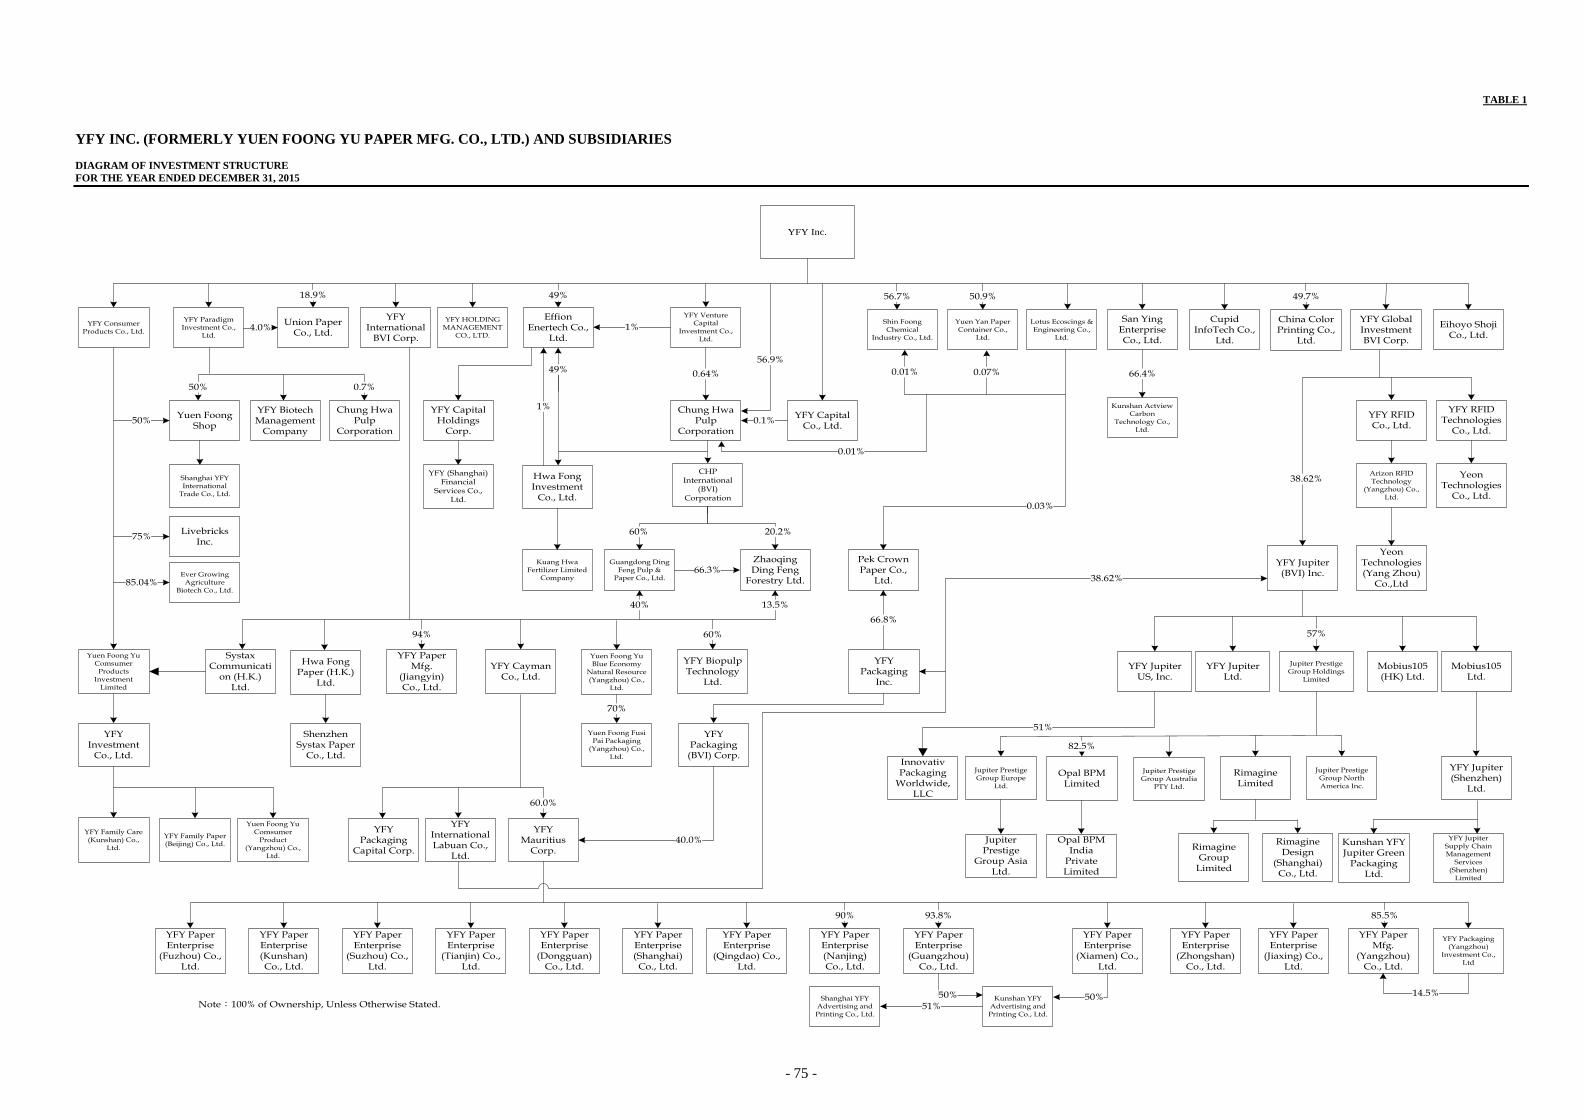
- 75 -
TABLE 1
YFY INC. (FORMERLY YUEN FOONG YU PAPER MFG. CO., LTD.) AND SUBSIDIARIES
DIAGRAM OF INVESTMENT STRUCTURE
FOR THE YEAR ENDED DECEMBER 31, 2015
YFY Inc.
San Ying Enterprise Co., Ltd.
Lotus Ecoscings & Engineering Co.,
Ltd.
Yuen Yan Paper Container Co.,
Ltd.
Shin Foong Chemical
Industry Co., Ltd.
Union Paper Co., Ltd.
YFY HOLDING MANAGEMENT
CO., LTD.
YFY Consumer Products Co., Ltd.
18.9% 50.9%
YFY Biotech Management
Company
YFY Jupiter (BVI) Inc.
YFY RFID Co., Ltd.
YFY RFID Technologies
Co., Ltd.
38.62% Yeon Technologies
Co., Ltd.
Arizon RFID Technology
(Yangzhou) Co., Ltd.
YFY Jupiter Ltd.
Jupiter Prestige Group Holdings
Limited
Mobius105 (HK) Ltd.
Mobius105 Ltd.
57%
YFY Jupiter (Shenzhen)
Ltd.
YFY Jupiter Supply Chain Management
Services (Shenzhen)
Limited
YFY Biopulp Technology
Ltd.
Yuen Foong Yu Blue Economy
Natural Resource (Yangzhou) Co.,
Ltd.
YFY Paper Mfg.
(Jiangyin) Co., Ltd.
Yuen Foong Yu Comsumer Products
Investment Limited
94% 60%
YFY Mauritius
Corp.
YFY Packaging (BVI) Corp.
Pek Crown Paper Co.,
Ltd.
Hwa Fong Paper (H.K.)
Ltd.
Shenzhen Systax Paper
Co., Ltd.
YFY Investment
Co., Ltd.
YFY Family Paper (Beijing) Co., Ltd.
Yuen Foong Yu Comsumer
Product (Yangzhou) Co.,
Ltd.
Systax Communicati
on (H.K.) Ltd.
YFY Cayman Co., Ltd.
YFY International Labuan Co.,
Ltd.
YFY Packaging
Inc.
66.8%
0.03%
60.0%
40.0%
YFY Paper Enterprise
(Fuzhou) Co., Ltd.
YFY Paper Enterprise (Kunshan) Co., Ltd.
YFY Paper Enterprise
(Suzhou) Co., Ltd.
YFY Paper Enterprise
(Tianjin) Co., Ltd.
YFY Paper Enterprise
(Dongguan) Co., Ltd.
YFY Paper Enterprise (Shanghai) Co., Ltd.
YFY Paper Enterprise
(Qingdao) Co., Ltd.
YFY Paper Enterprise (Nanjing) Co., Ltd.
YFY Paper Enterprise
(Guangzhou) Co., Ltd.
YFY Paper Enterprise
(Xiamen) Co., Ltd.
YFY Paper Enterprise
(Zhongshan) Co., Ltd.
YFY Paper Enterprise
(Jiaxing) Co., Ltd.
YFY Paper Mfg.
(Yangzhou) Co., Ltd.
90% 93.8%
Kunshan YFY Advertising and Printing Co., Ltd.
50% 50%Shanghai YFY Advertising and Printing Co., Ltd.
51%
YFY International
BVI Corp.
Note:100% of Ownership, Unless Otherwise Stated.
50%Yuen Foong
Shop
YFY Paradigm Investment Co.,
Ltd.
Effion Enertech Co.,
Ltd.
49%
YFY Capital Co., Ltd.
56.9%
Hwa Fong Investment
Co., Ltd.
CHP International
(BVI) Corporation
Chung Hwa Pulp
Corporation
Guangdong Ding Feng Pulp &
Paper Co., Ltd.
Zhaoqing Ding Feng
Forestry Ltd.
60%
66.3%
40% 13.5%
Chung Hwa Pulp
Corporation
0.7%
Rimagine Limited
Rimagine Group
Limited
Rimagine Design
(Shanghai) Co., Ltd.
YFY Venture Capital
Investment Co., Ltd.
75%Livebricks
Inc.
YFY Family Care (Kunshan) Co.,
Ltd.
YFY Packaging (Yangzhou)
Investment Co., Ltd
85.5%
14.5%
20.2%
YFY Capital Holdings
Corp.
YFY (Shanghai) Financial
Services Co., Ltd.
Jupiter Prestige Group North America Inc.
Opal BPM Limited
Jupiter Prestige Group Europe
Ltd.
Jupiter Prestige
Group Asia Ltd.
82.5%
YFY Jupiter US, Inc.
Ever Growing Agriculture
Biotech Co., Ltd.85.04%
Yuen Foong Fusi Pai Packaging
(Yangzhou) Co., Ltd.
70%
YFY Packaging
Capital Corp.
51%
China Color Printing Co.,
Ltd.
49.7%
38.62%
0.01% 0.07%
4.0%
Kunshan YFY Jupiter Green
Packaging Ltd.
Yeon Technologies (Yang Zhou)
Co.,Ltd
Innovativ Packaging
Worldwide, LLC
49% 0.64%
Kuang Hwa Fertilizer Limited
Company
0.01%
Cupid InfoTech Co.,
Ltd.
YFY Global Investment BVI Corp.
Eihoyo Shoji Co., Ltd.
0.1%
56.7%
50%
Shanghai YFY International
Trade Co., Ltd.
1%
1%
Kunshan Actview Carbon
Technology Co., Ltd.
66.4%
Jupiter Prestige Group Australia
PTY Ltd.
Opal BPMIndia
PrivateLimited

- 76 -
TABLE 2
YFY INC. (FORMERLY YUEN FOONG YU PAPER MFG. CO., LTD.) AND SUBSIDIARIES
FINANCING PROVIDED TO OTHERS
FOR THE YEAR ENDED DECEMBER 31, 2015
(In Thousands of New Taiwan Dollars, Unless Stated Otherwise)
No. Lender Borrower Financial
Statement Account
Related
Party
Highest Balance
for the Period
(Note 3)
Ending Balance
(Note 3)
Actual Borrowing
Amount
(Note 3)
Interest
Rate
(%)
Nature of
Financing
Business
Transaction
Amounts
(Note 3)
Reasons for
Short-term
Financing
Allowance for
Impairment Loss
(Note 3)
Collateral Financing Limit
for Each
Borrower
(Notes 1 and 3)
Aggregate
Financing Limits
(Notes 1 and 3)
Note Item Value
1 YFY International BVI Corp.
YFY Paper Mfg. (Yangzhou) Co.,
Ltd.
Long-term receivables from
related parties
Yes $ 5,074,745 (US$ 154,600
thousand)
$ 5,074,745 (US$ 154,600
thousand)
$ 5,074,745 (US$ 154,600
thousand)
2-2.37 Short-term financing
$ - Financing for working capital
requirements
$ - - $ - $ 46,725,337 (US$ 1,423,468
thousand)
$ 46,725,337 (US$ 1,423,468
thousand)
Note 2
YFY Paper Mfg. (Yangzhou) Co.,
Ltd.
Long-term receivables from
related parties
Yes 656,500 (US$ 20,000
thousand)
656,500 (US$ 20,000
thousand)
656,500 (US$ 20,000
thousand)
2 Short-term financing
- Financing for working capital
requirements
- - - 46,725,337 (US$ 1,423,468
thousand)
46,725,337 (US$ 1,423,468
thousand)
Note 2
YFY Family Paper (Beijing) Co., Ltd.
Other receivables from related
parties
Yes 98,475 (US$ 3,000
thousand)
- - - Short-term financing
- Financing for working capital
requirements
- - - 46,725,337 (US$ 1,423,468
thousand)
46,725,337 (US$ 1,423,468
thousand)
Note 2
Systax Communication
(H.K.) Ltd.
Other receivables from related
parties
Yes 77,861 (US$ 2,372
thousand)
77,861 (US$ 2,372
thousand)
71,296 (US$ 2,172
thousand)
2 Short-term financing
- Financing for working capital
requirements
- - - 46,725,337 (US$ 1,423,468
thousand)
46,725,337 (US$ 1,423,468
thousand)
Note 2
YFY Paper Enterprise
(Nanjing) Co.,
Ltd.
Other receivables from related
parties
Yes 459,550 (US$ 14,000
thousand)
391,602 (US$ 11,930
thousand)
391,602 (US$ 11,930
thousand)
2 Short-term financing
- Financing for working capital
requirements
- - - 9,345,081 (US$ 284,694
thousand)
18,690,128 (US$ 569,387
thousand)
Note 2
YFY Paper Mfg.
(Jiangyin) Co.,
Ltd.
Other receivables
from related
parties
Yes 229,775
(US$ 7,000
thousand)
229,775
(US$ 7,000
thousand)
229,775
(US$ 7,000
thousand)
2 Short-term
financing
- Financing for
working capital
requirements
- - - 9,345,081
(US$ 284,694
thousand)
18,690,128
(US$ 569,387
thousand)
Note 2
YFY BioTechnology
(Kunshan) Co.,
Ltd.
Other receivables No 131,300
(US$ 4,000
thousand)
131,300
(US$ 4,000
thousand)
131,300
(US$ 4,000
thousand)
2 Short-term
financing
- Financing for
working capital
requirements
- - - 9,345,081
(US$ 284,694
thousand)
18,690,128
(US$ 569,387
thousand)
-
YFY BioTechnology
(Kunshan) Co., Ltd.
Other receivables No 242,639
(RMB 48,000 thousand)
242,639
(RMB 48,000 thousand)
242,639
(RMB 48,000 thousand)
2 Short-term
financing
- Financing for
working capital requirements
- - - 9,345,081
(US$ 284,694 thousand)
18,690,128
(US$ 569,387 thousand )
-
YFY Paper
Enterprise (Tianjin) Co., Ltd.
Other receivables
from related parties
Yes 32,825
(US$ 1,000 thousand)
32,825
(US$ 1,000 thousand)
32,825
(US$ 1,000 thousand)
2 Short-term
financing
- Financing for
working capital requirements
- - - 46,725,337
(US$ 1,423,468 thousand)
46,725,337
(US$ 1,423,468 thousand)
Note 2
YFY Paper
Enterprise (Qingdao) Co.,
Ltd.
Other receivables
from related parties
Yes 142,789
(US$ 4,350 thousand)
142,789
(US$ 4,350 thousand)
77,139
(US$ 2,350 thousand)
2 Short-term
financing
- Financing for
working capital requirements
- - - 46,725,337
(US$ 1,423,468 thousand)
46,725,337
(US$ 1,423,468 thousand)
Note 2
YFY Paper Enterprise
(Kunshan) Co.,
Ltd.
Long-term receivables from
related parties
Yes 1,086,820 (RMB 215,000
thousand)
1,086,820 (RMB 215,000
thousand)
793,631 (RMB 157,000
thousand)
2 Short-term financing
- Financing for working capital
requirements
- - - 46,725,337 (US$ 1,423,468
thousand)
46,725,337 (US$ 1,423,468
thousand)
Note 2
YFY Packaging
(Yangzhou)
Investment Co., Ltd.
Other receivables
from related
parties
Yes 558,025
(US$ 17,000
thousand)
492,375
(US$ 15,000
thousand)
492,375
(US$ 15,000
thousand)
2.37 Short-term
financing
- Financing for
working capital
requirements
- - - 46,725,337
(US$ 1,423,468
thousand)
46,725,337
(US$ 1,423,468
thousand)
Note 2
2 YFY Global
Investment BVI Corp.
YFY Paper Mfg.
(Yangzhou) Co., Ltd.
Other receivables
from related parties
Yes 328,250
(US$ 10,000 thousand)
328,250
(US$ 10,000 thousand)
328,250
(US$ 10,000 thousand)
2 Short-term
financing
- Financing for
working capital requirements
- - - 9,281,039
(US$ 282,743 thousand)
9,281,039
(US$ 282,743 thousand)
Note 2
YFY Paper Mfg.
(Jiangyin) Co., Ltd.
Other receivables
from related parties
Yes 259,318
(US$ 7,900 thousand)
259,318
(US$ 7,900 thousand)
259,318
(US$ 7,900 thousand)
2 Short-term
financing
- Financing for
working capital requirements
- - - 1,856,221
(US$ 56,549 thousand )
3,712,409
(US$ 113,097 thousand )
Note 2
Chinese Cubes Co.,
Ltd.
Other receivables No 150,174
(US$ 4,575 thousand)
- - - Short-term
financing
- Financing for
working capital requirements
- - - 1,856,221
(US$ 56,549 thousand)
3,712,409
(US$ 113,097 thousand)
-
YFY Cayman Co., Ltd.
Other receivables from related
parties
Yes 361,075 (US$ 11,000
thousand)
361,075 (US$ 11,000
thousand)
361,075 (US$ 11,000
thousand)
1 Short-term financing
- Financing for working capital
requirements
- - - 9,281,039 (US$ 282,743
thousand)
9,281,039 (US$ 282,743
thousand)
Note 2
(Continued)

- 77 -
No. Lender Borrower Financial
Statement Account
Related
Party
Highest Balance
for the Period
(Note 3)
Ending Balance
(Note 3)
Actual Borrowing
Amount
(Note 3)
Interest
Rate
(%)
Nature of
Financing
Business
Transaction
Amounts
(Note 3)
Reasons for
Short-term
Financing
Allowance for
Impairment Loss
(Note 3)
Collateral Financing Limit
for Each
Borrower
(Notes 1 and 3)
Aggregate
Financing Limits
(Notes 1 and 3) Note
Item Value
3 YFY Paper Mfg.
(Yangzhou) Co., Ltd.
YFY Paper Mfg.
(Jiangyin) Co., Ltd.
Other receivables
from related parties
Yes $ 497,844
(RMB 98,486 thousand)
$ 450,105
(RMB 89,042 thousand)
$ 421,489
(RMB 83,381 thousand)
2.25 Short-term
financing
$ - Financing for
working capital requirements
$ - - $ - $ 450,105
(RMB 89,042 thousand)
$ 3,600,827
(RMB 712,333 thousand)
Note 2
Shenzhen Systax
Paper Co., Ltd.
Other receivables
from related parties
Yes 9,956,859
(RMB 1,969,714 thousand)
9,002,075
(RMB 1,780,834 thousand)
- - Short-term
financing
- Financing for
working capital requirements
- - - 9,002,075
(RMB 1,780,834 thousand)
9,002,075
(RMB 1,780,834 thousand)
Note 2
Yuen Foong Yu
Blue Economy Natural Resource
(Yangzhou) Co.,
Ltd.
Other receivables
from related parties
Yes 9,956,859
(RMB 1,969,714 thousand)
9,002,075
(RMB 1,780,834 thousand)
10
(RMB 2 thousand)
2.25 Short-term
financing
- Financing for
working capital requirements
- - - 9,002,075
(RMB 1,780,834 thousand)
9,002,075
(RMB 1,780,834 thousand)
Note 2
Kunshan YFY
Advertising and
Printing Co., Ltd.
Other receivables
from related
parties
Yes 9,956,859
(RMB 1,969,714
thousand)
9,002,075
(RMB 1,780,834
thousand)
425,351
(RMB 84,145
thousand)
2.25 Short-term
financing
- Financing for
working capital
requirements
- - - 9,002,075
(RMB 1,780,834
thousand)
9,002,075
(RMB 1,780,834
thousand)
Note 2
YFY Family Care
(Kunshan) Co.,
Ltd.
Other receivables
from related
parties
Yes 9,956,859
(RMB 1,969,714
thousand)
9,002,075
(RMB 1,780,834
thousand)
- - Short-term
financing
- Financing for
working capital
requirements
- - - 9,002,075
(RMB 1,780,834
thousand)
9,002,075
(RMB 1,780,834
thousand)
Note 2
YFY Paper
Enterprise
(Suzhou) Co., Ltd.
Other receivables
from related
parties
Yes 9,956,859
(RMB 1,969,714
thousand)
9,002,075
(RMB 1,780,834
thousand)
67,459
(RMB 13,345
thousand)
2.25 Short-term
financing
- Financing for
working capital
requirements
- - - 9,002,075
(RMB 1,780,834
thousand)
9,002,075
(RMB 1,780,834
thousand)
Note 2
YFY Paper
Enterprise (Fuzhou) Co.,
Ltd.
Other receivables
from related parties
Yes 9,956,859
(RMB 1,969,714 thousand)
9,002,075
(RMB 1,780,834 thousand)
489,054
(RMB 96,747 thousand)
2.25 Short-term
financing
- Financing for
working capital requirements
- - - 9,002,075
(RMB 1,780,834 thousand)
9,002,075
(RMB 1,780,834 thousand)
Note 2
YFY Paper Enterprise
(Shanghai) Co.,
Ltd.
Other receivables from related
parties
Yes 9,956,859 (RMB 1,969,714
thousand)
9,002,075 (RMB 1,780,834
thousand)
204,054 (RMB 40,367
thousand)
2.25 Short-term financing
- Financing for working capital
requirements
- - - 9,002,075 (RMB 1,780,834
thousand)
9,002,075 (RMB 1,780,834
thousand)
Note 2
YFY BioTechnology
(Kunshan) Co.,
Ltd.
Other receivables No 497,844
(RMB 98,486
thousand)
101,100
(RMB 20,000
thousand)
47,092
(RMB 9,316
thousand)
2.25 Short-term
financing
- Financing for
working capital
requirements
- - - 450,105
(RMB 89,042
thousand)
3,600,827
(RMB 712,333
thousand)
-
Sinopac
International
Leasing (Tianjin) Corp.
Other receivables No 101,100
(RMB 20,000
thousand)
- - - Short-term
financing
- Financing for
working capital
requirements
- - - 1,800,416
(RMB 356,167
thousand)
3,600,827
(RMB 712,333
thousand)
-
YFY Paper
Enterprise (Nanjing) Co.,
Ltd.
Other receivables
from related parties
Yes 497,844
(RMB 98,486 thousand)
450,105
(RMB 89,042 thousand)
85,399
(RMB 16,894 thousand)
2.25 Short-term
financing
- Financing for
working capital requirements
- - - 450,105
(RMB 89,042 thousand)
3,600,827
(RMB 712,333 thousand)
Note 2
YFY Paper Enterprise
(Dongguan) Co.,
Ltd.
Other receivables from related
parties
Yes 9,956,859 (RMB 1,969,714
thousand)
9,002,075 (RMB 1,780,834
thousand)
-
- Short-term financing
- Financing for working capital
requirements
- - - 9,002,075 (RMB 1,780,834
thousand)
9,002,075 (RMB 1,780,834
thousand)
Note 2
YFY Paper
Enterprise (Jiaxing) Co., Ltd.
Other receivables
from related parties
Yes 9,956,859
(RMB 1,969,714 thousand)
9,002,075
(RMB 1,780,834 thousand)
159,919
(RMB 31,636 thousand)
2.25 Short-term
financing
- Financing for
working capital requirements
- - - 9,002,075
(RMB 1,780,834 thousand)
9,002,075
(RMB 1,780,834 thousand)
Note 2
Rimagine Design
(Shanghai) Co., Ltd.
Other receivables
from related parties
Yes 9,956,859
(RMB 1,969,714 thousand)
9,002,075
(RMB 1,780,834 thousand)
1,269
(RMB 251 thousand)
2.25 Short-term
financing
- Financing for
working capital requirements
- - - 9,002,075
(RMB 1,780,834 thousand)
9,002,075
(RMB 1,780,834 thousand)
Note 2
YFY Paper
Enterprise (Guangzhou) Co.,
Ltd.
Other receivables
from related parties
Yes 497,844
(RMB 98,486 thousand)
450,105
(RMB 89,042 thousand)
-
- Short-term
financing
- Financing for
working capital requirements
- - - 450,105
(RMB 89,042 thousand)
3,600,827
(RMB 712,333 thousand)
Note 2
Guangdong Ding Feng Pulp &
Paper Co., Ltd.
Other receivables from related
parties
Yes 497,844 (RMB 98,486
thousand)
450,105 (RMB 89,042
thousand)
-
- Short-term financing
- Financing for working capital
requirements
- - - 450,105 (RMB 89,042
thousand)
3,600,827 (RMB 712,333
thousand)
Note 2
YFY Family Paper (Beijing) Co., Ltd.
Other receivables from related
parties
Yes 9,956,859 (RMB 1,969,714
thousand)
9,002,075 (RMB 1,780,834
thousand)
135,999 (RMB 26,904
thousand)
2.25 Short-term financing
- Financing for working capital
requirements
- - - 9,002,075 (RMB 1,780,834
thousand)
9,002,075 (RMB 1,780,834
thousand)
Note 2
YFY Paper Enterprise
(Zhongshan) Co.,
Ltd.
Other receivables from related
parties
Yes 9,956,859 (RMB 1,969,714
thousand)
9,002,075 (RMB 1,780,834
thousand)
-
- Short-term financing
- Financing for working capital
requirements
- - - 9,002,075 (RMB 1,780,834
thousand)
9,002,075 (RMB 1,780,834
thousand)
Note 2
(Continued)

- 78 -
No. Lender Borrower Financial
Statement Account
Related
Party
Highest Balance
for the Period
(Note 3)
Ending Balance
(Note 3)
Actual Borrowing
Amount
(Note 3)
Interest
Rate
(%)
Nature of
Financing
Business
Transaction
Amounts
(Note 3)
Reasons for
Short-term
Financing
Allowance for
Impairment Loss
(Note 3)
Collateral Financing Limit
for Each
Borrower
(Notes 1 and 3)
Aggregate
Financing Limits
(Notes 1 and 3) Note
Item Value
YFY Paper
Enterprise (Xiamen) Co.,
Ltd.
Other receivables
from related parties
Yes $ 9,956,859
(RMB 1,969,714 thousand)
$ 9,002,075
(RMB 1,780,834 thousand)
$ 16,545
(RMB 3,273 thousand)
2.25 Short-term
financing
$ - Financing for
working capital requirements
$ - - $ - $ 9,002,075
(RMB 1,780,834 thousand)
$ 9,002,075
(RMB 1,780,834 thousand)
Note 2
YFY Paper Enterprise
(Kunshan) Co.,
Ltd.
Other receivables from related
parties
Yes 9,956,859 (RMB 1,969,714
thousand)
9,002,075 (RMB 1,780,834
thousand)
-
- Short-term financing
- Financing for working capital
requirements
- - - 9,002,075 (RMB 1,780,834
thousand)
9,002,075 (RMB 1,780,834
thousand)
Note 2
YFY Paper
Enterprise
(Tianjin) Co., Ltd.
Other receivables
from related
parties
Yes 9,956,859
(RMB 1,969,714
thousand)
9,002,075
(RMB 1,780,834
thousand)
-
- Short-term
financing
- Financing for
working capital
requirements
- - - 9,002,075
(RMB 1,780,834
thousand)
9,002,075
(RMB 1,780,834
thousand)
Note 2
YFY Paper
Enterprise
(Qingdao) Co., Ltd.
Other receivables
from related
parties
Yes 9,956,859
(RMB 1,969,714
thousand)
9,002,075
(RMB 1,780,834
thousand)
-
- Short-term
financing
- Financing for
working capital
requirements
- - - 9,002,075
(RMB 1,780,834
thousand)
9,002,075
(RMB 1,780,834
thousand)
Note 2
Arizon RFID
Technology (Yangzhou) Co.,
Ltd.
Other receivables
from related parties
Yes 9,956,859
(RMB 1,969,714 thousand)
9,002,075
(RMB 1,780,834 thousand)
-
- Short-term
financing
- Financing for
working capital requirements
- - - 9,002,075
(RMB 1,780,834 thousand)
9,002,075
(RMB 1,780,834 thousand)
Note 2
YFY Jupiter (Shenzhen) Ltd.
Other receivables from related
parties
Yes 9,956,859 (RMB 1,969,714
thousand)
9,002,075 (RMB 1,780,834
thousand)
-
- Short-term financing
- Financing for working capital
requirements
- - - 9,002,075 (RMB 1,780,834
thousand)
9,002,075 (RMB 1,780,834
thousand)
Note 2
Kunshan YFY Jupiter Green
Packaging Ltd.
Other receivables from related
parties
Yes 9,956,859 (RMB 1,969,714
thousand)
9,002,075 (RMB 1,780,834
thousand)
-
- Short-term financing
- Financing for working capital
requirements
- - - 9,002,075 (RMB 1,780,834
thousand)
9,002,075 (RMB 1,780,834
thousand)
Note 2
YFY Packaging (Yangzhou)
Investment Co.,
Ltd.
Other receivables from related
parties
Yes 9,956,859 (RMB 1,969,714
thousand)
9,002,075 (RMB 1,780,834
thousand)
- - Short-term financing
- Financing for working capital
requirements
- - - 9,002,075 (RMB 1,780,834
thousand)
9,002,075 (RMB 1,780,834
thousand)
Note 2
Yuen Foong Yu
Comsumer
Product (Yangzhou) Co.,
Ltd.
Other receivables
from related
parties
Yes 9,956,859
(RMB 1,969,714
thousand)
9,002,075
(RMB 1,780,834
thousand)
- - Short-term
financing
- Financing for
working capital
requirements
- - - 9,002,075
(RMB 1,780,834
thousand)
9,002,075
(RMB 1,780,834
thousand)
Note 2
YFY Investment Co., Ltd.
Other receivables from related
parties
Yes 9,956,859 (RMB 1,969,714
thousand)
9,002,075 (RMB 1,780,834
thousand)
-
- Short-term financing
- Financing for working capital
requirements
- - - 9,002,075 (RMB 1,780,834
thousand)
9,002,075 (RMB 1,780,834
thousand)
Note 2
YFY Packaging (Yangzhou)
Investment Co.,
Ltd.
Other receivables from related
parties
Yes 9,002,075 (RMB 1,780,834
thousand)
9,002,075 (RMB 1,780,834
thousand)
-
- Short-term financing
- Financing for working capital
requirements
- - - 9,002,075 (RMB 1,780,834
thousand)
9,002,075 (RMB 1,780,834
thousand)
Note 2
4 YFY Paper Enterprise
(Kunshan) Co., Ltd.
YFY Paper Mfg.
(Yangzhou) Co., Ltd.
Other receivables
from related parties
Yes 1,027,161
(RMB 203,198 thousand)
600,354
(RMB 118,765 thousand)
582,480
(RMB 115,229 thousand)
2.1 Short-term
financing
- Financing for
working capital requirements
- - - 1,004,753
(RMB 198,765 thousand)
1,004,753
(RMB 198,765 thousand)
Note 2
YFY Packaging
(Yangzhou) Investment Co.,
Ltd.
Other receivables
from related parties
Yes 1,004,753
(RMB 198,765 thousand)
600,354
(RMB 118,765 thousand)
12,966
(RMB 2,565 thousand )
2.1 Short-term
financing
- Financing for
working capital requirements
- - - 1,004,753
(RMB 198,765 thousand)
1,004,753
(RMB 198,765 thousand)
Note 2
YFY (Shanghai) Financial Services
Co., Ltd.
Other receivables from related
parties
Yes 404,398 (RMB 80,000
thousand)
404,398 (RMB 80,000
thousand)
389,233 (RMB 77,000
thousand)
2.85 Short-term financing
- Financing for working capital
requirements
- - - 1,004,753 (RMB 198,765
thousand)
1,004,753 (RMB 198,765
thousand)
Note 2
5 YFY Paper Enterprise
(Qingdao) Co., Ltd.
YFY Paper Mfg.
(Yangzhou) Co.,
Ltd.
Other receivables
from related
parties
Yes 1,235,740
(RMB 244,460
thousand)
1,235,740
(RMB 244,460
thousand)
658,547
(RMB 130,277
thousand)
2.1 Short-term
financing
- Financing for
working capital
requirements
- - - 1,539,038
(RMB 304,460
thousand)
1,539,038
(RMB 304,460
thousand)
Note 2
YFY (Shanghai)
Financial Services
Co., Ltd.
Other receivables
from related
parties
Yes 303,299
(RMB 60,000
thousand)
303,299
(RMB 60,000
thousand)
60,660
(RMB 12,000
thousand)
2.85 Short-term
financing
- Financing for
working capital
requirements
- - - 1,539,038
(RMB 304,460
thousand)
1,539,038
(RMB 304,460
thousand)
Note 2
6 YFY Paper Enterprise
(Guangzhou) Co.,
Ltd.
YFY Paper Mfg.
(Yangzhou) Co.,
Ltd.
Other receivables
from related
parties
Yes 56,232
(RMB 11,124
thousand)
43,796
(RMB 8,664
thousand)
33,363
(RMB 6,600
thousand)
2.1 Short-term
financing
- Financing for
working capital
requirements
- - - 43,796
(RMB 8,664
thousand)
350,355
(RMB 69,309
thousand)
Note 2
YFY Paper Mfg.
(Jiangyin) Co.,
Ltd.
Other receivables
from related
parties
Yes 151,649
(RMB 30,000
thousand)
151,649
(RMB 30,000
thousand)
151,649
(RMB 30,000
thousand)
2.25 Short-term
financing
- Financing for
working capital
requirements
- - - 175,175
(RMB 34,654
thousand)
350,355
(RMB 69,309
thousand)
Note 2
(Continued)
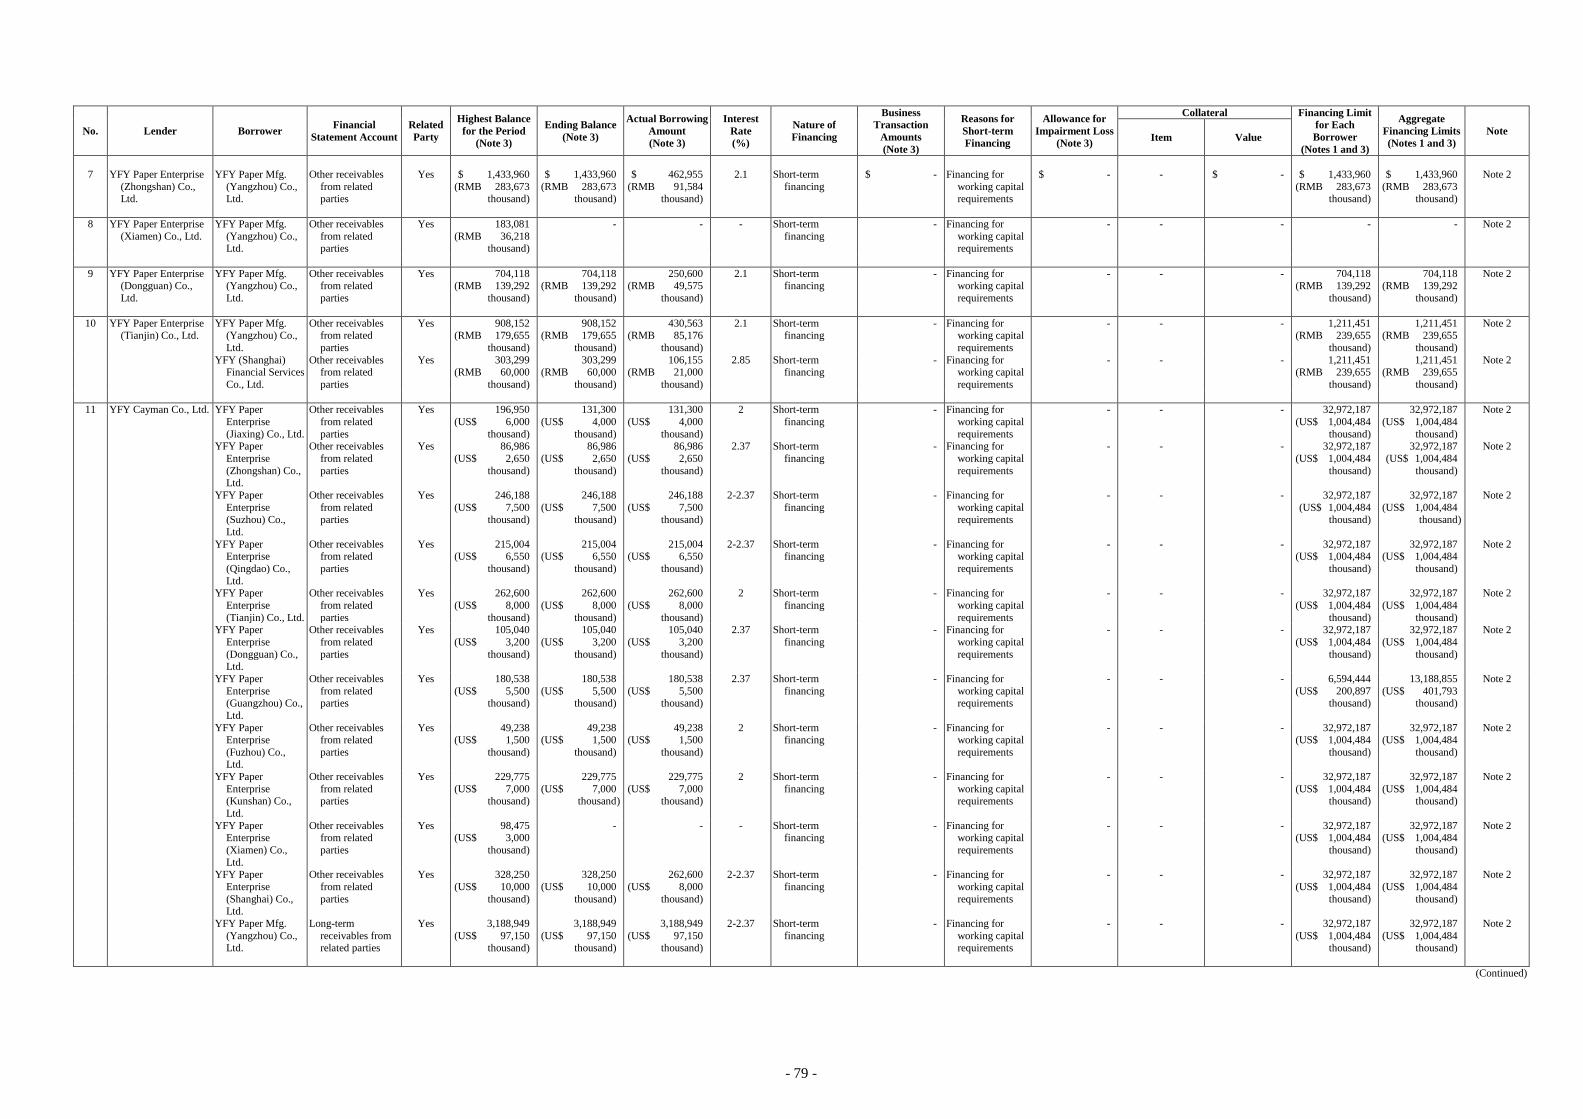
- 79 -
No. Lender Borrower Financial
Statement Account
Related
Party
Highest Balance
for the Period
(Note 3)
Ending Balance
(Note 3)
Actual Borrowing
Amount
(Note 3)
Interest
Rate
(%)
Nature of
Financing
Business
Transaction
Amounts
(Note 3)
Reasons for
Short-term
Financing
Allowance for
Impairment Loss
(Note 3)
Collateral Financing Limit
for Each
Borrower
(Notes 1 and 3)
Aggregate
Financing Limits
(Notes 1 and 3) Note
Item Value
7 YFY Paper Enterprise
(Zhongshan) Co., Ltd.
YFY Paper Mfg.
(Yangzhou) Co., Ltd.
Other receivables
from related parties
Yes $ 1,433,960
(RMB 283,673 thousand)
$ 1,433,960
(RMB 283,673 thousand)
$ 462,955
(RMB 91,584 thousand)
2.1 Short-term
financing
$ - Financing for
working capital requirements
$ - - $ - $ 1,433,960
(RMB 283,673 thousand)
$ 1,433,960
(RMB 283,673 thousand)
Note 2
8 YFY Paper Enterprise
(Xiamen) Co., Ltd.
YFY Paper Mfg.
(Yangzhou) Co., Ltd.
Other receivables
from related parties
Yes 183,081
(RMB 36,218 thousand)
-
-
- Short-term
financing
- Financing for
working capital requirements
- - - -
-
Note 2
9 YFY Paper Enterprise (Dongguan) Co.,
Ltd.
YFY Paper Mfg. (Yangzhou) Co.,
Ltd.
Other receivables from related
parties
Yes 704,118 (RMB 139,292
thousand)
704,118 (RMB 139,292
thousand)
250,600 (RMB 49,575
thousand)
2.1 Short-term financing
- Financing for working capital
requirements
- - - 704,118 (RMB 139,292
thousand)
704,118 (RMB 139,292
thousand)
Note 2
10 YFY Paper Enterprise (Tianjin) Co., Ltd.
YFY Paper Mfg. (Yangzhou) Co.,
Ltd.
Other receivables from related
parties
Yes 908,152 (RMB 179,655
thousand)
908,152 (RMB 179,655
thousand)
430,563 (RMB 85,176
thousand)
2.1 Short-term financing
- Financing for working capital
requirements
- - - 1,211,451 (RMB 239,655
thousand)
1,211,451 (RMB 239,655
thousand)
Note 2
YFY (Shanghai) Financial Services
Co., Ltd.
Other receivables from related
parties
Yes 303,299 (RMB 60,000
thousand)
303,299 (RMB 60,000
thousand)
106,155 (RMB 21,000
thousand)
2.85 Short-term financing
- Financing for working capital
requirements
- - - 1,211,451 (RMB 239,655
thousand)
1,211,451 (RMB 239,655
thousand)
Note 2
11 YFY Cayman Co., Ltd. YFY Paper
Enterprise
(Jiaxing) Co., Ltd.
Other receivables
from related
parties
Yes 196,950
(US$ 6,000
thousand)
131,300
(US$ 4,000
thousand)
131,300
(US$ 4,000
thousand)
2 Short-term
financing
- Financing for
working capital
requirements
- - - 32,972,187
(US$ 1,004,484
thousand)
32,972,187
(US$ 1,004,484
thousand)
Note 2
YFY Paper
Enterprise
(Zhongshan) Co., Ltd.
Other receivables
from related
parties
Yes 86,986
(US$ 2,650
thousand)
86,986
(US$ 2,650
thousand)
86,986
(US$ 2,650
thousand)
2.37 Short-term
financing
- Financing for
working capital
requirements
- - - 32,972,187
(US$ 1,004,484
thousand)
32,972,187
(US$ 1,004,484
thousand)
Note 2
YFY Paper
Enterprise
(Suzhou) Co.,
Ltd.
Other receivables
from related
parties
Yes 246,188
(US$ 7,500
thousand)
246,188
(US$ 7,500
thousand)
246,188
(US$ 7,500
thousand)
2-2.37 Short-term
financing
- Financing for
working capital
requirements
- - - 32,972,187
(US$ 1,004,484
thousand)
32,972,187
(US$ 1,004,484
thousand )
Note 2
YFY Paper Enterprise
(Qingdao) Co.,
Ltd.
Other receivables from related
parties
Yes 215,004 (US$ 6,550
thousand)
215,004 (US$ 6,550
thousand)
215,004 (US$ 6,550
thousand)
2-2.37 Short-term financing
- Financing for working capital
requirements
- - - 32,972,187 (US$ 1,004,484
thousand)
32,972,187 (US$ 1,004,484
thousand)
Note 2
YFY Paper
Enterprise
(Tianjin) Co., Ltd.
Other receivables
from related
parties
Yes 262,600
(US$ 8,000
thousand)
262,600
(US$ 8,000
thousand)
262,600
(US$ 8,000
thousand)
2 Short-term
financing
- Financing for
working capital
requirements
- - - 32,972,187
(US$ 1,004,484
thousand)
32,972,187
(US$ 1,004,484
thousand)
Note 2
YFY Paper
Enterprise
(Dongguan) Co., Ltd.
Other receivables
from related
parties
Yes 105,040
(US$ 3,200
thousand)
105,040
(US$ 3,200
thousand)
105,040
(US$ 3,200
thousand)
2.37 Short-term
financing
- Financing for
working capital
requirements
- - - 32,972,187
(US$ 1,004,484
thousand)
32,972,187
(US$ 1,004,484
thousand)
Note 2
YFY Paper
Enterprise (Guangzhou) Co.,
Ltd.
Other receivables
from related parties
Yes 180,538
(US$ 5,500 thousand)
180,538
(US$ 5,500 thousand)
180,538
(US$ 5,500 thousand)
2.37 Short-term
financing
- Financing for
working capital requirements
- - - 6,594,444
(US$ 200,897 thousand)
13,188,855
(US$ 401,793 thousand)
Note 2
YFY Paper Enterprise
(Fuzhou) Co., Ltd.
Other receivables from related
parties
Yes 49,238 (US$ 1,500
thousand)
49,238 (US$ 1,500
thousand)
49,238 (US$ 1,500
thousand)
2 Short-term financing
- Financing for working capital
requirements
- - - 32,972,187 (US$ 1,004,484
thousand)
32,972,187 (US$ 1,004,484
thousand)
Note 2
YFY Paper
Enterprise (Kunshan) Co.,
Ltd.
Other receivables
from related parties
Yes 229,775
(US$ 7,000 thousand)
229,775
(US$ 7,000 thousand )
229,775
(US$ 7,000 thousand)
2 Short-term
financing
- Financing for
working capital requirements
- - - 32,972,187
(US$ 1,004,484 thousand)
32,972,187
(US$ 1,004,484 thousand)
Note 2
YFY Paper Enterprise
(Xiamen) Co.,
Ltd.
Other receivables from related
parties
Yes 98,475 (US$ 3,000
thousand)
- - - Short-term financing
- Financing for working capital
requirements
- - - 32,972,187 (US$ 1,004,484
thousand)
32,972,187 (US$ 1,004,484
thousand)
Note 2
YFY Paper
Enterprise
(Shanghai) Co., Ltd.
Other receivables
from related
parties
Yes 328,250
(US$ 10,000
thousand)
328,250
(US$ 10,000
thousand)
262,600
(US$ 8,000
thousand)
2-2.37 Short-term
financing
- Financing for
working capital
requirements
- - - 32,972,187
(US$ 1,004,484
thousand)
32,972,187
(US$ 1,004,484
thousand)
Note 2
YFY Paper Mfg.
(Yangzhou) Co., Ltd.
Long-term
receivables from related parties
Yes 3,188,949
(US$ 97,150 thousand)
3,188,949
(US$ 97,150 thousand)
3,188,949
(US$ 97,150 thousand)
2-2.37 Short-term
financing
- Financing for
working capital requirements
- - - 32,972,187
(US$ 1,004,484 thousand)
32,972,187
(US$ 1,004,484 thousand)
Note 2
(Continued)

- 80 -
No. Lender Borrower Financial
Statement Account
Related
Party
Highest Balance
for the Period
(Note 3)
Ending Balance
(Note 3)
Actual Borrowing
Amount
(Note 3)
Interest
Rate
(%)
Nature of
Financing
Business
Transaction
Amounts
(Note 3)
Reasons for
Short-term
Financing
Allowance for
Impairment Loss
(Note 3)
Collateral Financing Limit
for Each
Borrower
(Notes 1 and 3)
Aggregate
Financing Limits
(Notes 1 and 3) Note
Item Value
YFY Paper Mfg.
(Yangzhou) Co., Ltd.
Long-term
receivables from related parties
Yes $ 1,516,493
(RMB 300,000 thousand)
$ 1,516,493
(RMB 300,000 thousand)
$ 1,516,493
(RMB 300,000 thousand)
2 Short-term
financing
$ -
Financing for
working capital requirements
$ - - $ - $ 32,972,187
(US$ 1,004,484 thousand)
$ 32,972,187
(US$ 1,004,484 thousand)
Note 2
YFY Packaging
(Yangzhou) Investment Co.,
Ltd.
Long-term
receivables from related parties
Yes 328,250
(US$ 10,000 thousand)
328,250
(US$ 10,000 thousand)
328,250
(US$ 10,000 thousand)
2.37 Short-term
financing
-
Financing for
working capital requirements
- - - 32,972,187
(US$ 1,004,484 thousand)
32,972,187
(US$ 1,004,484 thousand)
Note 2
YFY Packaging (Yangzhou)
Investment Co.,
Ltd.
Other receivables from related
parties
Yes 164,125 (US$ 5,000
thousand)
164,125 (US$ 5,000
thousand)
164,125 (US$ 5,000
thousand)
2 Short-term financing
- Financing for working capital
requirements
- - - 32,972,187 (US$ 1,004,484
thousand)
32,972,187 (US$ 1,004,484
thousand)
Note 2
12 YFY Jupiter Ltd. YFY Jupiter (BVI)
Inc.
Other receivables
from related
parties
Yes 18,054
(US$ 550
thousand)
18,054
(US$ 550
thousand)
18,054
(US$ 550
thousand)
0.1 Short-term
financing
- Financing for
working capital
requirements
- - - 142,099
(US$ 4,329
thousand)
284,166
(US$ 8,657
thousand)
Note 2
13 YFY Paper Enterprise
(Nanjing) Co., Ltd.
YFY Paper Mfg.
(Yangzhou) Co., Ltd.
Other receivables
from related parties
Yes 29,890
(RMB 5,913 thousand)
29,511
(RMB 5,838 thousand)
-
- Short-term
financing
- Financing for
working capital requirements
- - - 29,511
(RMB 5,838 thousand)
236,088
(RMB 46,704 thousand)
Note 2
YFY Packaging
(Yangzhou) Investment Co.,
Ltd.
Other receivables
from related parties
Yes 29,511
(RMB 5,838 thousand)
29,511
(RMB 5,838 thousand)
470
(RMB 93 thousand)
2.1 Short-term
financing
-
Financing for
working capital requirements
- - - 29,511
(RMB 5,838 thousand)
236,088
(RMB 46,704 thousand)
Note 2
14 Arizon RFID
Technology
(Yangzhou) Co., Ltd.
YFY Paper Mfg.
(Yangzhou) Co.,
Ltd.
Other receivables
from related
parties
Yes 2,763,975
(RMB 546,783
thousand)
2,763,975
(RMB 546,783
thousand)
- - Short-term
financing
- Financing for
working capital
requirements
- - - 2,763,975
(RMB 546,783
thousand)
2,763,975
(RMB 546,783
thousand)
Note 2
15 YFY Jupiter
(Shenzhen) Ltd.
YFY Paper Mfg.
(Yangzhou) Co., Ltd.
Other receivables
from related parties
Yes 229,092
(RMB 45,320 thousand)
229,092
(RMB 45,320 thousand)
5,045
(RMB 998 thousand)
2.1 Short-term
financing
- Financing for
working capital requirements
- - - 229,092
(RMB 45,320 thousand)
229,092
(RMB 45,320 thousand)
Note 2
16 Guangdong Ding Feng Pulp & Paper Co.,
Ltd.
YFY Paper Mfg. (Yangzhou) Co.,
Ltd.
Other receivables from related
parties
Yes 531,976 (RMB 105,238
thousand)
526,617 (RMB 104,178
thousand)
188,738 (RMB 37,337
thousand)
2.1 Short-term financing
- Financing for working capital
requirements
- - - 526,617 (RMB 104,178
thousand)
4,212,944 (RMB 833,425
thousand)
Note 2
17 YFY Family Paper (Beijing) Co., Ltd.
YFY Paper Mfg. (Yangzhou) Co.,
Ltd.
Other receivables from related
parties
Yes 1,104,770 (RMB 218,551
thousand)
1,079,642 (RMB 213,580
thousand)
- - Short-term financing
- Financing for working capital
requirements
- - - 1,079,642 (RMB 213,580
thousand)
1,079,642 (RMB 213,580
thousand)
Note 2
18 YFY Investment Co.,
Ltd.
YFY Paper Mfg.
(Yangzhou) Co.,
Ltd.
Other receivables
from related
parties
Yes 3,385,712
(RMB 669,778
thousand)
3,385,712
(RMB 669,778
thousand)
216,606
(RMB 42,850
thousand)
2.1 Short-term
financing
- Financing for
working capital
requirements
- - - 3,385,712
(RMB 669,778
thousand)
3,385,712
(RMB 669,778
thousand)
Note 2
19 Shenzhen Systax Paper
Co., Ltd.
YFY Paper Mfg.
(Yangzhou) Co., Ltd.
Other receivables
from related parties
Yes 131,556
(RMB 26,025 thousand)
131,556
(RMB 26,025 thousand)
27,090
(RMB 5,359 thousand)
2.1 Short-term
financing
- Financing for
working capital requirements
- - - 131,556
(RMB 26,025 thousand)
131,556
(RMB 26,025 thousand)
Note 2
20 Effion Enertech Co.,
Ltd.
Lotus Ecoscings &
Engineering Co., Ltd.
Other receivables
from related parties
Yes 100,000 100,000 100,000 1.35 Short-term
financing
- Financing for
working capital requirements
- - - 298,672 597,344 Note 2
YFY Venture
Capital Investment Co.,
Ltd.
Other receivables
from related parties
Yes 198,000 198,000 198,000 1.35 Short-term
financing
- Financing for
working capital requirements
- - - 298,672 597,344 Note 2
21 YFY Family Care
(Kunshan) Co., Ltd.
YFY Paper Mfg.
(Yangzhou) Co.,
Ltd.
Other receivables
from related
parties
Yes 1,072,095
(RMB 212,087
thousand)
953,389
(RMB 188,604
thousand)
21,650
(RMB 4,283
thousand)
2.1 Short-term
financing
- Financing for
working capital
requirements
- - - 953,389
(RMB 188,604
thousand)
953,389
(RMB 188,604
thousand)
Note 2
(Continued)
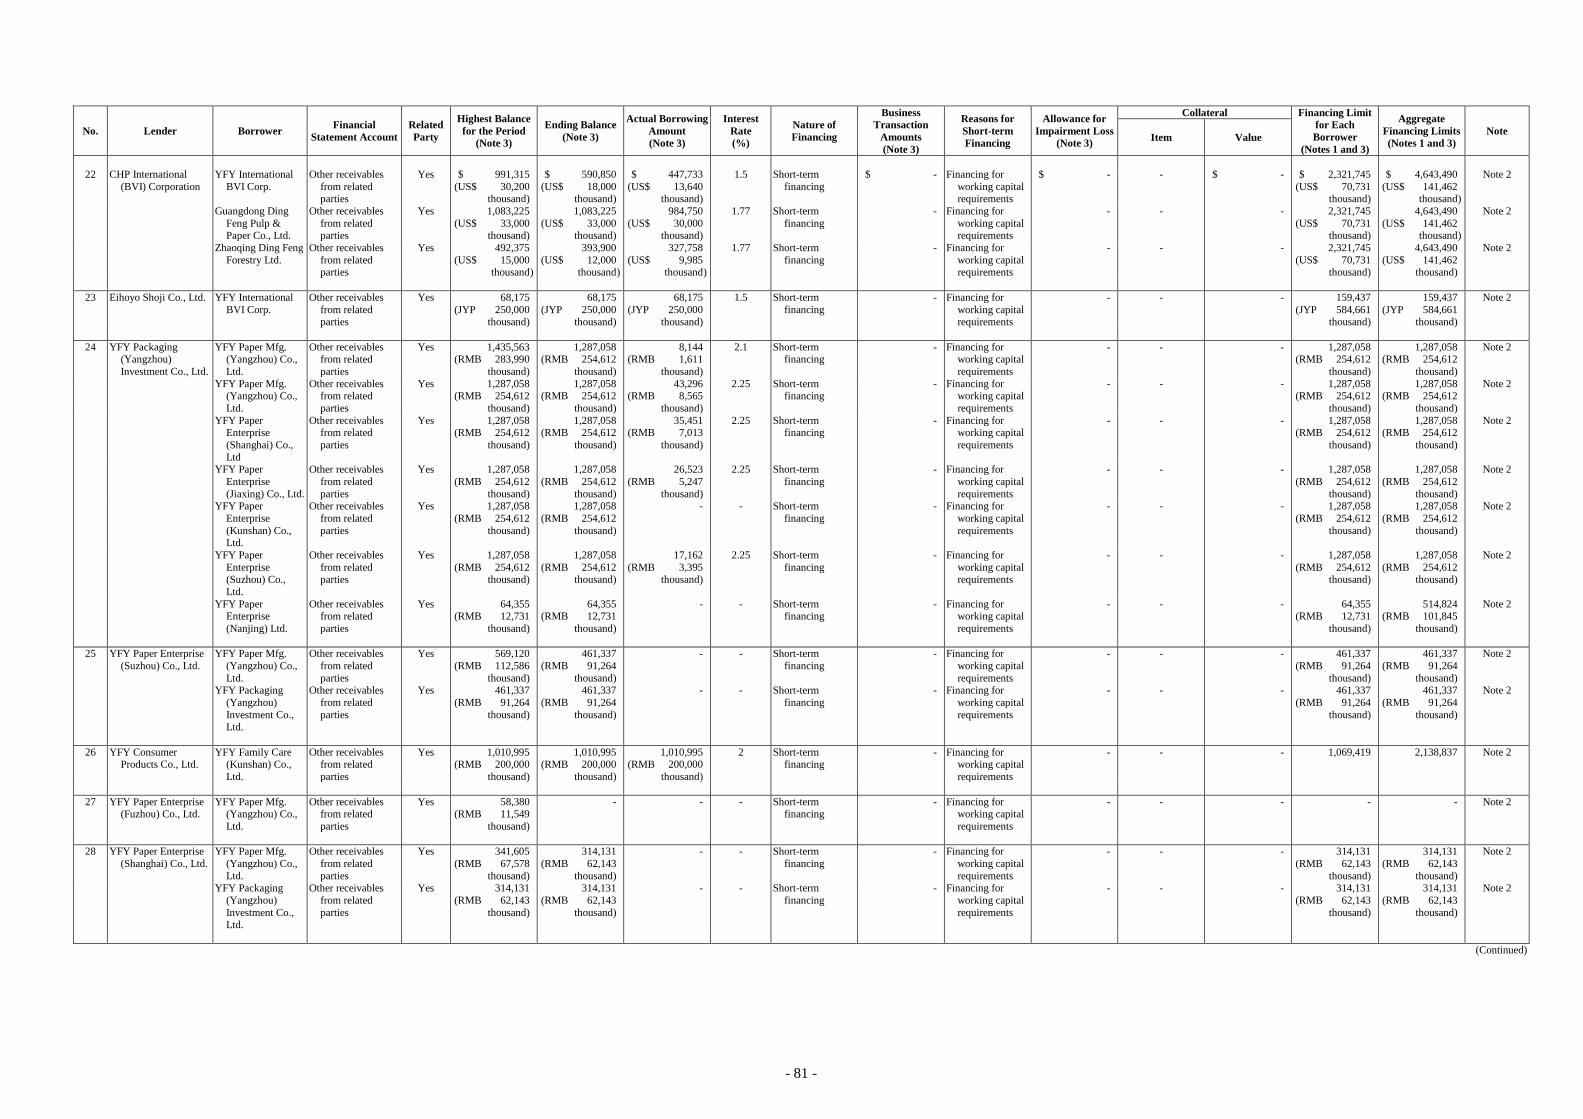
- 81 -
No. Lender Borrower Financial
Statement Account
Related
Party
Highest Balance
for the Period
(Note 3)
Ending Balance
(Note 3)
Actual Borrowing
Amount
(Note 3)
Interest
Rate
(%)
Nature of
Financing
Business
Transaction
Amounts
(Note 3)
Reasons for
Short-term
Financing
Allowance for
Impairment Loss
(Note 3)
Collateral Financing Limit
for Each
Borrower
(Notes 1 and 3)
Aggregate
Financing Limits
(Notes 1 and 3) Note
Item Value
22 CHP International
(BVI) Corporation
YFY International
BVI Corp.
Other receivables
from related parties
Yes $ 991,315
(US$ 30,200 thousand)
$ 590,850
(US$ 18,000 thousand)
$ 447,733
(US$ 13,640 thousand)
1.5 Short-term
financing
$ - Financing for
working capital requirements
$ - - $ - $ 2,321,745
(US$ 70,731 thousand)
$ 4,643,490
(US$ 141,462 thousand )
Note 2
Guangdong Ding
Feng Pulp & Paper Co., Ltd.
Other receivables
from related parties
Yes 1,083,225
(US$ 33,000 thousand)
1,083,225
(US$ 33,000 thousand)
984,750
(US$ 30,000 thousand)
1.77 Short-term
financing
- Financing for
working capital requirements
- - - 2,321,745
(US$ 70,731 thousand)
4,643,490
(US$ 141,462 thousand )
Note 2
Zhaoqing Ding Feng
Forestry Ltd.
Other receivables
from related parties
Yes 492,375
(US$ 15,000 thousand )
393,900
(US$ 12,000 thousand )
327,758
(US$ 9,985 thousand )
1.77 Short-term
financing
- Financing for
working capital requirements
- - - 2,321,745
(US$ 70,731 thousand)
4,643,490
(US$ 141,462 thousand)
Note 2
23 Eihoyo Shoji Co., Ltd. YFY International
BVI Corp.
Other receivables
from related parties
Yes 68,175
(JYP 250,000 thousand)
68,175
(JYP 250,000 thousand)
68,175
(JYP 250,000 thousand)
1.5 Short-term
financing
- Financing for
working capital requirements
- - - 159,437
(JYP 584,661 thousand)
159,437
(JYP 584,661 thousand)
Note 2
24 YFY Packaging (Yangzhou)
Investment Co., Ltd.
YFY Paper Mfg. (Yangzhou) Co.,
Ltd.
Other receivables from related
parties
Yes 1,435,563 (RMB 283,990
thousand)
1,287,058 (RMB 254,612
thousand)
8,144 (RMB 1,611
thousand)
2.1 Short-term financing
- Financing for working capital
requirements
- - - 1,287,058 (RMB 254,612
thousand)
1,287,058 (RMB 254,612
thousand)
Note 2
YFY Paper Mfg. (Yangzhou) Co.,
Ltd.
Other receivables from related
parties
Yes 1,287,058 (RMB 254,612
thousand)
1,287,058 (RMB 254,612
thousand)
43,296 (RMB 8,565
thousand)
2.25 Short-term financing
-
Financing for working capital
requirements
- - - 1,287,058 (RMB 254,612
thousand)
1,287,058 (RMB 254,612
thousand)
Note 2
YFY Paper Enterprise
(Shanghai) Co.,
Ltd
Other receivables from related
parties
Yes 1,287,058 (RMB 254,612
thousand)
1,287,058 (RMB 254,612
thousand)
35,451 (RMB 7,013
thousand)
2.25 Short-term financing
- Financing for working capital
requirements
- - - 1,287,058 (RMB 254,612
thousand)
1,287,058 (RMB 254,612
thousand)
Note 2
YFY Paper
Enterprise
(Jiaxing) Co., Ltd.
Other receivables
from related
parties
Yes 1,287,058
(RMB 254,612
thousand)
1,287,058
(RMB 254,612
thousand)
26,523
(RMB 5,247
thousand)
2.25 Short-term
financing
- Financing for
working capital
requirements
- - - 1,287,058
(RMB 254,612
thousand)
1,287,058
(RMB 254,612
thousand)
Note 2
YFY Paper
Enterprise
(Kunshan) Co., Ltd.
Other receivables
from related
parties
Yes 1,287,058
(RMB 254,612
thousand)
1,287,058
(RMB 254,612
thousand)
- - Short-term
financing
- Financing for
working capital
requirements
- - - 1,287,058
(RMB 254,612
thousand)
1,287,058
(RMB 254,612
thousand)
Note 2
YFY Paper
Enterprise (Suzhou) Co.,
Ltd.
Other receivables
from related parties
Yes 1,287,058
(RMB 254,612 thousand)
1,287,058
(RMB 254,612 thousand)
17,162
(RMB 3,395 thousand)
2.25 Short-term
financing
- Financing for
working capital requirements
- - - 1,287,058
(RMB 254,612 thousand)
1,287,058
(RMB 254,612 thousand)
Note 2
YFY Paper Enterprise
(Nanjing) Ltd.
Other receivables from related
parties
Yes 64,355 (RMB 12,731
thousand)
64,355 (RMB 12,731
thousand)
- - Short-term financing
- Financing for working capital
requirements
- - - 64,355 (RMB 12,731
thousand)
514,824 (RMB 101,845
thousand)
Note 2
25 YFY Paper Enterprise
(Suzhou) Co., Ltd.
YFY Paper Mfg.
(Yangzhou) Co.,
Ltd.
Other receivables
from related
parties
Yes 569,120
(RMB 112,586
thousand)
461,337
(RMB 91,264
thousand)
- - Short-term
financing
- Financing for
working capital
requirements
- - - 461,337
(RMB 91,264
thousand)
461,337
(RMB 91,264
thousand)
Note 2
YFY Packaging
(Yangzhou)
Investment Co.,
Ltd.
Other receivables
from related
parties
Yes 461,337
(RMB 91,264
thousand)
461,337
(RMB 91,264
thousand)
- - Short-term
financing
-
Financing for
working capital
requirements
- - - 461,337
(RMB 91,264
thousand)
461,337
(RMB 91,264
thousand)
Note 2
26 YFY Consumer Products Co., Ltd.
YFY Family Care (Kunshan) Co.,
Ltd.
Other receivables from related
parties
Yes 1,010,995 (RMB 200,000
thousand)
1,010,995 (RMB 200,000
thousand)
1,010,995 (RMB 200,000
thousand)
2 Short-term financing
- Financing for working capital
requirements
- - - 1,069,419
2,138,837
Note 2
27 YFY Paper Enterprise (Fuzhou) Co., Ltd.
YFY Paper Mfg. (Yangzhou) Co.,
Ltd.
Other receivables from related
parties
Yes 58,380 (RMB 11,549
thousand)
- - - Short-term financing
- Financing for working capital
requirements
- - - - - Note 2
28 YFY Paper Enterprise
(Shanghai) Co., Ltd.
YFY Paper Mfg.
(Yangzhou) Co.,
Ltd.
Other receivables
from related
parties
Yes 341,605
(RMB 67,578
thousand)
314,131
(RMB 62,143
thousand)
- - Short-term
financing
- Financing for
working capital
requirements
- - - 314,131
(RMB 62,143
thousand)
314,131
(RMB 62,143
thousand)
Note 2
YFY Packaging
(Yangzhou)
Investment Co., Ltd.
Other receivables
from related
parties
Yes 314,131
(RMB 62,143
thousand)
314,131
(RMB 62,143
thousand)
- - Short-term
financing
-
Financing for
working capital
requirements
- - - 314,131
(RMB 62,143
thousand)
314,131
(RMB 62,143
thousand)
Note 2
(Continued)

- 82 -
No. Lender Borrower Financial
Statement Account
Related
Party
Highest Balance
for the Period
(Note 3)
Ending Balance
(Note 3)
Actual Borrowing
Amount
(Note 3)
Interest
Rate
(%)
Nature of
Financing
Business
Transaction
Amounts
(Note 3)
Reasons for
Short-term
Financing
Allowance for
Impairment Loss
(Note 3)
Collateral Financing Limit
for Each
Borrower
(Notes 1 and 3)
Aggregate
Financing Limits
(Notes 1 and 3) Note
Item Value
29 YFY Paper Enterprise
(Jiaxing) Co., Ltd.
YFY Paper Mfg.
(Yangzhou) Co., Ltd.
Other receivables
from related parties
Yes $ 375,898
(RMB 74,362 thousand)
$ 318,357
(RMB 62,979 thousand)
$ - - Short-term
financing
$ - Financing for
working capital requirements
$ - - $ - $ 318,357
(RMB 62,979 thousand)
$ 318,357
(RMB 62,979 thousand)
Note 2
YFY Packaging
(Yangzhou) Investment Co.,
Ltd.
Other receivables
from related parties
Yes 318,357
(RMB 62,979 thousand)
318,357
(RMB 62,979 thousand)
- - Short-term
financing
-
Financing for
working capital requirements
- - - 318,357
(RMB 62,979 thousand)
318,357
(RMB 62,979 thousand)
Note 2
30 YFY Paradigm Investment Co., Ltd.
Livebricks Inc. Other receivables from related
parties
Yes 75,000 75,000 75,000 2.5 Short-term financing
- Financing for working capital
requirements
- - - 674,190 1,348,380 Note 2
Cupid InfoTech Co., Ltd.
Other receivables from related
parties
Yes 50,000 50,000 50,000 1.5 Short-term financing
- Financing for working capital
requirements
- - - 674,190 1,348,380 Note 2
31 YFY Packaging BVI
Corp.
YFY Paper Mfg.
(Yangzhou) Co.,
Ltd.
Other receivables
from related
parties
Yes 1,477,125
(US$ 45,000
thousand)
- - - Short-term
financing
- Financing for
working capital
requirements
- - - 10,383,664
(US$ 316,334
thousand)
10,383,664
(US$ 316,334
thousand)
Note 2
YFY International
BVI Corp.
Other receivables
from related
parties
Yes 656,500
(US$ 20,000
thousand)
656,500
(US$ 20,000
thousand)
656,500
(US$ 20,000
thousand)
1 Short-term
financing
-
Financing for
working capital
requirements
- - - 10,383,664
(US$ 316,334
thousand)
10,383,664
(US$ 316,334
thousand)
Note 2
YFY Cayman Co.,
Ltd.
Other receivables
from related
parties
Yes 833,755
(US$ 25,400
thousand)
833,755
(US$ 25,400
thousand)
833,755
(US$ 25,400
thousand)
1 Short-term
financing
-
Financing for
working capital
requirements
- - - 10,383,664
(US$ 316,334
thousand)
10,383,664
(US$ 316,334
thousand)
Note 2
32 YFY Consumer
Products Investment Limited
YFY Investment
Co., Ltd.
Other receivables
from related parties
Yes 984,750
(US$ 30,000 thousand)
984,750
(US$ 30,000 thousand)
984,750
(US$ 30,000 thousand)
2 Short-term
financing
- Financing for
working capital requirements
- - - 3,608,616
(US$ 109,935 thousand)
3,608,616
(US$ 109,935 thousand)
Note 2
Yuen Foong Yu
Consumer Product
(Yangzhou) Co.,
Ltd.
Other receivables
from related parties
Yes 656,500
(US$ 20,000 thousand)
656,500
(US$ 20,000 thousand)
656,500
(US$ 20,000 thousand)
2 Short-term
financing
- Financing for
working capital requirements
- - - 3,608,616
(US$ 109,935 thousand)
3,608,616
(US$ 109,935 thousand)
Note 2
33 YFY RFID
Technologies Co.,
Ltd.
YFY Cayman Co.,
Ltd.
Other receivables
from related
parties
Yes 7,222
(US$ 220
thousand)
7,222
(US$ 220
thousand)
7,222
(US$ (220
thousand)
1 Short-term
financing
- Financing for
working capital
requirements
- - - 16,938
(US$ 516
thousand)
16,938
(US$ 516
thousand)
Note 2
34 YFY International
Labuan Co, Ltd.
YFY Cayman Co.,
Ltd.
Other receivables
from related parties
Yes 105,040
(US$ 3,200 thousand)
105,040
(US$ 3,200 thousand)
105,040
(US$ 3,200 thousand)
1 Short-term
financing
- Financing for
working capital requirements
- - - 16,024,509
(US$ 488,180 thousand)
16,024,509
(US$ 488,180 thousand)
Note 2
35 YFY Packaging Capital
Corp.
YFY International
BVI Corp.
Other receivables
from related parties
Yes 471,154
(RMB 93,206 thousand)
471,154
(RMB 93,206 thousand)
471,154
(RMB 93,206 thousand)
2 Short-term
financing
- Financing for
working capital requirements
- - - 12,881,942
(RMB 2,548,368 thousand)
12,881,942
(RMB 2,548,368 thousand)
Note 2
YFY International BVI Corp.
Long-term receivables from
related parties
Yes 719,293 (RMB 142,294
thousand)
719,293 (RMB 142,294
thousand)
719,293 (RMB 142,294
thousand)
2 Short-term financing
- Financing for working capital
requirements
- - - 12,881,942 (RMB 2,548,368
thousand)
12,881,942 (RMB 2,548,368
thousand)
Note 2
YFY Paper Mfg. (Yangzhou) Co.,
Ltd.
Long-term receivables from
related parties
Yes 470,492 (RMB 93,075
thousand)
470,492 (RMB 93,075
thousand)
454,948 (RMB 90,000
thousand)
2 Short-term financing
- Financing for working capital
requirements
- - - 12,881,942 (RMB 2,548,368
thousand)
12,881,942 (RMB 2,548,368
thousand)
Note 2
YFY Cayman Co., Ltd.
Long-term receivables from
related parties
Yes 4,780,037 (RMB 945,610
thousand)
4,780,037 (RMB 945,610
thousand)
4,780,037 (RMB 945,610
thousand)
0.5 Short-term financing
- Financing for working capital
requirements
- - - 12,881,942 (RMB 2,548,368
thousand)
12,881,942 (RMB 2,548,368
thousand)
Note 2
YFY Packaging (Yangzhou)
Investment Co.,
Ltd.
Other receivables from related
parties
Yes 631,872 (RMB 125,000
thousand)
- - - Short-term financing
- Financing for working capital
requirements
- - - 12,881,942 (RMB 2,548,368
thousand)
12,881,942 (RMB 2,548,368
thousand)
Note 2
36 Rimagine Design
(Shanghai) Co., Ltd.
YFY Paper Mfg.
(Yangzhou) Co.,
Ltd.
Other receivables
from related
parties
Yes 3,149
(RMB 623
thousand)
3,149
(RMB 623
thousand)
- - Short-term
financing
- Financing for
working capital
requirements
- - - 3,149
(RMB 623
thousand)
3,149
(RMB 623
thousand)
Note 2
37 Kunshan YFY Jupiter
Green Packaging Ltd.
YFY Paper Mfg.
(Yangzhou) Co., Ltd.
Other receivables
from related parties
Yes 45,414
(RMB 8,984 thousand)
45,414
(RMB 8,984 thousand)
7,603
(RMB 1,504 thousand)
2.1 Short-term
financing
- Financing for
working capital requirements
- - - 45,414
(RMB 8,984 thousand)
45,414
(RMB 8,984 thousand)
Note 2
(Continued)
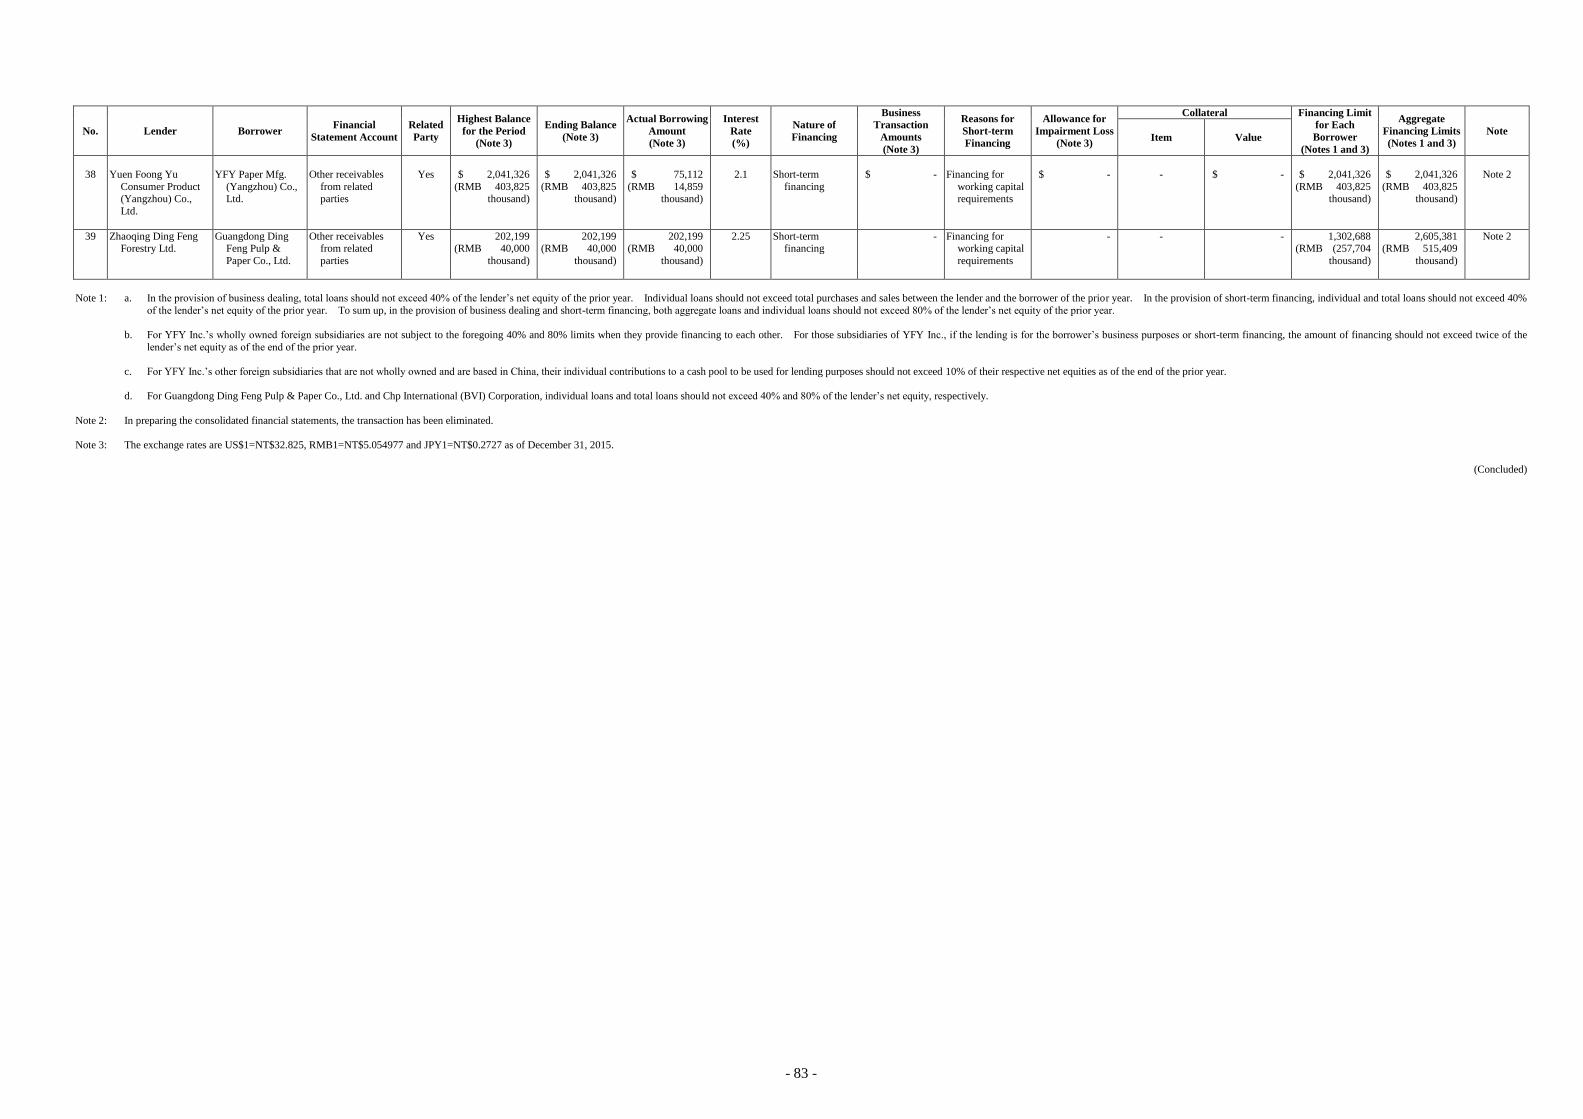
- 83 -
No. Lender Borrower Financial
Statement Account
Related
Party
Highest Balance
for the Period
(Note 3)
Ending Balance
(Note 3)
Actual Borrowing
Amount
(Note 3)
Interest
Rate
(%)
Nature of
Financing
Business
Transaction
Amounts
(Note 3)
Reasons for
Short-term
Financing
Allowance for
Impairment Loss
(Note 3)
Collateral Financing Limit
for Each
Borrower
(Notes 1 and 3)
Aggregate
Financing Limits
(Notes 1 and 3) Note
Item Value
38 Yuen Foong Yu
Consumer Product (Yangzhou) Co.,
Ltd.
YFY Paper Mfg.
(Yangzhou) Co., Ltd.
Other receivables
from related parties
Yes $ 2,041,326
(RMB 403,825 thousand)
$ 2,041,326
(RMB 403,825 thousand)
$ 75,112
(RMB 14,859 thousand)
2.1 Short-term
financing
$ - Financing for
working capital requirements
$ - - $ - $ 2,041,326
(RMB 403,825 thousand)
$ 2,041,326
(RMB 403,825 thousand)
Note 2
39 Zhaoqing Ding Feng Forestry Ltd.
Guangdong Ding Feng Pulp &
Paper Co., Ltd.
Other receivables from related
parties
Yes 202,199 (RMB 40,000
thousand)
202,199 (RMB 40,000
thousand)
202,199 (RMB 40,000
thousand)
2.25 Short-term financing
- Financing for working capital
requirements
- - - 1,302,688 (RMB (257,704
thousand)
2,605,381 (RMB 515,409
thousand)
Note 2
Note 1: a. In the provision of business dealing, total loans should not exceed 40% of the lender’s net equity of the prior year. Individual loans should not exceed total purchases and sales between the lender and the borrower of the prior year. In the provision of short-term financing, individual and total loans should not exceed 40%
of the lender’s net equity of the prior year. To sum up, in the provision of business dealing and short-term financing, both aggregate loans and individual loans should not exceed 80% of the lender’s net equity of the prior year.
b. For YFY Inc.’s wholly owned foreign subsidiaries are not subject to the foregoing 40% and 80% limits when they provide financing to each other. For those subsidiaries of YFY Inc., if the lending is for the borrower’s business purposes or short-term financing, the amount of financing should not exceed twice of the
lender’s net equity as of the end of the prior year.
c. For YFY Inc.’s other foreign subsidiaries that are not wholly owned and are based in China, their individual contributions to a cash pool to be used for lending purposes should not exceed 10% of their respective net equities as of the end of the prior year.
d. For Guangdong Ding Feng Pulp & Paper Co., Ltd. and Chp International (BVI) Corporation, individual loans and total loans should not exceed 40% and 80% of the lender’s net equity, respectively.
Note 2: In preparing the consolidated financial statements, the transaction has been eliminated.
Note 3: The exchange rates are US$1=NT$32.825, RMB1=NT$5.054977 and JPY1=NT$0.2727 as of December 31, 2015.
(Concluded)

- 84 -
TABLE 3
YFY INC. (FORMERLY YUEN FOONG YU PAPER MFG. CO., LTD.) AND SUBSIDIARIES
ENDORSEMENTS/GUARANTEES PROVIDED
FOR THE YEAR ENDED DECEMBER 31, 2015
(In Thousands of New Taiwan Dollars, Unless Stated Otherwise)
No. Endorser/Guarantor
Endorsee/Guarantee Limits on
Endorsement/
Guarantee Given
on Behalf of
Each Party
(Notes 1 and 4)
Maximum
Amount
Endorsed/
Guaranteed
During the
Period (Note 4)
Outstanding
Endorsement/
Guarantee at the
End of the Period
(Note 4)
Actual
Borrowing
Amount (Note 4)
Amount
Endorsed/
Guaranteed by
Collaterals
Ratio of
Accumulated
Endorsement/
Guarantee to Net
Equity In Latest
Financial
Statements (%)
Aggregate
Endorsement/
Guarantee Limit
(Notes 2 and 4)
Endorsement/
Guarantee Given
by Parent on
Behalf of
Subsidiaries
Endorsement/
Guarantee Given
by Subsidiaries
on Behalf of
Parent
Endorsement/
Guarantee Given
on Behalf of
Companies in
Mainland China
Name Relationship
Endorsement
1 YFY Consumer Products Co., Ltd. YFY Family Paper (Beijing) Co., Ltd. Note 3 a. $ 4,010,320 $ 65,650
(US$ 2,000
thousand)
$ - $ - $ - - $ 5,347,094 Yes No Yes
2 Chung Hwa Pulp Co., Ltd. Guangdong Ding Feng Pulp & Paper
Co., Ltd.
Note 3 a. 26,020,922 196,950
(US$ 6,000
thousand)
- - - - 34,694,562 Yes No Yes
Credit lines
1 YFY Inc. YFY Capital Co., Ltd. Note 3 a. 59,634,858 3,500,000 3,200,000 2,030,000 - 9.00 79,513,144 Yes No No
YFY Venture Capital Investment Co.,
Ltd.
Note 3 a. 59,634,858 2,150,000 2,150,000 880,000 - 6.05 79,513,144 Yes No No
San Ying Enterprise Co., Ltd. Note 3 a. 59,634,858 330,000 200,000 6,000 - 0.56 79,513,144 Yes No No
YFY Paradigm Investment Co., Ltd. Note 3 a. 59,634,858 1,700,000 1,700,000 1,063,000 - 4.78 79,513,144 Yes No No
Lotus Ecoscings & Engineering Co.,
Ltd.
Note 3 a. 59,634,858 230,000 230,000 101,000 - 0.65 79,513,144 Yes No No
Yeon Technologies Co., Ltd. Note 3 a. 59,634,858 100,000 60,000 15,000 - 0.17 79,513,144 Yes No No
YFY Operation Management
Consulting Co., Ltd.
Note 3 a. 59,634,858 90,000 - - - - 79,513,144 Yes No No
YFY International BVI Corp. Note 3 a. 59,634,858 588,000 588,000 262,600
(US$ 8,000
thousand)
- 11.30 79,513,144 Yes No No
4,086,713
(US$ 124,500
thousand)
3,430,213
(US$ 104,500
thousand)
390,486
(US$ 11,896
thousand)
-
YFY Global Investment BVI Corp. Note 3 a. 59,634,858
330,000 160,000 - - 1.84 79,513,144 Yes No No
984,750
(US$ 30,000
thousand)
492,375
(US$ 15,000
thousand)
98,475
(US$ 3,000
thousand)
-
YFY Jupiter Ltd. Note 3 a. 59,634,858 140,000 140,000 131,300
(US$ 4,000
thousand)
- 0.76 79,513,144 Yes No No
131,300
(US$ 4,000
thousand)
131,300
(US$ 4,000
thousand)
- -
Arizon RFID Technology (Yangzhou)
Co., Ltd.
Note 3 a. 59,634,858 143,520
(EUR 4,000
thousand)
82,063
(US$ 2,500
thousand)
71,760
(EUR 2,000
thousand)
- 0.23 79,513,144 Yes No Yes
Eihoyo Shoji Co., Ltd. Note 3 a. 59,634,858 84,000 84,000 - - 0.24 79,513,144 Yes No No
(Continued)

- 85 -
No. Endorser/Guarantor
Endorsee/Guarantee Limits on
Endorsement/
Guarantee Given
on Behalf of
Each Party
(Notes 1 and 4)
Maximum
Amount
Endorsed/
Guaranteed
During the
Period (Note 4)
Outstanding
Endorsement/
Guarantee at the
End of the Period
(Note 4)
Actual
Borrowing
Amount (Note 4)
Amount
Endorsed/
Guaranteed by
Collaterals
Ratio of
Accumulated
Endorsement/
Guarantee to Net
Equity In Latest
Financial
Statements (%)
Aggregate
Endorsement/
Guarantee Limit
(Notes 2 and 4)
Endorsement/
Guarantee Given
by Parent on
Behalf of
Subsidiaries
Endorsement/
Guarantee Given
by Subsidiaries
on Behalf of
Parent
Endorsement/
Guarantee Given
on Behalf of
Companies in
Mainland China
Name Relationship
2 YFY Packaging Inc. YFY Cayman Co., Ltd. Note 3 b. 11,080,617 $ 9,322,300
(US$ 284,000
thousand)
$ 8,911,988
(US$ 271,500
thousand)
$ 4,728,080
(US$ 144,039
thousand)
$ - 128.57 $ 14,774,156 No Yes No
YFY Paper Enterprise (Jiaxing) Co.,
Ltd.
Note 3 b. 11,080,617 98,475
(US$ 3,000
thousand)
98,475
(US$ 3,000
thousand)
98,475
(US$ 3,000
thousand)
- 1.42 14,774,156 No No Yes
YFY Paper Enterprise (Suzhou) Co.,
Ltd.
Note 3 b. 11,080,617 196,950
(US$ 6,000
thousand)
196,950
(US$ 6,000
thousand)
98,475
(US$ 3,000
thousand)
- 2.84 14,774,156 No No Yes
YFY Paper Enterprise (Kunshan) Co.,
Ltd.
Note 3 b. 11,080,617 131,300
(US$ 4,000
thousand)
- - - - 14,774,156 No No Yes
YFY Paper Enterprise (Dongguan)
Co., Ltd.
Note 3 b. 11,080,617 98,475
(US$ 3,000
thousand)
98,475
(US$ 3,000
thousand)
98,475
(US$ 3,000
thousand)
- 1.42 14,774,156 No No Yes
YFY Paper Enterprise (Guangzhou)
Co., Ltd.
Note 3 b. 11,080,617 212,050
(US$ 6,460
thousand)
212,050
(US$ 6,460
thousand)
212,050
(US$ 6,460
thousand)
- 3.06 14,774,156 No No Yes
YFY Paper Mfg. (Yangzhou) Co.,
Ltd.
Note 3 b. 11,080,617 328,250
(US$ 10,000
thousand)
328,250
(US$ 10,000
thousand)
252,753
(US$ 7,700
thousand)
- 4.74 14,774,156 No No Yes
3 YFY Consumer Products Co., Ltd.
Yuen Foong Yu Consumer Products
(Yangzhou) Co., Ltd.
Note 3 a. 4,010,320 771,388
(US$ 23,500
thousand)
771,388
(US$ 23,500
thousand)
492,375
(US$ 15,000
thousand)
- 31.31 5,347,094 Yes No Yes
YFY Investment Co., Ltd. Note 3 a. 4,010,320 656,500
(US$ 20,000
thousand)
656,500
(US$ 20,000
thousand)
- - 26.65 5,347,094 Yes No Yes
YFY Family Care (Kunshan) Co.,
Ltd.
Note 3 a. 4,010,320 1,313,000
(US$ 40,000
thousand)
820,625
(US$ 25,000
thousand)
164,125
(US$ 5,000
thousand)
- 33.31 5,347,094 Yes No Yes
4 Chung Hwa Pulp Co., Ltd. CHP International (BVI) Corp. Note 3 a. 26,020,922 164,400
(US$ 5,008
thousand)
164,400
(US$ 5,008
thousand)
-
- 1.00 34,694,562 Yes No No
Note 3 a. 26,020,922 147,398
(US$ 4,490
thousand)
147,398
(US$ 4,490
thousand)
-
- 0.89 34,694,562 Yes No No
Note 1: Represents 150% of the prior year’s net equity of YFY Inc., Chung Hwa Pulp Co., Ltd., YFY Packaging Inc., and YFY Consumer Products Co., Ltd.
Note 2: Represents 200% of the prior year’s net equity of YFY Inc., Chung Hwa Pulp Co., Ltd., YFY Packaging Inc. and YFY Consumer Products Co., Ltd.
Note 3: The relationships between endorsee and guarantee are as follow:
a. Subsidiary.
b. Same parent company.
Note 4: The exchange rates are US$1=NT$32.825 and EUR1=NT$35.88 as of December 31, 2015.
(Concluded)
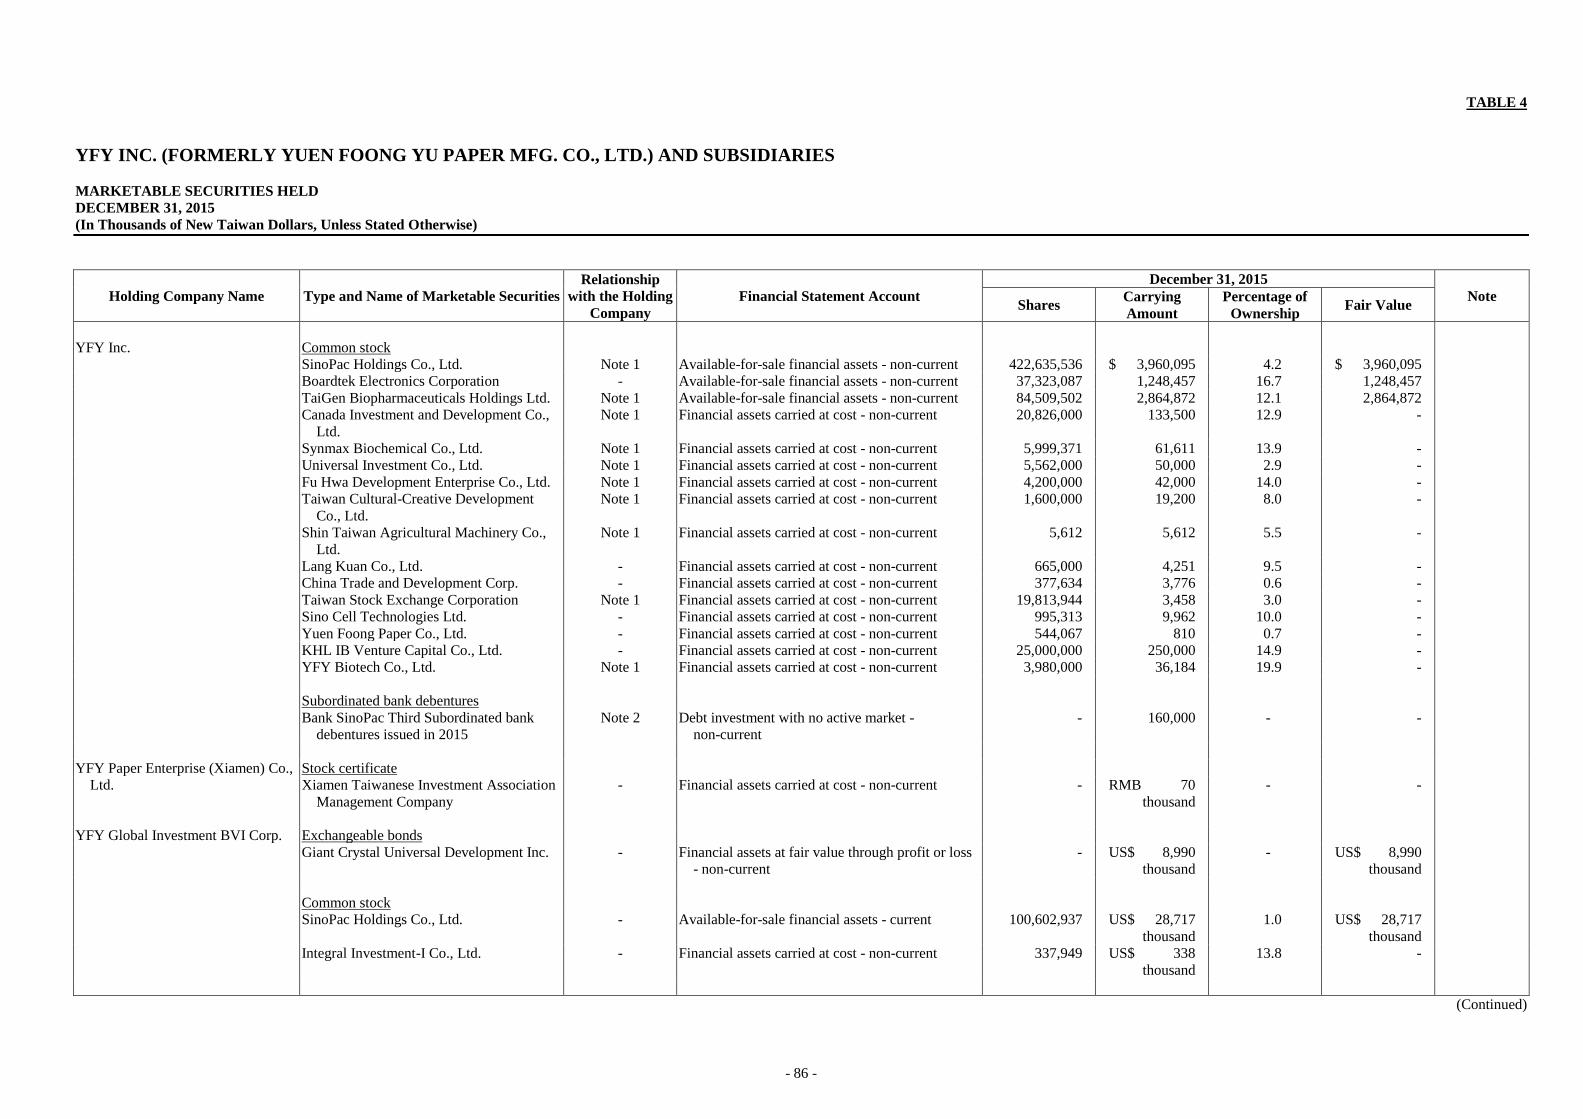
- 86 -
TABLE 4
YFY INC. (FORMERLY YUEN FOONG YU PAPER MFG. CO., LTD.) AND SUBSIDIARIES
MARKETABLE SECURITIES HELD
DECEMBER 31, 2015
(In Thousands of New Taiwan Dollars, Unless Stated Otherwise)
Holding Company Name Type and Name of Marketable Securities
Relationship
with the Holding
Company
Financial Statement Account
December 31, 2015
Note Shares
Carrying
Amount
Percentage of
Ownership Fair Value
YFY Inc. Common stock
SinoPac Holdings Co., Ltd. Note 1 Available-for-sale financial assets - non-current 422,635,536 $ 3,960,095 4.2 $ 3,960,095
Boardtek Electronics Corporation - Available-for-sale financial assets - non-current 37,323,087 1,248,457 16.7 1,248,457
TaiGen Biopharmaceuticals Holdings Ltd. Note 1 Available-for-sale financial assets - non-current 84,509,502 2,864,872 12.1 2,864,872
Canada Investment and Development Co.,
Ltd.
Note 1 Financial assets carried at cost - non-current 20,826,000 133,500 12.9 -
Synmax Biochemical Co., Ltd. Note 1 Financial assets carried at cost - non-current 5,999,371 61,611 13.9 -
Universal Investment Co., Ltd. Note 1 Financial assets carried at cost - non-current 5,562,000 50,000 2.9 -
Fu Hwa Development Enterprise Co., Ltd. Note 1 Financial assets carried at cost - non-current 4,200,000 42,000 14.0 -
Taiwan Cultural-Creative Development
Co., Ltd.
Note 1 Financial assets carried at cost - non-current 1,600,000 19,200 8.0 -
Shin Taiwan Agricultural Machinery Co.,
Ltd.
Note 1 Financial assets carried at cost - non-current 5,612 5,612 5.5 -
Lang Kuan Co., Ltd. - Financial assets carried at cost - non-current 665,000 4,251 9.5 -
China Trade and Development Corp. - Financial assets carried at cost - non-current 377,634 3,776 0.6 -
Taiwan Stock Exchange Corporation Note 1 Financial assets carried at cost - non-current 19,813,944 3,458 3.0 -
Sino Cell Technologies Ltd. - Financial assets carried at cost - non-current 995,313 9,962 10.0 -
Yuen Foong Paper Co., Ltd. - Financial assets carried at cost - non-current 544,067 810 0.7 -
KHL IB Venture Capital Co., Ltd. - Financial assets carried at cost - non-current 25,000,000 250,000 14.9 -
YFY Biotech Co., Ltd. Note 1 Financial assets carried at cost - non-current 3,980,000 36,184 19.9 -
Subordinated bank debentures
Bank SinoPac Third Subordinated bank
debentures issued in 2015
Note 2 Debt investment with no active market -
non-current
- 160,000 - -
YFY Paper Enterprise (Xiamen) Co., Stock certificate
Ltd. Xiamen Taiwanese Investment Association
Management Company
- Financial assets carried at cost - non-current - RMB 70
thousand
- -
YFY Global Investment BVI Corp. Exchangeable bonds
Giant Crystal Universal Development Inc. - Financial assets at fair value through profit or loss
- non-current
- US$ 8,990
thousand
- US$ 8,990
thousand
Common stock
SinoPac Holdings Co., Ltd. - Available-for-sale financial assets - current 100,602,937 US$ 28,717
thousand
1.0 US$ 28,717
thousand
Integral Investment-I Co., Ltd. - Financial assets carried at cost - non-current 337,949 US$ 338
thousand
13.8 -
(Continued)

- 87 -
Holding Company Name Type and Name of Marketable Securities
Relationship
with the Holding
Company
Financial Statement Account
December 31, 2015
Note Shares
Carrying
Amount
Percentage of
Ownership Fair Value
Preferred stock
Neutron Innovation (BVI) Ltd. - Financial assets carried at cost - non-current 1,692,250 US$ 1,354
thousand
6.5 $ -
Micareo Inc. - Financial assets carried at cost - non-current 4,999,999 US$ 2,000
thousand
15.7 -
Loyalty Alliance Enterprise Co., Ltd. - Financial assets carried at cost - non-current 3,034,073 US$ 2,440
thousand
2.6 -
Omni-ID Corporation Inc. - Financial assets carried at cost - non-current 2,953,630 US$ 3,000
thousand
3.7 -
Beneficiary certificates
Doughty Hanson & Co III - Financial assets carried at cost - non-current - US$ 960
thousand
0.2 -
WI Harper INC Fund VII LP - Financial assets carried at cost - non-current - US$ 235
thousand
0.3 -
Shin Foong Chemical Industry Co., Beneficiary certificates
Ltd. SinoPac TWD Money Market - Financial assets at fair value through profit or loss
- current
21,138,623 290,817 - 290,817
Common stock
SinoPac Holdings Co., Ltd. - Available-for-sale financial assets - non-current 19,748,706 185,045 0.2 185,045
Foongtone Technology Co., Ltd. - Financial assets carried at cost - non-current 2,383,815 11,784 11.8 -
Huashan Cultural-Creative Co., Ltd. - Financial assets carried at cost - non-current 3,200,000 32,000 6.2 -
China Color Printing Co., Ltd. Beneficiary certificates
Jih Sun Money Market - Financial assets at fair value through profit or loss
- current
2,872,617 42,002 - 42,002
Common stock
China Development Financial Holding
Corporation
- Available-for-sale financial assets - current 9,959,081 81,963 0.1 81,963
China Parcel Co., Ltd. - Financial assets carried at cost - non-current 463,917 5,804 10.8 -
YFY Capital Co., Ltd. Common stock
SinoPac Holdings Co., Ltd. - Available-for-sale financial assets - current 26,208,125 245,570 0.3 245,570
Yuanta Financial Holdings Co., Ltd. - Available-for-sale financial assets - current 8,946,324 108,698 0.1 108,698
Mega Financial Holding Company Ltd. - Available-for-sale financial assets - current 11,244,315 238,942 0.1 238,942
Taiwan Cooperative Financial Holding Co.,
Ltd.
- Available-for-sale financial assets - current 6,125,996 84,232 0.1 84,232
Taishin Holdings Co., Ltd. - Available-for-sale financial assets - current 25,448,493 290,113 0.3 290,113
Chinatrust Financial Holding Co., Ltd. - Available-for-sale financial assets - current 32,852 555 - 555
E.Sun Financial Holding Company Ltd. - Available-for-sale financial assets - current 1,291,696 24,736 - 24,736
Fubon Financial Holding Co., Ltd. - Available-for-sale financial assets - current 10,000 450 - 450
Cathay Financial Holding Co., Ltd. - Available-for-sale financial assets - current 21,000 972 - 972
China Life Insurance Company Ltd. - Available-for-sale financial assets - current 28,600 722 - 722
Advance Materials Corporation Co., Ltd. - Financial assets carried at cost - non-current 2,349,620 13,205 1.7 -
Leadwell Machines Mfg. Corp. - Financial assets carried at cost - non-current 2,090,000 23,957 3.4 -
(Continued)

- 88 -
Holding Company Name Type and Name of Marketable Securities
Relationship
with the Holding
Company
Financial Statement Account
December 31, 2015
Note Shares
Carrying
Amount
Percentage of
Ownership Fair Value
YFY Binotech Mangement Company Common stock
iStat Biomedical Co., Ltd. - Financial assets carried at cost - non-current 100,000 $ 1,000 0.6 $ -
YFY Venture Capital Investment Common stock
Co., Ltd. SinoPac Holdings Co., Ltd. - Financial assets at fair value through profit or loss
- current
9,946,173 93,196 0.1 93,196
SinoPac Holdings Co., Ltd. - Available-for-sale financial assets - current 55,102,531 516,311 0.5 516,311
Taigen Pharmaceuticals Holdings Limited Note 1 Available-for-sale financial assets - non-current 1,265,000 42,884 0.2 42,884
Quan Yuan Investment Co., Ltd. Note 1 Financial assets carried at cost - non-current 7,000,000 70,000 5.5 -
Taiwan Global BioFund Co., Ltd. Note 1 Financial assets carried at cost - non-current 5,600,000 69,384 4.7 -
Vision Venture Capital Corp. - Financial assets carried at cost - non-current 195,392 1,954 4.2 -
Ever Terminal Co., Ltd. - Financial assets carried at cost - non-current 3,002,401 33,567 2.5 -
Echem Solutions Corp. - Financial assets carried at cost - non-current 1,419,369 20,625 2.9 -
Overseas Investment & Development Co.,
Ltd.
- Financial assets carried at cost - non-current 1,000,000 9,960 1.1 -
Advance Materials Corporation Co., Ltd. - Financial assets carried at cost - non-current 1,113 11 - -
Medeon Biodesign, Inc. - Financial assets carried at cost - non-current 205,000 28,700 0.5 -
Hanmore Investment Corp. - Financial assets carried at cost - non-current 1,635,245 - 8.3 -
YFY Paradigm Investment Co., Ltd. Common stock
SinoPac Holdings Co., Ltd. - Available-for-sale financial assets - current 71,803,384 672,798 0.7 672,798
Darfon Electronics Corp. - Available-for-sale financial assets - current 801,076 15,421 0.3 15,421
Well Shin Technology Co., Ltd. - Available-for-sale financial assets - current 233,954 12,587 0.2 12,587
Shen’s Art Printing Co., Ltd. Note 1 Available-for-sale financial assets - current 43,109 648 0.1 648
Taigen Pharmaceuticals Holdings Limited - Available-for-sale financial assets - non-current 28,211,405 956,367 4.1 956,367
Canada Investment and Development Co.,
Ltd.
Note 1 Financial assets carried at cost - non-current 2,574,000 16,500 1.6 -
Locus Publishing Company Note 1 Financial assets carried at cost - non-current 1,402,386 16,442 12.8 -
Huashan Cultural-Creative Co., Ltd. Note 1 Financial assets carried at cost - non-current 6,893,333 68,933 13.3 -
Sino Cell Technologies Ltd. Note 1 Financial assets carried at cost - non-current 994,687 9,971 9.9 -
Foongtone Technology Co., Ltd. - Financial assets carried at cost - non-current 728,252 500 3.6 -
Taiwan Stock Exchange Corp. - Financial assets carried at cost - non-current 1,371 50 - -
Medeon Biodesign, Inc. - Financial assets carried at cost - non-current 259,000 36,260 0.6 -
YFY Packaging Inc. Beneficiary certificates
SinoPac TWD Money Market - Financial assets at fair value through profit or loss
- current
3,816,107 52,500 - 52,500
Yuanta Wan Tai Money Market Fund Financial assets at fair value through profit or loss
- current
133,634 2,000 - 2,000
Cupid InfoTech Co., Ltd. Common stock
SinoPac Holdings Co., Ltd. Available-for-sale financial assets - current 6,725,792 63,021 0.1 63,021
Lotus Ecoscings & Engineering Co., Common stock
Ltd. SinoPac Holdings Co., Ltd. - Available-for-sale financial assets - current 27,262,508 255,450 0.3 255,450
Boardtek Electronics Cor. Note 1 Available-for-sale financial assets - current 2,335,530 78,123 1.0 78,123
Fu Hwa Development Enterprise Co., Ltd. - Financial assets carried at cost - non-current 1,050,000 26,750 3.5 -
Foongtone Technology Co., Ltd. Note 1 Financial assets carried at cost - non-current 404,584 2,000 2.0 -
(Continued)

- 89 -
Holding Company Name Type and Name of Marketable Securities
Relationship
with the Holding
Company
Financial Statement Account
December 31, 2015
Note Shares
Carrying
Amount
Percentage of
Ownership Fair Value
Chung Hwa Pulp Co., Ltd. Common stock
SinoPac Holdings Co., Ltd. - Available-for-sale financial assets - current 68,365,018 $ 640,580 0.7 $ 640,580
Taigen Pharmaceuticals Holdings Limited - Available-for-sale financial assets - non-current 13,315,248 451,387 1.9 451,387
ID Softcapital Inc. Note 1 Financial assets carried at cost - non-current 5,000 50 5.0 -
NTU Innovation & Incubation Co., Ltd. Note 1 Financial assets carried at cost - non-current 800,000 8,000 6.3 -
Groundhog Technologies Inc. - Financial assets carried at cost - non-current 275,000 3,902 2.8 -
KHL IB Venture Capital Co., Ltd. - Financial assets carried at cost - non-current 25,000,000 250,000 14.9 -
Subordinated bank debentures
Bank SinoPac Third Subordinated bank
debentures issued in 2015
- Debt investment with no active market -
non-current
- 170,000 - -
YFY Operating Management Beneficiary certificates
Consulting Co., Ltd. SinoPac TWD Money Market - Financial assets at fair value through profit or loss
- current
11,678,263 160,665 - 160,665
Ever Growing Agriculture Biotech Beneficiary certificates
Co., Ltd. SinoPac TWD Money Market - Financial assets at fair value through profit or loss
- current
574,741 7,907 - 7,907
Yeon Technologies Co., Ltd. Beneficiary certificates
SinoPac TWD Money Market - Financial assets at fair value through profit or loss
- current
109,076 1,501 - 1,501
Yuanta Wan Tai Money Market Fund - Financial assets at fair value through profit or loss
- current
56,800 850 - 850
Union Paper Co., Ltd. Beneficiary certificates
SinoPac TWD Money Market Financial assets at fair value through profit or loss
- current
2,933,157 40,353 - 40,353
Subordinated bank debentures
Bank SinoPac Third Subordinated bank
debentures issued in 2015
- Debt investment with no active market -
non-current
- 20,000 - -
Eihoyo Shoji Co., Ltd. Common stock
Beautone Japan Co., Ltd. - Financial assets carried at cost - non-current 440 JPY 37,400
thousand
36.7 -
Effion Enertech Co., Ltd. Subordinated bank debentures
Bank SinoPac Third Subordinated bank
debentures issued in 2015
- Debt investment with no active market -
non-current
- 50,000 - -
Note 1: The investor is the member of the Board of Directors or supervisors.
Note 2: The investor is the member of parent company of the board of directors.
(Concluded)

- 90 -
TABLE 5
YFY INC. (FORMERLY YUEN FOONG YU PAPER MFG. CO., LTD.) AND SUBSIDIARIES
MARKETABLE SECURITIES ACQUIRED AND DISPOSED AT COSTS OR PRICES OF AT LEAST $300 MILLION OR 20% OF THE PAID-IN CAPITAL
FOR THE YEAR ENDED DECEMBER 31, 2015
(In Thousands of New Taiwan Dollars)
Company Name Type and Name of Marketable
Security
Financial
Statement
Account
Counterparty Relationship
Beginning Balance Acquisition Disposal Other
Adjustments
(Note 3)
Ending Balance
Note Shares Amount Shares Amount Shares Amount
Carrying
Amount
Gain (Loss) on
Disposal Shares Amount
YFY Inc. Beneficial certificate
SinoPac TWD Money Market Note 1 - - - $ - 92,603,558 $ 1,272,500 92,603,558 $ 1,272,656 $ 1,272,500 $ 156 $ - - $ - -
Common stock
YFY International BVI Corp. Note 2 - - 534,598,758 22,525,090 15,500,000 493,613 - - - - (992,378 ) 550,098,758 22,026,325 Note 6
YFY Packaging Inc. Beneficiary certificate
SinoPac TWD Money Market Note 1 - - 2,264,873 31,000 292,218,153 4,009,900 290,666,919 3,988,847 3,988,399 448 (1 ) 3,816,107 52,500 - Yuanta Wan Tai Money Market Note 1 - - - - 136,775,606 2,042,200 136,641,972 2,040,455 2,040,200 255 - 133,634 2,000 -
YFY Consumer Products Co., Common stock Ltd. Yuen Foong Yu Consumer
Products Co., Ltd.
Note 2 - - 100,013,000 1,739,718 50,000,000 1,274,643 - - - - (2,130 ) 150,013,000 3,012,231 Notes 5 and 6
Chung Hwa Pulp Co., Ltd. Beneficiary certificate
SinoPac TWD Money Market Note 1 - - - - 407,473,376 5,591,800 407,473,376 5,592,294 5,591,800 494 - - - -
Mega Diamond Money Market Note 1 - - - - 124,796,712 1,538,000 124,796,712 1,538,182 1,538,000 182 - - - -
YFY Cayman Co., Ltd. Common stock
YFY Packaging Capital Corp. Note 2 - - - - 200,000,000 6,565,000 (Note 4)
- - - - (93,835 ) (Note 4)
200,000,000 6,471,165 Note 6
YFY Operation Management Beneficiary certificate Consulting Co., Ltd. SinoPac TWD Money Market Note 1 - - 12,005,659 164,325 39,344,211 540,000 39,671,607 544,200 543,713 487 53 11,678,263 160,665 -
Shin Foong Chemicla Beneficiary certificate Industry Co., Ltd. SinoPac TWD Money Market Note 1 - - - - 60,304,960 828,000 39,166,337 538,008 537,347 661 164 21,138,623 290,817 -
YFY Capital Co., Ltd. Beneficiary certificate SinoPac TWD Money Market Note 1 - - - - 50,473,991 693,000 50,473,991 693,075 693,000 75 - - - -
Union Paper Co., Ltd. Beneficiary certificate
SinoPac TWD Money Market Note 1 - - 3,517,548 48,146 33,165,578 455,000 33,749,969 463,000 462,786 214 (7 ) 2,933,157 40,353 -
Note 1: Accounted as financial assets at fair value through profit or loss - current.
Note 2: Accounted as investments accounted for using equity method.
Note 3: Include the exchange differences on translating foreign operations, share of other comprehensive income of associates and unrealized gains and losses on available-for-sale financial assets.
Note 4: The exchange rates are US$1=NT$32.825 as of December 31, 2015.
Note 5: Formerly Trifaith Ltd.
Note 6: In preparing the consolidated financial statements, the transaction has been eliminated.
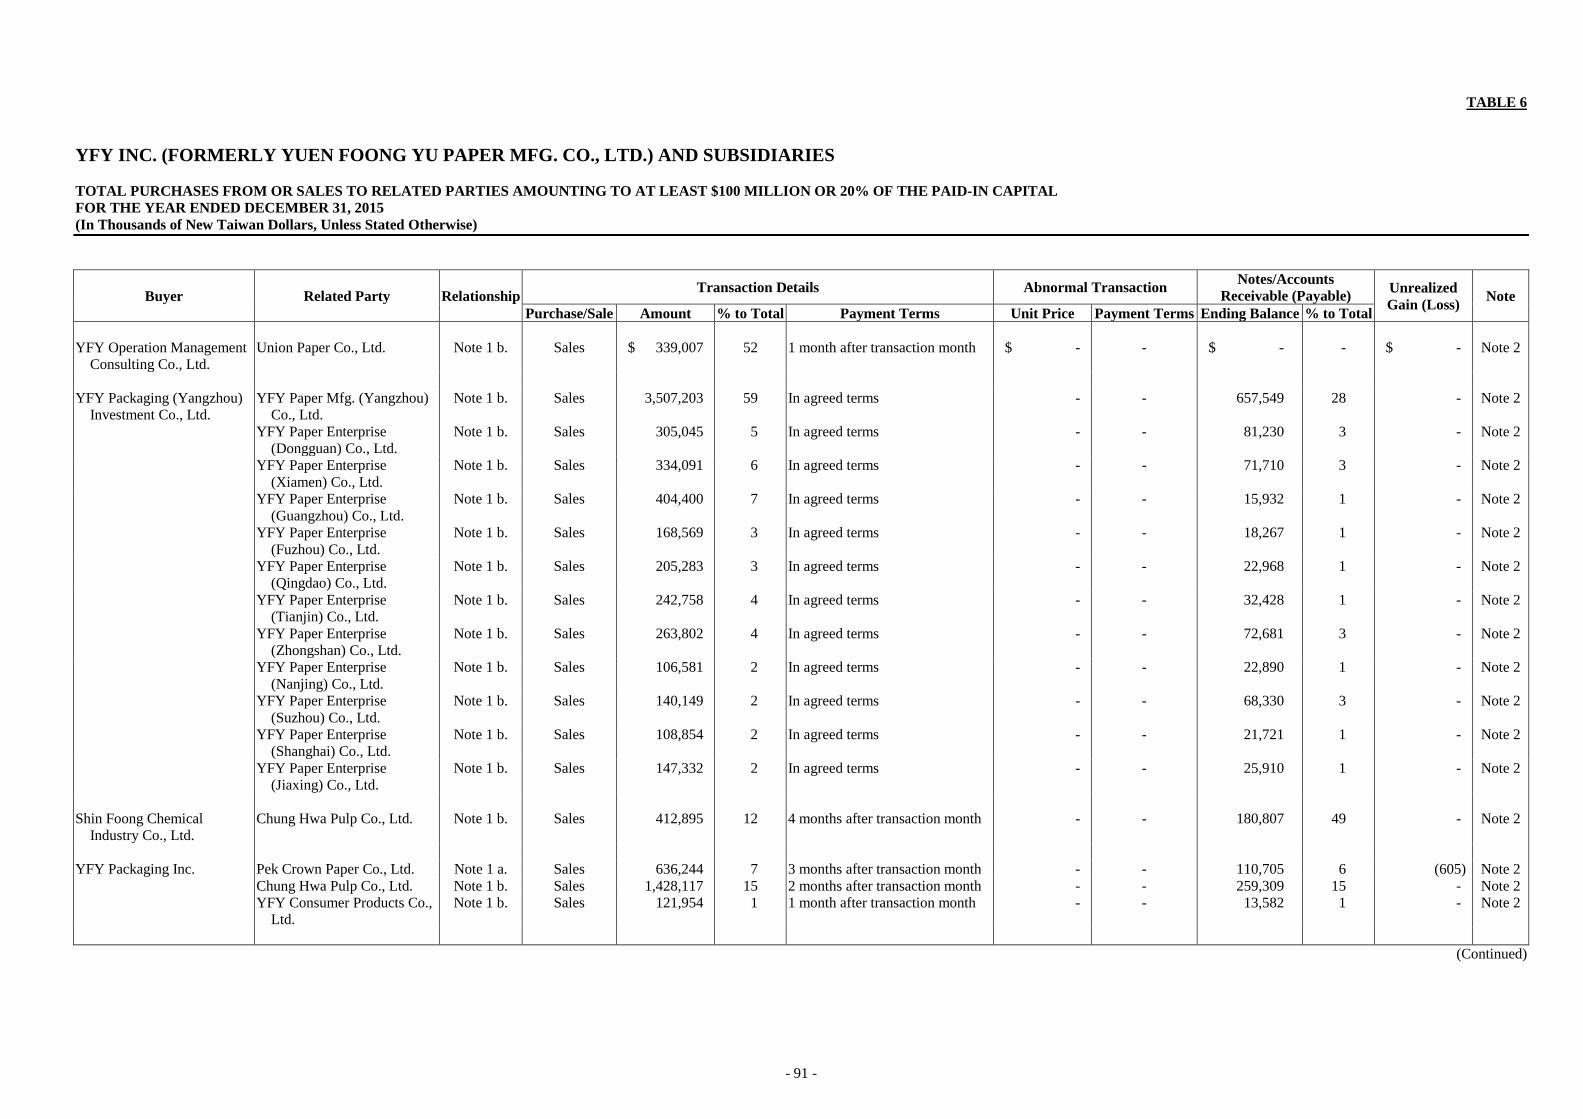
- 91 -
TABLE 6
YFY INC. (FORMERLY YUEN FOONG YU PAPER MFG. CO., LTD.) AND SUBSIDIARIES
TOTAL PURCHASES FROM OR SALES TO RELATED PARTIES AMOUNTING TO AT LEAST $100 MILLION OR 20% OF THE PAID-IN CAPITAL
FOR THE YEAR ENDED DECEMBER 31, 2015
(In Thousands of New Taiwan Dollars, Unless Stated Otherwise)
Buyer Related Party Relationship Transaction Details Abnormal Transaction
Notes/Accounts
Receivable (Payable) Unrealized
Gain (Loss) Note
Purchase/Sale Amount % to Total Payment Terms Unit Price Payment Terms Ending Balance % to Total
YFY Operation Management
Consulting Co., Ltd.
Union Paper Co., Ltd. Note 1 b. Sales $ 339,007 52 1 month after transaction month $ - - $ - - $ - Note 2
YFY Packaging (Yangzhou)
Investment Co., Ltd.
YFY Paper Mfg. (Yangzhou)
Co., Ltd.
Note 1 b. Sales 3,507,203 59 In agreed terms - - 657,549 28 - Note 2
YFY Paper Enterprise
(Dongguan) Co., Ltd.
Note 1 b. Sales 305,045 5 In agreed terms - - 81,230 3 - Note 2
YFY Paper Enterprise
(Xiamen) Co., Ltd.
Note 1 b. Sales 334,091 6 In agreed terms - - 71,710 3 - Note 2
YFY Paper Enterprise
(Guangzhou) Co., Ltd.
Note 1 b. Sales 404,400 7 In agreed terms - - 15,932 1 - Note 2
YFY Paper Enterprise
(Fuzhou) Co., Ltd.
Note 1 b. Sales 168,569 3 In agreed terms - - 18,267 1 - Note 2
YFY Paper Enterprise
(Qingdao) Co., Ltd.
Note 1 b. Sales 205,283 3 In agreed terms - - 22,968 1 - Note 2
YFY Paper Enterprise
(Tianjin) Co., Ltd.
Note 1 b. Sales 242,758 4 In agreed terms - - 32,428 1 - Note 2
YFY Paper Enterprise
(Zhongshan) Co., Ltd.
Note 1 b. Sales 263,802 4 In agreed terms - - 72,681 3 - Note 2
YFY Paper Enterprise
(Nanjing) Co., Ltd.
Note 1 b. Sales 106,581 2 In agreed terms - - 22,890 1 - Note 2
YFY Paper Enterprise
(Suzhou) Co., Ltd.
Note 1 b. Sales 140,149 2 In agreed terms - - 68,330 3 - Note 2
YFY Paper Enterprise
(Shanghai) Co., Ltd.
Note 1 b. Sales 108,854 2 In agreed terms - - 21,721 1 - Note 2
YFY Paper Enterprise
(Jiaxing) Co., Ltd.
Note 1 b. Sales 147,332 2 In agreed terms - - 25,910 1 - Note 2
Shin Foong Chemical
Industry Co., Ltd.
Chung Hwa Pulp Co., Ltd. Note 1 b. Sales 412,895 12 4 months after transaction month - - 180,807 49 - Note 2
YFY Packaging Inc. Pek Crown Paper Co., Ltd. Note 1 a. Sales 636,244 7 3 months after transaction month - - 110,705 6 (605) Note 2
Chung Hwa Pulp Co., Ltd. Note 1 b. Sales 1,428,117 15 2 months after transaction month - - 259,309 15 - Note 2
YFY Consumer Products Co.,
Ltd.
Note 1 b. Sales 121,954 1 1 month after transaction month - - 13,582 1 - Note 2
(Continued)
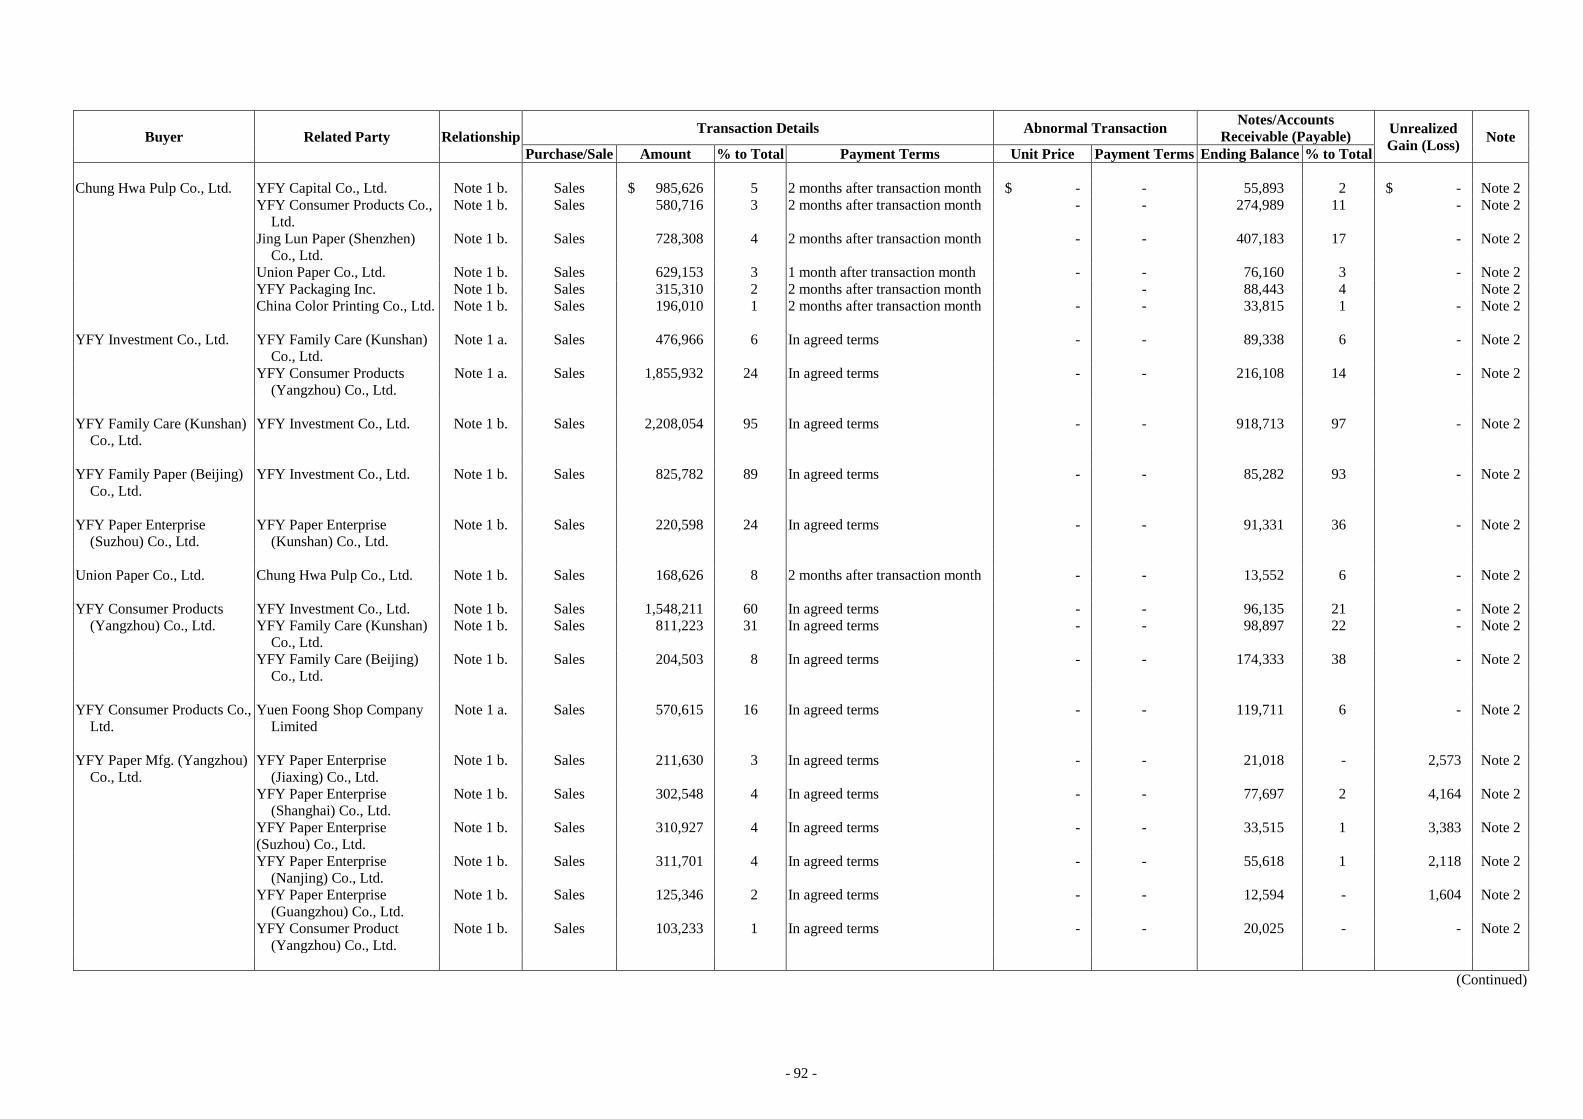
- 92 -
Buyer Related Party Relationship Transaction Details Abnormal Transaction
Notes/Accounts
Receivable (Payable) Unrealized
Gain (Loss) Note
Purchase/Sale Amount % to Total Payment Terms Unit Price Payment Terms Ending Balance % to Total
Chung Hwa Pulp Co., Ltd. YFY Capital Co., Ltd. Note 1 b. Sales $ 985,626 5 2 months after transaction month $ - - 55,893 2 $ - Note 2
YFY Consumer Products Co.,
Ltd.
Note 1 b. Sales 580,716 3 2 months after transaction month - - 274,989 11 - Note 2
Jing Lun Paper (Shenzhen)
Co., Ltd.
Note 1 b. Sales 728,308 4 2 months after transaction month - - 407,183 17 - Note 2
Union Paper Co., Ltd. Note 1 b. Sales 629,153 3 1 month after transaction month - - 76,160 3 - Note 2
YFY Packaging Inc. Note 1 b. Sales 315,310 2 2 months after transaction month - 88,443 4 Note 2
China Color Printing Co., Ltd. Note 1 b. Sales 196,010 1 2 months after transaction month - - 33,815 1 - Note 2
YFY Investment Co., Ltd. YFY Family Care (Kunshan)
Co., Ltd.
Note 1 a. Sales 476,966 6 In agreed terms - - 89,338 6 - Note 2
YFY Consumer Products
(Yangzhou) Co., Ltd.
Note 1 a. Sales 1,855,932 24 In agreed terms - - 216,108 14 - Note 2
YFY Family Care (Kunshan)
Co., Ltd.
YFY Investment Co., Ltd. Note 1 b. Sales 2,208,054 95 In agreed terms - - 918,713 97 - Note 2
YFY Family Paper (Beijing)
Co., Ltd.
YFY Investment Co., Ltd. Note 1 b. Sales 825,782 89 In agreed terms - - 85,282 93 - Note 2
YFY Paper Enterprise
(Suzhou) Co., Ltd.
YFY Paper Enterprise
(Kunshan) Co., Ltd.
Note 1 b. Sales 220,598 24 In agreed terms - - 91,331 36 - Note 2
Union Paper Co., Ltd. Chung Hwa Pulp Co., Ltd. Note 1 b. Sales 168,626 8 2 months after transaction month - - 13,552 6 - Note 2
YFY Consumer Products YFY Investment Co., Ltd. Note 1 b. Sales 1,548,211 60 In agreed terms - - 96,135 21 - Note 2
(Yangzhou) Co., Ltd. YFY Family Care (Kunshan)
Co., Ltd.
Note 1 b. Sales 811,223 31 In agreed terms - - 98,897 22 - Note 2
YFY Family Care (Beijing)
Co., Ltd.
Note 1 b. Sales 204,503 8 In agreed terms - - 174,333 38 - Note 2
YFY Consumer Products Co.,
Ltd.
Yuen Foong Shop Company
Limited
Note 1 a. Sales 570,615 16 In agreed terms - - 119,711 6 - Note 2
YFY Paper Mfg. (Yangzhou)
Co., Ltd.
YFY Paper Enterprise
(Jiaxing) Co., Ltd.
Note 1 b. Sales 211,630 3 In agreed terms - - 21,018 - 2,573 Note 2
YFY Paper Enterprise
(Shanghai) Co., Ltd.
Note 1 b. Sales 302,548 4 In agreed terms - - 77,697 2 4,164 Note 2
YFY Paper Enterprise
(Suzhou) Co., Ltd.
Note 1 b. Sales 310,927 4 In agreed terms - - 33,515 1 3,383 Note 2
YFY Paper Enterprise
(Nanjing) Co., Ltd.
Note 1 b. Sales 311,701 4 In agreed terms - - 55,618 1 2,118 Note 2
YFY Paper Enterprise
(Guangzhou) Co., Ltd.
Note 1 b. Sales 125,346 2 In agreed terms - - 12,594 - 1,604 Note 2
YFY Consumer Product
(Yangzhou) Co., Ltd.
Note 1 b. Sales 103,233 1 In agreed terms - - 20,025 - - Note 2
(Continued)

- 93 -
Buyer Related Party Relationship Transaction Details Abnormal Transaction
Notes/Accounts
Receivable (Payable) Unrealized
Gain (Loss) Note
Purchase/Sale Amount % to Total Payment Terms Unit Price Payment Terms Ending Balance % to Total
Eihoyo Shoji Co., Ltd. Chung Hwa Pulp Co., Ltd. Note 1 b. Sales $ 290,847 45 In agreed terms $ - - $ - - $ - Note 2
Ever Growing Agriculture
Biotech Co., Ltd.
YFY Consumer Products Co.,
Ltd.
Note 1 b. Sales 232,311 100 1 month after transaction month - - 89,015 100 - Note 2
Guangdong Ding Feng Pulp YFY Investment Co., Ltd. Note 1 b. Sales 191,867 8 2 month after transaction month - - 74,515 6 - Note 2
& Paper Co., Ltd. YFY Family Paper (Beijing)
Co., Ltd.
Note 1 b. Sales 123,394 5 In agreed terms - - 40,961 3 -
Zhaoqing Ding Feng Forestry
Ltd.
Guangdong Ding Feng Pulp &
Paper Co., Ltd.
Note 1 b. Sales 436,317 100 Advance payment or 30 days
monthly statement
- - - - - Note 2
San Ying Enterprise Co., Ltd. Union Paper Co., Ltd. Note 1 b. Sales 100,370 66 1 month after transaction month - - 9,054 28 - Note 2
Note 1: The relationships are as follow:
a. Subsidiary.
b. Parent company or the same ultimate parent company.
Note 2: In preparing the consolidated financial statements, the transaction has been eliminated.
(Concluded)
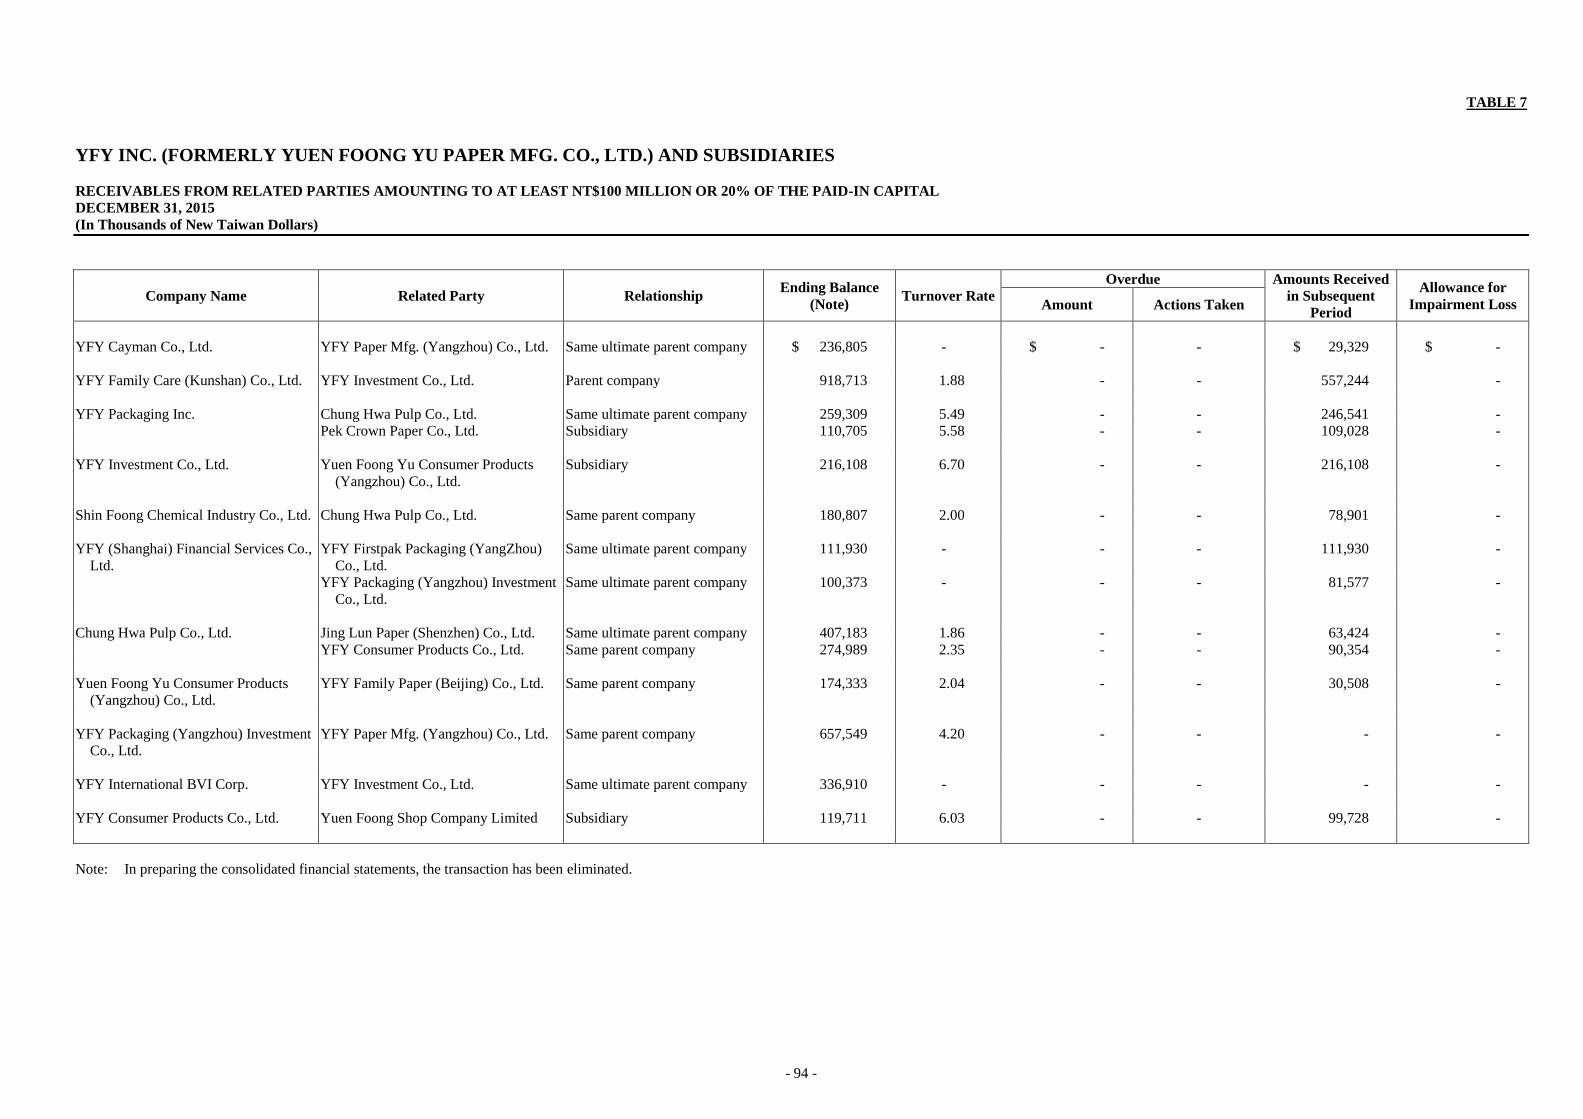
- 94 -
TABLE 7
YFY INC. (FORMERLY YUEN FOONG YU PAPER MFG. CO., LTD.) AND SUBSIDIARIES
RECEIVABLES FROM RELATED PARTIES AMOUNTING TO AT LEAST NT$100 MILLION OR 20% OF THE PAID-IN CAPITAL
DECEMBER 31, 2015
(In Thousands of New Taiwan Dollars)
Company Name Related Party Relationship Ending Balance
(Note) Turnover Rate
Overdue Amounts Received
in Subsequent
Period
Allowance for
Impairment Loss Amount Actions Taken
YFY Cayman Co., Ltd. YFY Paper Mfg. (Yangzhou) Co., Ltd. Same ultimate parent company $ 236,805 - $ - - $ 29,329 $ -
YFY Family Care (Kunshan) Co., Ltd. YFY Investment Co., Ltd. Parent company 918,713 1.88 - - 557,244 -
YFY Packaging Inc. Chung Hwa Pulp Co., Ltd. Same ultimate parent company 259,309 5.49 - - 246,541 -
Pek Crown Paper Co., Ltd. Subsidiary 110,705 5.58 - - 109,028 -
YFY Investment Co., Ltd. Yuen Foong Yu Consumer Products
(Yangzhou) Co., Ltd.
Subsidiary 216,108 6.70 - - 216,108 -
Shin Foong Chemical Industry Co., Ltd. Chung Hwa Pulp Co., Ltd. Same parent company 180,807 2.00 - - 78,901 -
YFY (Shanghai) Financial Services Co.,
Ltd.
YFY Firstpak Packaging (YangZhou)
Co., Ltd.
Same ultimate parent company 111,930 - - - 111,930 -
YFY Packaging (Yangzhou) Investment
Co., Ltd.
Same ultimate parent company 100,373 - - - 81,577 -
Chung Hwa Pulp Co., Ltd. Jing Lun Paper (Shenzhen) Co., Ltd. Same ultimate parent company 407,183 1.86 - - 63,424 -
YFY Consumer Products Co., Ltd. Same parent company 274,989 2.35 - - 90,354 -
Yuen Foong Yu Consumer Products
(Yangzhou) Co., Ltd.
YFY Family Paper (Beijing) Co., Ltd. Same parent company 174,333 2.04 - - 30,508 -
YFY Packaging (Yangzhou) Investment
Co., Ltd.
YFY Paper Mfg. (Yangzhou) Co., Ltd. Same parent company 657,549 4.20 - - - -
YFY International BVI Corp. YFY Investment Co., Ltd. Same ultimate parent company 336,910 - - - - -
YFY Consumer Products Co., Ltd. Yuen Foong Shop Company Limited Subsidiary 119,711 6.03 - - 99,728 -
Note: In preparing the consolidated financial statements, the transaction has been eliminated.

- 95 -
TABLE 8
YFY INC. (FORMERLY YUEN FOONG YU PAPER MFG. CO., LTD.) AND SUBSIDIARIES
INFORMATION ON INVESTEES
FOR THE YEAR ENDED DECEMBER 31, 2015
(In Thousands of New Taiwan Dollars, Unless Stated Otherwise)
Investor Company Investee Company Location Main Businesses and Products Investment Amount As of December 31, 2015 Net Income (Loss)
of the Investee
Share of
Profits (Loss) Note
December 31, 2015 December 31, 2014 Shares % Carrying Amount
YFY Inc. Chung Hwa Pulp Co., Ltd. Hualien, Taiwan Manufacture and sale of pulp $ 5,715,988 $ 6,398,878 627,827,088 56.90 $ 9,452,577 $ 779,717 $ 443,780 Notes 1 and 6
E Ink Holdings Inc. Hsinchu, Taiwan To research, develop, produce and sale Thin-film
transistor liquid crystal
1,361,555 1,361,555 133,472,904 11.70 3,129,684 539,330 57,555 -
YFY International BVI Corp. British Virgin Islands. Investment and holding 17,218,994 16,725,381 550,098,758 100.00 22,026,325 (664,849 ) (664,374 ) Notes 1 and 6
YFY Global Investment BVI Corp. British Virgin Islands. Investment and holding 2,153,335 2,153,335 79,000,000 100.00 4,550,685 299,190 298,959 Notes 1 and 6
YFY Consumer Products Co., Ltd. Taipei, Taiwan Sale and produce of paper, household cleansers, and related paper merchandise
1,600,000 1,600,000 214,562,200 100.00 2,463,415 (159,006 ) (159,006 ) Notes 1 and 6
Shin Foong Chemical Industry Co., Ltd. Kaohsiung, Taiwan Sale and production of SBR Latex 75,203 75,203 53,451,248 56.70 1,221,683 767,162 434,477 Notes 1 and 6
Taiwan Global BioFund Co., Ltd. Taipei, Taiwan Biotechnology and biopharmaceutical business investment
516,875 516,875 51,687,500 23.00 1,129,728 (80,883 ) (18,582 ) -
China Color Printing Co., Ltd. Taipei, Taiwan To print magazines, posters and books 190,068 190,068 32,896,330 49.70 450,997 44,869 22,280 Notes 1 and 6
YFY Venture Capital Investment Co., Ltd. Taipei, Taiwan Investment and holding 200,000 200,000 44,993,600 100.00 701,794 42,068 42,068 Notes 1 and 6 Effion Enertech Co., Ltd. Taipei, Taiwan To operate cogeneration and provide power
technology
343,000 343,000 34,300,000 49.00 346,475 29,555 16,494 Notes 1 and 6
YFY Capital Co., Ltd. Taipei, Taiwan Paper and paper products, such as the trading business
189,759 189,759 26,840,000 100.00 319,617 52,540 52,540 Notes 1 and 6
YFY Operation Management Consulting Co., Ltd. Taipei, Taiwan Consulting management 250,000 250,000 25,000,000 100.00 241,073 20,716 20,716 Notes 1 and 6
Union Paper Co., Ltd. Yunlin, Taiwan Sale and manufacture of Kraft paper 200,700 200,700 19,584,000 18.90 225,081 21,121 3,995 Notes 1 and 6 YFY Paradigm Investment Co., Ltd. Taipei, Taiwan Investment and holding 231,357 231,357 54,870,000 100.00 1,378,687 62,297 62,297 Notes 1 and 6
San Ying Enterprise Co., Ltd. Taipei, Taiwan Design and construct water processing
construction and environmental facilities.
100,003 100,003 12,600,000 100.00 137,066 962 962 Notes 1 and 6
Lotus Ecoscings & Engineering Co., Ltd. Taipei, Taiwan Construction of sewage treatment plants and
incinerators
152,944 152,944 21,939,000 100.00 240,395 19,660 19,660 Notes 1 and 6
Eihoyo Shoji Co., Ltd. Japan Trade of paper, chemical material and machinery 2,099 2,099 200 100.00 81,646 1,857 1,857 Notes 1 and 6 Yuen Yan Paper Container Co., Ltd. Miaoli, Taiwan Sale of corrugated paper and manufacture of
material
62,462 69,327 6,178,500 50.90 70,424 6,769 3,448 Notes 1 and 6
Quan Hwa Venture Capital Co., Ltd.
Taipei, Taiwan Venture capital 27,331 27,331 2,733,167 19.50 9,704 - - -
Cupid InfoTech Co., Ltd.
Taipei, Taiwan 1. To provide service in information software
and information processing. 2. Wholesale of information software and
electric appliance.
10,000 10,000 1,000,000 100.00 23,364 9,402 9,402 Notes 1 and 6
Han Tang Management Services Co., Ltd.
Taipei, Taiwan To provide consulting service in business and information management
- 178 - - - (5 ) (2 ) -
Taiwan Genome Sciences Co., Ltd.
Taipei, Taiwan 1. Develop skills in genome medicine
2. Manufacture, wholesale of chemical material 3. Medicine test
12,260 12,260 1,225,956 19.40 3,384 430 83 -
YFY International BVI Corp. YFY Cayman Co., Ltd. Cayman Islands Investment and holding US$ 361,850 thousand
US$ 361,850 thousand
309,918,142 100.00 US$ 444,019 thousand
US$ (27,314 ) thousand
US$ (27,314 ) thousand
Notes 1 and 6
Hwa Fong Paper (H.K.) Ltd. Hong Kong, China Sale and print of paper merchandise US$ 13,520
thousand
US$ 13,520
thousand
116,000,000 100.00 US$ 2,370
thousand
US$ 241
thousand
US$ 241
thousand
Notes 1 and 6
Systax Communication (H.K.) Ltd. Hong Kong, China Sale and print of paper merchandise US$ 4,646
thousand
US$ 4,646
thousand
20,499,999 100.00 - US$ 89
thousand
US$ 89
thousand
Notes 1, 2 and 6
YFY Biopulp Technology Limited British Virgin Islands Investment and holding US$ 90 thousand
US$ 90 thousand
90,000 60.00 US$ 2 thousand
US$ (50 ) thousand
US$ (30 ) thousand
Notes 1 and 6
YFY Cayman Co., Ltd. YFY International Labuan Co., Ltd. Malaysia Investment and holding US$ 135,901 thousand
US$ 135,901 thousand
135,901,099 100.00 US$ 223,474 thousand
US$ (7,498 ) thousand
US$ (7,502 ) thousand
Notes 1 and 6
YFY Mauritius Corp. Mauritius Investment and holding US$ 157,502
thousand
US$ 157,502
thousand
157,501,731 60.0 US$ 130,647
thousand
US$ (41,688 )
thousand
US$ (25,013 )
thousand
Notes 1 and 6
Willpower Industries Ltd. British Virgin Islands Investment and holding US$ 10,898
thousand
US$ 10,898
thousand
6,950,000 44.80 US$ 18,837
thousand
US$ 6,478
thousand
US$ 2,904
thousand
-
YFY Packaging Capital Corp. British Virgin Islands Investment and holding US$ 200,000
thousand
-
200,000,000 100.00 US$ 197,141
thousand
US$ 959
thousand
US$ 959
thousand
Notes 1 and 6
(Continued)

- 96 -
Investor Company Investee Company Location Main Businesses and Products Investment Amount As of December 31, 2015 Net Income (Loss)
of the Investee
Share of
Profits (Loss) Note
December 31, 2015 December 31, 2014 Shares % Carrying Amount
YFY International Labuan Co., Ltd. YFY Jupiter (BVI) Inc. British Virgin Islands. Investment and holding US$ 4,444
Thousand
US$ 4,444
Thousand
4,571,427 38.62 US$ 9,099
thousand
US$ 3,778
thousand
US$ 1,467
thousand
Notes 1 and 6
YFY Packaging Inc. Taipei, Taiwan Production and sale of Kraft paper and
corrugated paper
US$ 135,901
thousand
US$ 135,901
thousand
320,150,000 100.00 US$ 211,165
thousand
US$ (8,976 )
thousand
US$ (8,976 )
thousand
Notes 1 and 6
YFY Jupiter (BVI) Inc. Mobius 105 Ltd. Hong Kong, China Investment and holding HK$ 10
thousand
HK$ 10
thousand
10,000 100.00 US$ 5,608
thousand
US$ 2,050
thousand
US$ 2,050
thousand
Notes 1 and 6
YFY Jupiter Ltd. Hong Kong, China Design of packaging and sale of paper - - 3 100.00 US$ 6,001 thousand
US$ 2,622 thousand
US$ 2,622 thousand
Notes 1 and 6
Jupiter Prestige Group Holding Limited United Kingdom Investment and holding GBP 100
thousand
GBP 100
thousand
100,000 57.00 US$ 3,208
thousand
US$ (1,486 )
thousand
US$ (847 )
thousand
Notes 1 and 6
Mobius 105 (HK) Ltd. Hong Kong, China Design of packaging and sale of paper HK$ 10
thousand
HK$ 10
thousand
10,000 100.00 US$ 12
thousand
US$ (1 )
thousand
US$ (1 )
thousand
Notes 1 and 6
YFY Jupiter US Inc. USA Design of packaging and sale of paper US$ 1 thousand
US$ 1 thousand
100,000 100.00 - - - Notes 1, 2 and 6
YFY Jupiter US, Inc. Innovativ Packaging Worldwide, LLC USA Design of packaging and sale of paper - - 51,000 51.00 - US$ (647 ) thousand
US$ (330 ) thousand
Notes 1, 2 and 6
Mobius 105 Ltd. GST Packaging Ltd. Hong Kong, China Trading business HK$ 4 Thousand
HK$ 4 Thousand
3,500 35.00 US$ 240 thousand
US$ 218 thousand
US$ 76 thousand
-
YJY Packaging Ltd. Hong Kong, China Trading business HK$ 4 Thousand
HK$ 4 Thousand
3,500 35.00 US$ 177 thousand
US$ 203 thousand
US$ 71 thousand
-
JLD Logistics Ltd. Hong Kong, China Trading business HK$ 4
thousand
HK$ 4
thousand
3,500 35.00 US$ 84
thousand
US$ 113
thousand
US$ 40
thousand
-
Jupiter Prestige Group Holding Limited Rimagine Limited Hong Kong, China Investment and holding - - 100 100.00 - US$ (242 )
thousand
US$ (242 )
thousand
Notes 1, 2 and 6
Jupiter Prestige Group Europe Ltd. England Graphic design GBP 30
thousand
GBP 30
thousand
30,000 100.00 US$ 5,175
thousand
US$ (793 )
thousand
US$ (793 )
thousand
Notes 1 and 6
Jupiter Prestige Group North America Inc. USA Design of packaging and sale of paper US$ 1 thousand
US$ 1 thousand
100,000 100.00 US$ 1,158 thousand
US$ (307 ) thousand
US$ (307 ) thousand
Notes 1, 3 and 6
Jupiter Prestige Group Australia PTY Ltd. Australia Graphic design - - 100 100.00 - US$ (172 )
thousand
US$ (172 )
thousand
Notes 1, 2 and 6
Opal BPM Limited United Kingdom Design of process system and assistance of
graphic design
GBP 1
thousand
GBP 1
thousand
1,000 82.50 US$ 148
thousand
US$ 239
thousand
US$ 197
thousand
Notes 1 and 6
Foster and Balyis (Prestige) Ltd. United Kingdom Graphic design 300 33.30 US$ 84 thousand
US$ (73 ) thousand
US$ (24 ) thousand
Note 5
Rimagine Limited Rimagine Group Limited British Virgin Islands. Trading business - - 100 100.00 US$ 192 thousand
US$ 11 thousand
US$ 11 thousand
Notes 1 and 6
Jupiter Prestige Group Europe Ltd. Jupiter Prestige Group Asia Ltd. Hong Kong, China Graphic design - - 100 100.00 US$ 2,022 thousand
US$ 84 thousand
US$ 84 thousand
Notes 1 and 6
Opal BPM Limited Opal BPM India Private Limited India Workflow system coding GBP 1 thousand
- 1,000 100.00 US$ 1 thousand
- - Notes 1 and 6
YFY Packaging Inc. YFY Packaging (BVI) Corp. British Virgin Islands. Investment and holding 4,819,148 4,819,148 150,050,000 100.0 4,357,504 (510,914 ) (510,914 ) Notes 1 and 6 Pek Crown Paper Co., Ltd. Taichung, Taiwan Sale and manufacture of paper container 234,666 234,666 20,027,557 66.8 289,498 52,329 35,684 Notes 1 and 6
YFY Packaging (BVI) Corp. YFY Mauritius Corp. Mauritius Investment and holding US$ 105,000 thousand
US$ 105,000 thousand
105,000,000 40.00 US$ 87,097 thousand
US$ (41,688 ) thousand
US$ (16,675 ) thousand
Notes 1 and 6
YFY Global Investment BVI Corp. YFY RFID Co., Ltd. Hong Kong, China Investment and holding US$ 25,600 thousand
US$ 25,600 thousand
25,600,000 100.00 US$ 49,137 thousand
US$ 7,127 thousand
US$ 7,127 thousand
Notes 1 and 6
YFY Jupiter (BVI) Inc. British Virgin Islands. Investment and holding US$ 4,056
thousand
US$ 4,056
thousand
4,571,428 38.62 US$ 9,390
thousand
US$ 3,778
thousand
US$ 1,467
thousand
Notes 1 and 6
YFY RFID Technologies Co., Ltd. British Virgin Islands. Investment and holding US$ 5,330
thousand
US$ 5,330
thousand
5,330,000 100.00 US$ 116
thousand
US$ (146 )
thousand
US$ (146 )
thousand
Notes 1 and 6
YFY RFID Technologies Co., Ltd. Yeon Technologies Co., Ltd. Taipei, Taiwan Sale and design RFID products US$ 2,035
thousand
US$ 2,035
thousand
6,000,001 100.00 - US$ (146 )
thousand
US$ (146 )
thousand
Notes 1, 2 and 6
YFY Consumer Products Co., Ltd. Yuen Foong Yu Consumer Products Investment
Limited
Samoa Investment and holding 3,543,004 2,268,361 150,013,000 100.00 3,012,231 (277,410 ) (277,410 ) Notes 1, 4 and 6
Ever Growing Agriculture Biotech Co., Ltd. Taipei, Taiwan Agricultural services, wholesale and manufacturing of fertilizers and other cleaning
supplies wholesale.
107,595 32,595 6,716,034 85.00 169,628 24,492 15,785 Notes 1 and 6
Livebricks Inc. Taipei, Taiwan Information processing services. - - 750,000 75.00 - (18,612 ) (13,959 ) Notes 1, 2 and 6 Yuen Foong Shop Company Limited Taipei, Taiwan Sale of paper 25,000 25,000 2,500,000 50.00 3,291 (31,766 ) (15,673 ) Notes 1 and 6
(Continued)

- 97 -
Investor Company Investee Company Location Main Businesses and Products Investment Amount As of December 31, 2015 Net Income (Loss)
of the Investee
Share of
Profits (Loss) Note
December 31, 2015 December 31, 2014 Shares % Carrying Amount
YFY Capital Co., Ltd. Chung Hwa Pulp Co., Ltd. Hualien, Taiwan Manufacture and sale of pulp $ 16,809 $ 18,099 1,181,137 0.1 $ 17,682 $ 779,717 $ 836 Note 6
E Ink Holdings Inc. Hsinchu, Taiwan Sale and manufacture of TFT-LCD 15,672 15,672 267,000 - 16,465 539,330 115 -
YFY Venture Capital Investment Co., Ltd. E Ink Holdings Inc. Hsinchu, Taiwan Sale and manufacture of TFT-LCD 412,244 412,244 23,059,296 2.0 585,099 539,330 9,943 -
Taiwan Global BioFund Co., Ltd. Taipei, Taiwan To provide service in consultation and business management
88,550 88,550 8,855,000 3.9 193,545 (80,883 ) (3,184 ) -
Effion Enertech Co., Ltd. Taipei, Taiwan To operate cogeneration and provide power
technology
7,000 7,000 700,000 1.0 7,478 29,555 296 Note 6
Taiwan Genome Sciences Co., Ltd. Taipei, Taiwan 1. Develop skills in genome medicine
2. Manufacture, wholesale of chemical material
3. Medicine test
1,660 1,660 165,972 2.6 458 430 11 -
Chung Hwa Pulp Co., Ltd. Hualien, Taiwan Manufacture and sale of pulp 68,976 - 7,014,504 0.64 105,000 779,717 - Note 6
YFY Paradigm Investment Co., Ltd. Union Paper Co., Ltd. Yunlin, Taiwan Investment and holding 44,476 44,476 4,112,892 4.0 47,271 21,121 839 Notes 1 and 6 YFY Biotech Management Company Taipei, Taiwan To provide service in consultation and business
management
10,000 10,000 1,400,000 100.0 43,064 24,071 24,071 Notes 1 and 6
E Ink Holdings Inc. Hsinchu, Taiwan Sale and manufacture of TFT-LCD 296,300 296,300 6,094,000 0.5 297,850 539,330 2,628 - Chung Hwa Pulp Co., Ltd. Hualien, Taiwan Manufacture and sale of pulp 77,666 85,971 7,635,485 0.7 114,311 779,717 5,412 Note 6
Yuen Foong Shop Company Limited Taipei, Taiwan Sale of paper 25,000 - 2,500,000 50.0 4,900 (31,766 ) (15,883 ) Notes 1 and 6
Lotus Ecoscings & Engineering Co., Ltd. Taiwan Genome Sciences Co., Ltd. Taipei, Taiwan 1. Develop skills in genome medicine
2. Manufacture, wholesale of chemical material 3. Medicine test
450 450 43,408 0.7 120 430 3 -
E Ink Holdings Inc. Hsinchu, Taiwan Sale and manufacture of TFT-LCD 73,961 73,961 1,778,000 0.2 76,607 539,330 767 -
Yuen Yan Paper Container Co., Ltd. Miaoli, Taiwan Sale of corrugated paper and manufacture of material
107 117 9,000 0.1 103 6,769 5 Note 6
Shin Foong Chemical Industry Co., Ltd. Kaohsiung, Taiwan Trade of paper, chemical material and machinery 183 183 11,000 - 252 767,162 90 Note 6
Pek Crown Paper Co., Ltd. Taichung, Taiwan Sale and manufacture of paper container 141 141 10,000 - 145 52,329 17 Note 6 Chung Hwa Pulp Co., Ltd. Hualien, Taiwan Manufacture and sale of pulp 1,226 1,354 117,247 - 1,750 779,717 83 Note 6
Chung Hwa Pulp Co., Ltd. Chp International (BVI) Corporation British Virgin Islands. Investment and holding 1,747,085 1,747,085 61,039,956 100.0 5,665,910 107,923 107,923 Notes 1 and 6 Effion Enertech Co., Ltd. Taipei, Taiwan To operate cogeneration and provide power
technology
343,000 343,000 34,300,000 49.0 366,429 29,555 14,482 Note 6
Taiwan Global BioFund Co., Ltd. Taipei, Taiwan To provide service in consultation and business management
100,000 100,000 10,000,000 4.4 228,017 (80,883 ) (3,638 ) -
Hwa Fong Investment Co., Ltd. Taipei, Taiwan Investment and holding 36,000 36,000 3,600,000 100.0 48,797 6,064 4,689 Notes 1 and 6
Quan Hwa Venture Capital Co., Ltd.
Taipei, Taiwan Biotechnology and biopharmaceutical business investment.
7,008 7,008 700,812 5.0 2,488 - - -
E Ink Holdings Inc. Hsinchu, Taiwan To research, develop, produce and sale thin-film
transistor liquid crystal display.
329,000 329,000 20,000,000 1.8 373,775 539,330 8,624 -
Hwa Fong Investment Co., Ltd. Effion Enertech Co., Ltd. Taipei, Taiwan To operate cogeneration and provide power
technology
7,000 7,000 700,000 1.0 7,478 29,555 295 Note 6
Kuang Hwa Fertilizer Limited Company Hualien, Taiwan To produce fertilizer 5,000 5,000 - 100.0 10,495 4,514 4,514 Notes 1 and 6
Effion Enertech Co., Ltd. YFY Capital Holdings Corp. British Virgin Islands Investment and holding 243,625 243,625 8,060 100.0 310,213 25,482 25,482 Notes 1 and 6
Note 1: Subsidiary.
Note 2: The amount was recognized as a subtraction from investment accounted for by the equity method and accounted as other non-current liabilities.
Note 3: Formerly YFY Jupiter Inc.
Note 4: Formerly Trifaith Ltd.
Note 5: In August 2015, the Group lost control over Foster and Balyis (Prestige) Ltd. due to the change of substantive influence.
Note 6: In preparing the consolidated financial statements, the transaction has been eliminated.
(Concluded)
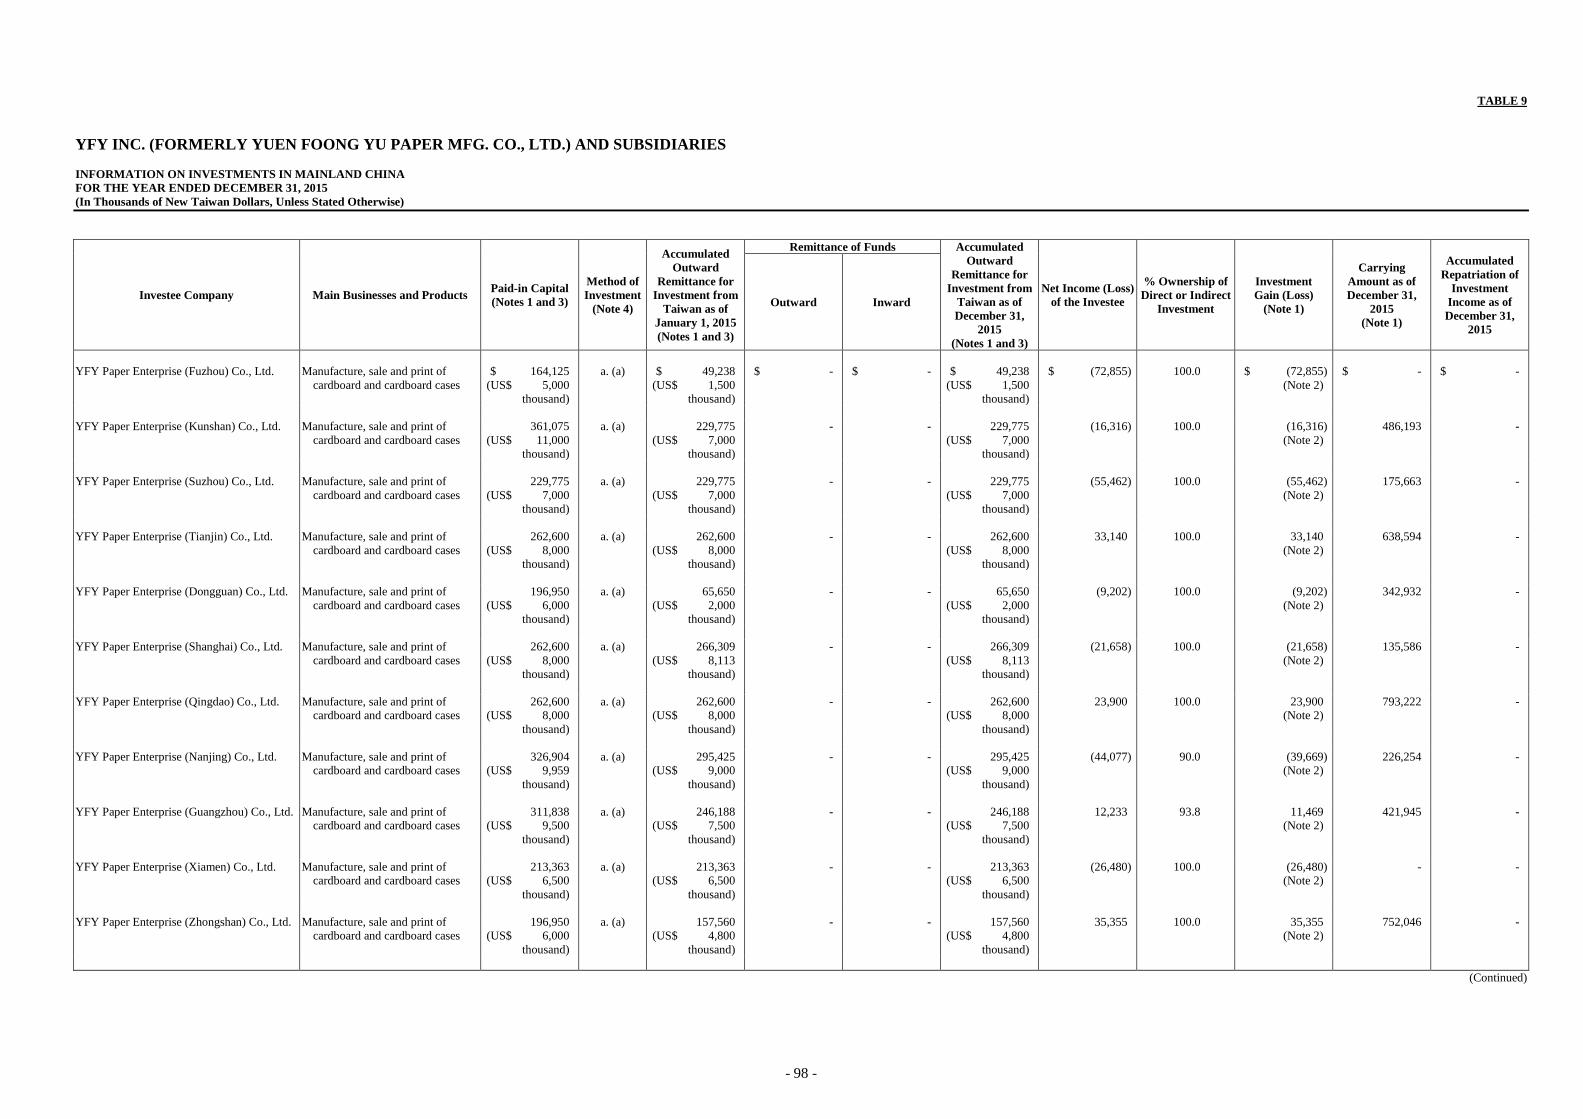
- 98 -
TABLE 9
YFY INC. (FORMERLY YUEN FOONG YU PAPER MFG. CO., LTD.) AND SUBSIDIARIES
INFORMATION ON INVESTMENTS IN MAINLAND CHINA
FOR THE YEAR ENDED DECEMBER 31, 2015
(In Thousands of New Taiwan Dollars, Unless Stated Otherwise)
Investee Company Main Businesses and Products Paid-in Capital
(Notes 1 and 3)
Method of
Investment
(Note 4)
Accumulated
Outward
Remittance for
Investment from
Taiwan as of
January 1, 2015
(Notes 1 and 3)
Remittance of Funds Accumulated
Outward
Remittance for
Investment from
Taiwan as of
December 31,
2015
(Notes 1 and 3)
Net Income (Loss)
of the Investee
% Ownership of
Direct or Indirect
Investment
Investment
Gain (Loss)
(Note 1)
Carrying
Amount as of
December 31,
2015
(Note 1)
Accumulated
Repatriation of
Investment
Income as of
December 31,
2015
Outward Inward
YFY Paper Enterprise (Fuzhou) Co., Ltd. Manufacture, sale and print of
cardboard and cardboard cases
$ 164,125
(US$ 5,000
thousand)
a. (a) $ 49,238
(US$ 1,500
thousand)
$ - $ - $ 49,238
(US$ 1,500
thousand)
$ (72,855) 100.0 $ (72,855)
(Note 2)
$ - $ -
YFY Paper Enterprise (Kunshan) Co., Ltd. Manufacture, sale and print of
cardboard and cardboard cases
361,075
(US$ 11,000
thousand)
a. (a) 229,775
(US$ 7,000
thousand)
- - 229,775
(US$ 7,000
thousand)
(16,316) 100.0 (16,316)
(Note 2)
486,193 -
YFY Paper Enterprise (Suzhou) Co., Ltd. Manufacture, sale and print of
cardboard and cardboard cases
229,775
(US$ 7,000
thousand)
a. (a) 229,775
(US$ 7,000
thousand)
- - 229,775
(US$ 7,000
thousand)
(55,462) 100.0 (55,462)
(Note 2)
175,663 -
YFY Paper Enterprise (Tianjin) Co., Ltd. Manufacture, sale and print of
cardboard and cardboard cases
262,600
(US$ 8,000
thousand)
a. (a) 262,600
(US$ 8,000
thousand)
- - 262,600
(US$ 8,000
thousand)
33,140 100.0 33,140
(Note 2)
638,594 -
YFY Paper Enterprise (Dongguan) Co., Ltd. Manufacture, sale and print of
cardboard and cardboard cases
196,950
(US$ 6,000
thousand)
a. (a) 65,650
(US$ 2,000
thousand)
- - 65,650
(US$ 2,000
thousand)
(9,202) 100.0 (9,202)
(Note 2)
342,932 -
YFY Paper Enterprise (Shanghai) Co., Ltd. Manufacture, sale and print of
cardboard and cardboard cases
262,600
(US$ 8,000
thousand)
a. (a) 266,309
(US$ 8,113
thousand)
- - 266,309
(US$ 8,113
thousand)
(21,658) 100.0 (21,658)
(Note 2)
135,586 -
YFY Paper Enterprise (Qingdao) Co., Ltd. Manufacture, sale and print of
cardboard and cardboard cases
262,600
(US$ 8,000
thousand)
a. (a) 262,600
(US$ 8,000
thousand)
- - 262,600
(US$ 8,000
thousand)
23,900 100.0 23,900
(Note 2)
793,222 -
YFY Paper Enterprise (Nanjing) Co., Ltd. Manufacture, sale and print of
cardboard and cardboard cases
326,904
(US$ 9,959
thousand)
a. (a) 295,425
(US$ 9,000
thousand)
- - 295,425
(US$ 9,000
thousand)
(44,077) 90.0 (39,669)
(Note 2)
226,254 -
YFY Paper Enterprise (Guangzhou) Co., Ltd. Manufacture, sale and print of
cardboard and cardboard cases
311,838
(US$ 9,500
thousand)
a. (a) 246,188
(US$ 7,500
thousand)
- - 246,188
(US$ 7,500
thousand)
12,233 93.8 11,469
(Note 2)
421,945 -
YFY Paper Enterprise (Xiamen) Co., Ltd. Manufacture, sale and print of
cardboard and cardboard cases
213,363
(US$ 6,500
thousand)
a. (a) 213,363
(US$ 6,500
thousand)
- - 213,363
(US$ 6,500
thousand)
(26,480) 100.0 (26,480)
(Note 2)
- -
YFY Paper Enterprise (Zhongshan) Co., Ltd. Manufacture, sale and print of
cardboard and cardboard cases
196,950
(US$ 6,000
thousand)
a. (a) 157,560
(US$ 4,800
thousand)
- - 157,560
(US$ 4,800
thousand)
35,355 100.0 35,355
(Note 2)
752,046 -
(Continued)

- 99 -
Investee Company Main Businesses and Products Paid-in Capital
(Notes 1 and 3)
Method of
Investment
(Note 4)
Accumulated
Outward
Remittance for
Investment from
Taiwan as of
January 1, 2015
(Notes 1 and 3)
Remittance of Funds Accumulated
Outward
Remittance for
Investment from
Taiwan as of
December 31,
2015
(Notes 1 and 3)
Net Income (Loss)
of the Investee
% Ownership of
Direct or Indirect
Investment
Investment
Gain (Loss)
(Note 1)
Carrying
Amount as of
December 31,
2015
(Note 1)
Accumulated
Repatriation of
Investment
Income as of
December 31,
2015
Outward Inward
YFY Paper Enterprise (Jiaxing) Co., Ltd. Manufacture, sale and print of
cardboard and cardboard cases
$ 164,125
(US$ 5,000
thousand)
a. (a) $ 164,125
(US$ 5,000
thousand)
$ - $ - $ 164,125
(US$ 5,000
thousand)
$ (33,150) 100.0 $ (33,150)
(Note 2)
$ 126,300 $ -
YFY Packaging (Yangzhou) Investment Co.,
Ltd.
Investment and holding and paper
trading
876,657
(US$ 26,707
thousand)
a. (a) 886,275
(US$ 27,000
thousand)
- - 886,275
(US$ 27,000
thousand)
(178,979) 100.0 (178,979)
(Note 2)
423,100 -
YFY Paper Mfg. (Yangzhou) Co., Ltd. Production and sale of paper and
cardboard
6,062,613
(US$ 184,695
thousand)
a. (b) 6,072,625
(US$ 185,000
thousand)
- - 6,072,625
(US$ 185,000
thousand)
(1,134,328) 100.0 (1,134,328)
(Note 2)
3,079,081 -
YFY BioTechnology (Kunshan) Co., Ltd. To promote agriculture skills and
operate in trade of agriculture
products
249,470
(US$ 7,600
thousand)
a. (c) 130,315
(US$ 3,970
thousand)
- - 130,315
(US$ 3,970
thousand)
(42,033) - (21,957)
(Note 7)
- -
YFY Paper Mfg. (Jiangyin) Co., Ltd. Manufacture, sale and print of
cardboard and cardboard cases
489,093
(US$ 14,900
thousand)
a. (c) 459,747
(US$ 14,006
thousand)
- - 459,747
(US$ 14,006
thousand)
(87,270) 94.0 (82,034)
(Note 2)
- -
Yuen Foong Yu Blue Economy Natural
Resource (Yangzhou) Co., Ltd.
Development the technology of
agricultural resource recycling
262,600
(US$ 8,000
thousand)
a. (c) 262,600
(US$ 8,000
thousand)
- - 262,600
(US$ 8,000
thousand)
(7,275) 100.0 (7,275)
(Note 2)
222,892 -
YFY Firstpak Packaging (YangZhou) Co.,
Ltd.
General trade 80,880
(RMB 16,000
thousand)
a. (d) - - - - (25,077) 70.0 (17,554)
(Note 2)
33,757 -
YFY Bio Technology (Yangzhou) Co., Ltd. Manufacture, sale and print of
cardboard
15,165
(RMB 3,000
thousand)
a. (d) - - - - (1,703) 49.5 (843)
(Note 2)
6,671 -
Shenzhen Systax Paper Co., Ltd. Sale of paper merchandise and
import/export business
16,176
(RMB 3,200
thousand)
a. (e) - - - - 7,755 100.0 7,755
(Note 2)
73,470 -
Kunshan YFY Advertising and Printing Co.,
Ltd.
To design, produce and act as agent
releasing various domestic
advertising and printing plate cum
98,475
(US$ 3,000
thousand)
a. (f) - - - - (13,096) 100.0 (13,096)
(Note 2)
- -
Shanghai YFY Advertising Printing Co., Ltd. Prepress publications, publications
printing, packaging printing, other
printing, business card printing,
and sale of paper and printing
equipment
10,110
(RMB 2,000
thousand)
a. (g) - - - - (4,780) 51.0 (2,438)
(Note 2)
1,478 -
Arizon RFID Technology (Yangzhou) Co.,
Ltd.
Sale and design RFID products 820,625
(US$ 25,000
thousand)
a. (h) 833,492
(US$ 25,392
thousand)
-
- 833,492
(US$ 25,392
thousand)
226,205 100.0 226,205
(Note 2)
1,606,335 -
Yeon Technologies (Yangzhou) Co., Ltd 40,440
(RMB 8,000
thousand)
a. (i) -
-
- -
2,173 100.0 710
(Note 2)
45,956 -
(Continued)

- 100 -
Investee Company Main Businesses and Products Paid-in Capital
(Notes 1 and 3)
Method of
Investment
(Note 4)
Accumulated
Outward
Remittance for
Investment from
Taiwan as of
January 1, 2015
(Notes 1 and 3)
Remittance of Funds Accumulated
Outward
Remittance for
Investment from
Taiwan as of
December 31,
2015
(Notes 1 and 3)
Net Income (Loss)
of the Investee
% Ownership of
Direct or Indirect
Investment
Investment
Gain (Loss)
(Note 1)
Carrying
Amount as of
December 31,
2015
(Note 1)
Accumulated
Repatriation of
Investment
Income as of
December 31,
2015
Outward Inward
YFY Jupiter (Shenzhen) Ltd. Design and sale of paper $ 4,596
(US$ 140
thousand)
a. (j) $ - $ - $ - $ - $ 46,169 77.2 $ 35,659
(Note 2)
$ 127,058 $ -
Kunshan YFY Jupiter Green Packaging Ltd. Design of packaging and sale of
paper
10,110
(RMB 2,000
thousand)
a. (k) - - - - 16,516 77.2 12,756
(Note 2)
30,599 -
YFY Jupiter Supply Chain Management
Service (Shenzhen) Limited
Design of packaging and sale of
paper
- a. (k) - - - - 16,411 77.2 12,675
(Note 2)
13,136 -
Chengdu JieLianDa Warehousing Co., Ltd. Trading business 7,582
(RMB 1,500
thousand)
a. (k) - - - - (736) 27.0 (199)
(Note 6)
2,145 -
ChengDu JingShiTong Packing Co., Ltd. Trading business 10,110
(RMB 2,000
thousand)
a. (k) - - - - 2,104 27.0 569
(Note 6)
3,792 -
ChengDu YongJunYu Environmental
Protection packing Co., Ltd.
Trading business 10,110
(RMB 2,000
thousand)
a. (k) - - - - 43 27.0 12
(Note 6)
2,570 -
Rimagine Design (Shanghai) Co., Ltd. Photograh 11,482
(EUR 320
thousand)
a. (l) - - - - (12,276) 44.0 (5,404)
(Note 6)
- -
YFY Investment Co., Ltd. Investment and holding and sale of
paper
3,118,375
(US$ 95,000
thousand)
a. (m) 3,118,375
(US$ 95,000
thousand)
- - 3,118,375
(US$ 95,000
thousand)
(294,568) 100.0 (294,568)
(Note 2)
1,345,423 -
YFY Family Care (Kunshan) Co., Ltd. Manufacture and sale of tissue paper
and napkin
984,750
(US$ 30,000
thousand)
a. (n) 984,750
(US$ 30,000
thousand)
- - 984,750
(US$ 30,000
thousand)
8,893 100.0 8,893
(Note 2)
485,515 -
YFY Family Paper (Beijing) Co., Ltd. Manufacture and sale of tissue paper
and napkin
1,148,875
(US$ 35,000
thousand)
a. (n) 1,148,875
(US$ 35,000
thousand)
- - 1,148,875
(US$ 35,000
thousand)
(22,520) 100.0 (22,520)
(Note 2)
517,485 -
Yuen Foong Yu Consumer Products
(Yangzhou) Co., Ltd.
Manufacture and sale of tissue paper
and napkin
984,750
(US$ 30,000
thousand)
a. (n) 984,750
(US$ 30,000
thousand)
- - 984,750
(US$ 30,000
thousand)
42,055 100.0 42,055
(Note 2)
1,038,238 -
Shanghai YFY International Trade Co., Ltd. Trading business 5,055
(RMB 1,000
thousand)
b. (a) - 5,055
(RMB 1,000
thousand)
- 5,055
(RMB 1,000
thousand)
(4,661) 100.0 (4,661)
(Note 2)
432 -
Guangdong Ding Feng Pulp & Paper Co.,
Ltd.
Pulp and paper production, trading
and forestry business
2,810,805
(US$ 85,630
thousand)
a. (o) 722,150
(US$ 22,000
thousand)
- - 722,150
(US$ 22,000
thousand)
163,869 75.0
122,942
(Note 2)
4,038,881 -
(Continued)
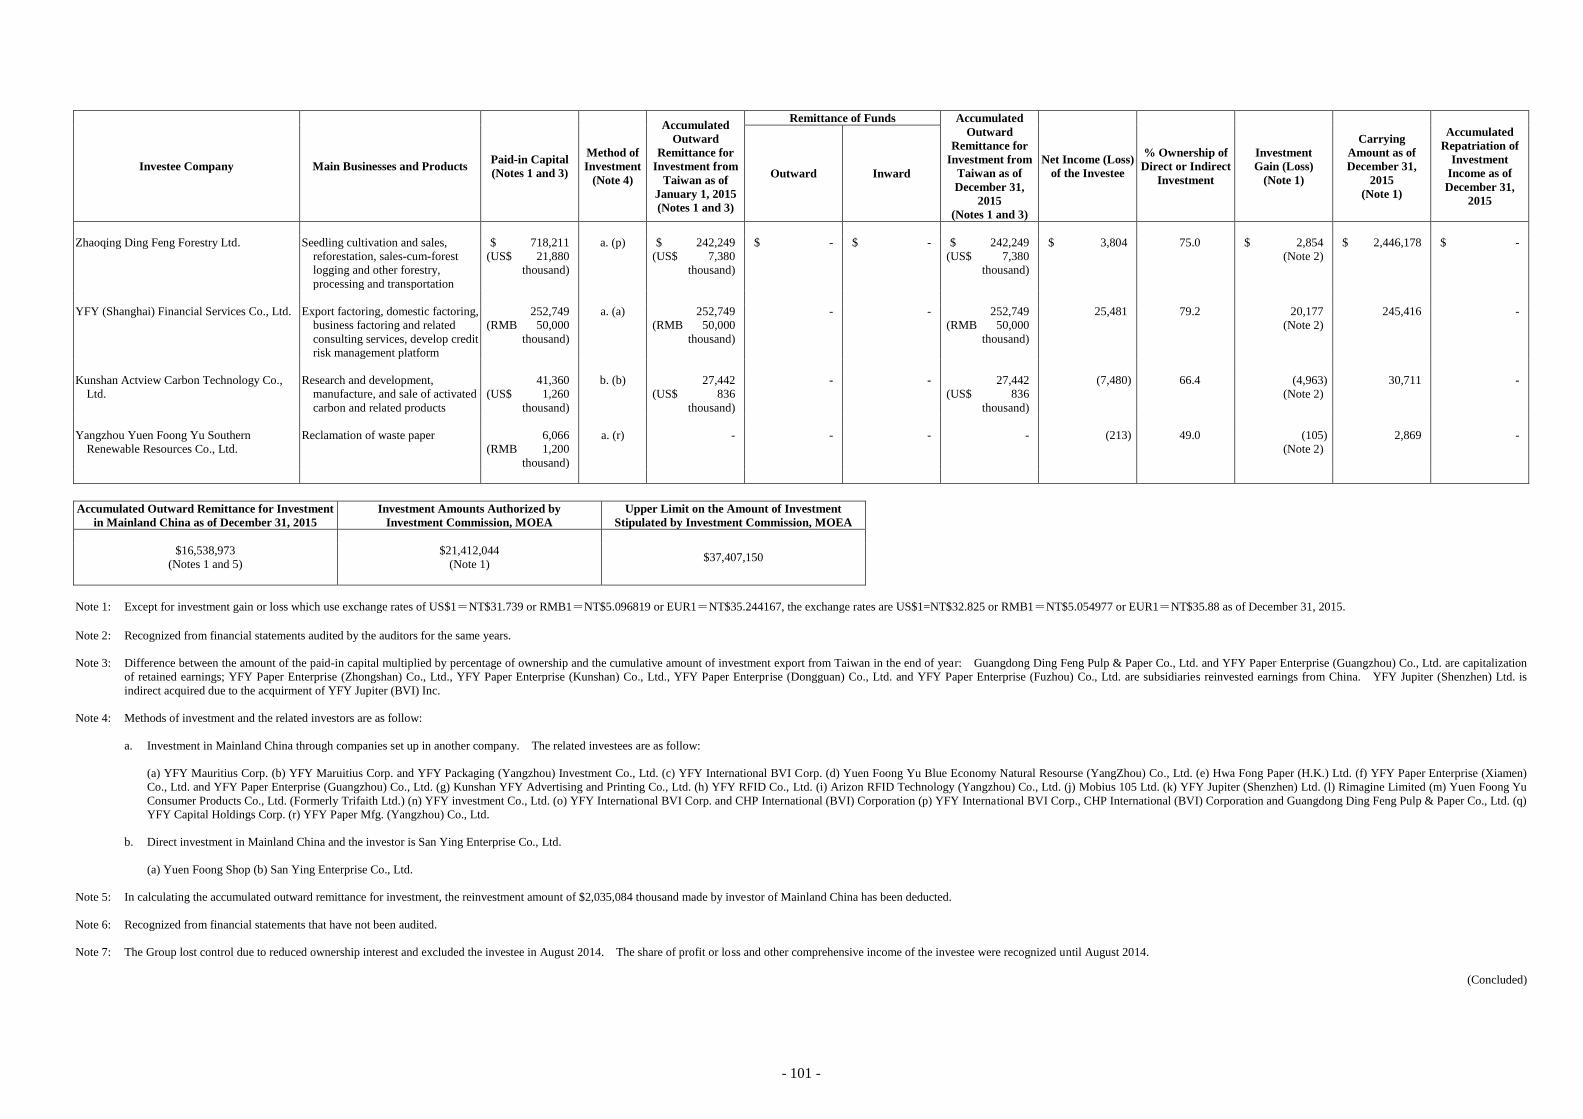
- 101 -
Investee Company Main Businesses and Products Paid-in Capital
(Notes 1 and 3)
Method of
Investment
(Note 4)
Accumulated
Outward
Remittance for
Investment from
Taiwan as of
January 1, 2015
(Notes 1 and 3)
Remittance of Funds Accumulated
Outward
Remittance for
Investment from
Taiwan as of
December 31,
2015
(Notes 1 and 3)
Net Income (Loss)
of the Investee
% Ownership of
Direct or Indirect
Investment
Investment
Gain (Loss)
(Note 1)
Carrying
Amount as of
December 31,
2015
(Note 1)
Accumulated
Repatriation of
Investment
Income as of
December 31,
2015
Outward Inward
Zhaoqing Ding Feng Forestry Ltd. Seedling cultivation and sales,
reforestation, sales-cum-forest
logging and other forestry,
processing and transportation
$ 718,211
(US$ 21,880
thousand)
a. (p) $ 242,249
(US$ 7,380
thousand)
$ - $ - $ 242,249
(US$ 7,380
thousand)
$ 3,804 75.0 $ 2,854
(Note 2)
$ 2,446,178 $ -
YFY (Shanghai) Financial Services Co., Ltd.
Export factoring, domestic factoring,
business factoring and related
consulting services, develop credit
risk management platform
252,749
(RMB 50,000
thousand)
a. (a) 252,749
(RMB 50,000
thousand)
- - 252,749
(RMB 50,000
thousand)
25,481 79.2 20,177
(Note 2)
245,416 -
Kunshan Actview Carbon Technology Co.,
Ltd.
Research and development,
manufacture, and sale of activated
carbon and related products
41,360
(US$ 1,260
thousand)
b. (b) 27,442
(US$ 836
thousand)
- - 27,442
(US$ 836
thousand)
(7,480) 66.4 (4,963)
(Note 2)
30,711 -
Yangzhou Yuen Foong Yu Southern
Renewable Resources Co., Ltd.
Reclamation of waste paper 6,066
(RMB 1,200
thousand)
a. (r) - - - - (213) 49.0 (105)
(Note 2)
2,869 -
Accumulated Outward Remittance for Investment
in Mainland China as of December 31, 2015
Investment Amounts Authorized by
Investment Commission, MOEA
Upper Limit on the Amount of Investment
Stipulated by Investment Commission, MOEA
$16,538,973
(Notes 1 and 5)
$21,412,044
(Note 1) $37,407,150
Note 1: Except for investment gain or loss which use exchange rates of US$1=NT$31.739 or RMB1=NT$5.096819 or EUR1=NT$35.244167, the exchange rates are US$1=NT$32.825 or RMB1=NT$5.054977 or EUR1=NT$35.88 as of December 31, 2015.
Note 2: Recognized from financial statements audited by the auditors for the same years.
Note 3: Difference between the amount of the paid-in capital multiplied by percentage of ownership and the cumulative amount of investment export from Taiwan in the end of year: Guangdong Ding Feng Pulp & Paper Co., Ltd. and YFY Paper Enterprise (Guangzhou) Co., Ltd. are capitalization
of retained earnings; YFY Paper Enterprise (Zhongshan) Co., Ltd., YFY Paper Enterprise (Kunshan) Co., Ltd., YFY Paper Enterprise (Dongguan) Co., Ltd. and YFY Paper Enterprise (Fuzhou) Co., Ltd. are subsidiaries reinvested earnings from China. YFY Jupiter (Shenzhen) Ltd. is
indirect acquired due to the acquirment of YFY Jupiter (BVI) Inc.
Note 4: Methods of investment and the related investors are as follow:
a. Investment in Mainland China through companies set up in another company. The related investees are as follow:
(a) YFY Mauritius Corp. (b) YFY Maruitius Corp. and YFY Packaging (Yangzhou) Investment Co., Ltd. (c) YFY International BVI Corp. (d) Yuen Foong Yu Blue Economy Natural Resourse (YangZhou) Co., Ltd. (e) Hwa Fong Paper (H.K.) Ltd. (f) YFY Paper Enterprise (Xiamen)
Co., Ltd. and YFY Paper Enterprise (Guangzhou) Co., Ltd. (g) Kunshan YFY Advertising and Printing Co., Ltd. (h) YFY RFID Co., Ltd. (i) Arizon RFID Technology (Yangzhou) Co., Ltd. (j) Mobius 105 Ltd. (k) YFY Jupiter (Shenzhen) Ltd. (l) Rimagine Limited (m) Yuen Foong Yu
Consumer Products Co., Ltd. (Formerly Trifaith Ltd.) (n) YFY investment Co., Ltd. (o) YFY International BVI Corp. and CHP International (BVI) Corporation (p) YFY International BVI Corp., CHP International (BVI) Corporation and Guangdong Ding Feng Pulp & Paper Co., Ltd. (q)
YFY Capital Holdings Corp. (r) YFY Paper Mfg. (Yangzhou) Co., Ltd.
b. Direct investment in Mainland China and the investor is San Ying Enterprise Co., Ltd.
(a) Yuen Foong Shop (b) San Ying Enterprise Co., Ltd.
Note 5: In calculating the accumulated outward remittance for investment, the reinvestment amount of $2,035,084 thousand made by investor of Mainland China has been deducted.
Note 6: Recognized from financial statements that have not been audited.
Note 7: The Group lost control due to reduced ownership interest and excluded the investee in August 2014. The share of profit or loss and other comprehensive income of the investee were recognized until August 2014.
(Concluded)
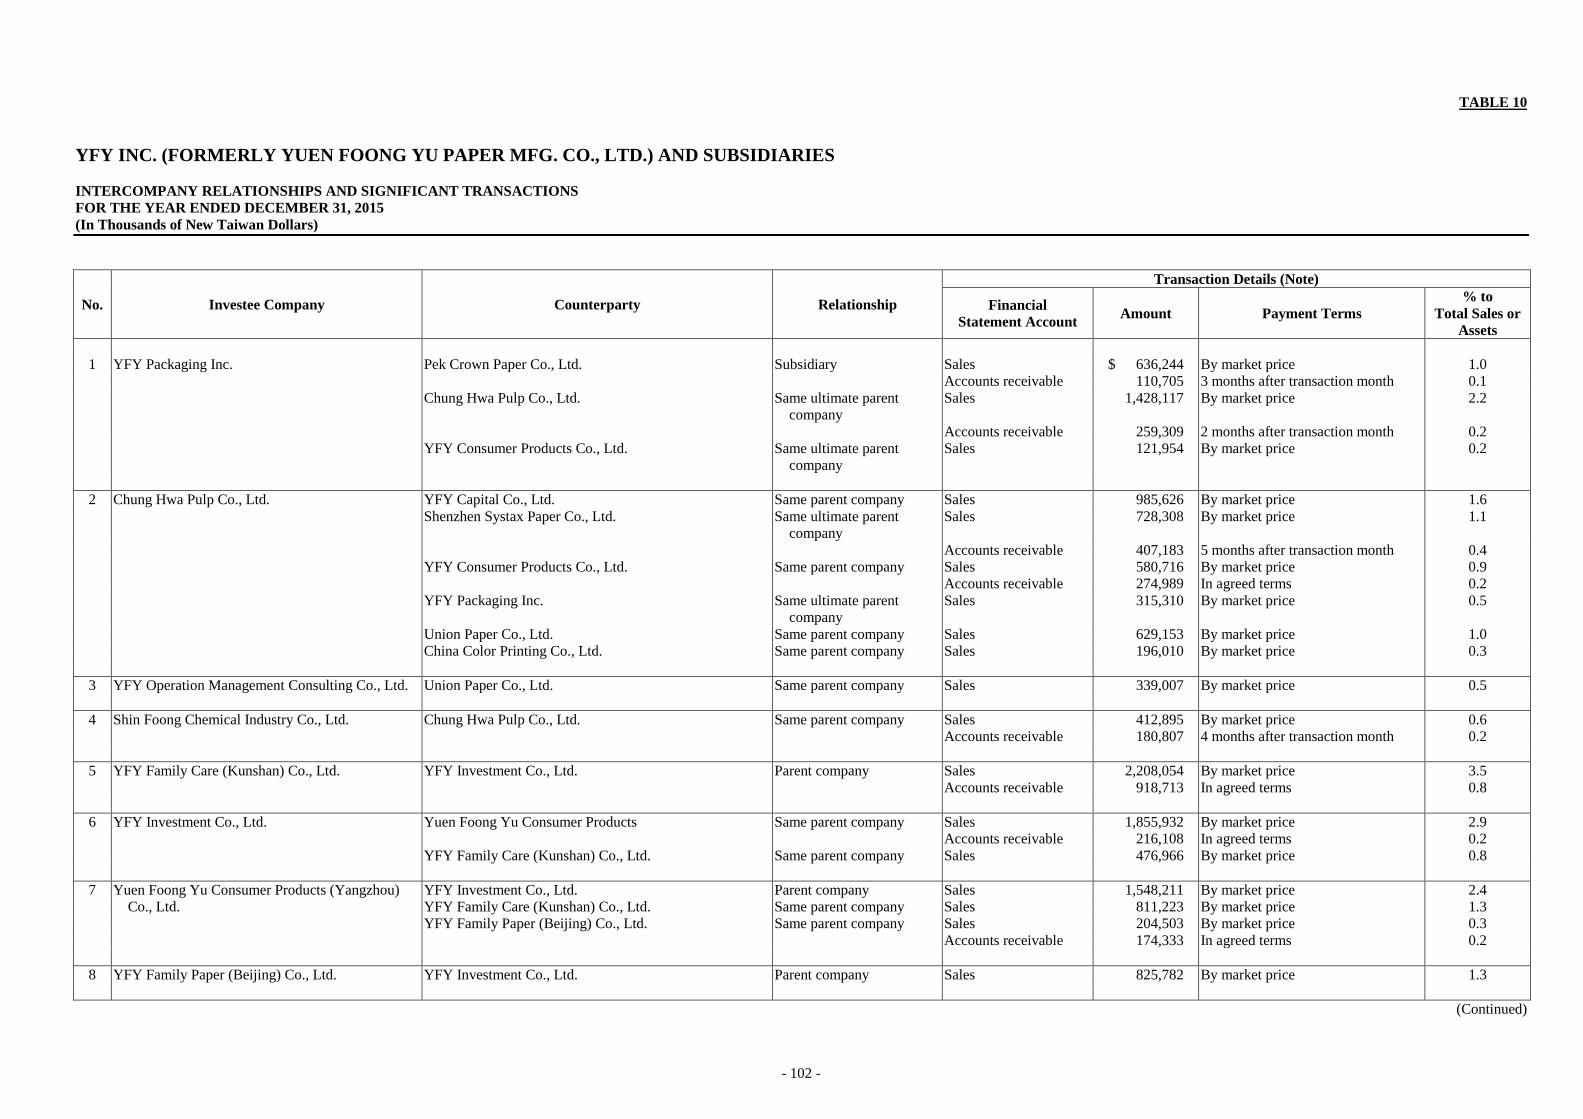
- 102 -
TABLE 10
YFY INC. (FORMERLY YUEN FOONG YU PAPER MFG. CO., LTD.) AND SUBSIDIARIES
INTERCOMPANY RELATIONSHIPS AND SIGNIFICANT TRANSACTIONS
FOR THE YEAR ENDED DECEMBER 31, 2015
(In Thousands of New Taiwan Dollars)
No. Investee Company Counterparty Relationship
Transaction Details (Note)
Financial
Statement Account Amount Payment Terms
% to
Total Sales or
Assets
1 YFY Packaging Inc. Pek Crown Paper Co., Ltd. Subsidiary Sales $ 636,244 By market price 1.0
Accounts receivable 110,705 3 months after transaction month 0.1
Chung Hwa Pulp Co., Ltd. Same ultimate parent
company
Sales 1,428,117 By market price 2.2
Accounts receivable 259,309 2 months after transaction month 0.2
YFY Consumer Products Co., Ltd. Same ultimate parent
company
Sales 121,954 By market price 0.2
2 Chung Hwa Pulp Co., Ltd. YFY Capital Co., Ltd. Same parent company Sales 985,626 By market price 1.6
Shenzhen Systax Paper Co., Ltd. Same ultimate parent
company
Sales 728,308 By market price 1.1
Accounts receivable 407,183 5 months after transaction month 0.4
YFY Consumer Products Co., Ltd. Same parent company Sales 580,716 By market price 0.9
Accounts receivable 274,989 In agreed terms 0.2
YFY Packaging Inc. Same ultimate parent
company
Sales 315,310 By market price 0.5
Union Paper Co., Ltd. Same parent company Sales 629,153 By market price 1.0
China Color Printing Co., Ltd. Same parent company Sales 196,010 By market price 0.3
3 YFY Operation Management Consulting Co., Ltd. Union Paper Co., Ltd. Same parent company Sales 339,007 By market price 0.5
4 Shin Foong Chemical Industry Co., Ltd. Chung Hwa Pulp Co., Ltd. Same parent company Sales 412,895 By market price 0.6
Accounts receivable 180,807 4 months after transaction month 0.2
5 YFY Family Care (Kunshan) Co., Ltd. YFY Investment Co., Ltd. Parent company Sales 2,208,054 By market price 3.5
Accounts receivable 918,713 In agreed terms 0.8
6 YFY Investment Co., Ltd. Yuen Foong Yu Consumer Products Same parent company Sales 1,855,932 By market price 2.9
Accounts receivable 216,108 In agreed terms 0.2
YFY Family Care (Kunshan) Co., Ltd. Same parent company Sales 476,966 By market price 0.8
7 Yuen Foong Yu Consumer Products (Yangzhou) YFY Investment Co., Ltd. Parent company Sales 1,548,211 By market price 2.4
Co., Ltd. YFY Family Care (Kunshan) Co., Ltd. Same parent company Sales 811,223 By market price 1.3
YFY Family Paper (Beijing) Co., Ltd. Same parent company Sales 204,503 By market price 0.3
Accounts receivable 174,333 In agreed terms 0.2
8 YFY Family Paper (Beijing) Co., Ltd. YFY Investment Co., Ltd. Parent company Sales 825,782 By market price 1.3
(Continued)

- 103 -
No. Investee Company Counterparty Relationship
Transaction Details (Note)
Financial
Statement Account Amount Payment Terms
% to
Total Sales or
Assets
9 YFY Cayman Co., Ltd. YFY Paper Mfg. (Yangzhou) Co., Ltd. Same ultimate parent
company
Accounts receivable $ 236,805 2 months after transaction month 0.2
10 YFY (Shanghai) Financial Services Co., Ltd. YFY Firstpak Packaging (Yangzhou) Investment Co., Ltd. Same ultimate parent
company
Accounts receivable 111,930 In agreed terms 0.1
YFY Packaging (Yangzhou) Investment Co., Ltd. Same ultimate parent
company
Accounts receivable 100,373 In agreed terms 0.1
11 YFY Paper Mfg. (Yangzhou) Co., Ltd. YFY Paper Enterprise (Jiaxing) Co., Ltd. Same parent company Sales 211,630 By market price 0.3
YFY Paper Enterprise (Shanghai) Co., Ltd. Same parent company Sales 302,548 By market price 0.5
YFY Paper Enterprise (Suzhou) Co., Ltd. Same parent company Sales 310,927 By market price 0.5
YFY Paper Enterprise (Nanjing) Co., Ltd. Same parent company Sales 311,701 By market price 0.5
YFY Paper Enterprise (Guangzhou) Co., Ltd. Same parent company Sales 125,346 By market price 0.2
YFY Foong Yu Consumer Product (Yangzhou) Co., Ltd. Same parent company Sales 103,233 By market price 0.2
12 YFY Packaging (Yangzhou) Investment Co., Ltd. YFY Paper Mfg. (Yangzhou) Co., Ltd. Same parent company Sales 3,507,203 By market price 5.5
Accounts receivable 657,549 In agreed terms 0.6
YFY Paper Enterprise (Dongguan) Co., Ltd. Same parent company Sales 305,045 By market price 0.5
YFY Paper Enterprise (Xiamen) Co., Ltd. Same parent company Sales 334,091 By market price 0.5
YFY Paper Enterprise (Guangzhou) Co., Ltd. Same parent company Sales 404,400 By market price 0.6
YFY Paper Enterprise (Fuzhou) Co., Ltd. Same parent company Sales 168,569 By market price 0.3
YFY Paper Enterprise (Qingdao) Co., Ltd. Same parent company Sales 205,283 By market price 0.3
YFY Paper Enterprise (Tianjin) Co., Ltd. Same parent company Sales 242,758 By market price 0.4
YFY Paper Enterprise (Zhongshan) Co., Ltd. Same parent company Sales 263,802 By market price 0.4
YFY Paper Enterprise (Nanjing) Co., Ltd. Same parent company Sales 106,581 By market price 0.2
YFY Paper Enterprise (Suzhou) Co., Ltd. Same parent company Sales 140,149 By market price 0.2
YFY Paper Enterprise (Shanghai) Co., Ltd. Same parent company Sales 108,854 By market price 0.2
YFY Paper Enterprise (Jiaxing) Co., Ltd. Same parent company Sales 147,332 By market price 0.2
13 YFY Consumer Products Co., Ltd. Yuen Foong Shop Company Limited Subsidiary Sales 570,615 By market price 0.9
Accounts receivable 119,711 In agreed terms 0.1
14 Eihoyo Shoji Co., Ltd. Chung Hwa Pulp Co., Ltd. Same parent company Sales 290,847 By market price 0.5
15 Ever Growing Agriculture Biotech Co., Ltd. YFY Consumer Products Co., Ltd. Parent company Sales 232,311 By market price 0.4
16 Guangdong Ding Feng Pulp & Paper Co., Ltd. YFY Investment Co., Ltd. Same ultimate parent
Company
Sales 191,867 By market price 0.3
YFY Family Paper (Beijing) Co., Ltd. Same ultimate parent
Company
Sales 123,394 By market price 0.2
17 Zhaoqing Ding Feng Forestry Ltd. Guangdong Ding Feng Pulp & Paper Co., Ltd. Parent company Sales 436,317 By market price 0.7
18 YFY Paper Enterprise (Suzhou) Co., Ltd. YFY Paper Enterprise (Kunshan) Co., Ltd. Same parent company Sales 220,598 By market price 0.3
(Continued)

- 104 -
No. Investee Company Counterparty Relationship
Transaction Details (Note)
Financial
Statement Account Amount Payment Terms
% to
Total Sales or
Assets
19 Union Paper Co., Ltd. Chung Hwa Pulp Co., Ltd. Same ultimate parent
company
Sales $ 168,626 By market price 0.3
20 YFY International BVI Corp. YFY Investment Co., Ltd. Same ultimate parent
company
Accounts receivable 336,910 In agreed terms 0.3
21 San Ying Enterprise Co., Ltd. Union Paper Co., Ltd. Same ultimate parent
company
Sales 100,370 By market price 0.2
Note: In preparing the consolidated financial statements, the transaction has been eliminated.
(Concluded)