yield line theory.pdf
DESCRIPTION
Yield LineTRANSCRIPT

D A N M A R K S
T E K N I S K E
UNIVERSITET
Tim Gudmand-Høyer
Yield line Theory for Concrete Slabs Subjected to Axial Force
Rapport BYG·DTU R-073
2003ISSN 1601-2917
ISBN 87-7877-136-6


Yield line Theory for Concrete Slabs Subjected to Axial Force
Tim Gudmand-Høyer
Deflected form Non-deflected form
um


Tim Gudmand-Høyer
- 1 -
1 Preface
This report is prepared as a partial fulfilment of the requirements for obtaining the Ph.D. degree at
the Technical University of Denmark.
The work has been carried out at the Department of Structural Engineering and Materials, Technical
University of Denmark (BYG•DTU), under the supervision of Professor, dr. techn. M. P. Nielsen.
I would like to thank my supervisor for the valuable advise, for the inspiration and the many and
rewarding discussions and criticism to this work.
Thanks are also due to my co-supervisor M. Sc. Ph.D. Bent Steen Andreasen, RAMBØLL, M. Sc.
Ph.D.-student Karsten Findsen, BYG•DTU, M. Sc. Ph.D.-student Lars Z. Hansen, BYG•DTU, M.
Sc. Ph.D.-student Jakob L. Laugesen, BYG•DTU, M. Sc. Ph.D. Bent Feddersen RAMBØLL and
Architect MAA Søren Bøgh MURO for their engagement and criticism to the present work and my
Ph.D.-project in general.
Finally I would like to thank my wife and family for their encouragement and support.
Lyngby, December 2003
Tim Gudmand-Høyer

Yield line Theory for Concrete Slabs Subjected to Axial Force
- 2 -

Tim Gudmand-Høyer
- 3 -
2 Summary
This paper treats the subject Yield line Theory for Concrete Slabs Subjected to Axial Force.
In order to calculate the load-carrying capacity from an upper bound solution the dissipation has to
be known.
For a slab without axial force the usual way of calculating this dissipation is by using the normality
condition of the theory of plasticity together with the yield condition. This method is equivalent to
the original proposal by K. W. Johansen. This method has shown good agreement with experiments
and has won general acceptance.
In this paper the dissipation in a yield line is calculated on the basis of the Coulomb yield condition
for concrete in order to verify K. W. Johansen’s method. It is found that the calculations lead to the
same results if the axes of rotation are the same for adjacent slab parts. However, this is only true if
the slab is isotropic and not subjected to axial load.
An evaluation of the error made using K. W. Johansen’s proposal for orthotropic rectangular slabs
is made and it is found that the method is sufficiently correct for practical purposes.
For deflected slabs it is known that the load-carrying capacity is higher. If it is assumed that the axis
of rotation corresponds to the neutral axis of a slab part and the dissipation is found from the
moment capacities about these axes K. W. Johansen’s proposal may be used to find the load-
carrying capacity in these cases too. In this paper this is verified by comparing the results with
numerical calculations of the dissipation. Also for deflected slabs it is found that the simplified
method is sufficiently correct for practical purposes.
The same assumptions are also used for rectangular slabs loaded with axial force in both one and
two directions and sufficiently good agreement is found by comparing the methods.
Interaction diagrams between the axial load and the transverse load are developed at the end of the
paper for both methods. Different approaches are discussed.
Only a few comparisons between experiments and theory are made. These indicate that the theory
may be used if a proper effectiveness factor is introduced and the deflection at failure is known.
If the deflection is unknown an estimate of the deflection based on the yield strains of the concrete
and the reinforcement seems to lead to acceptable results.

Yield line Theory for Concrete Slabs Subjected to Axial Force
- 4 -
3 Resume
Denne rapport behandler emnet brudlinieteori for plader belastet med normalkræfter og
tværbelastning.
For at kunne beregne bæreevnen ud fra en øvreværdibetragtning er det nødvendigt at kunne udregne
dissipationen.
Plader uden normalkraft beregnes normalt ud fra plasticitetsteoriens normalitetsbetingelse
kombineret med pladens flydebetingelse. Denne metode er ækvivalent med K. W. Johansens
oprindelige forslag. Denne metode har vist god overensstemmelse med forsøg og er almindeligt
benyttet.
I denne rapport udregnes dissipationen i en brudlinie ud fra dissipationsformlerne for et Coulomb
materiale og dette sammenholdes med K. W. Johansens metode. Af dette fremgår det at resultatet er
det samme hvis rotationsakserne for tilstødende pladedele ligger i samme højde. Dette vil dog kun
være rigtigt for isotrope plader og der er derfor gennemført en vurdering af fejlen ved beregninger
af ortotrope plader. Fejlen vurderes at være uden praktisk betydning.
Det vides at bæreevnen for en plade stiger under udbøjning. Det er her vist at hvis man antager at
rotationsaksen svarer til nullinien for den enkelte pladedel og beregner dissipationen efter K. W.
Johansens fremgangsmåde kan man beregne bæreevnen. Dette er eftervist ved at sammenligne med
numeriske beregninger der baserer sig på dissipationsudtrykkene for et Coulomb materiale.
Beregningerne viser, at afvigelserne er uden praktisk betydning.
Beregninger af plader med normalkraft og udbøjede plader med normalkraft i både en og to
retninger viser tilsvarende god overensstemmelse.
Interaktionsdiagrammer for normal og tværlast behandles til sidst og der gives forskellige bud på
hvordan dette kan gribes an.
Kun ganske få forsøg er her fundet brugbare til verifikation af teorien. Disse data er for kvadratiske
plader med normalkraft i én retning.
Ved sammenligning mellem forsøg og teori er det vist at beregninger med en passende
effektivitetsfaktor giver god overensstemmelse med forsøg hvis man anvender den målte
brududbøjning.
Kendes brududbøjningen ikke kan man tilsyneladende anvende et skøn der baserer sig på
flydetøjningen for beton og armering.

Tim Gudmand-Høyer
- 5 -
4 Table of contents
1 Preface .................................................................................................................... 1
2 Summary................................................................................................................. 3
3 Resume ................................................................................................................... 4
4 Table of contents .................................................................................................... 5
5 Notation .................................................................................................................. 7
6 Introduction ............................................................................................................ 9
7 Theory................................................................................................................... 10
7.1 DISSIPATION IN A YIELD LINE ..............................................................................................10 7.1.1 The contribution from the concrete............................................................................10 7.1.2 The contribution from the reinforcement...................................................................29
7.2 BEAM EXAMPLE ..................................................................................................................30 7.3 SQUARE SLAB WITHOUT AXIAL FORCE ................................................................................33 7.4 RECTANGULAR SLABS WITH AXIAL FORCE ..........................................................................44 7.5 RECTANGULAR SLABS WITH AXIAL FORCE AND WITH DEFLECTION .....................................55 7.6 INTERACTION CURVES.........................................................................................................79
8 Theory compared with tests.................................................................................. 89
9 Conclusion ............................................................................................................ 97
10 Literature ........................................................................................................... 98
11 Appendix ........................................................................................................... 99
11.1.1 Results of calculations for different slabs ..................................................................99 11.2 CALCULATIONS OF THE COMPRESSION DEPTH ...................................................................103

Yield line Theory for Concrete Slabs Subjected to Axial Force
- 6 -

Tim Gudmand-Høyer
- 7 -
5 Notation
The most commonly used symbols are listed below. Exceptions from the list may appear, but this
will then be noted in the text in connection with the actual symbol.
Geometry
h Height of a cross-section
A Area of a cross-section
Ac Area of a concrete cross-section
As Area of reinforcement close to the bottom face
As’ Area of reinforcement close to the top face
Asc Area of reinforcement in compression
hc Distance from the bottom face to the centre of the bottom reinforcement
hc’ Distance from the top face to the centre of the top reinforcement
y0 Compression depth
L Length of an element
Lx,Ly Length of a slab in the x and y direction, respectively
e Eccentricity
u Deflection
um Deflection in the mid section
x, y, z Cartesian coordinates
Physics
ε Strain
σ Stress
σc Stress in concrete
fc Compressive strength of concrete
fy Yield strength of reinforcement
ρ Reinforcement ratio
Φ0 Degree of Reinforcement
Φ0x, Φ0y Degree of Reinforcement in the x and y direction, respectively
p Line load, uniform load per unit length

Yield line Theory for Concrete Slabs Subjected to Axial Force
- 8 -
q Surface load, uniform load per area unit
mp yield moment in pure bending
mpx,mpy yield moment in pure bending in the x and y direction, respectively
mf yield moment for a given axial load
mfx,mfy yield moment for a given axial load in the x and y direction, respectively
n Axial load per unit length
nx,ny Axial load per unit length in the x and y direction, respectively
Wi,We internal and external work, respectively
Wc,Ws concrete and reinforcement contribution to the dissipation, respectively

Tim Gudmand-Høyer
- 9 -
6 Introduction
This paper has two main purposes.
The first one is to investigate the possibility of calculating the load-carrying capacity of a slab in a
simplified way based on an interpretation of K. W. Johansen´s proposal regarding the dissipation
and C. R. Calladine´s proposal regarding the axes of rotation.
The second purpose is to investigate the possibility of finding a calculation method for the relation
between axial load-carrying capacity and lateral load-carrying capacity.
In order to determine the load-carrying capacity for slabs by using an upper bound approach the
dissipation in a yield line has to be found.
In section 7.1 the contribution from the concrete and the reinforcement are found separately. In both
cases formulas for the dissipation are developed for all possible yield lines starting in a corner,
followed by the formulas for the special case of a right-angled corner.
Section 7.2 treats beams. This illustrates the basic problems in these calculations.
The following sections (7.3 to 7.5) treat different cases of rectangular slabs starting with the square
slab without axial force and initial deflection and ending up with rectangular slabs with axial force
and initial deflections.
In section 7.6 a conservative proposal for an interaction curve between the axial load and the
transverse load is given.
In chapter 8 test results are compared with theory.
Finally conclusions are made in chapter 9.

Yield line Theory for Concrete Slabs Subjected to Axial Force
- 10 -
7 Theory
7.1 Dissipation in a yield line
If the axes of rotation for two slab parts are not at the same depth measured from the slab surface,
the relative displacement discontinuity is no longer perpendicular to the yield line. The angle
between the displacement discontinuity and the yield line changes with the depth from the slab
surface and this must be taken into account when calculating the dissipation.Equation Section 7
Axi
s of r
otat
ion
for s
lab
II
Axis of rotation for slab I
u
v w w-v
x
y
II
I
z hII
z hI
u uI=ωI(hI-z)
uII=ωII(hII-z)
w
-αII
I( )2
w vπ − −
2vπ −
w
Figure 7.1. Displacement for two slab parts.
7.1.1 The contribution from the concrete
The concrete dissipation in the yield line may be calculated from the dissipation formulas for plane
stress assuming a modified Coulomb material. Setting the tensile strength of concrete to zero, the
contribution to the dissipation (per unit length) from the concrete may be calculated as:
( )( )0
1 1 sin2
h
c cW f u dzα= −∫ (7.1)
u being the relative displacement and α the angle between the displacement and the yield line.
Formula for plane stress has been used, see [5].
Both u and α depends on z, which is the depth from the top surface to the point considered. uI and
uII are the displacements of slab part I and II, respectively. Depending on whether the displacements
uI and uII are positive or not, α and u has to be calculated from one of the following cases:

Tim Gudmand-Høyer
- 11 -
Case 1:
u uI
uII
-αuI>0 & uII>0
( )2 2 2 cosI II I IIu u u u u wπ= + − − (7.2)
2 2 2
cos2 2
II I
II
u u uv Arcu u
πα + −= − + −
(7.3)
Case 2:
u -uI
uII
-αuI<0 & uII>0
( ) ( )2 2 2 cosI II I IIu u u u u w= + − − (7.4)
( )22 2
cos2 2
II I
II
u u uv Arc
u uπα + − − = − + +
(7.5)
Case 3:
u uI
-uII
αuI>0 & uII<0
( )2 2 2 cosI II I IIu u u u u wπ= + − − (7.6)
2 2 2
cos2 2
II I
II
u u uv Arcu u
πα + −= − − −
(7.7)

Yield line Theory for Concrete Slabs Subjected to Axial Force
- 12 -
Case 4:
u -uI
-uII α
uI<0 & uII<0
( )2 2 2 cosI II I IIu u u u u wπ= + − − (7.8)
( )22 2
cos2 2
II I
II
u u uv Arc
u uπα
+ − −= − +
− (7.9)
It is seen that the calculation of u is the same in all the cases and u may in general be calculated as:
( )2 2 2 cosI II I IIu u u u u w= + + (7.10)
The angle between the displacement and the yield line α varies with respect to uI and uII depending
on whether they are positive or negative.
The relation between the two rotations about I and II may be found from the geometrical conditions
demanding the same displacement at a point of the yield line.
( )sinII vδω =
( )sinI w vδω =
−
• δ
vw w-v
x
y
III
sin(w-v) 1
sin(v)
1δω =
II
I
Figure 7.2. Geometrical relation between the rotations.
It appears from Figure 7.2 that the rotations may be calculated as
( )
( )
sin
sin
I
II
w v
v
ωω
ωω
=−
= (7.11)
Here ω is the rotation of slab part line about an axis along to the yield line.

Tim Gudmand-Høyer
- 13 -
In the calculation of the displacement it is assumed that the rotation is small and the displacement
may therefore be calculated as the rotation multiplied with the height. The displacements uI, uII and
u may be calculated as
( )
( )
sin
1sin
II
I I
h zu hw v h h
u h zh w v h h
ω
ω
= − ⇔ −
= − −
(7.12)
( )
( )
sin
1sin
IIII
II II
h zu hv h h
u h zh v h h
ω
ω
= − ⇔
= −
(7.13)
Inserting (7.12) and (7.13) into (7.10) leads to:
( ) ( )
( ) ( ) ( )
( ) ( )
2 2
2 2
sin sin
2 cossin sin
2
sin sin
I II
I II
I II I
h hz zh hw v h h v h h
uh hz zh h w
w v h h v h h
h h hz z zu h h h h h h
h w v v
ω ω
ω ω
ω
− + − − = ⇔ + − − −
− − − = + +−
( )( ) ( )
cos
sin sin
IIh z wh h
w v v
−
−
(7.14)
The angle α may be calculated as:
Case 1(uI>0 & uII>0):
2 2 2
cos2 2
II I
II
u u uv Arcu u
πα + −= − + −
(7.15)
Case 2 (uI<0 & uII>0):
( )22 2
cos2 2
II I
II
u u uv Arc
u uπα + − − = − + +
(7.16)
Case 3 (uI>0 & uII<0):
2 2 2
cos2 2
II I
II
u u uv Arcu u
πα + −= − − −
(7.17)
Case 4 (uI<0 & uII<0):
( )22 2
cos2 2
II I
II
u u uv Arc
u uπα
+ − −= − +
− (7.18)

Yield line Theory for Concrete Slabs Subjected to Axial Force
- 14 -
It is seen that the contribution to the dissipation from the concrete is a function of both the position
of the axes of rotation hI, hII, the depth h, the rotation ω and the compressive strength fc. The
dissipation may be calculated in a dimensionless form as:
( )( )1
2 0
1 1 sin2
c
c
W u zdh f h h
αω
= −∫ (7.19)
A general analytical expression has not been found. However, for the special case of right-angled
corners (w=π/2) the dissipation becomes:
( ) ( )
( ) ( ) ( ) ( )
( ) ( ) ( ) ( )
( ) ( )
2
2 22 2 2 2
2 22 2 2 2
2 2
14sin cos
-1 2 sin cos sin cos
1 - 2 cos - 2 sin 1- sin - cos
- sin - coslog
c
c
I II I II
II II I I I II
I II
Wh f v v
h h h hv v v vh h h h
h h h h h hv v v vh h h h h h
h hv vh h
ω= ⋅
+ + + +
+ + +
++
( ) ( )
( ) ( ) ( ) ( )
( ) ( )( )
2 22 2
2 22 2 2 2
2 22 4
sin cos
1- sin - cos 1 - 2 cos - 2 sin
2 - - cos - cos
I II
I II II II I I
I II I II
h hv vh h
h h h h h hv v v vh h h h h h
h h h h v vh h h h
+
+ + + ⋅
(7.20)
This expression is found from integrating by parts over the interval in which the expressions for α
are valid. Distinctions must be made whether h1 is larger than h2 and whether these are larger than
h. As an example it is seen that if h1<h2 and h2>h the formula becomes:
( )( ) ( )( )1
1
1
1 22 0
1 11 sin 1 sin2 2
hccase caseh
c
W u z u zd dh f h h h h
α αω
= − + −∫ ∫ (7.21)
Fortunately all the combinations of h1, h2 and h lead to the result given in (7.20).
Plots of results of calculations for hII/h =0.5 w=0.5π and v=0.25π may be seen in Figure 7.1 to
Figure 7.6.
These plots show which case has to be used in the calculation, how the different parts in the
function (7.19) depends on the height and finally the function it self.

Tim Gudmand-Høyer
- 15 -
1 1.5 2 2.5 3 3.5 40
0.1
0.2
0.3
0.4
0.5
0.6
0.7
0.8
0.9
1
caseno
z/h
hI/h=0 h
II/h=1/2 w=1/2π v=1/4π
hI/h=1/8 h
II/h=1/2 w=1/2π v=1/4π
hI/h=1/4 h
II/h=1/2 w=1/2π v=1/4π
hI/h=1/2.6667 h
II/h=1/2 w=1/2π v=1/4π
hI/h=1/2 h
II/h=1/2 w=1/2π v=1/4π
Figure 7.3. z/h as a function of the case no.
0 0.5 1 1.5 20
0.1
0.2
0.3
0.4
0.5
0.6
0.7
0.8
0.9
1
1-sin(α)
z/h
hI/h=0 h
II/h=1/2 w=1/2π v=1/4π
hI/h=1/8 h
II/h=1/2 w=1/2π v=1/4π
hI/h=1/4 h
II/h=1/2 w=1/2π v=1/4π
hI/h=1/2.6667 h
II/h=1/2 w=1/2π v=1/4π
hI/h=1/2 h
II/h=1/2 w=1/2π v=1/4π
Figure 7.4. z/h as a function of 1-sin(α).
Case no

Yield line Theory for Concrete Slabs Subjected to Axial Force
- 16 -
0 0.2 0.4 0.6 0.8 1 1.2 1.4 1.60
0.1
0.2
0.3
0.4
0.5
0.6
0.7
0.8
0.9
1
u/(hω)
z/h
hI/h=0 h
II/h=1/2 w=1/2π v=1/4π
hI/h=1/8 h
II/h=1/2 w=1/2π v=1/4π
hI/h=1/4 h
II/h=1/2 w=1/2π v=1/4π
hI/h=1/2.6667 h
II/h=1/2 w=1/2π v=1/4π
hI/h=1/2 h
II/h=1/2 w=1/2π v=1/4π
Figure 7.5. z/h as a function of u/(hω).
0 0.5 1 1.5 20
0.1
0.2
0.3
0.4
0.5
0.6
0.7
0.8
0.9
1
∆W =u/(hω)(1-sin(α))
z/h
hI/h=0 h
II/h=1/2 w=1/2π v=1/4π
hI/h=1/8 h
II/h=1/2 w=1/2π v=1/4π
hI/h=1/4 h
II/h=1/2 w=1/2π v=1/4π
hI/h=1/2.6667 h
II/h=1/2 w=1/2π v=1/4π
hI/h=1/2 h
II/h=1/2 w=1/2π v=1/4π
Figure 7.6. z/h as a function of ∆W.
As expected, most of the contribution to the dissipation is from the top (z/h is small).

Tim Gudmand-Høyer
- 17 -
Plots of results of calculations for hII/h =0 w=0.5π and v=0.25π may be seen in Figure 7.7 to Figure
7.10.
3 3.2 3.4 3.6 3.8 40
0.1
0.2
0.3
0.4
0.5
0.6
0.7
0.8
0.9
1
caseno
z/h
hI/h=0 h
II/h=1/Inf w=1/2π v=1/4π
hI/h=1/8 h
II/h=1/Inf w=1/2π v=1/4π
hI/h=1/4 h
II/h=1/Inf w=1/2π v=1/4π
hI/h=1/2.6667 h
II/h=1/Inf w=1/2π v=1/4π
hI/h=1/2 h
II/h=1/Inf w=1/2π v=1/4π
Figure 7.7. z/h as a function of the case no.
0 0.5 1 1.5 20
0.1
0.2
0.3
0.4
0.5
0.6
0.7
0.8
0.9
1
1-sin(α)
z/h
hI/h=0 h
II/h=1/Inf w=1/2π v=1/4π
hI/h=1/8 h
II/h=1/Inf w=1/2π v=1/4π
hI/h=1/4 h
II/h=1/Inf w=1/2π v=1/4π
hI/h=1/2.6667 h
II/h=1/Inf w=1/2π v=1/4π
hI/h=1/2 h
II/h=1/Inf w=1/2π v=1/4π
Figure 7.8. z/h as a function of 1-sin(α).

Yield line Theory for Concrete Slabs Subjected to Axial Force
- 18 -
0 0.5 1 1.5 20
0.1
0.2
0.3
0.4
0.5
0.6
0.7
0.8
0.9
1
u/(hω)
z/h
hI/h=0 h
II/h=1/Inf w=1/2π v=1/4π
hI/h=1/8 h
II/h=1/Inf w=1/2π v=1/4π
hI/h=1/4 h
II/h=1/Inf w=1/2π v=1/4π
hI/h=1/2.6667 h
II/h=1/Inf w=1/2π v=1/4π
hI/h=1/2 h
II/h=1/Inf w=1/2π v=1/4π
Figure 7.9. z/h as a function of u/(hω).
0 0.2 0.4 0.6 0.8 1 1.2 1.40
0.1
0.2
0.3
0.4
0.5
0.6
0.7
0.8
0.9
1
∆W =u/(hω)(1-sin(α))
z/h
hI/h=0 h
II/h=1/Inf w=1/2π v=1/4π
hI/h=1/8 h
II/h=1/Inf w=1/2π v=1/4π
hI/h=1/4 h
II/h=1/Inf w=1/2π v=1/4π
hI/h=1/2.6667 h
II/h=1/Inf w=1/2π v=1/4π
hI/h=1/2 h
II/h=1/Inf w=1/2π v=1/4π
Figure 7.10. z/h as a function of ∆W.
In the case where one of the axes of rotation is in the top face it is seen that the main contribution is
from the top of the slab.

Tim Gudmand-Høyer
- 19 -
A plot of the dimensionless dissipation contribution from the concrete is shown as a function of hI/h
and hII/h for w=0.5π and w=0.25π in Figure 7.11 and Figure 7.12.
These values are found from numerical integration over the depth of the section.
00.5
10 0.2 0.4 0.6 0.8 1
0
0.2
0.4
0.6
0.8
1
1.2
1.4
0.50.4
hI/h
0.30.60.50.7
0.2
0.80.40.3
0.90.6
0.10.5
Wc/(h2ωfc) for w=1/2π v=1/4π
0.7
0.2
hII/h
0.30.40.1
0.60.5
0.20.30.40.5
Wc/(h
2 ωf c)
Figure 7.11. Surface and contour plot of the dimensionless dissipation contribution from the concrete.
0 0.2 0.4 0.6 0.8 10
0.1
0.2
0.3
0.4
0.5
0.6
0.7
0.8
0.9
1
hI/h
h II/h
Wc/(h2ωfc) for w=1/2π v=1/4π
0.1
0.1
0.20.2
0.2
0.3
0.3
0.3
0.40.4
0.4
0.4
0.5
0.5
0.5
0.5
0.6
0.6
0.6
0.6
0.7
0.70.8
0.9
Figure 7.12Contour plot of the dimensionless dissipation contribution from the concrete.

Yield line Theory for Concrete Slabs Subjected to Axial Force
- 20 -
It appears that the actual calculations are somewhat comprehensive and a simplification is therefore
desirable.
K. W. Johansen, see [1], proposed that the bending moment in a section perpendicular to the yield
line may be calculated as if the principal directions were coinciding with the directions of the
reinforcement. The agreement between the yield condition and K. W. Johansen’s proposal has been
demonstrated by M. P. Nielsen in [5].
If a similar relation is valid for the dissipation, the dissipation contribution from the concrete might
be calculated from the rotation about the axis, assuming a displacement perpendicular to the axis of
rotation. This may be calculated quite easily since only the compression zone contributes to the
dissipation and the displacement is perpendicular to the axis of rotation. In this case
( )( )
( )
( )( )( ) ( ) ( )
_ . . 0
_ . . 0 0
_ . . 0 0
_ . . 0 0
1 1 sin21 12cos - 2cos( )2 2
cos cos( )
cos cos( )sin sin
I II
I II
I II
h
c K W J c
h h
c K W J c I c II
h h
c K W J c I II
h hI II
c K W J c
W f u dz
W f u w v dz f u v dz
W f u w v dz u v dz
h hz zW f h w v dz h v dzw v h h v h h
α
ω ω
= −
= +
= − +
= − − + − −
∫
∫ ∫
∫ ∫
∫ ∫
( )( ) ( )( )( ) ( )
( )
_ . . 0 0
_ . . 0 0
22
_ . .
cos cos( )sin sin
cos cos( )sin sin
1 1 12 tan
I II
L II
h hI II
c K W J c
h hI II
c K W J c
Ic K W J c
w v h hz v zW h f dz dzw v h h v h h
w v h hz v zW h f dz dzw v h h v h h
hW h fh w v
ω
ω
ω
− = − + − − − = − + − −
= + −
∫ ∫
∫ ∫
( )2 1
2 tanIIhh v
(7.22)
A numerical comparison between the simplified calculation and the theoretical one may be seen in
Figure 7.13 to Figure 7.18 along with the deviation. These plots illustrate how large the difference
is and how it depends on the position of the axis of rotation. They are made for different values for
v in order to illustrate the influence of such a variation.

Tim Gudmand-Høyer
- 21 -
0 0.2 0.4 0.6 0.8 10
0.1
0.2
0.3
0.4
0.5
0.6
0.7
0.8
0.9
1
hI/h
h II/h
Wc/(h2ωfc) for w=1/2π v=1/4π
0.1
0.1
0.20.2
0.2
0.30.3
0.3
0.40.4
0.4
0.4
0.5
0.5
0.5
0.5
0.6
0.6
0.6
0.6
0.7
0.70.8
0.9
0.1
0.1
0.2
0.2
0.2
0.3
0.3
0.3
0.4
0.4
0.4
0.4
0.50.5
0.5
0.5
0.6
0.6
0.6
0.7
0.70.8
0.9TheoreticalK.W.J. Simplification
Figure 7.13 Contour plot of the dimensionless dissipation contribution from the concrete
0 0.2 0.4 0.6 0.8 10
0.1
0.2
0.3
0.4
0.5
0.6
0.7
0.8
0.9
1
hI/h
h II/h
(Wc K.W.J.-Wc)/Wc for w=1/2π v=1/4π
-0.3
-0.3
-0.2
-0.2
-0.2-0.2
-0.1
-0.1
-0.1
-0.1
-0.1
-0.10
0
0
0
0
0
0
00.1
Figure 7.14. Deviation plot for the two calculation methods.

Yield line Theory for Concrete Slabs Subjected to Axial Force
- 22 -
0 0.2 0.4 0.6 0.8 10
0.1
0.2
0.3
0.4
0.5
0.6
0.7
0.8
0.9
1
hI/h
h II/h
Wc/(h2ωfc) for w=1/2π v=1/6π
0.20.2
0.2
0.40.4
0.40.4 0.6
0.60.60.8
0.80.8 11
0.2
0.20.2
0.4
0.40.4 0.6
0.60.6 0.8
0.80.8 1Theoretical
K.W.J. Simplification
Figure 7.15 Contour plot of the dimensionless dissipation contribution from the concrete
0 0.2 0.4 0.6 0.8 10
0.1
0.2
0.3
0.4
0.5
0.6
0.7
0.8
0.9
1
hI/h
h II/h
(Wc K.W.J.-Wc)/Wc for w=1/2π v=1/6π
-0.3-0.3
-0.2 -0.2
-0.2
-0.2
-0.1
-0.1
-0.1
-0.1
-0.1
-0.1
0
0
0
0
0
0
0
0
0.1
Figure 7.16. Deviation plot for the two calculation methods.

Tim Gudmand-Høyer
- 23 -
0 0.2 0.4 0.6 0.8 10
0.1
0.2
0.3
0.4
0.5
0.6
0.7
0.8
0.9
1
hI/h
h II/h
Wc/(h2ωfc) for w=1/2π v=1/12π
0.2 0.2
0.2
0.4
0.40.4 0.6
0.60.60.8
0.80.8 111
1.21.21.21.41.41.41.61.61.6
1.81.81.8
0.20.20.2
0.40.40.4
0.60.60.60.80.80.8111
1.21.21.21.41.41.4 1.61.61.6
1.81.81.8 TheoreticalK.W.J. Simplification
Figure 7.17 Contour plot of the dimensionless dissipation contribution from the concrete
0 0.2 0.4 0.6 0.8 10
0.1
0.2
0.3
0.4
0.5
0.6
0.7
0.8
0.9
1
hI/h
h II/h
(Wc K.W.J.-Wc)/Wc for w=1/2π v=1/12π
-0.4-0.4
-0.3-0.3
-0.3
-0.2
-0.2
-0.2
-0.1
-0.1
-0.1
0
0
0
0
0
0
00.1
Figure 7.18. Deviation plot for the two calculation methods.
It appears that the simplification underestimates the dissipation if w=1/2π. The underestimation is
large where the difference between hI/h and hII/h is large. Furthermore, it also appears that an
increasing difference between v and π/4 leads to a larger underestimation.

Yield line Theory for Concrete Slabs Subjected to Axial Force
- 24 -
The influence of w has also been studied and the following conclusions may be made:
If w is larger than 1/2π the simplification underestimates the dissipation as seen in Figure 7.19 to
Figure 7.20
If w is less than 1/2π the simplification overestimates the dissipation as seen in Figure 7.21 to
Figure 7.24.
If w is very small the overestimation becomes quite significant as seen in Figure 7.25 and Figure
7.26.
These figures (Figure 7.19 to Figure 7.26) are illustrative representations of the different situations
where w is larger or smaller than 1/2π.
0 0.2 0.4 0.6 0.8 10
0.1
0.2
0.3
0.4
0.5
0.6
0.7
0.8
0.9
1
hI/h
h II/h
Wc/(h2ωfc) for w=1/1.3333π v=1/2.6667π
0.1
0.1
0.1
0.2
0.2
0.2
0.2
0.3
0.30.3
0.3
0.3
0.4
0.4
0.4
0.05
0.05
0.1
0.1
0.1
0.15
0.15
0.15
0.15
0.2
0.2
0.2
0.2
0.25
0.25
0.3
0.3 0.35TheoreticalK.W.J. Simplification
Figure 7.19 Contour plot of the dimensionless dissipation contribution from the concrete

Tim Gudmand-Høyer
- 25 -
0 0.2 0.4 0.6 0.8 10
0.1
0.2
0.3
0.4
0.5
0.6
0.7
0.8
0.9
1
hI/h
h II/h
(Wc K.W.J.-Wc)/Wc for w=1/1.3333π v=1/2.6667π
-0.7
-0.7-0.7
-0.6
-0.6
-0.6
-0.6-0.6
-0.6
-0.5
-0.5
-0.5
-0.5
-0.5
-0.5
-0.4
-0.4
-0.4
-0.4
-0.4
-0.4
-0.3
-0.3
-0.3
-0.3
-0.3
-0.3
-0.2
-0.2
-0.2
-0.2
-0.2
-0.2
-0.2
-0.1
-0.1
-0.1
-0.1
-0.1
-0.1
Figure 7.20. Deviation plot for the two calculation methods.
0 0.2 0.4 0.6 0.8 10
0.1
0.2
0.3
0.4
0.5
0.6
0.7
0.8
0.9
1
hI/h
h II/h
Wc/(h2ωfc) for w=1/4π v=1/8π
0.5
0.5
0.5
1
1
1
1
1.5
1.52
0.5
0.5
0.5
1
1
1
1
1.5
1.5 2TheoreticalK.W.J. Simplification
Figure 7.21 Contour plot of the dimensionless dissipation contribution from the concrete

Yield line Theory for Concrete Slabs Subjected to Axial Force
- 26 -
0 0.2 0.4 0.6 0.8 10
0.1
0.2
0.3
0.4
0.5
0.6
0.7
0.8
0.9
1
hI/h
h II/h
(Wc K.W.J.-Wc)/Wc for w=1/4π v=1/8π
0.05
0.050.05
0.05
0.05
0.1
0.1
0.1
0.1
0.1
0.1
0.15
0.15
0.15
0.15
0.15
0.15
0.2
0.2
0.2
0.2
0.2
0.2
0.25
0.250.25
0.25
0.25
0.30.3
0.3
0.3
0.350.35
0.35
0.4
0.4
Figure 7.22. Deviation plot for the two calculation methods.
0 0.2 0.4 0.6 0.8 10
0.1
0.2
0.3
0.4
0.5
0.6
0.7
0.8
0.9
1
hI/h
h II/h
Wc/(h2ωfc) for w=1/4π v=1/16π
0.5
0.5
0.51
1
11 1.5
1.5
1.5
2
2
22
2.5
2.5 3
0.50.5
0.5
1
1
11
1.5
1.51.5
222
2.5
2.52.5 3Theoretical
K.W.J. Simplification
Figure 7.23 Contour plot of the dimensionless dissipation contribution from the concrete

Tim Gudmand-Høyer
- 27 -
0 0.2 0.4 0.6 0.8 10
0.1
0.2
0.3
0.4
0.5
0.6
0.7
0.8
0.9
1
hI/h
h II/h
(Wc K.W.J.-Wc)/Wc for w=1/4π v=1/16π
0.20.2
0.20.2
0.4
0.40.4
0.60.6
0.60.8
0.8 1
Figure 7.24. Deviation plot for the two calculation methods.
0 0.2 0.4 0.6 0.8 10
0.1
0.2
0.3
0.4
0.5
0.6
0.7
0.8
0.9
1
hI/h
h II/h
Wc/(h2ωfc) for w=1/16π v=1/32π
2
2
2
2
4
4
4
6
6
8
2
2
2
4
4
4
4
6
6
68Theoretical
K.W.J. Simplification
Figure 7.25 Contour plot of the dimensionless dissipation contribution from the concrete

Yield line Theory for Concrete Slabs Subjected to Axial Force
- 28 -
0 0.2 0.4 0.6 0.8 10
0.1
0.2
0.3
0.4
0.5
0.6
0.7
0.8
0.9
1
hI/h
h II/h
(Wc K.W.J.-Wc)/Wc for w=1/16π v=1/32π
0.1
0.1
0.10.1
0.1
0.1
0.2
0.2
0.20.2
0.2
0.2
0.3
0.3
0.30.3
0.3
0.3
0.4
0.4
0.4
0.40.4
0.4
0.5
0.5
0.50.5
0.50.6
0.60.6
0.6
0.6
0.70.7
0.7
0.7
0.80.8
0.8
Figure 7.26. Deviation plot for the two calculation methods.
It appears that the formula proposed by K. W. Johansen is not accurate if w derivates significantly
from π/2. However, this does not necessarily mean that this way of calculating leads to a similar
over- and underestimations when calculating the load-carrying capacity of a slab since concrete
dissipation is only a part of the dissipation.
One of the most common situations is a yield line starting from a right-angled corner and the
formulas for this particular situation is therefore found. In these cases the following formula is
valid:

Tim Gudmand-Høyer
- 29 -
( ) ( )
( ) ( ) ( ) ( )
( ) ( ) ( ) ( )
( ) ( )
2
2 22 2 2 21 2 1 2
2 22 2 2 22 2 1 1 1 2
2 21 2 1
14sin cos
-1 2 sin cos sin cos
1 - 2 cos - 2 sin 1- sin - cos
- sin - coslog
c
c
Wh f v v
h h h hv v v vh h h h
h h h h h hv v v vh h h h h h
h h hv vh h h
ω= ⋅
+ + + +
+ + + +
++
( ) ( )
( ) ( ) ( ) ( )
( ) ( )( )
2 22 22
2 22 2 2 21 2 2 2 1 1
2 22 41 2 1 2
sin cos
1- sin - cos 1 - 2 cos - 2 sin
2 - - cos - cos
hv vh
h h h h h hv v v vh h h h h h
h h h h v vh h h h
+ + + + + ⋅
(7.23)
The formula for the simplified calculation becomes:
( ) ( )2 2
_ . .2
1 1 1tan2 2 tan
c K W J I II
c
W h hvh f h h vω
= + (7.24)
7.1.2 The contribution from the reinforcement
If the reinforcement is placed in a direction perpendicular to the axis of rotation at a distance from
the slab surface as shown in Figure 7.27 the contribution from the reinforcement to the dissipation
per unit length becomes:
( )( )
( )( )1 , ,
2 , ,
cos - ' '
cos ' 's s I cI I s I I cI
s II cII II s II II cII
W w v A h h h A h h
v A h h h A h h
ω
ω
= − − + − +
− − + − (7.25)
where ωI and ωII are the rotations about axis I and II, respectively. These are determined in (7.11)
and the expression may be written as:
( )
( )
0, 0,2
0, 0,
'1 1 'tan -
'1 1 'tan
s cI cII II I
c
cII cIIII IIII II
W h hh hh f w v h h h h
h hh hv h h h h
ω = Φ − − + Φ − +
Φ − − + Φ −
(7.26)

Yield line Theory for Concrete Slabs Subjected to Axial Force
- 30 -
h hcII´ hcI´
hcII hcI
AsII´AsII
AsI´AsI
v
I II
z
w
hII hI
Figure 7.27. Reinforcement arrangement
If the corner is right-angled the dissipation becomes:
( )
( )
0, 0,2
0, 0,
'tan 1 '
'1 1 'tan
s cI cII II I
c
cII cIIII IIII II
W h hh hvh f h h h h
h hh hv h h h h
ω = Φ − − + Φ − +
Φ − − + Φ −
(7.27)
7.2 Beam example
For slabs the position of the axes of rotation are not always easily found. An exact analysis for a
slab is impossible since no correct analytical expression may be found for the dissipation.
Therefore, a numerical investigation has to be made in each situation.
However, it may be assumed that the axes of rotation must be placed at the same position as the
neutral axis. For a beam this assumption may be shown to be correct and is therefore worth studying
first.
For all combinations of transverse loads, the load-carrying capacity always depends on the
dissipation for a unit rotation ω=1 in the yield line. Therefore, it is sufficient to find the minimum
dissipation in order to find the minimum load-carrying capacity.

Tim Gudmand-Høyer
- 31 -
ω
y0 d
fc
fy
h
Figure 7.28 Stresses in a beam.
Considering the beam in Figure 7.28 it is seen that the position of the neutral axis may be found
from a projection equation as:
0
0 0
0 0
s y c
c c
A bf by f
hf b by fy h
=
Φ == Φ
(7.28)
where
0s y
c
A fbhf
Φ = (7.29)
The yield moment becomes
0 0
20 0
1 12 21 12 2
p c
p c
M y f b d y
dM h f bh
= − ⇒ = Φ − Φ
(7.30)
An upper bound approach leads to the following result:
( )( ) ( )
( ) ( )
00
0 0 0 0
20 0 0 0
0 00
1 1 sin2
1 1 22 212
h
c s y
c c
c c c
c c
W f bu dz A bf d y
W f b y y hf b d y
W f b y hf b y hf b d
dW f b y hf bdy
α ω
ω ω
ω ω ω
ω ω
= − + − ⇔
= + Φ − ⇔
= − Φ + Φ ⇔
= − Φ
∫
(7.31)
0 00
0dW y hdy
= ⇔ = Φ (7.32)
As seen, the minimum load-carrying capacity is found where the position of the axis of rotation
equals the position of the neutral axis. Furthermore, it is seen that the dissipation found by the upper
bound approach is the same as the yield moment times the rotation.

Yield line Theory for Concrete Slabs Subjected to Axial Force
- 32 -
Similarly it may be shown that this assumption is valid if both top reinforcement and bottom
reinforcement are included. Furthermore, it may also be shown that the assumption is valid if an
axial force is applied. In these situations the dissipation plus the work caused by the dissipation of
the axial force equals the yield moment (including the contribution from the axial force) times the
rotation.
h σh
Φ0´hfc
Φ0hfc
σ'c
y0
hc´
hc
M
Figure 7.29. Beam with axial force.
For the reinforced beam illustrated in Figure 7.29 the position of the neutral axis may be calculated
as:
For 0 0´0 ´ch
fc hσ≤ ≤ − Φ − Φ
00 0´
yh fc
σ= + Φ + Φ (7.33)
For 0 0 0 0´ ´´ ´c ch h
h fc hσ− Φ − Φ ≤ ≤ − Φ + Φ
0 cy hh h
= (7.34)
For 0 0 0 0´ ´ ´c ch h h
h fc hσ −− Φ + Φ ≤ ≤ − Φ + Φ
00 0´
yh fc
σ= + Φ − Φ (7.35)
For 0 0 0 0´ ´c ch h h hh fc h
σ− −− Φ + Φ ≤ ≤ + Φ + Φ
0 cy h hh h
−= (7.36)
For 0 0 0 0´ 1 ´ch hh fc
σ− + Φ + Φ ≤ ≤ + Φ + Φ
00 0´
yh fc
σ= − Φ − Φ (7.37)

Tim Gudmand-Høyer
- 33 -
Knowing the position of the axis of rotation the dissipation per unit length may be calculated as:
2
0 0 00 02
´1 1 ´2
c c
c
y h y h yWh f h h h h hω
= + Φ − − + Φ −
(7.38)
It appears that since the assumption about the neutral axis being the axis of rotation is valid the
dissipation may be calculated quite easily for a beam.
7.3 Square slab without axial force
For slabs in general the assumption about the neutral axes being the axes of rotation can not be
shown analytically.
In the following examples the results of numerical calculations will be evaluated both regarding the
assumption about the axes of rotation and the error made using K. W. Johansen’s simplification.
Considering a uniformly laterally loaded isotropic square slab with the same amount of
reinforcement in the top and bottom and simply supported along all four edges, it is known (see [5])
that the exact solution is:
Prager 2
24 pmq
L= (7.39)
L
L
mp
mp
Figure 7.30. Prager’s exact solution for a square slab
If it is assumed that the failure mode in Figure 7.31 is the one that will occur the load-carrying
capacity found from the above dissipation formulas is as follows:

Yield line Theory for Concrete Slabs Subjected to Axial Force
- 34 -
L
L
mp
mp
Failure mode 1
Dy
Ls
Figure 7.31. Failure mode 1 for square slab.
Failure mode 1:
The external work becomes:
( )1 12 3e y yW q D L L D Lδ = + −
(7.40)
The dissipation becomes:
, , ,0 ,02 22 2 2 24 2
2
c v s v c si s c y c
s c c c c
W W W WW L h f D h fLL h f h f h f h f
δ δω ω ω ω
= + + +
(7.41)
The work equation leads to:
( )
, , ,0 ,022 2 2 2
1 2
24
2
c v s v c sc y
c c c c
y
W W W Wf h L D
h f h f h f h fq
D L Lω ω ω ω
+ + +
=+
(7.42)
Here Wc,v and Ws,v are the contributions to the dissipation per unit length for the yield line (Ls) from
the concrete and reinforcement, respectively. Similarly, Wc,0 and Ws,0 are the contributions to the
dissipation per unit length for the yield line (Dy) from the concrete and reinforcement, respectively.
Calculating all possible combinations of the positions of the two axes of rotation and plotting the
lowest load-carrying capacity for a given Dy leads to the results shown in Figure 7.32 and Figure
7.33.

Tim Gudmand-Høyer
- 35 -
0 0.2 0.4 0.6 0.8 10
0.05
0.1
0.15
0.2
0.25
0.3
Dy/Ly
q
24mp/L2
q1
Figure 7.32. Load-carrying capacity q1 for a square slab with L=2000mm, Φ0=Φ0´=0.1, hc/h= hc´/h=0.1, fc=30MPa
(solid) and load-carrying capacity according to (7.39) (dashed).
0 0.2 0.4 0.6 0.8 10
0.1
0.2
0.3
0.4
0.5
0.6
0.7
0.8
0.9
1
Dy/Ly
h x/h
hx/hhy/h
Figure 7.33 Position of the axes of rotation for a square slab with L=2000mm, Φ0=Φ0´=0.1, hc/h= hc´/h=0.1,
fc=30MPa.

Yield line Theory for Concrete Slabs Subjected to Axial Force
- 36 -
The yield moment mp used in these calculations is calculated as described in [5] (having hc/h=
hc´/h):
0
0
´µ Φ=Φ
(7.43)
For 00
1 11 and 1
c ch hh h
µµ
≥ − Φ ≤Φ +
( ) ( ) 20 0
11 2 1 12
c cp c
h hm h fh h
µ µ = − + + − Φ + Φ
(7.44)
For 00
1 11 and 1
c ch hh h
µµ
≥ − Φ ≥Φ +
2
20
0
1 11 22
c cp c
h hm h fh h
= − + Φ Φ (7.45)
For 0
11 chh
µ < −Φ
( ) ( ) 20 0
11 2 1 12
c cp c
h hm h fh h
µ µ = − + − − Φ − Φ
(7.46)
From Figure 7.32 it appears that the numerical calculations using the dissipation formulas above
leads to the same solution as the one found using the yield condition for the slab when Dy=0.
Furthermore, Figure 7.33 shows that the axes of rotation are at the same depth and this depth
corresponds to the neutral axes. More plots for different degrees of reinforcement and different
values of hc/h are shown in section 11.1.1.1.
For isotropic square slabs it may be concluded that the position of the axes of rotation corresponds
to the neutral axes and that the load-carrying capacity found from the above dissipation formulas
corresponds to the exact solutions found from the yield conditions.
7.3.1.1 Rectangular slabs For rectangular slabs the failure modes assumed in this paper are illustrated in Figure 7.34
(Ingerslev´s solutions). These failure modes are not exact solutions to the problem. However, it is
believed that the results are close to the exact solution and therefore acceptable.

Tim Gudmand-Høyer
- 37 -
Ly
Lx
mpx
mpy
Failure mode 1 Failure mode 2
Dy
Dx Ls
Ls
Figure 7.34. Failure modes.
An upper bound solution leads to the following load-carrying capacity for a uniformly loaded slab:
pym
px
mm
µ = (7.47)
For xy
m
LLµ
≥
Ingerslev 22
2
24
1 13
m px
x xx
m y ym
mq
L LLL L
µ
µ µ
= + −
(7.48)
and
2
1 3y y y y
y m x m x m x
D L L LL L L Lµ µ µ
= − − + +
(7.49)
For xy
m
LLµ
≤
Ingerslev 22
2
24
3
px
y yy m m
x x
mq
L LL
L Lµ µ
= + −
(7.50)
and
2
1 3m y m y m yx
x x x x
L L LDL L L L
µ µ µ = − − + +
(7.51)

Yield line Theory for Concrete Slabs Subjected to Axial Force
- 38 -
Formula (7.48) corresponds to failure mode 1 and (7.50) to failure mode 2. The yield moments mpx
and mpy are calculated from cross-section analyses perpendicular to the x-axis and the y-axis,
respectively.
For the two failure modes the equations according to the dissipation formulas becomes:
Failure mode 1:
The internal work becomes:
( )1 12 3e y x y y xW q D L L D Lδ = + −
(7.52)
The external work becomes:
, , ,0 ,02 22 2 2 24 2
2
c v s v c se s c y c
xs c c c c
W W W WW L h f D h fLL h f h f h f h f
δ δω ω ω ω
= + + +
(7.53)
The work equation leads to:
2, , ,0 ,0
2 2 2 2 2
1 2
6 4 1
1 2
y yc v s v c sc x
y y y c c y c c
y yx
y y y
D DW W W Wf h LL L L h f h f L h f h f
qD DL
L L L
ω ω ω ω
− + + + =
− +
(7.54)
where Wc,v and Ws,v are the contributions to the dissipation per unit length for the yield line (Ls)
from concrete and reinforcement, respectively. Similarly, Wc,0 and Ws,0 are the contributions to the
dissipation per unit length for the yield line (Dy) from concrete and reinforcement, respectively.
The work equation for failure mode 2 leads to load-carrying capacity:
2, , ,0 ,0
2 2 2 2 2
2 2
6 4 1
1 2
y c v s v c sc x x
x x x c c x c c
y x x
x x x
L W W W Wf h D DL L L h f h f L h f h f
qL D DL L L
ω ω ω ω
− + + + =
− +
(7.55)
Calculating all the possible combinations of the position of the two axes of rotation and plotting the
lowest load-carrying capacity for a given Dy lead to the results shown in Figure 7.35.

Tim Gudmand-Høyer
- 39 -
0 0.2 0.4 0.6 0.8 10
0.02
0.04
0.06
0.08
0.1
Φ0x=Φ0x´0.1,Φ0y=Φ0y´=0.1,fc=30MPa,h=100mm,hc/h=0.1,Lx=2000mm and Ly=16000mm
Dy/Ly for q1 or Dx/Lx for q2
q in
MP
a
q1q2Ingerslev
Figure 7.35. Load-carrying capacity q1 and q2 ,according to (7.54) (dashed dotted) and (7.55) (dotted), for a
rectangular slab with Lx=2000mm, Ly=16000mm, Φ0=Φ0´=0.1, hc/h= hc´/h=0.1, fc=30MPa and load-carrying
capacity according to (7.48) or (7.50) (*).The vertical line indicates the minium for the numerical calculculations.
0 0.2 0.4 0.6 0.8 10
0.1
0.2
0.3
0.4
0.5
0.6
0.7
0.8
0.9
1
Dy/Ly
h x/h
hx/hhy/h
Figure 7.36 Position of the axes of rotation for a rectangular slab with Lx=2000mm, Ly=16000mm, Φ0=Φ0´=0.1, hc/h=
hc´/h=0.1, fc=30MPa.

Yield line Theory for Concrete Slabs Subjected to Axial Force
- 40 -
Apparently, the assumption about the neutral axes being the axes of rotation is correct and this may
also be shown for isotropic slabs. Nevertheless, as shown in Figure 7.38, the assumption is not
always correct. Numerical calculations show that the assumption is incorrect if the slab is
orthotropic. In Figure 7.38 it is seen that the minimum load-carrying capacity is found where the
axes of rotation are at positions 0.14 hx/h and 0.1 hy/h in a slab with the reinforcement degrees
Φ0x=Φ0x´=0.1 and Φ0y=Φ0y´=0.05 and not at 0.2 hx/h and 0.1 hy/h as expected. However, the
minima of these curves are very flat as seen in Figure 7.39 where the load-carrying capacity is
plotted as a function of the position of the axis of rotation in the x direction.
0 0.2 0.4 0.6 0.8 10
0.01
0.02
0.03
0.04
0.05
0.06
Φ0x=Φ0x´0.1,Φ0y=Φ0y´=0.05,fc=30MPa,h=100mm,hc/h=0.2,Lx=2000mm and Ly=16000mm
Dy/Ly for q1 or Dx/Lx for q2
q in
MP
a
q1q2Ingerslev
Figure 7.37. Load-carrying capacity q1 and q2, according to (7.54) (dashed dotted) and (7.55) (dotted), for a square
slab Lx=2000mm, Ly=16000mm, Φ0x=Φ0x´=0.1, Φ0y=Φ0y´=0.05, hcx/h= hcx´/h= hcy/h= hcy´/h=0.2, fc=30MPa and load-
carrying capacity according to (7.48) or (7.50) (*).

Tim Gudmand-Høyer
- 41 -
0 0.2 0.4 0.6 0.8 10
0.1
0.2
0.3
0.4
0.5
0.6
0.7
0.8
0.9
1
Dy/Ly
h x/h
hx/hhy/h
Figure 7.38 Position of the axes of rotation for a rectangular slab Lx=2000mm, Ly=16000mm, Φ0x=Φ0x´=0.1,
Φ0y=Φ0y´=0.05, hcx/h= hcx´/h= hcy/h= hcy´/h=0.2, fc=30MPa.
0 0.05 0.1 0.15 0.2 0.25 0.3 0.35 0.40.03
0.031
0.032
0.033
0.034
0.035
0.036
0.037
0.038
0.039
0.04Φ0x=Φ0x´0.1,Φ0y=Φ0y´=0.05,fc=30MPa,h=100mm,hc/h=0.2,Lx=2000mm and Ly=16000mm
hx/h
q in
MP
a
Figure 7.39 Load-carrying capacity as a function of the position of the axis of rotation in the x direction for a
rectangular slab Lx=2000mm, Ly=16000mm, Φ0x=Φ0x´=0.1, Φ0y=Φ0y´=0.05, hcx/h= hcx´/h= hcy/h= hcy´/h=0.2,
fc=30MPa, Dy/Ly=0.73, hy/h=0.1.

Yield line Theory for Concrete Slabs Subjected to Axial Force
- 42 -
If the slab is reinforced in the top and bottom and Φ0+Φ0´>hc´/h the axis of rotation will be at the
neutral axis (assuming Φ0=Φ0´). If Φ0+Φ0´<hc´/h the assumption is incorrect but the error made by
such assumption is negligible.
If the slab is not reinforced in the top the assumption is incorrect and the error may become
noticeable. This is illustrated in Figure 7.40 and Figure 7.41 where the positions of the axes of
rotation for a slab with Φ0y´=Φ0x´=0, Φ0x=0.7 and Φ0y=0.1 are at 0.4hx/h and 0.1hy/h, respectively.
Even though the position of the axes of rotation is wrong in the x direction it is seen that the load-
carrying capacity is only underestimated about 5% in this case.
0 0.2 0.4 0.6 0.8 10
0.02
0.04
0.06
0.08
0.1
0.12
0.14
Φ0x=Φ0x´0.7,Φ0y=Φ0y´=0.1,fc=30MPa,h=100mm,hc/h=0.1,Lx=2000mm and Ly=16000mm
Dy/Ly for q1 or Dx/Lx for q2
q in
MP
a
q1q2Ingerslev
Figure 7.40. Load-carrying capacity q1 and q2, according to (7.54) (dashed dotted) and (7.55) (dotted), for a square
slab Lx=2000mm, Ly=16000mm, Φ0x=Φ0x´=0.7, Φ0y=Φ0y´=0.1, hcx/h= hcx´/h= hcy/h= hcy´/h=0.1, fc=30MPa and load-
carrying capacity according to (7.48) or (7.50) (*).

Tim Gudmand-Høyer
- 43 -
0 0.2 0.4 0.6 0.8 10
0.1
0.2
0.3
0.4
0.5
0.6
0.7
0.8
0.9
1
Dy/Ly
h x/h
hx/h for q1hy/h for q1
Figure 7.41 Position of the axes of rotation for a rectangular slab Lx=2000mm, Ly=16000mm, Φ0x=Φ0x´=0.7,
Φ0y=Φ0y´=0.1, hcx/h= hcx´/h= hcy/h= hcy´/h=0.1, fc=30MPa.
It is obvious that the error decreases for increasing difference between the two side lengths, since a
larger difference leads to larger contribution from the yield line parallel to the supports (Dx or Dy)
where the assumption is correct. In other words the slab starts to carry the load as a beam.
The fact that an increasing difference between the two degrees of reinforcement increases the error
is also quite obvious. Therefore, in order to estimate the largest error a slab with the largest
difference in the degrees of reinforcement and a side length ratio leading to almost no parallel parts
of the yield line is considered. Setting Φ0y´=Φ0x´=0, Φ0x=0.9 and Φ0y=0.1 Ly/Lx=2.2 (see Figure
11.7) leads to an error of about 17%. However, such a degree of reinforcement is quite unrealistic.
A realistic guess on the limits found in practice may be found for Φ0y´=Φ0x´=0, Φ0x=0.3 and
Φ0y=0.05 Ly/Lx=2.2 (see Figure 11.8) which lead to an error less than 4%.
Keeping in mind that the assumption about the neutral axes being the axes of rotation leads to an
underestimation of less than 4% for rectangular slabs, it is believed that the assumption may be
acceptable for such slabs.

Yield line Theory for Concrete Slabs Subjected to Axial Force
- 44 -
7.4 Rectangular slabs with axial force
For rectangular slabs with axial force the failure modes assumed are the same as for slabs without
axial force. They are shown in Figure 7.42.
Ly
Lx
mfx
mfy
Failure mode 1 Failure mode 2
Dy
Dx Ls
Ls
σx
σy
Figure 7.42. Failure modes for rectangular slabs with axial force.
An approximate solution to this problem is to calculate the yield moments in each direction
including the axial force and then use these yield moments in Ingerslev´s solution. This calculation
corresponds to the assumption about the neutral axes being the axes of rotation. The result is the
same as if the dissipation is determined according to K. W. Johansen´s method for calculating the
dissipation.
hc´
hc
hfcΦ´
hfcΦ
h
Figure 7.43.Cross section in a slab.
For the cross-section shown in Figure 7.43 the yield moments becomes:
For 0 0´0 ´ch
fc hσ≤ ≤ − Φ − Φ
00 0´
c
yh f
σ= + Φ + Φ (7.56)
2 0 00 0
´1 1 11 ´2 2 2
c cp c
y y h hm h fh h h h
= − + Φ − − Φ −
(7.57)
Tim Gudmand-Høyer
- 45 -
For 0 0 0 0´ ´´ ´c ch h
h fc hσ− Φ − Φ ≤ ≤ − Φ + Φ
0 ´cy hh h
= (7.58)
2 0 0 00 0
´1 1 112 2 2
c cp c
c
y y h y hm h fh h h h f h
σ = − + Φ − − − − Φ − (7.59)
For 0 0 0 0´ ´ ´c ch h h
h fc hσ −− Φ + Φ ≤ ≤ − Φ + Φ
00 0´
yh fc
σ= + Φ − Φ (7.60)
2 0 00 0
´1 1 11 ´2 2 2
c cp c
y y h hm h fh h h h
= − + Φ − + Φ −
(7.61)
For 0 0 0 0´ ´c ch h h hh fc h
σ− −− Φ + Φ ≤ ≤ + Φ + Φ
0 cy h hh h
−= (7.62)
2 0 0 00 0
´1 1 11 ´ ´2 2 2
c cp c
c
y y y h hm h fh h h f h h
σ = − + − + Φ − + Φ − (7.63)
For 0 0 0 0´ 1 ´ch hh fc
σ− + Φ + Φ ≤ ≤ + Φ + Φ
00 0´
yh fc
σ= − Φ − Φ (7.64)
2 0 00 0
´1 1 11 ´2 2 2
c cp c
y y h hm h fh h h h
= − − Φ − + Φ −
(7.65)
The formulas above are valid in both the x and y direction.
For the two failure modes the equations using the dissipation formulas above becomes:
Failure mode 1:
The internal work becomes:
, , ,0 ,02 22 2 2 24 2
2
c v s v c si s c y c
xs c c c c
W W W WW L h f D h fLL h f h f h f h f
δ δω ω ω ω
= + + +
(7.66)
The external work becomes:
( ) ( )1 1 2 22 3 2 2
2 2
e y x y y x x y y y x xx y y
h hW q D L L D L h L h h L hL L Dδ δδ σ σ = + − + − + − −
(7.67)

Yield line Theory for Concrete Slabs Subjected to Axial Force
- 46 -
where hx and hy are the distances from the top surface to the axes of rotation in the x and y direction,
respectively.
The work equation leads to:
, , ,0 ,02 2 2 2
2
22
1 2
2 112
1 2 1 2 1
y yc v s v c sx
y y c c y c cc
y y y y yx x x
c y y c y
x
y
D DW W W WLL L h f h f L h f h ff h
L D h D L hf L h L f L h
qDL
L
ω ω ω ω
σσ
− + + +
+ − + − + − =
1 2y y
y y
DL L
− +
(7.68)
where Wc,v and Ws,v are the contributions to the dissipation per unit length for the yield line (Ls)
from concrete and reinforcement, respectively. Similarly, Wc,0 and Ws,0 are the contributions to the
dissipation per unit length for the given line (Dy) from concrete and reinforcement, respectively.
The work equation for failure mode 2 leads to:
, , ,0 ,02 2 2 22
2 2
2 2
2 112
1 2 1 2 1
1
y c v s v c sx x
x x c c x c cc
x y y yx x x x
c x x c x
y x x
x x x
L W W W WD DL L h f h f L h f h ff h
L L hD h Df L h L f L h
qL D DL L L
ω ω ω ω
σ σ
− + + +
+ − + − + − =
− +
2
(7.69)
Calculating all possible combinations of the position of the two axes of rotation and plotting the
lowest load-carrying capacity for a given axial force in one direction lead to the results shown in
Figure 7.44 to Figure 7.48.

Tim Gudmand-Høyer
- 47 -
0 0.2 0.4 0.6 0.8 1 1.20
0.05
0.1
0.15
0.2
0.25
0.3
0.35
0.4
σx/fc
q
q1q2Ingerslev modified
Figure 7.44. Load-carrying capacity for a rectangular slab Lx=2000mm, Ly=2000mm, Φ0x=Φ0x´=0.1, Φ0y=Φ0y´=0.1,
hcx/h= hcx´/h= hcy/h= hcy´/h=0.1, fc=30MPa, h=100mm, increasing σx and σy=0.
0 0.2 0.4 0.6 0.8 1 1.2 1.40
5
10
15
20
25
30
35
40
σx/fc
diff
%
|qIngerslev mod.-min(q1,q2)|/min(q1,q2)*100%
Figure 7.45 Difference between the calculation methods for a rectangular slab Lx=2000mm, Ly=2000mm,
Φ0x=Φ0x´=0.1, Φ0y=Φ0y´=0.1, hcx/h= hcx´/h= hcy/h= hcy´/h=0.1, fc=30MPa, h=100mm, increasing σx and σy=0.

Yield line Theory for Concrete Slabs Subjected to Axial Force
- 48 -
0 0.2 0.4 0.6 0.8 1 1.20
0.1
0.2
0.3
0.4
0.5
0.6
0.7
0.8
0.9
1
σx/fc
Dy/L
y or D
x/Lx
Dy/Ly for q1Dx/Lx for q2Ingerslev
Figure 7.46.Length of the part of the yield line parallel to the axes of rotation for a rectangular slab Lx=2000mm,
Ly=2000mm, Φ0x=Φ0x´=0.1, Φ0y=Φ0y´=0.1, hcx/h= hcx´/h= hcy/h= hcy´/h=0.1, fc=30MPa, h=100mm, increasing σx and
σy=0.
0 0.2 0.4 0.6 0.8 1 1.20
0.1
0.2
0.3
0.4
0.5
0.6
0.7
0.8
0.9
1
σx/fc
h x/h o
r hy/h
hx/h for q1hy/h for q1Ingerslev modified
Figure 7.47.Position of the axes of rotation for failure mode 1 for a rectangular slab Lx=2000mm, Ly=2000mm,
Φ0x=Φ0x´=0.1, Φ0y=Φ0y´=0.1, hcx/h= hcx´/h= hcy/h= hcy´/h=0.1, fc=30MPa, h=100mm, increasing σx and σy=0.

Tim Gudmand-Høyer
- 49 -
0 0.2 0.4 0.6 0.8 1 1.20
0.1
0.2
0.3
0.4
0.5
0.6
0.7
0.8
0.9
1
σx/fc
h x/h o
r hy/h
hx/h for q2hy/h for q2Ingerslev modified
Figure 7.48 Position of the axes of rotation for failure mode 2 for a rectangular slab Lx=2000mm, Ly=2000mm,
Φ0x=Φ0x´=0.1, Φ0y=Φ0y´=0.1, hcx/h= hcx´/h= hcy/h= hcy´/h=0.1, fc=30MPa, h=100mm, increasing σx and σy=0.
As expected the calculations using the method based on Ingerslev´s solution lead to an
underestimation of the load-carrying capacity. In general the underestimation increases as the axial
force increases. This underestimation is caused by the underestimation of the dissipation
contribution from the concrete.
As seen in Figure 7.46 the length of the part of the yield line parallel to one of the axes for the
Ingerslev solution is not the same as the one found from the dissipation formulas. It is seen that for
σx=fc the load-carrying capacity found for failure mode 1 is the same as the load-carrying capacity
found for failure mode 2 and both have a part of the yield line parallel to the axes. Ingerslev´s
solution also leads to changes in failure mode at this stress but has no part of the yield line parallel
to the axes.
The positions of the axes of rotation found from the two methods are also different. It is seen that
the normal force dose not effect the position as assumed. The position found by using the
dissipation formulas determined by hy/h, is in general lower. This means that the axis of rotation is
placed closer to the top of the slab and therefore the positive effect for the load-carrying capacity is
higher.
In order to evaluate the overestimation, an extreme slab is considered.

Yield line Theory for Concrete Slabs Subjected to Axial Force
- 50 -
Knowing that the contribution to the dissipation from the concrete is calculated differently in the
two methods it is obvious that a lower degree of reinforcement leads to a larger difference between
the methods.
0.04 0.06 0.08 0.1 0.12 0.14 0.160
5
10
15
20
25
30
35
40
45
50
Φ0x=Φ0x´=Φ0y=Φ0y´
diff
%
Figure 7.49. Maximum (*) and minimum (+) difference between the two calculation methods for a rectangular slab
Lx=2000mm, Ly=2000mm, hcx/h= hcx´/h= hcy/h= hcy´/h=0.1, fc=30MPa, h=100mm, σx variation from 0 to
fc(1+Φ0x+Φ0x´), σy=0 and different Φ0x=Φ0x´= Φ0y=Φ0y´.
When it comes to the Lx/Ly ratio an extreme case cannot be found from similar simple
considerations. As illustrated in Figure 7.50 and Figure 7.51 extreme combinations of Lx and Ly
changes along with the degree of reinforcement. In these plots * and + represents the maximum and
minimum difference between the two calculation methods.

Tim Gudmand-Høyer
- 51 -
0 1 2 3 4 5 60
5
10
15
20
25
30
35
40
Lx/Ly
diff
%
Figure 7.50. Maximum (*) and minimum (+) difference between the two calculation methods for a rectangular slab
Lx=2000mm, Φ0x=Φ0x´=0.1, Φ0y=Φ0y´=0.1, hcx/h= hcx´/h= hcy/h= hcy´/h=0.1, fc=30MPa, h=100mm, σx variation from
0 to fc(1+Φ0x+Φ0x´), σy=0 and different Lx/Ly ratios.
0 1 2 3 4 5 60
5
10
15
20
25
30
35
40
45
50
Lx/Ly
diff
%
Figure 7.51. Maximum (*) and minimum (+) difference between the two calculation methods for a rectangular slab
Lx=2000mm, Φ0x=Φ0x´=0.05, Φ0y=Φ0y´=0.05, hcx/h= hcx´/h= hcy/h= hcy´/h=0.1, fc=30MPa, h=100mm, σx variation
from 0 to fc(1+Φ0x+Φ0x´), σy=0 and different Lx/Ly ratios.

Yield line Theory for Concrete Slabs Subjected to Axial Force
- 52 -
Figure 7.51 shows that the maximum positive deviation is found for a Lx/Ly ratio of approximately
0.5 if the degree of reinforcement is 0.05. It is also seen that the minimum deviation is always
positive and this means that the simplified calculation always underestimates the load-carrying
capacity.
In Figure 7.52 to Figure 7.56 the results of the calculations for a slab with the Lx/Ly ratio of 0.5 and
a degree of reinforcement of 0.05 are shown. Ingerslev modified refers to calculations using
Ingerslevs solution ((7.54) or (7.55)) with the yield moment found when including the axial force
((7.57) to (7.65)) and Ingerslev 1 and Ingerslev 2 refers to the solutions for the two yield patterns..
0 0.2 0.4 0.6 0.8 10
0.02
0.04
0.06
0.08
0.1
0.12
0.14
0.16
0.18
0.2
σx/fc
q
q1q2Ingerslev modified
Figure 7.52. Load-carrying capacity for a rectangular slab Lx=2000mm, Ly=4000mm, Φ0x=Φ0x´=0.05,
Φ0y=Φ0y´=0.05, hcx/h= hcx´/h= hcy/h= hcy´/h=0.1, fc=30MPa, increasing σx and σy=0.

Tim Gudmand-Høyer
- 53 -
0 0.2 0.4 0.6 0.8 10
5
10
15
20
25
30
35
40
45
50
σx/fc
diff
%
(qIngerslev mod.-min(q1,q2))/min(q1,q2)*100%
Figure 7.53 Difference between the calculation methods for a rectangularslab Lx=2000mm, Ly=4000mm,
Φ0x=Φ0x´=0.05, Φ0y=Φ0y´=0.05, hcx/h= hcx´/h= hcy/h= hcy´/h=0.1, fc=30MPa, increasing σx and σy=0.
0 0.2 0.4 0.6 0.8 10
0.1
0.2
0.3
0.4
0.5
0.6
0.7
0.8
0.9
1
σx/fc
Dy/L
y or D
x/Lx
Dy/Ly for q1Dx/Lx for q2Ingerslev1Ingerslev2
Figure 7.54.Length of the part of the yield line parallel to the axes of rotation for a rectangular slab Lx=2000mm,
Ly=4000mm, Φ0x=Φ0x´=0.05, Φ0y=Φ0y´=0.05, hcx/h= hcx´/h= hcy/h= hcy´/h=0.1, fc=30MPa, increasing σx and σy=0.

Yield line Theory for Concrete Slabs Subjected to Axial Force
- 54 -
0 0.2 0.4 0.6 0.8 1 1.20
0.1
0.2
0.3
0.4
0.5
0.6
0.7
0.8
0.9
1
σx/fc
h x/h o
r hy/h
hx/h for q1hy/h for q1Ingerslev modified
Figure 7.55.Position of the axes of rotation for failure mode 1 for a rectangular slab Lx=2000mm, Ly=4000mm,
Φ0x=Φ0x´=0.05, Φ0y=Φ0y´=0.05, hcx/h= hcx´/h= hcy/h= hcy´/h=0.1, fc=30MPa, increasing σx and σy=0.
0 0.2 0.4 0.6 0.8 1 1.20
0.1
0.2
0.3
0.4
0.5
0.6
0.7
0.8
0.9
1
σx/fc
h x/h o
r hy/h
hx/h for q2hy/h for q2Ingerslev modified
Figure 7.56 Position of the axes of rotation for failure mode 2 for a rectangular slab Lx=2000mm, Ly=4000mm,
Φ0x=Φ0x´=0.05, Φ0y=Φ0y´=0.05, hcx/h= hcx´/h= hcy/h= hcy´/h=0.1, fc=30MPa, increasing σx and σy=0.

Tim Gudmand-Høyer
- 55 -
It appears that the deviation between the two methods in general increases with the axial force. The
largest deviation is approximately 50% and it is larger for axial stresses closer to fc + Φ0+Φ0´.
However, this deviation is valid for an axial stress larger than fc and such a stress would not be
allowed in practice because of problems of stability. Assuming that the maximum axial stress is fc,
the deviation is 40%.
From this it may be concluded that the simple way (Ingerslev modified) of calculating the load-
carrying capacity for a rectangular slab loaded with axial force is always safe and the method
underestimates the load-carrying capacity with max 40%. A 40% deviation is an extreme case and it
is believed that the simplification is acceptable for most practical purposes.
7.5 Rectangular slabs with axial force and with deflection
If the slab is deflected, the calculation of the dissipation must be changed since the distance to the
axes of rotation changes along the yield line. In these calculations it is assumed that the deflection
follows the yield line pattern as shown in Figure 7.57.
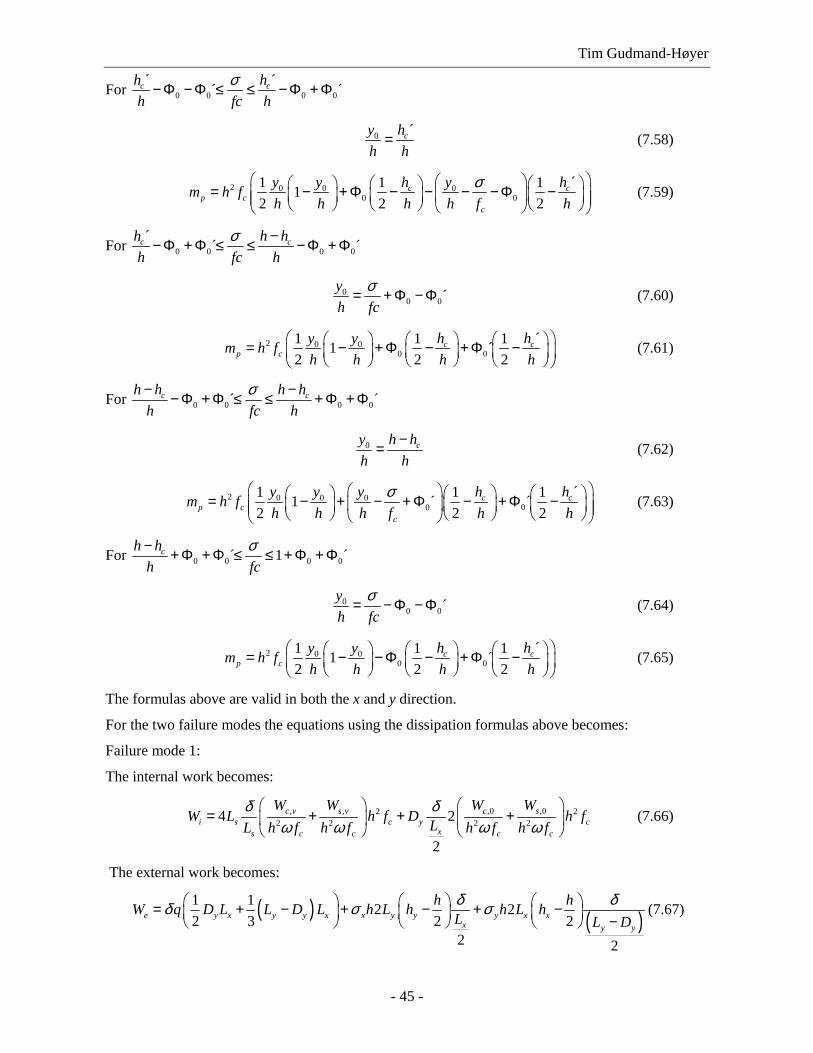
Deflected form Non deflected form
um
Figure 7.57. Deflection assumption for rectangular slabs.
Compared with the calculations for a slab without deflection the only difference is the calculation of
the dissipation. In these calculations the vertical distance to the axes of rotation changes and this
leads to different values of Ws,0 Ws,90, Ws,v, Wc,0, Wc,90, Wc,v.
Regarding Ws,0 Ws,90, Wc,0 and Wc,90 the distance from the top of the slab to the axes of rotation
changes from hx to hx-u and from hy to hy-u. Regarding Ws,v and Wc,v the distance from the top of
the slab to the axes of rotation varies along the yield line. This means that Ws,v and Wc,v must be
calculated as average values. The calculations are made numerically.
When calculating the dissipation as described above, the formulas ((7.68) and (7.69)) for non-
deflected slabs may be used to determine the load-carrying capacity.

Yield line Theory for Concrete Slabs Subjected to Axial Force
- 56 -
For a square slab the calculations lead to the results shown in Figure 7.58 to Figure 7.60. Since the
slab is square and the reinforcement is the same in both direction the two yield patterns leads to the
same results.
0 0.2 0.4 0.6 0.8 1 1.2 1.40
0.1
0.2
0.3
0.4
0.5
0.6
0.7
0.8
0.9
1q
u/h
q1q2Ingerslev modified1Ingerslev modified2
Figure 7.58 Load-carrying capacity for a rectangular slab Lx=2000mm, Ly=2000mm, Φ0x=Φ0x´=0.2, Φ0y=Φ0y´=0.2,
hcx/h= hcx´/h= hcy/h= hcy´/h=0.1, fc=30MPa, σx and σy=0

Tim Gudmand-Høyer
- 57 -
0 0.5 1 1.5 20
10
20
30
40
50
60
u/h
diff
%
Figure 7.59 Difference between the load-carrying capacity for a non-deflected and a deflected rectangular slab with
Lx=2000mm, Ly=2000mm, Φ0x=Φ0x´=0.2, Φ0y=Φ0y´=0.2, hcx/h= hcx´/h= hcy/h= hcy´/h=0.1, fc=30MPa, σx and σy=0
0 0.5 1 1.5 20.1
0.2
0.3
0.4
0.5
0.6
0.7
0.8
0.9
1
h x/h a
nd h
y/h
u/h
q1q2Ingerslev modified1Ingerslev modified2
Figure 7.60 Position of the axes of rotation for failure mode 2 for a rectangular slab Lx=2000mm, Ly=2000mm,
Φ0x=Φ0x´=0.2, Φ0y=Φ0y´=0.2, hcx/h= hcx´/h= hcy/h= hcy´/h=0.1, fc=30MPa, σx and σy=0.

Yield line Theory for Concrete Slabs Subjected to Axial Force
- 58 -
In these figures it is seen that the load-carrying capacity increases as the slab deflects. This
phenomenon is well-known and may be explained by the change in geometry from a slab to a
shallow shell. In these calculations only the displacements at failure are included in the work
equation, which means that the deflected slab is calculated as a shell with the shape corresponding
to the deflection.
As for non-deflected slabs it is interesting to investigate if the axes of rotation correspond to the
neutral axes. Of course, the stresses are not known in the upper bound solution, but if we assume
that the concrete stresses equal fc in the direction of the displacement and the reinforcement stresses
equal fy it is found that the axes of rotation correspond to the neutral axes.
Calculations verifying this result are usually very complicated since the direction of the
displacement changes along the yield line area. However, some simple cases may be used to
demonstrate the result.
A square slab with Φ0x=Φ0x´=0.25, Φ0y=Φ0y´=0.25, hcx/h= hcx´/h= hcy/h= hcy´/h=0 is used here to
demonstrate the result mentioned. The calculations of this slab lead to the results shown in Figure
7.60 to Figure 7.62.
0 0.5 1 1.5 20
0.1
0.2
0.3
0.4
0.5
0.6
0.7
0.8
0.9
1
q
u/h
q1q2Ingerslev modified1Ingerslev modified2
Figure 7.61 Load-carrying capacity for a rectangular slab Lx=2000mm, Ly=2000mm, Φ0x=Φ0x´=0.25, Φ0y=Φ0y´=0.25,
hcx/h= hcx´/h= hcy/h= hcy´/h=0, fc=30MPa, σx and σy=0

Tim Gudmand-Høyer
- 59 -
0 0.5 1 1.5 20
5
10
15
20
25
30
35
40
45
50
u/h
diff
%
Figure 7.62 Difference between the load-carrying capacity for a non-deflected and a deflected rectangular slab with
Lx=2000mm, Ly=2000mm, Φ0x=Φ0x´=0.25, Φ0y=Φ0y´=0.25, hcx/h= hcx´/h= hcy/h= hcy´/h=0, fc=30MPa, σx and σy=0
0 0.5 1 1.5 20
0.1
0.2
0.3
0.4
0.5
0.6
0.7
0.8
0.9
1
h x/h a
nd h
y/h
u/h
q1q2Ingerslev modified1Ingerslev modified2
Figure 7.63 Position of the axes of rotation for failure mode 2 for a rectangular slab Lx=2000mm, Ly=2000mm,
Φ0x=Φ0x´=0.25, Φ0y=Φ0y´=0.25, hcx/h= hcx´/h= hcy/h= hcy´/h=0, fc=30MPa, σx and σy=0.

Yield line Theory for Concrete Slabs Subjected to Axial Force
- 60 -
It appears that the axes of rotation move downward as the deflection increases. For the situation
where u/h equals 2 it is seen that the relative position of axes of rotation is 1. This situation is
illustrated in Figure 7.64.
From a projection equation in the x-direction it appears that if u/h =2 and hx=hy=h the degree of
reinforcement becomes:
0
0
½ ½½ 2 ½2
0.25
cc
f h L f h L= Φ ⇔
Φ = (7.70)
This corresponds to the degree of reinforcement used in the calculations.
½ ½½ 2cf h L
Φ0fch½LΦ0´fch½½L
Φ0´fch½½L
Figure 7.64 Failure mode for a square deflected slab.
Similar observations may be made for slabs with axial force. In Figure 7.65 to Figure 7.67 the
results of calculations for a square slab with Φ0x=Φ0x´=0.15, Φ0y=Φ0y´=0.15, hcx/h= hcx´/h= hcy/h=
hcy´/h=0 and σy=σx=0.1fc are shown. It appears that the axes of rotation correspond to the neutral
axes.

Tim Gudmand-Høyer
- 61 -
0 0.5 1 1.5 20.32
0.34
0.36
0.38
0.4
0.42
0.44
0.46
0.48
q
u/h
q1q2Ingerslev modified1Ingerslev modified2
Figure 7.65 Load-carrying capacity for a rectangular slab Lx=2000mm, Ly=2000mm, Φ0x=Φ0x´=0.15, Φ0y=Φ0y´=0.15,
hcx/h= hcx´/h= hcy/h= hcy´/h=0, fc=30MPa, σx=σy=0.1fc
0 0.5 1 1.5 2-10
-5
0
5
10
15
20
25
u/h
diff
%
Figure 7.66 Difference between the load-carrying capacity for a non-deflected and a deflected rectangular slab with
Lx=2000mm, Ly=2000mm, Φ0x=Φ0x´=0.15, Φ0y=Φ0y´=0.15, hcx/h= hcx´/h= hcy/h= hcy´/h=0, fc=30MPa, σx=σy=0.1fc

Yield line Theory for Concrete Slabs Subjected to Axial Force
- 62 -
0 0.5 1 1.5 20
0.1
0.2
0.3
0.4
0.5
0.6
0.7
0.8
0.9
1
h x/h a
nd h
y/h
u/h
q1q2Ingerslev modified1Ingerslev modified2
Figure 7.67 Position of the axes of rotation for failure mode 2 for a rectangular slab Lx=2000mm, Ly=2000mm,
Φ0x=Φ0x´=0.15, Φ0y=Φ0y´=0.15, hcx/h= hcx´/h= hcy/h= hcy´/h=0, fc=30MPa, σx=σy=0.1fc.
One might suspect that the assumption about the axes of rotation being the same as the neutral axes
is only valid for isotropic slabs. However, numerical calculations as the one shown in Figure 7.68 to
Figure 7.70, show that this is not the case. In the calculations the reinforcement is orthotropic and
the slab is only subjected to axial load in one direction (Φ0x=Φ0x´=0.15, Φ0y=Φ0y´=0.25, hcx/h=
hcx´/h= hcy/h= hcy´/h=0 and σy=0, σx=0.1fc). Since the axial load equals the difference in the
reinforcement the slab behaves as if the reinforcement was isotropic.

Tim Gudmand-Høyer
- 63 -
0 0.5 1 1.5 20.35
0.4
0.45
0.5
0.55
0.6
0.65
0.7
q
u/h
q1q2Ingerslev modified1Ingerslev modified2
Figure 7.68 Load-carrying capacity for a rectangular slab Lx=2000mm, Ly=2000mm, Φ0x=Φ0x´=0.15, Φ0y=Φ0y´=0.25,
hcx/h= hcx´/h= hcy/h= hcy´/h=0, fc=30MPa, σx=0.1fc, σy=0
0 0.5 1 1.5 20
5
10
15
20
25
30
35
40
u/h
diff
%
Figure 7.69 Difference between the load-carrying capacity for a non-deflected and a deflected rectangular slab with
Lx=2000mm, Ly=2000mm, Φ0x=Φ0x´=0.15, Φ0y=Φ0y´=0.25, hcx/h= hcx´/h= hcy/h= hcy´/h=0, fc=30MPa, σx=0.1fc, σy=0

Yield line Theory for Concrete Slabs Subjected to Axial Force
- 64 -
0 0.5 1 1.5 20
0.1
0.2
0.3
0.4
0.5
0.6
0.7
0.8
0.9
1
h x/h a
nd h
y/h
u/h
q1q2Ingerslev modified1Ingerslev modified2
Figure 7.70 Position of the axes of rotation for failure mode 2 for a rectangular slab Lx=2000mm, Ly=2000mm,
Φ0x=Φ0x´=0.15, Φ0y=Φ0y´=0.25, hcx/h= hcx´/h= hcy/h= hcy´/h=0, fc=30MPa, σx=0.1fc, σy=0.
Since the calculations are made numerically it is not possible to prove strictly that the axes of
rotation and the neutral axes are identical. However, assuming that the contribution to the
dissipation from the concrete may be calculated according to the simplified formulas given in
section 7.1.1, it may be shown that the axes of rotation corresponds to the neutral axes.
Ly
Lx
Failure mode 2
σx
σy
Dx
Lx
hcx´
Dx
hcx
Ly
hcy´
hcy
Φ0x´hfc
Φ0xhfc
Φ0y´hfc
Φ0yhfc
u
u
Figure 7.71. Yield pattern and cross sections.

Tim Gudmand-Høyer
- 65 -
For a failure mode as the one shown in Figure 7.71 the calculations becomes as follows.
The external work:
( )1 1 2 22 3 2 2
2 2
e x y x x y x y y y x xyx x
h hW q D L L D L h L h h L h LL Dδ δδ σ σ = + − + − + − −
(7.71)
The internal work becomes:
( ) ( )
( ) ( )
( ) ( )
( )
2
0
0
2
0
1 1 12 3 2
2 1´ ´ ´ 2
2 12
1 1 12 3 22
´2
x x x x
x x x x cx x x cxy
i c x x x cx x x cx x
y y y y
x xy
L D u h u u L h u
h L D h u h D h u hL
W f h L D h h u h D h h u h
L u h u u L h u
L DhL
δ
δ
− − + + −
+Φ − − − + − − = +Φ − − + − + − + −
− + + − + −
+Φ 01 1´2 2y y cy y y cy yh u h hL h h u h
− − + Φ − − −
(7.72)
The load-carrying capacity becomes:

Yield line Theory for Concrete Slabs Subjected to Axial Force
- 66 -
2
22
0 0
2
2 2
0 0
24 1
1 2
1 ´ 1 1
1 11 12 2
´
c
x y x x
x x x
yx x xx x
x x c xx
x x x
x x
y y xy y
x xy
f hqL L D D
L L L
D D DL L f Lh
h D h Duh L h L
L LL L fh
h
σ
σ
= ⋅
− + +
Φ − + Φ − + + −
+ − + −
Φ − Φ +
+
2
2 2
0
2
0
2
0 0
1 12 2
1 11 12 2
´ ´1 1´2 2
1 1 ´2
y
c x
y y y
x x
x cx x cxx
x x
cx x cx xx
x x
y cy yy y
x
LL
L h Luh L h L
D h D hu uL h L h h h
h D h Du uh h L h h L
L h LuL h h L
+ −
+Φ − + − + + − +Φ + − −
+Φ + − + Φ
2
2 2 22
´12
1 1 1 1 1 112 2 2 6 3 6
cy
x
y y yx x x x
c x c x x x x
huh h
L LD D Duf L f L h L L L
σ σ
+ + − + − + − − + −
(7.73)
The minimum load-carrying capacity is found for:
0 0
0
1 1 ´2
x
yx xx x
c x
dqhdh
h Duh f h L
σ
= ⇒
= + + + Φ − Φ
(7.74)
0 0
0
1 ´2
y
y xy y
c
dqh
dh
h uh f h
σ
= ⇒
= + + Φ − Φ
(7.75)
It appears that the axes of rotation correspond to the neutral axes for each slab part since the
minimization leads to the same result as a projection equation. Similar calculations may be made for
other positions of the axes of rotation and deflections and they all show that the axes of rotation
correspond to the neutral axes.

Tim Gudmand-Høyer
- 67 -
For a given axial stress and deflection it is thus possible to determine the axes of rotation and
thereby also the dissipation in the yield line (the simplified dissipation according to the K.W.
Johansen’s method).
The following equations are obtained from a projection equation of a deflected section of a slab, as
shown in Figure 7.72.
½L ½D
hc
y0
Φ0´hfc
Φ0hfc
u hc
σ
Figure 7.72. Cross-section of a deflected slab subjected to axial load.
The projection equation used for the determination of the compression zone depends on both the
deflection and the compression zone it self. This means that there are quite a lot of intervals to
consider. They may all be seen in 11.2.An example is given below for the situation where 0<u<hc
& hc´<u+ hc´<h+ hc & h-hc<u+h-hc<h.
if 0<u<hc & hc´<u+ hc´<h+ hc & h-hc<u+h-hc<h
and 0≤=y0<u
0
2 1 '
1
c
D uL h fy
DhL
σ − + Φ + Φ =
−
(7.76)
and u≤y0<hc
0 1 2 2 ´ 22 c
y u u Dh f h h L
σ = + Φ + Φ + +
(7.77)
and hc≤y0<u+hc
2
0
-1- 2 ´ 4 ´ 112 -2 ´ 2 ´ -
c
c
hD u u DL h f h h Ly
D uhL h
σ + − + Φ +Φ + Φ − =
Φ + Φ (7.78)

Yield line Theory for Concrete Slabs Subjected to Axial Force
- 68 -
and u+hc=y0
1 1 1 1- -́2 ´ - - - ´2 2 2 2
c c
c
h hD u D D uL h L h f L h h
σ + Φ Φ Φ + ≤ ≤ Φ + + Φ
(7.79)
and u+hc<y0<h-hc
0 1 1´2 2c
y u u Dh f h h L
σ = − Φ +Φ + +
(7.80)
and h-hc≤y0<h-hc+u
2
0
1 -1- - -́ 2 - 2 1-2
-2 1- -
c
c
hD u u DL h f h h Ly
D uhL h
σ + + Φ Φ + Φ Φ =
Φ
(7.81)
and h-hc+u≤y0<h
0 1- -́ 12c
y u Dh f h L
σ = Φ Φ + +
(7.82)
and u+h-hc=y0
1 11- ´ 1- - 2 1- ´ 1-2 2
c c
c
h hD u D D uL h h L f L h h
σ + Φ +Φ + Φ ≤ ≤ + Φ +Φ +
(7.83)
and h<y0≤u+h
( )
2
0
1- - 2 1- ´ 1- -
1-
c
u D u D u Dh L h f L h Ly
DhL
σ + ± − Φ +Φ = (7.84)
The dissipation is most easily calculated as the dissipation per unit rotation about the neutral axes.
Using the K. W. Johansen method this may be done by taking moments about the rotation axes for
each slab part.
The moments are most easily calculated as contributions from the top and bottom reinforcement and
the concrete.
, , ' ,f f c f s f sM M M M= + + (7.85)
for Mf,c we get:
if u≤h
and y0≤u

Tim Gudmand-Høyer
- 69 -
3
, 02
-11-
12f c
c
DM y L
uf h L hh
+ =
(7.86)
and u<y0≤h
22 2
, 0 0 02
y y y1 u u u D u D-3 + -3 +2 +312 h h h h L h h L h
f c
c
Mf h L
= (7.87)
and h<y0≤h+u
22 3 2 30 0 0
2 30 0 0
,2
y y yu u u D u D u-3 + -3 +2 +3h h h h L h h L h h
y y y1 3 3 1h h h1
12f c
c
DLM
uf h Lh
+ − + − − = (7.88)
if u>h
and y0≤h
3
, 02
-11-12
f c
c
DM y L
uf h L hh
+ =
(7.89)
and h<y0≤u
20 0
,2
3 -3 11- -1
12f c
c
y yM D h h
uf h L Lh
+ = +
(7.90)
and u<y0≤h+u
22 3 2 30 0 0
2 30 0 0
,2
-3 -3 2 3
1 3 3 11
12f c
c
y y yu u u D u D uh h h h L h h L h h
y y y Dh h h LM
uf h Lh
+ + +
+ − + − − = (7.91)
for Mf,s’ we get:
if y0≤hc
, ' 0 0 02
1- ´ - 2 - 2 2 - 2 - 2 -4
f s c c c
c
M h y h y h yu u D D uf h L h h h h h h L L h h h
= Φ + + + +
(7.92)
if hc<y0≤u+hc

Yield line Theory for Concrete Slabs Subjected to Axial Force
- 70 -
2 220 0 0 0
, '2
-4 - 2 2 2 2 1- 2 -1 ´4
c c c c
f s
c
y h y h h y h yu u u D u D uh h h h h h h h h L h h h L hM
uf h Lh
+ + + + + + = Φ
(7.93)
if u+hc<y0≤h+u
, ' 0 0 02
1 ´ - 2 - 2 2 - 2 2 -4
f s c c c
c
M h y h y h yu u D D uf h L h h h h h h L L h h h
= Φ + − + + +
(7.94)
for Mf,s we get:
if y0≤h-hc
, 0 0 02
1- - 2 2 - 2 2 2 - 2 - 2 1 -4
f s c c c
c
M h y h y h yu u D D uf h L h h h h h h L L h h h
= Φ − + + − + − +
(7.95)
if h-hc<y0≤u+h-hc
, 0 02
2 20 0 0
-1/ 4 -1 -1/ 4 2 2 - 2 1- - 2 1- _ -
-2 - 2 4 4 - 2 - 4 1--1/ 4
f s c c
c
c c c
M y h h yD u D Du hf h L L h h h L h h L
y h y h y h Dh h h h h h L
uh
= Φ Φ + +
+ + Φ
(7.96)
if u+h-hc<y0≤h+u
, 0 0 02
1- - 2 2 - 2 2 2 - 2 - 2 1 -4
f s c c c
c
M h y h y h yu u D D uf h L h h h h h h L L h h h
= Φ − + + − + − +
(7.97)
From the formulas above the load-carrying capacity may be found as:
Failure mode 1:
The internal work becomes:
2 2
2 2 2
i fy fxx y y
W M ML L Dδ δ= +
− (7.98)
The external work becomes:
( )( )
11 1 - 2 - 2 -1 12 2 2 2
2 2
e y x y y x x y y y x x
x y y
h hW q D L L D L h L h h L hL L D
δ δδ σ σ = + + + −
(7.99)
The work equation leads to:

Tim Gudmand-Høyer
- 71 -
( ) ( )2 2 2 2 2 2 2
1, 2
2
02 22
1, 2
-2 2 - 2 - 2 - - 2 212
- 2
2 -2 2 1-12
fx x x y y x y y y x y x y y y x x y x fy y fy yeq
y y x y y
fx y fy y yx x x x
y c x c c c y y c yeq c
y
M L hL h hL h D h L h L D hL h h L M L M Dq
L D L D L
or
M y M DL LL f h L f h f f h L L f Lhq f
L
σ σ σ σ σ σ
σσ σ
+ + + +=
+ +
+ + + +
=
2
0
2
1 2
1- 2
x
y yx
y y y
yh
D DLL L L
−
+
(7.100)
A similar formula is obtained for failure mode 2: 2 2
002 22
2, 22
2 -2 2 1- 1 212
1- 2
y fy y y fx y yx x x
x c y c c c x x c xeq c
x yx x
x x x
L M M L yy DL f h L f h f f h L L f L hhq f
L LD DL L L
σ σ σ + + + + −
=
+
(7.101)
For a given slab having a certain deflection and failure mode (u and D/L) it is now possible to
calculate the load-carrying capacity without making any numerical integrations. This leads of
course to a substantial reduction of the calculations since a theoretically correct calculation involves
integration over the yield line (the Ls-part).
In the following, the index ,eq indicates that the axes of the rotation are found from equilibrium of a
slab part as described above. The index ,up indicates that the axes of rotation is found numerically
from the minimum of upper bound solutions.
In order to find the minimum load-carrying capacity for a given deflection the most optimal failure
mode has to be found.
In Figure 7.73 to Figure 7.75 and Figure 7.76 to Figure 7.78 the results of calculations for a square
slab with axial force in two direction are shown for σ/fc=0.1 and σ/fc=0.4 respectively. In these plots
both the results of the simplified way of calculating the load-carrying capacity (index eq) and the
results of the numerical calculations (index up) are shown. Index 1 and 2 refers to the yield line
pattern.
In Figure 7.75 the contributions from reinforcement (index s) and concrete (index c) to the work are
plotted and thereby showing the difference between the two calculation methods.

Yield line Theory for Concrete Slabs Subjected to Axial Force
- 72 -
0 0.2 0.4 0.6 0.8 10
0.05
0.1
0.15
0.2
0.25
0.3
0.35
0.4
D/L
q [M
Pa]
q1,eqq1,eqminq1,upq1,upmin
Figure 7.73.Results of calculations by equations (7.76) to (7.101) (solid) and numerical calculations (dashed) on a slab
with Lx=Ly= 2000mm,Φ0x=Φ0x´=Φ0y=Φ0y´=0.1,hc/h=0.1, h=60mm, fc=50MPa, u/h=1 and σx/fc=σy/fc=0.1.
0 0.2 0.4 0.6 0.8 10
10
20
30
40
50
60
70
80
90
100
D/L
h
hx1,eqhy1,eqhx1,uphy1,up
Figure 7.74.Results of calculations by equations (7.76) to (7.101) (solid) and numerical calculations (dashed) on a slab
with Lx=Ly= 2000mm,Φ0x=Φ0x´=Φ0y=Φ0y´=0.1,hc/h=0.1, h=60mm, fc=50MPa, u/h=1 and σx/fc=σy/fc=0.1.

Tim Gudmand-Høyer
- 73 -
0 0.2 0.4 0.6 0.8 10
1
2
3
4
5
6
7
8
9
10 x 105
D/L
Wi/ω
Wiq1,eqWicq1,eqWisq1,eqWiq1,upWicq1,upWisq1,up
Figure 7.75.Results of calculations by equations (7.76) to (7.101) (solid) and numerical calculations (dashed) on a slab
with Lx=Ly= 2000mm,Φ0x=Φ0x´=Φ0y=Φ0y´=0.1,hc/h=0.1, h=60mm, fc=50MPa, u/h=1 and σx/fc=σy/fc=0.1.
0 0.2 0.4 0.6 0.8 10
0.05
0.1
0.15
0.2
0.25
0.3
0.35
0.4
D/L
q [M
Pa]
q1,eqq1,eqminq1,upq1,upmin
Figure 7.76.Results of calculations by equations (7.76) to (7.101) (solid) and numerical calculations (dashed) on a slab
with Lx=Ly= 2000mm,Φ0x=Φ0x´=Φ0y=Φ0y´=0.1,hc/h=0.1, h=60mm, fc=50MPa, u/h=1 and σx/fc=σy/fc=0.4.

Yield line Theory for Concrete Slabs Subjected to Axial Force
- 74 -
0 0.2 0.4 0.6 0.8 10
10
20
30
40
50
60
70
80
90
100
D/L
h
hx1,eqhy1,eqhx1,uphy1,up
Figure 7.77.Results of calculations by equations (7.76) to (7.101) (solid) and numerical calculations (dashed) on a slab
with Lx=Ly= 2000mm,Φ0x=Φ0x´=Φ0y=Φ0y´=0.1,hc/h=0.1, h=60mm, fc=50MPa, u/h=1 and σx/fc=σy/fc=0.4.
0 0.2 0.4 0.6 0.8 10
1
2
3
4
5
6
7
8
9
10 x 105
D/L
Wi/ω
Wiq1,eqWicq1,eqWisq1,eqWiq1,upWicq1,upWisq1,up
Figure 7.78.Results of calculations by equations (7.76) to (7.101) (solid) and numerical calculations (dashed) on a slab
with Lx=Ly= 2000mm,Φ0x=Φ0x´=Φ0y=Φ0y´=0.1,hc/h=0.1, h=60mm, fc=50MPa, u/h=1 and σx/fc=σy/fc=0.4.

Tim Gudmand-Høyer
- 75 -
In the case σ/fc=0.1 it is seen that the agreement is very good for both the load-carrying capacity
and the internal work per unit deflection increase even though the position of the axes of rotation is
not quite the same. Part of the error is of course due to the limited accuracy of the numerical
calculations. Despite this it is seen that the position of the axes of rotation has the right performance
but not entirely the correct value. The same conclusions may be made when the axial force is
increased to σ/fc=0.4.
As described previously it may be proven that equalizing the axes of rotation with the neutral axes
leads to the minimum load-carrying capacity if the concrete contribution to the dissipation is
calculated in the simplified way. It may be seen in these plots that it is not quite the same if the
correct dissipation formulas are used but the results are close enough to furnish the correct load-
carrying capacity.
It is previously shown that the simplified way of calculating the concrete contribution to the
dissipation is less accurate for small values of the angle v and for large differences between the
positions of the two axes of rotation. A difference in the axial force in the two directions leads to a
difference in the position of the axes of rotation. Therefore, it is expected that the agreement is less
good if the slab is only subjected to axial force in one direction. Results of calculations for such a
case may be seen in Figure 7.79 to Figure 7.80.
It appears that the agreement is good. It is also seen that the simplified calculations lead to both
over- and underestimations for different values of D/L in failure mode 2. However, it is also seen
that the minimum load-carrying capacity is almost the same. It is therefore believed that the
simplified method is sufficiently accurate for practical purposes.

Yield line Theory for Concrete Slabs Subjected to Axial Force
- 76 -
0 0.2 0.4 0.6 0.8 10
0.05
0.1
0.15
0.2
0.25
0.3
0.35
0.4
D/L
q [M
Pa]
q1,eqq1,eqminq1,upq1,upmin
0 0.2 0.4 0.6 0.8 10
0.05
0.1
0.15
0.2
0.25
0.3
0.35
0.4
D/L
q [M
Pa]
q2,eqq2,eqminq2,upq2,upmin
Figure 7.79.Results of calculations by equations (7.76) to (7.101) (solid) and numerical calculations (dashed) on a slab
with Lx=Ly= 2000mm,Φ0x=Φ0x´=Φ0y=Φ0y´=0.01,hc/h=0.1, h=60mm, fc=50MPa, u/h=1 and σx/fc=0.4, σy/fc=0.

Tim Gudmand-Høyer
- 77 -
0 0.2 0.4 0.6 0.8 10
10
20
30
40
50
60
70
80
90
100
D/L
h
hx1,eqhy1,eqhx1,uphy1,up
0 0.2 0.4 0.6 0.8 10
10
20
30
40
50
60
70
80
90
100
D/L
h
hx2,eqhy2,eqhx2,uphy2,up
Figure 7.80. Results of calculations by equations (7.76) to (7.101) (solid) and numerical calculations (dashed) on a slab
with Lx=Ly= 2000mm,Φ0x=Φ0x´=Φ0y=Φ0y´=0.01,hc/h=0.1, h=60mm, fc=50MPa, u/h=1 and σx/fc=0.4, σy/fc=0.

Yield line Theory for Concrete Slabs Subjected to Axial Force
- 78 -
0 0.2 0.4 0.6 0.8 10
1
2
3
4
5
6
7
8
9
10 x 105
D/L
Wi/ω
Wiq1,eqWicq1,eqWisq1,eqWiq1,upWicq1,upWisq1,up
0 0.2 0.4 0.6 0.8 10
1
2
3
4
5
6
7
8
9
10 x 105
D/L
Wi/ω
Wiq2,eqWicq2,eqWisq2,eqWiq2,upWicq2,upWisq2,up
Figure 7.81 Results of calculations by equations (7.76) to (7.101) (solid) and numerical calculations (dashed) on a slab
with Lx=Ly= 2000mm,Φ0x=Φ0x´=Φ0y=Φ0y´=0.01,hc/h=0.1, h=60mm, fc=50MPa, u/h=1 and σx/fc=0.4, σy/fc=0

Tim Gudmand-Høyer
- 79 -
7.6 Interaction curves
It is obvious that the load-carrying capacity must be determined as the minimum for all values of
D/L. How the load-carrying capacity should be determined in relation to the deflection is a question
somewhat more difficult to answer.
In Figure 7.82 the results of calculations of the load-carrying capacity as a function of the deflection
are shown.
0 50 100 1500
0.02
0.04
0.06
0.08
0.1
0.12
0.14
0.16
0.18
0.2
u
q [M
Pa]
q1 eqq1min eqq2 eqq2min eqq1 upq1min upq2 upq2min up
Figure 7.82 Results of calculations by equations (8.2) to (7.101) (solid) and numerical calculations (dashed) on a slab
with Lx=Ly= 2000mm,Φ0x=Φ0x´=Φ0y=Φ0y´=0.01,hc/h=0.1, h=60mm, fc=50MPa and σx/fc=0.4 or 0.2, σy/fc=0
For low axial force it is seen that the load-carrying capacity has a minimum with respect to the
deflection. For higher axial force the load-carrying capacity decreases as the deflection increases.
Assuming that the slab is perfectly rigid plastic it is obvious that the load-carrying capacity is the
maximum of the load carrying capacities found for different deflections. Nevertheless, taking into
consideration the actual behaviour of a concrete slab it is equally obvious that the plastic behaviour
does not give the correct picture for a non-deflected slab. A more thorough investigation would take
into account the actual behaviour of the concrete to determine the deflection at failure but such
calculations would be cumbersome.
Instead the minimum value with respect to the deflection may be used. This is of course
conservative.
σx/fc=0.2
σx/fc=0.4

Yield line Theory for Concrete Slabs Subjected to Axial Force
- 80 -
Using the minimum value with respect to both D/L and the deflection, it is possible to calculate an
interaction curve giving the load-carrying capacity for combinations of axial load and lateral load.
Results from calculations with both methods are plotted in Figure 7.85 and
Figure 7.88. Figure 7.85 shows results for a slab with axial force in one direction and
Figure 7.88 shows results for a slab with axial force in two directions. In both cases the deflection is
determined in the one corresponding to the minimum of the load-carrying capacity. It should be
noted that the results are obtained through numerical calculations and that the maximum deflection
is set at 110mm.
0 0.05 0.1 0.15 0.20
0.05
0.1
0.15
0.2
0.25
0.3
0.35
0.4
0.45
0.5
q [MPa]
σ /(f c(1
+Φ+Φ
´))
q1,eqq2,eqq1,upq2,up
Figure 7.83 Results of calculations by equations (8.2) to (7.101) (solid) and numerical calculations (dashed) on a slab
with Lx=Ly= 2000mm,Φ0x=Φ0x´=Φ0y=Φ0y´=0.1,hc/h=0.1, h=60mm, fc=50MPa, σy/fc=0.
q1
q2

Tim Gudmand-Høyer
- 81 -
0 20 40 60 80 100 1200
0.05
0.1
0.15
0.2
0.25
0.3
0.35
0.4
0.45
0.5
u [mm]
σ /(f c(1
+Φ+Φ
´))
u1,equ2,equ1,upu2,up
Figure 7.84 Results of calculations by equations (8.2) to (7.101) (solid) and numerical calculations (dashed) on a slab
with Lx=Ly= 2000mm,Φ0x=Φ0x´=Φ0y=Φ0y´=0.1,hc/h=0.1, h=60mm, fc=50MPa, σy/fc=0.
0 0.2 0.4 0.6 0.8 10
0.05
0.1
0.15
0.2
0.25
0.3
0.35
0.4
0.45
0.5
DyLy
σ /(f c(1
+Φ+Φ
´))
Dy/Ly 1,eqDx/Lx 2,eqDy/Ly 1,upDx/Lx 2,up
Figure 7.85. Results of calculations by equations (8.2) to (7.101) (solid) and numerical calculations (dashed) on a slab
with Lx=Ly= 2000mm,Φ0x=Φ0x´=Φ0y=Φ0y´=0.1,hc/h=0.1, h=60mm, fc=50MPa, σy/fc=0.
Dy/Ly

Yield line Theory for Concrete Slabs Subjected to Axial Force
- 82 -
0 0.05 0.1 0.15 0.20
0.05
0.1
0.15
0.2
0.25
0.3
0.35
0.4
0.45
0.5
q [MPa]
σ /(f c(1
+Φ+Φ
´))
q1,eqq2,eqq1,upq2,up
Figure 7.86Results of calculations by equations (8.2) to (7.101) (solid) and numerical calculations (dashed) on a slab
with Lx=Ly= 2000mm,Φ0x=Φ0x´=Φ0y=Φ0y´=0.1,hc/h=0.1, h=60mm, fc=50MPa, σy=σx
0 20 40 60 80 100 1200
0.05
0.1
0.15
0.2
0.25
0.3
0.35
0.4
0.45
0.5
u [mm]
σ /(f c(1
+Φ+Φ
´))
u1,equ2,equ1,upu2,up
Figure 7.87Results of calculations by equations (8.2) to (7.101) (solid) and numerical calculations (dashed) on a slab
with Lx=Ly= 2000mm,Φ0x=Φ0x´=Φ0y=Φ0y´=0.1,hc/h=0.1, h=60mm, fc=50MPa, σy=σx.
q1
q2

Tim Gudmand-Høyer
- 83 -
0 0.2 0.4 0.6 0.8 10
0.05
0.1
0.15
0.2
0.25
0.3
0.35
0.4
0.45
0.5
DyLy
σ /(f c(1
+Φ+Φ
´))
Dy/Ly 1,eqDx/Lx 2,eqDy/Ly 1,upDx/Lx 2,up
Figure 7.88. Results of calculations by equations (8.2) to (7.101) (solid) and numerical calculations (dashed) on a slab
with Lx=Ly= 2000mm,Φ0x=Φ0x´=Φ0y=Φ0y´=0.1,hc/h=0.1, h=60mm, fc=50MPa, σy=σx.
These figures (Figure 7.83 to Figure 7.88) confirm that using the neutral axes as the axes of rotation
and combining this assumption with the simplified way of calculating the dissipation lead to a load-
carrying capacity close to the theoretically correct one. This goes for slabs subjected to axial force
in both one and two directions. It is also seen that the failure form (D/L) and the deflection at failure
is not found to be the same in the two methods. Nevertheless, the most important issue here is the
load-carrying capacity and it is seen that this is quite accurate.
For rectangular slabs with a Lx/Ly ratio different from one, the simplified calculation method is not
as good as for the square slabs. Examples of this may be seen in Figure 7.89 to Figure 7.95
Dy/Ly

Yield line Theory for Concrete Slabs Subjected to Axial Force
- 84 -
0 0.05 0.1 0.15 0.2 0.25 0.3 0.35 0.40
0.05
0.1
0.15
0.2
0.25
q1
σ /(f c(1
+Φ+Φ
´))
q1,eqq2,eqq1,upq2,up
Figure 7.89. Results of calculations by equations (8.2) to (7.101) (solid) and numerical calculations (dashed) on a slab
with Lx=2000mm, Ly=1000mm,Φ0x=Φ0x´=Φ0y=Φ0y´=0.1,hc/h=0.1, h=60mm, fc=50MPa, σy=σx.
0 0.2 0.4 0.6 0.8 10
0.05
0.1
0.15
0.2
0.25
DyLy
σ /(f c(1
+Φ+Φ
´)) Dy/Ly 1,eqDx/Lx 2,eqDy/Ly 1,upDx/Lx 2,up
Figure 7.90 Results of calculations by equations (8.2) to (7.101) (solid) and numerical calculations (dashed) on a slab
with Lx=2000mm, Ly=1000mm,Φ0x=Φ0x´=Φ0y=Φ0y´=0.1,hc/h=0.1, h=60mm, fc=50MPa, σy=σx.
q1
q2
Dy/Ly

Tim Gudmand-Høyer
- 85 -
0 50 100 150 2000
0.05
0.1
0.15
0.2
0.25
u [mm]
σ /(f c(1
+Φ+Φ
´))
u1,equ2,equ1,upu2,up
Figure 7.91 Results of calculations by equations (8.2) to (7.101) (solid) and numerical calculations (dashed) on a slab
with Lx=2000mm, Ly=1000mm,Φ0x=Φ0x´=Φ0y=Φ0y´=0.1,hc/h=0.1, h=60mm, fc=50MPa, σy=σx.
0 0.05 0.1 0.15 0.2 0.25 0.3 0.35 0.40
0.05
0.1
0.15
0.2
0.25
q [MPa]
σ /(f c(1
+Φ+Φ
´))
q1,eqq2,eqq1,upq2,up
Figure 7.92 Results of calculations by equations (8.2) to (7.101) (solid) and numerical calculations (dashed) on a slab
with Lx=2000mm, Ly=1000mm,Φ0x=Φ0x´=Φ0y=Φ0y´=0.1,hc/h=0.1, h=60mm, fc=50MPa, σy=0.
q1
q2

Yield line Theory for Concrete Slabs Subjected to Axial Force
- 86 -
0 0.2 0.4 0.6 0.8 10
0.05
0.1
0.15
0.2
0.25
DyLy
σ /(f c(1
+Φ+Φ
´))
Dy/Ly 1,eqDx/Lx 2,eqDy/Ly 1,upDx/Lx 2,up
Figure 7.93 Results of calculations by equations (8.2) to (7.101) (solid) and numerical calculations (dashed) on a slab
with Lx=2000mm, Ly=1000mm,Φ0x=Φ0x´=Φ0y=Φ0y´=0.1,hc/h=0.1, h=60mm, fc=50MPa, σy=0.
0 50 100 1500
0.05
0.1
0.15
0.2
0.25
u [mm]
σ /(f c(1
+Φ+Φ
´))
u1,equ2,equ1,upu2,up
Figure 7.94 Results of calculations by equations (8.2) to (7.101) (solid) and numerical calculations (dashed) on a slab
with Lx=2000mm, Ly=1000mm,Φ0x=Φ0x´=Φ0y=Φ0y´=0.1,hc/h=0.1, h=60mm, fc=50MPa, σy=0.
Dy/Ly

Tim Gudmand-Høyer
- 87 -
0 0.05 0.1 0.15 0.2 0.25 0.3 0.35 0.40
0.05
0.1
0.15
0.2
0.25
0.3
0.35
0.4
q [MPa]
σ /(f c(1
+Φ+Φ
´))
q1,eqq2,eqq1,upq2,up
Figure 7.95. Results of calculations by equations (8.2) to (7.101) (solid) and numerical calculations (dashed) on a slab
with Lx=2000mm, Ly=1000mm,Φ0x=Φ0x´=Φ0y=Φ0y´=0.1,hc/h=0.1, h=60mm, fc=50MPa, σx=0.
0 0.2 0.4 0.6 0.8 10
0.05
0.1
0.15
0.2
0.25
0.3
0.35
0.4
DyLy
σ /(f c(1
+Φ+Φ
´))
Dy/Ly 1,eqDx/Lx 2,eqDy/Ly 1,upDx/Lx 2,up
Figure 7.96 Results of calculations by equations (8.2) to (7.101) (solid) and numerical calculations (dashed) on a slab
with Lx=2000mm, Ly=1000mm,Φ0x=Φ0x´=Φ0y=Φ0y´=0.1,hc/h=0.1, h=60mm, fc=50MPa, σx=0.
q1
q2
Dy/Ly

Yield line Theory for Concrete Slabs Subjected to Axial Force
- 88 -
0 50 100 150 2000
0.05
0.1
0.15
0.2
0.25
0.3
0.35
0.4
u [mm]
σ /(f c(1
+Φ+Φ
´))
u1,equ2,equ1,upu2,up
Figure 7.97 Results of calculations by equations (8.2) to (7.101) (solid) and numerical calculations (dashed) on a slab
with Lx=2000mm, Ly=1000mm,Φ0x=Φ0x´=Φ0y=Φ0y´=0.1,hc/h=0.1, h=60mm, fc=50MPa, σx=0.
It may be seen that the simplified calculations underestimate the load-carrying capacity somewhat
for rectangular slabs with axial force in both directions and also for rectangular slabs with axial
force perpendicular to the longer side. Nevertheless, it is believed that the simplified calculation
method is still useful due to the simplicity of the calculations.
From the interaction curves it appears that the curve at a certain level of axial force almost makes a
cut off. At this point the deflection actually goes towards infinity. In these figures the deflection is
limited to 170mm in order to keep the number of calculations at a reasonable level. This axial force
corresponds to stability failure. The slab may carry the load in a non-deflected state but a small
deflection would lead to collapse of the slab.
In an actual slab the level of stability found in this way is of course not quite correct since the slab
may be far from a plastic state close to the non-deflected state and only gets closer to plastic states
as the deflection increases. Therefore, a cut off level as the one seen in the interaction diagram
Figure 7.92 may not be expected to be verified by experiments.

Tim Gudmand-Høyer
- 89 -
8 Theory compared with tests
Only a few experimental investigations have been made on simply supported slabs subjected to both
lateral and transverse loads. A. O. Aghayere and J. G. MacGregor (see [4]) made a test series, but
because of the variation of many parameters (reinforcement ratio, concrete strength ect.) these tests
are not very useful for the verification of the theory. Instead some of the tests made by L. Z. Hansen
and T. Gudmand-Høyer (see[6]) are used.
The main data are given in Table 8.1 and Table 8.2. Equation Section (Next)
No fc Ec fY e h Layer Asx hcx ρ0x l x hcy Asy ρ0y l y
[MPa] [MPa] [MPa] [mm] [mm] [mm2/m] [mm] [ ] [mm] [mm] [mm2/m] [ ] [mm]
3 60,4 18081 593 0 61,66 1 523,6 35 0,008 2000 25 523,6 0,0085 20004 59,5 17425 593 0 62,03 1 523,6 35 0,008 2000 25 523,6 0,0084 20005 58,8 17662 593 0 61,63 1 523,6 35 0,008 2000 25 523,6 0,0085 20006 64,6 18688 593 0 61,37 1 523,6 35 0,009 2000 25 523,6 0,0085 20007 64,0 18466 593 0 61,26 1 523,6 35 0,009 2000 25 523,6 0,0085 20008 61,4 17718 593 0 60,99 1 523,6 35 0,009 2000 25 523,6 0,0086 20009 66,7 18744 593 0 61,56 1 523,6 35 0,009 2000 25 523,6 0,0085 200016 66,7 19394 593 0 61,48 1 523,6 35 0,009 2000 25 523,6 0,0085 2000
Table 8.1. The data of the reinforced slabs.
No q Nx u Notes[kN/m2] [kN/m] [mm]
3 74,5 0,0 78 Material failure4 21,5 1084,1 29 Rig failure5 33,2 462,9 53 Stability failure6 25,1 653,3 46 Stability failure7 41,5 436,0 61 Stability failure8 16,7 800,0 42 Stability failure9 8,5 1103,4 17 Material failure16 25,1 1030,1 37 Material failure
Table 8.2. The results of the tests.
The following calculation are made for a slab with fc=60MPa, fy=593MPa, h=60mm, hcm/h=0.5,
Lx=Ly=2000mm, Φ’x=Φ’y=0.0085fy/fc, Φx=Φy=0 if nothing else is mentioned.
If the conservative simplified method proposed in the previous chapter is used to calculate the load-
carrying capacity for the slabs tested the results in Figure 8.1 to Figure 8.3 are obtained.

Yield line Theory for Concrete Slabs Subjected to Axial Force
- 90 -
0 0.05 0.1 0.150
500
1000
1500
2000
2500
3000
q [MPa]
Nx [k
N]
q1,eqq2,eqq1,upq2,upExp
Figure 8.1 Results of calculations for a slab with fc=60MPa, fy=593MPa, h=60mm, hcm/h=0.5, Lx=Ly=2000mm,
Φ’x=Φ’y=0.0085fy/fc, Φx=Φy=0 and ν=1.
0 20 40 60 80 100 1200
500
1000
1500
2000
2500
3000
u [mm]
Nx [k
N]
u1,equ2,equ1,upu2,upExp
Figure 8.2 Results of calculations for a slab with fc=60MPa, fy=593MPa, h=60mm, hcm/h=0.5, Lx=Ly=2000mm,
Φ’x=Φ’y=0.0085fy/fc, Φx=Φy=0 and ν=1.
q1
q2

Tim Gudmand-Høyer
- 91 -
0 0.2 0.4 0.6 0.8 10
500
1000
1500
2000
2500
3000
D/L
Nx [k
N]
Dy/Ly 1,eqDx/Lx 2,eqDy/Ly 1,upDx/Lx 2,up
Figure 8.3 Results of calculations for a slab with fc=60MPa, fy=593MPa, h=60mm, hcm/h=0.5, Lx=Ly=2000mm,
Φ’x=Φ’y=0.0085fy/fc, Φx=Φy=0 and ν=1.
It is obvious that the theoretical load-carrying capacity is much too high. This is of course expected
since it is known that the concrete does not behave entirely according to plastic theory so an
effectiveness factor should therefore be introduced.
Besides from the load-carrying capacity being much too high, also the deflection is wrong. Not only
is it wrong when it comes to the numerical value but also when it comes to the relation between
axial force and deflection. The experiments shows that the deflection decreases as the axial force
increases and the conservative method of calculation shows the opposite relation. This tendency is
also expected to a certain extent. For instance it is obvious that for no axial force the conservative
method of calculation corresponds to zero deflection whereas in the tests the slabs of course will
have some deflection.
In order to determine the effectiveness factor, interaction curves are found using the measured
deflection (an approximate line close to the measured points). In Figure 8.4 and Figure 8.5 the
results are shown for both ν=1 and ν=0.45 (fc is set to 0.45•60MPa)

Yield line Theory for Concrete Slabs Subjected to Axial Force
- 92 -
0 0.02 0.04 0.06 0.08 0.10
500
1000
1500
2000
2500
3000
q [MPa]
Nx [k
N]
q1,eqq2,eqq1,upq2,upExp
Figure 8.4. Effectivenessfactor ν=0.45 or ν=1. Results of calculations for a slab with fc=60MPa, fy=593MPa,
h=60mm, hcm/h=0.5, Lx=Ly=2000mm, Φ’x=Φ’y=0.0085fy/fc, Φx=Φy=0.
0 10 20 30 40 50 60 70 800
500
1000
1500
2000
2500
3000
u [mm]
Nx [k
N]
u1,equ2,equ1,upu2,upExp
Figure 8.5 Results of calculations for a slab with fc=60MPa, fy=593MPa, h=60mm, hcm/h=0.5, Lx=Ly=2000mm,
Φ’x=Φ’y=0.0085fy/fc, Φx=Φy=0.
It is seen that if ν is set to 0.45 the calculations are in good agreement with the experiments.
ν=0,45
ν=1

Tim Gudmand-Høyer
- 93 -
This effectiveness factor is quite small compared to the effectiveness factors normally used in
calculations of moment capacities (approx. 0.85). In evaluation of such an effectiveness factor one
should keep in mind that the strains in the yield lines may be far from the yield strains. Assuming
that the yield strain for concrete is 2 ‰ and that the yield strain is 1,465‰ for the reinforcement the
deflection at the midpoint would approximately be
21 2 1.465 2000 6610 30 1000mu mm+= =
⋅ (8.1)
if the stresses in the mid section should be close to the yield stresses. Keeping in mind that a
deflection of 66mm only leads to yielding in the top of the compression zone in the midpoint and
not in the remaining parts of the yield line, it may seem reasonable that the effectiveness factor of
the magnitude found above has to be used.
If ν is set to 0.45 and the conservative simplified method is used to calculate the load-carrying
capacity, Figure 8.6 and Figure 8.7 are obtained.
0 0.02 0.04 0.06 0.08 0.10
500
1000
1500
2000
2500
3000
q [MPa]
Nx [k
N]
q1,eqq2,eqq1,upq2,upExp
Figure 8.6. Results of calculations for a slab with fc=60MPa, fy=593MPa, h=60mm, hcm/h=0.5, Lx=Ly=2000mm,
Φ’x=Φ’y=0.0085fy/fc, Φx=Φy=0 and ν=0.45.

Yield line Theory for Concrete Slabs Subjected to Axial Force
- 94 -
0 20 40 60 80 1000
500
1000
1500
2000
2500
3000
u [mm]
Nx [k
N]
u1,equ2,equ1,upu2,upExp
Figure 8.7. Results of calculations for a slab with fc=60MPa, fy=593MPa, h=60mm, hcm/h=0.5, Lx=Ly=2000mm,
Φ’x=Φ’y=0.0085fy/fc, Φx=Φy=0 and ν=0.45.
It is seen that this approximation does not lead to useful results since the deviation from the tests is
very large.
Another approach could be to use the deflection corresponding to yielding in mid-section (in this
case 66mm) for all axial forces. A similar approach is used in calculations of reinforced concrete
columns and one might suspect that it might give useful results for slabs as well. Results using this
approximation may be seen in Figure 8.8 and Figure 8.9.
It appears that the results are closer to the values from tests. Nevertheless, these results only
represent one slab type and further investigations and tests have to be made in order to verify the
approach.

Tim Gudmand-Høyer
- 95 -
0 0.02 0.04 0.06 0.08 0.10
500
1000
1500
2000
2500
3000
q [MPa]
Nx [k
N]
q1,eqq2,eqq1,upq2,upExp
Figure 8.8. Results of calculations for a slab with fc=60MPa, fy=593MPa, h=60mm, hcm/h=0.5, Lx=Ly=2000mm,
Φ’x=Φ’y=0.0085fy/fc, Φx=Φy=0 and ν=0.45.
0 20 40 60 80 1000
500
1000
1500
2000
2500
3000
u [mm]
Nx [k
N]
u1,equ2,equ1,upu2,upExp
Figure 8.9. Results of calculations for a slab with fc=60MPa, fy=593MPa, h=60mm, hcm/h=0.5, Lx=Ly=2000mm,
Φ’x=Φ’y=0.0085fy/fc, Φx=Φy=0 and ν=0.45.

Yield line Theory for Concrete Slabs Subjected to Axial Force
- 96 -
These comparisons with test results show that the theory developed may be used if the deflection at
failure is known and a proper effectiveness factor is introduced.
If the deflection at failure is unknown the conservative simplified method may be used but it will
lead to a large underestimation for low axial forces.
Using a deflection corresponding to the yield strain in concrete and reinforcement in the mid section
for all levels of axial force seems to lead to reasonable agreement with tests.
From a critical point of view it may be said that this way of calculating the load-carrying capacity
does not lead to any simple and useful calculation since the deflection has to be known from either
experiments or from calculations that involve a much more detailed description of the behaviour of
concrete.

Tim Gudmand-Høyer
- 97 -
9 Conclusion
In this paper it is shown that calculations of the load-carrying capacity of rectangular slabs using the
K.W. Johansen method agree with a calculation based on the correct dissipation formulas that is
sufficiently correct for practical purposes.
Furthermore, it is shown that for a deflected rectangular slab with axial force the load-carrying
capacity may be calculated in the same way if the axes of rotation correspond to the neutral axes of
the slab parts.
Only rectangular slabs have been treated here but the agreement between the concrete contribution
to the dissipation calculated according to the K.W. Johansen method and according to the correct
dissipation formulas for a Coulomb material has been investigated in general. It is shown that if the
corner angle w is larger than 1/2π the Johansen simplification underestimates the dissipation and if
w is less than 1/2π the simplification overestimates the dissipation.
Only tests with seven rectangular slabs with axial force in one direction have been used for
verification of the theory and the conclusions are therefore not general. Furthermore, it should be
noted that due to the small number of tests no great effort has been made in order to determine the
effectiveness factor ν.
However, it has been shown that if a proper effectiveness factor is used, the calculations seem to be
in good agreement under the condition that the deflection at failure is known.
A conservative approach using the minimum load-carrying capacity for all deflections leads to a
large underestimation in some cases and thus can only be recommended as a rough estimate.
If the deflection corresponding to yield strains of the concrete and the reinforcement is used for all
levels of axial force, predictions of the load-carrying capacity seem to be reasonable.

Yield line Theory for Concrete Slabs Subjected to Axial Force
- 98 -
10 Literature
The list is ordered by year.
[1] JOHANSEN, K.W., Brudlinieteorier (Yield line theories), Copenhagen, Gjellerup, 1943.
[2] CALLADINE, C.R., Simple Ideas in the Large-Deflection Plastic Theory of Plates and
Slabs, Engineering Plasticity, HEYMAN J. and LECKIE, F. A. eds. , pp. 93-127,
Cambridge, Cambridge University Press, 1968
[3] NIELSEN, M. P. and RATHKJEN, A.: Mekanik 5.1. Del 2 Skiver og plader, Danmarks
Ingeniørakadami, Bygningsafdelingen, Aalborg, Den Private Ingeniørfond, 1981.
[4] AGHAYERE, A. O. and MACGREGOR, J. G., Test of reinforced Concrete Plates under
Combined In-Plane and Transverse Loads, ACI Structural Journal, V. 87, No. 6, pp. 615-
622, 1990
[5] NIELSEN, M. P.: Limit Analysis and Concrete Plasticity, Second Edition, CRC Press,
1998
[6] HANSEN, L. Z., GUDMAND-HØYER, T.: Instability of Concrete Slabs, Department of
Structural Engeneering and Materials, R-042, ISSN 1601-2917, ISBN 87-7877-101-3,
Technical University of Denmark, 2001

Tim Gudmand-Høyer
- 99 -
11 Appendix
11.1.1 Results of calculations for different slabs
11.1.1.1 Square slab without axial force
0 0.2 0.4 0.6 0.8 10
0.05
0.1
0.15
0.2
0.25
0.3
Dy/Ly
q
24mp/L2
q1
0 0.2 0.4 0.6 0.8 10
0.1
0.2
0.3
0.4
0.5
0.6
0.7
0.8
0.9
1
Dy/Lyh x/h
hx/hhy/h
Figure 11.1. Load-carrying capacity q1 for a square slab with L=2000mm, Φ0=Φ0´=0.1, hc/h= hc´/h=0.1, fc=30MPa
(solid) and load-carrying capacity according to (7.39) (dashed) at the left hand side and position of the axes of rotation
at the right hand side.
0 0.2 0.4 0.6 0.8 10
0.02
0.04
0.06
0.08
0.1
0.12
0.14
0.16
Dy/Ly
q
24mp/L2
q1
0 0.2 0.4 0.6 0.8 10
0.1
0.2
0.3
0.4
0.5
0.6
0.7
0.8
0.9
1
Dy/Ly
h x/h
hx/hhy/h
Figure 11.2. Load-carrying capacity q1 for a square slab with L=2000mm, Φ0=Φ0´=0.05, hc/h= hc´/h=0.2, fc=30MPa
(solid) and load-carrying capacity according to (7.39) (dashed) at the left hand side and position of the axes of rotation
at the right hand side.

Yield line Theory for Concrete Slabs Subjected to Axial Force
- 100 -
0 0.2 0.4 0.6 0.8 10
0.05
0.1
0.15
0.2
0.25
Dy/Ly
q
24mp/L2
q1
0 0.2 0.4 0.6 0.8 10
0.1
0.2
0.3
0.4
0.5
0.6
0.7
0.8
0.9
1
Dy/Ly
h x/h
hx/hhy/h
Figure 11.3. Load-carrying capacity q1 for a square slab with L=2000mm, Φ0=Φ0´=0.1, hc/h= hc´/h=0.2, fc=30MPa
(solid) and load-carrying capacity according to (7.39) (dashed) at the left hand side and position of the axes of rotation
at the right hand side.
11.1.1.2 Rectangular slab without axial force
0 0.2 0.4 0.6 0.8 10
0.02
0.04
0.06
0.08
0.1
Φ0x=Φ0x´0.1,Φ0y=Φ0y´=0.1,fc=30MPa,h=100mm,hc/h=0.1,Lx=2000mm and Ly=16000mm
Dy/Ly for q1 or Dx/Lx for q2
q in
MP
a
q1q2Ingerslev
0 0.2 0.4 0.6 0.8 1
0
0.1
0.2
0.3
0.4
0.5
0.6
0.7
0.8
0.9
1
Dy/Ly
h x/h
hx/hhy/h
Figure 11.4. Load-carrying capacity q1 for a rectangular slab Lx=2000mm, Ly=16000mm, Φ0x=Φ0x´=Φ0y=Φ0y´=0.1,
hcx/h= hcx´/h= hcy/h= hcy´/h=0.1, fc=30MPa (solid) and load-carrying capacity according to (7.48) or (7.50) at the left
hand side and position of the axes of rotation at the right hand side.
0 0.2 0.4 0.6 0.8 10
0.01
0.02
0.03
0.04
0.05
0.06
Φ0x=Φ0x´0.05,Φ0y=Φ0y´=0.05,fc=30MPa,h=100mm,hc/h=0.2,Lx=2000mm and Ly=16000mm
Dy/Ly for q1 or Dx/Lx for q2
q in
MP
a
q1q2Ingerslev
0 0.2 0.4 0.6 0.8 10
0.1
0.2
0.3
0.4
0.5
0.6
0.7
0.8
0.9
1
Dy/Ly
h x/h
hx/hhy/h
Figure 11.5. Load-carrying capacity q1 for a rectangular slab Lx=2000mm, Ly=16000mm, Φ0x=Φ0x´=Φ0y=Φ0y´=0.05,
hcx/h= hcx´/h= hcy/h= hcy´/h=0.2, fc=30MPa (solid) and load-carrying capacity according to (7.48) or (7.50) at the left
hand side and position of the axes of rotation at the right hand side.

Tim Gudmand-Høyer
- 101 -
0 0.2 0.4 0.6 0.8 10
0.01
0.02
0.03
0.04
0.05
0.06
Φ0x=Φ0x´0.1,Φ0y=Φ0y´=0.05,fc=30MPa,h=100mm,hc/h=0.2,Lx=2000mm and Ly=16000mm
Dy/Ly for q1 or Dx/Lx for q2
q in
MP
a
q1q2Ingerslev
0 0.2 0.4 0.6 0.8 1
0
0.1
0.2
0.3
0.4
0.5
0.6
0.7
0.8
0.9
1
Dy/Ly
h x/h
hx/hhy/h
Figure 11.6. Load-carrying capacity q1 for a rectangular slab Lx=2000mm, Ly=16000mm, Φ0x=Φ0x´=0.1,
Φ0y=Φ0y´=0.05, hcx/h= hcx´/h= hcy/h= hcy´/h=0.2, fc=30MPa (solid) and load-carrying capacity according to (7.48) or
(7.50) at the left hand side and position of the axes of rotation at the right hand side.
0 0.2 0.4 0.6 0.8 10
0.05
0.1
0.15
0.2
0.25
0.3
Φ0x=Φ0x´0.9,Φ0y=Φ0y´=0.1,fc=30MPa,h=100mm,hc/h=0.1,Lx=2000mm and Ly=4800mm
Dy/Ly for q1 or Dx/Lx for q2
q in
MP
a
q1q2Ingerslev
0 0.2 0.4 0.6 0.8 1
0
0.1
0.2
0.3
0.4
0.5
0.6
0.7
0.8
0.9
1
Dy/Ly
h x/h
hx/h for q1hy/h for q1
Figure 11.7. Load-carrying capacity q1 for a rectangular slab Lx=2000mm, Ly=4800mm, Φ0x=Φ0x´=0.7,
Φ0y=Φ0y´=0.1, hcx/h= hcx´/h= hcy/h= hcy´/h=0.1, fc=30MPa (solid) and load-carrying capacity according to (7.48) or
(7.50) at the left hand side and position of the axes of rotation at the right hand side.
0 0.2 0.4 0.6 0.8 10
0.05
0.1
0.15
Φ0x=Φ0x´0.3,Φ0y=Φ0y´=0.05,fc=30MPa,h=100mm,hc/h=0.1,Lx=2000mm and Ly=4800mm
Dy/Ly for q1 or Dx/Lx for q2
q in
MP
a
q1q2Ingerslev
0 0.2 0.4 0.6 0.8 1
0
0.1
0.2
0.3
0.4
0.5
0.6
0.7
0.8
0.9
1
Dy/Ly
h x/h
hx/h for q1hy/h for q1
Figure 11.8. Load-carrying capacity q1 for a rectangular slab Lx=2000mm, Ly=4800mm, Φ0x=Φ0x´=0.3,
Φ0y=Φ0y´=0.05, hcx/h= hcx´/h= hcy/h= hcy´/h=0.1, fc=30MPa (solid) and load-carrying capacity according to (7.48) or
(7.50) at the left hand side and position of the axes of rotation at the right hand side.

Yield line Theory for Concrete Slabs Subjected to Axial Force
- 102 -
11.1.1.3 Rectangular slab with axial force
0 0.2 0.4 0.6 0.8 1 1.20
0.05
0.1
0.15
0.2
0.25
0.3
0.35
0.4
σx/fc
qq1q2Ingerslev modified
0 0.2 0.4 0.6 0.8 1 1.2 1.40
5
10
15
20
25
30
35
40
σx/fc
diff
%
|qIngerslev mod.-min(q1,q2)|/min(q1,q2)*100%
0 0.2 0.4 0.6 0.8 1 1.20
0.1
0.2
0.3
0.4
0.5
0.6
0.7
0.8
0.9
1
σx/fc
Dy/L
y or D
x/Lx
Dy/Ly for q1Dx/Lx for q2Ingerslev
0 0.2 0.4 0.6 0.8 1 1.20
0.1
0.2
0.3
0.4
0.5
0.6
0.7
0.8
0.9
1
σx/fc
h x/h o
r hy/h
hx/h for q1hy/h for q1Ingerslev modified
0 0.2 0.4 0.6 0.8 1 1.20
0.1
0.2
0.3
0.4
0.5
0.6
0.7
0.8
0.9
1
σx/fc
h x/h o
r hy/h
hx/h for q2hy/h for q2Ingerslev modified
Figure 11.9. Load-carrying capacity (top left hand side), difference between the calculation methods (top right hand
side), length of the part of the yield line parallel to the axes of rotation (middle left hand side), position of the axes of
rotation for failure mode 1(middle left hand side) and position of the axes of rotation for failure mode 2(bottom) for a
rectangular slab Lx=2000mm, Ly=2000mm, Φ0x=Φ0x´=0.1, Φ0y=Φ0y´=0.1, hcx/h= hcx´/h= hcy/h= hcy´/h=0.1, fc=30MPa,
increasing σx and σy=0.

Tim Gudmand-Høyer
- 103 -
0 0.2 0.4 0.6 0.8 1 1.20
0.05
0.1
0.15
0.2
0.25
0.3
0.35
0.4
σx/fc
q
q1q2Ingerslev modified
0 0.2 0.4 0.6 0.8 1 1.2-100
-80
-60
-40
-20
0
20
40
60
80
100
σx/fc
diff
%
(qIngerslev mod.-min(q1,q2))/min(q1,q2)*100%
0 0.2 0.4 0.6 0.8 1 1.20
0.1
0.2
0.3
0.4
0.5
0.6
0.7
0.8
0.9
1
σx/fc
Dy/L
y or D
x/Lx
Dy/Ly for q1Dx/Lx for q2Ingerslev
0 0.2 0.4 0.6 0.8 1 1.20
0.1
0.2
0.3
0.4
0.5
0.6
0.7
0.8
0.9
1
σx/fc
h x/h o
r hy/h
hx/h for q1hy/h for q1Ingerslev modified
0 0.2 0.4 0.6 0.8 1 1.20
0.1
0.2
0.3
0.4
0.5
0.6
0.7
0.8
0.9
1
σx/fc
h x/h o
r hy/h
hx/h for q2hy/h for q2Ingerslev modified
Figure 11.10. Load-carrying capacity (top left hand side), difference between the calculation methods (top right hand
side), length of the part of the yield line parallel to the axes of rotation (middle left hand side), position of the axes of
rotation for failure mode 1(middle left hand side) and position of the axes of rotation for failure mode 2(bottom) for a
rectangular slab Lx=2000mm, Ly=16000mm, Φ0x=Φ0x´=0.1, Φ0y=Φ0y´=0.1, hcx/h= hcx´/h= hcy/h= hcy´/h=0.1,
fc=30MPa, increasing σx and σy=0.
11.2 Calculations of the compression depth
if 0<u<hc & hc´<u+ hc´<h+ hc & h-hc<u+h-hc<h
and 0≤y0<u

Yield line Theory for Concrete Slabs Subjected to Axial Force
- 104 -
0
2 1 '
1
c
D uL h fy
DhL
σ − + Φ + Φ =
−
(8.2)
and u≤y0<hc
0 1 2 2 ´ 22 c
y u u Dh f h h L
σ = + Φ + Φ + +
(8.3)
and hc≤y0<u+hc
2
0
-1- 2 ´ 4 ´ 112 -2 ´ 2 ´ -
c
c
hD u u DL h f h h Ly
D uhL h
σ + − + Φ +Φ + Φ − =
Φ + Φ (8.4)
and u+hc=y0
1 1 1 1- -́2 ´ - - - ´2 2 2 2
c c
c
h hD u D D uL h L h f L h h
σ + Φ Φ Φ + ≤ ≤ Φ + + Φ
(8.5)
and u+hc<y0<h-hc
0 1 1´2 2c
y u u Dh f h h L
σ = − Φ +Φ + +
(8.6)
and h-hc≤y0<h-hc+u
2
0
1 -1- - -́ 2 - 2 1-2
-2 1- -
c
c
hD u u DL h f h h Ly
D uhL h
σ + + Φ Φ + Φ Φ =
Φ
(8.7)
and h-hc+u≤y0<h
0 1- -́ 12c
y u Dh f h L
σ = Φ Φ + +
(8.8)
and u+h-hc=y0
1 11- ´ 1- - 2 1- ´ 1-2 2
c c
c
h hD u D D uL h h L f L h h
σ + Φ +Φ + Φ ≤ ≤ + Φ +Φ +
(8.9)
and h<y0≤u+h

Tim Gudmand-Høyer
- 105 -
( )
2
0
1- - 2 1- ´ 1- -
1-
c
u D u D u Dh L h f L h Ly
DhL
σ + ± − Φ +Φ = (8.10)
if hc´<u<h-hc & hc´<u+ hc´<h+ hc & h<u+h-hc
and 0≤y0<hc
0
2 1- ´
1-
c
D uL h fy
DhL
σ + Φ +Φ = (8.11)
and hc≤y0<u
2
0
1- 2 ´ 2 1- 2 ´ 2 ´ 1- ´
1
c
c
hD D D uL L h L f hy
DhL
σ Φ + Φ + Φ + Φ + Φ + =
− (8.12)
and u≤y0<u+hc
2
0
1 -1- ´ - 2 ´ 12
-2 ´ 1 -
c
c
hD u u DL h f h h Ly
D uhL h
σ − + Φ +Φ Φ − =
Φ −
(8.13)
and u+hc=y0
1 11- - 2 -́ ´ 1- ´2 2
c c
c
h hD u D D uL h L h f L h h
σ Φ Φ + + Φ ≤ ≤ − Φ + + Φ
(8.14)
and u+hc<y0<h-hc
0
c
y 1 u D= - ´+ + 1h f 2 h L
σ Φ Φ +
(8.15)
and h-hc≤y0<h
2
0
1 -1- - -́ 2 - 2 1-2
-2 1- -
c
c
hD u u DL h f h h Ly
D uhL h
σ + + Φ Φ + Φ Φ =
Φ
(8.16)
and h≤y0<u+h-hc

Yield line Theory for Concrete Slabs Subjected to Axial Force
- 106 -
( )
22
2 22
0
1 -́ 1 2 4 4 1-1- 2 1
-8 -8
1-
c
c
c
hD u DL f h h Lu D
h L hD D u DL L h h Ly
DhL
σ − Φ + Φ + + Φ + Φ + Φ − ± Φ Φ +
= (8.17)
and u+h-hc=y0
2 21 1- 1- - 1-2 21- ´ - 2 1- ´
c c
c c
c
h hD Dh hD D Dh L h L
u uL h L f L hh h
σ
+ Φ +Φ Φ + ≤ ≤ + Φ +Φ + (8.18)
and u+h-hc<y0≤u+h
2
0
1- 2 1- 1- ´ -
1-
c
u D u D u Dh L h L f h Ly
DhL
σ + ± + Φ +Φ = (8.19)
if hc´<u<h-hc & h-hc<u+ hc´<h & h<u+h-hc
and 0≤y0<hc
0
2 1- ´
1-
c
D uL h fy
DhL
σ ± + Φ +Φ = (8.20)
and hc≤y0<u
( )2
0
2 ´ 1 2 1- 2 ´ 2 ´ 1- ´
-1
c
c
hD D u D uL L f h h L hy
DhL
σ Φ − + + Φ + Φ + Φ +Φ =
+ (8.21)
and u≤y0<h-hc
2
0
1 1 ´ 2 ´ 1-2
2 ´ 1-
c
c
hD u u DL h f h h Ly
D uhL h
σ + + + Φ +Φ + Φ =
Φ +
(8.22)
and u+hc=y0

Tim Gudmand-Høyer
- 107 -
( )4 - 2 - 4 21 1- - 2 ´ ´
2
4 - 2 - 4 21 1- - 2 ´2
c c
c
c
c c
c
h hD DhD u D h L h L
uL h L hh
fh hD D
hD u D h L h LuL h L hh
σ
Φ Φ Φ + Φ Φ + Φ + Φ +Φ + +
≤ ≤
Φ Φ Φ + Φ Φ + Φ +Φ + +
(8.23)
and h-hc<y0<u+hc
( )
2
0
1 1 ´ 2 - ´ 12
2 ´ 1
c c
c
h hD u u DL h f h h h Ly
D uhL h
σ + + + Φ +Φ + Φ + Φ + Φ − =
Φ + Φ − +
(8.24)
and u+hc≤y0<h
21 1 ´ 2 2 12
012 1
c
c
hD u u DL h f h h L
yD uL h
σ + + − Φ +Φ + Φ − Φ − =
Φ − +
(8.25)
and h≤y0<u+h-hc
22
2 22
0
2 2 - 2 2 ´ 1 4 4 12 1 1
-8 -8
1
c
c
c
hu u u u D Dh h f h h L h LD u D
L h L hD u D DL h L L hy
DhL
σ + Φ + Φ − + Φ + Φ + Φ − + + − ± Φ + Φ
=−
(8.26)
and u+h-hc=y0
2 21 11- 1-2 21- ´ - 2 1- ´
c c
c c
c
h hD Dh hD D Dh L h L
u uL h L f L hh h
σ
+ Φ +Φ Φ − ≤ ≤ + Φ +Φ − (8.27)
and u+h-hc<y0≤u+h
2
0
1- 2 1- ´ 1-
1-
c
u D u D u Dh L h f L h Ly
DhL
σ + ± + Φ +Φ + = (8.28)

Yield line Theory for Concrete Slabs Subjected to Axial Force
- 108 -
if h-hc<u<h & h <u+ hc´ & h<u+h-hc
and 0≤y0<hc
0
2 1- ´
1-
c
D uL h fy
DhL
σ + Φ +Φ = (8.29)
and hc≤y0<h-hc
2
0
2 ´ 1- 2 1- ´ 2 ´ 2 ´ 1-
1-
c
c
hD D u DL L h f h Ly
DhL
σ − Φ + + Φ + Φ + Φ + Φ = ± (8.30)
and h-hc≤y0<u
( )2 2
0
2 ´ 2 ´ - ´ 12 ´ 1 2 1-
´
1-
c c
c
h h Dh h LD D
L L uf hy
DhL
σ
Φ +Φ + Φ + Φ Φ Φ + Φ − Φ +Φ − ± + Φ + Φ + = (8.31)
and u+hc=y0
( )
2
2
1 11- -2 - 4 -2 2
1- ´ 1- 2
1 11- -2 - 4 -2 2
1- 1- 2 ´
c c c
c
c
c c c
c
h h hDL h h hhD D D
uL L h Lh
f
h h hDL h h hhD D D
uL L h Lh
σ
Φ + + Φ + + Φ + Φ +
≤ ≤
Φ + + Φ + + Φ + Φ +
(8.32)
and u<y0<h
( )
2
0
1 1 ´ 2 ´ 12
2 ´ 1
c c
c
h hD u u DL h f h h h Ly
D uhL h
σ + + + Φ +Φ + Φ + Φ − Φ − =
Φ + Φ − +
(8.33)

Tim Gudmand-Høyer
- 109 -
and h≤y0<u+hc
( )
22 2
2 2
2 2
0
1- 2 2
1 4 ´ 4 4 - 4 ´ 8 ´ 4 ´
1 -2 - 2 ´ 1 - 2 2 ´
8 - - ´ - ´ - ´
-16 ´
-1
c c
c
c c
D u uL h h
h hDL h h
D u D u uL h L h h f
h hDL h h
D u DL h Ly
Dh
σ
+ + Φ + + + Φ + Φ + Φ Φ + Φ Φ + Φ
+ Φ Φ − + + + − − Φ
+ Φ Φ Φ + Φ Φ
Φ Φ + =+
L
(8.34)
and u+hc≤y0<u+h-hc
2c c
c
2 22
0
D u D2 - -2 -1+L h L
h hu D D D2 ´+1+ - 1- 4 1 + -2h f L L h L h
+D u D-8 +L h Ly = Dh -1+
L
σ
Φ Φ
Φ Φ + Φ + Φ
Φ (8.35)
and u+h-hc=y0
2 21 11- 1-2 21- ´ - 2 - 1- ´ -
c c
c c
h hD Dh hD D Dh L h L
u uh L L h Lh h
+ Φ +Φ Φ ≤ + Φ +Φ (8.36)
and u+h-hc<y0≤u+h
2
0
- -1 2 1 1- ´
-1
c
u D u D u Dh L h L f h Ly
DhL
σ + + − + Φ +Φ + =+
(8.37)
if h <u & h<u+hc´ & h<u+h-hc
and 0≤y0<hc

Yield line Theory for Concrete Slabs Subjected to Axial Force
- 110 -
0
2 1- 2 ´
1-
c
D uL h fy
DhL
σ Φ +Φ + = (8.38)
and hc≤y0<h-hc
2
0
2 1 2 1- ´ 2 ´ 2 ´ 1
1-
c
c
hD D u DL L f h h Ly
DhL
σ − − ± + Φ +Φ + Φ + Φ − = (8.39)
and h-hc≤y0<h
( ) 2 2
0
2 - -́ 1 2 1- 2 1 ´ 2 ´ - ´ ´
1-
c c
c
h hD D D uL L L h h f hy
DhL
σ Φ Φ − ± − +Φ − Φ + Φ Φ Φ +Φ + Φ + +Φ + + Φ =
(8.40)
and u+hc=y0
2
2
1 1- - 4 - 2 12 2
1- - 2 - 2 ´ ´
1 1- - 4 - 2 12 2
1- - 2 ´
c c c
c
c
c c c
c
h h h Dh h h LhD D D D
uL L h L Lh
f
h h h Dh h h LhD D D
uL L h Lh
σ
+ Φ Φ − + Φ Φ +Φ + Φ +
≤ ≤
+ Φ Φ − + Φ + Φ + Φ +
(8.41)
and h<y0<u
( )
0
1´ 2 - 2 2 ´ 1-2
1- 2 ´ 2 1
c c
c
h hu Df h h h Ly
DhL
σ + Φ +Φ + + Φ Φ + Φ =
Φ + Φ +
(8.42)
and u≤y0<u+hc

Tim Gudmand-Høyer
- 111 -
2
2 2
2 2
0
2 - 2 - 2 -8 ´
2 4 - 4 ´ 2 ´ 4 ´ 2
8 ´ -8 4
- - 2 ´ 2 ´ - 2 -1 2 -4 ´ 8 ´ - 2 ´
-2 8 ´ 4 ´
c c
c c
c c c
c
D u u u D DL f h f h h L L
h hu u uh h h h h
h h hD D DL h L h L h
hu D D D D D D uh L L L L h L L h
u D u D Dh L h L L
yh
σ σ Φ Φ
+ Φ + Φ Φ + Φ + Φ +
+ Φ Φ + Φ
+ Φ + Φ Φ + Φ ± Φ + Φ Φ Φ
+ + Φ Φ + Φ
=
22
2 22 2 2 2 2
-8
4 4 4 ´ -8 ´ 4 ´
-16 ´
-1
DL
D D DL L L
DL
DL
Φ
+ Φ + Φ + Φ Φ + Φ
Φ Φ
+
(8.43)
and u+hc≤y0<u+h-hc
2 2 2
22 2 2
0
2 - 2 ´ 2 ´ 2
2 - 2 - 2 - 2
1- 2 2-8 4 4
4 -8 4
1-
c c
c c c
u u D u uh h L h h
u D u u D D uh L f f h h L L hD D u
h h hu D D DL L hh L L h h L h
D DL Ly
DhL
σ σ
Φ + Φ + Φ
+ Φ
+ Φ − Φ + ± + Φ + Φ + Φ
+ Φ Φ + Φ = (8.44)
and u+h-hc=y0
2
2
1- 1-21- ´ - 2
1- 1-21- ´
c
c
c
c
c
h DhD D h L
uL h Lh
f
h DhD h L
uL hh
σ
+ Φ +Φ Φ +
≤ ≤
+ Φ +Φ +
(8.45)
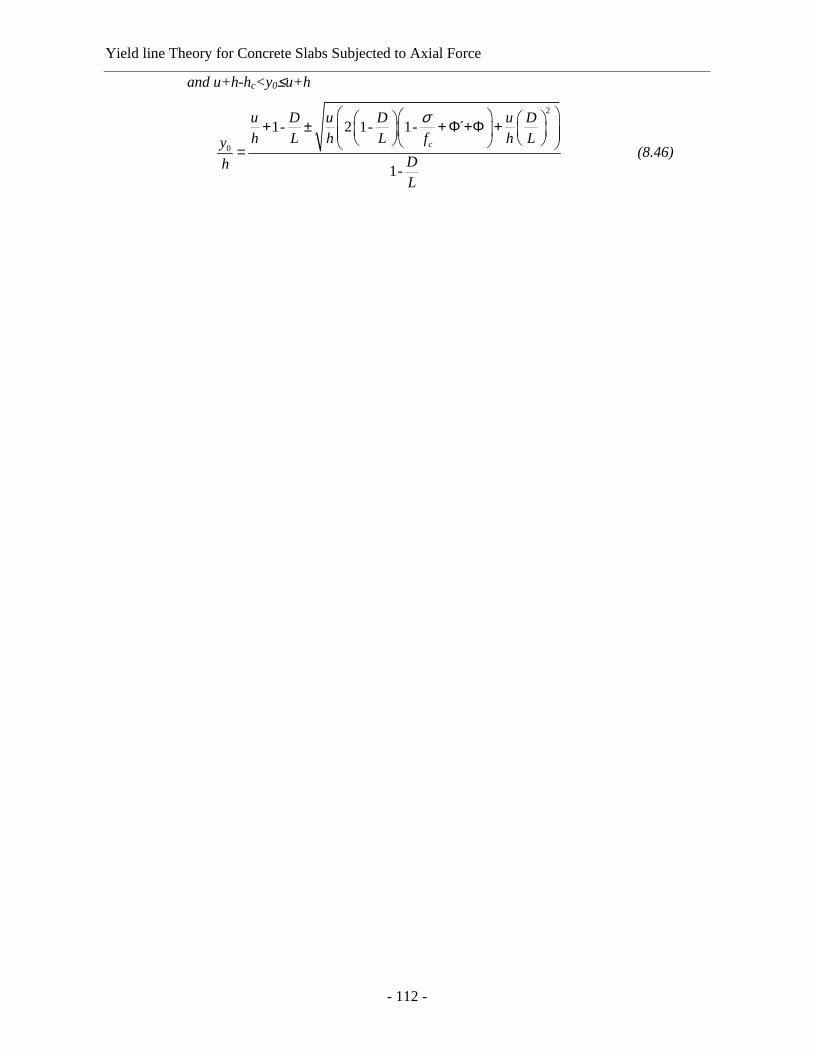
Yield line Theory for Concrete Slabs Subjected to Axial Force
- 112 -
and u+h-hc<y0≤u+h
2
0
1- 2 1- 1- ´
1-
c
u D u D u Dh L h L f h Ly
DhL
σ + ± + Φ +Φ + = (8.46)