yimei chan's data analysis work
TRANSCRIPT


Agenda
1. Data Reporting
Quick Learner of new systems & powerful Excel
Product Reports
Market Analysis
Opportunity Analysis
2. Data Analyser Development
Overview
Filters
3. Business Process Improvement
Product End-of-Life Monitor
Sample Control System

Data Reporting
Data Analyser Development
Business Process Improvement

4Data Reporting
• I joined D-Link in 2011 as a new user of QlikView, a data software.
• Soon I went on to manipulate the data and established various analysis functions:
Product reports
Market analysis
Opportunity analysis
Advanced user of Excel with VBA
Extract Data
Data Feeding Data Reporting
Analyse Data
• Within two weeks I took
over all routine work to
extract QlikView data.• My team praised me as a
“magic wand” to turn data
into commercial insights.
Quick learner of
new systems
• And I used the data to
conduct monthly price
benchmarking.

5Data Reporting
Product Report
Outliers deleted from the dataset for best results
Max. and min. prices indicated for a holistic overview
Reports heavily used Pivot Tables
The data as shown has been modified from its source as the original data is proprietary to D-Link.
Users can select any product(s) to customise results
Applicable for various analysis purposes

6Data Reporting
Market Analysis The data as shown has been modified from its source as the original data is proprietary to D-Link.
EU 11ac Market Report as at October 2013
Outliers deleted from the dataset for best results
Quantity/price displayed clearly and concisely
Max. and min. prices indicated for a holistic overview
A pricy but hot selling product identified!
Data bars give country breakdown
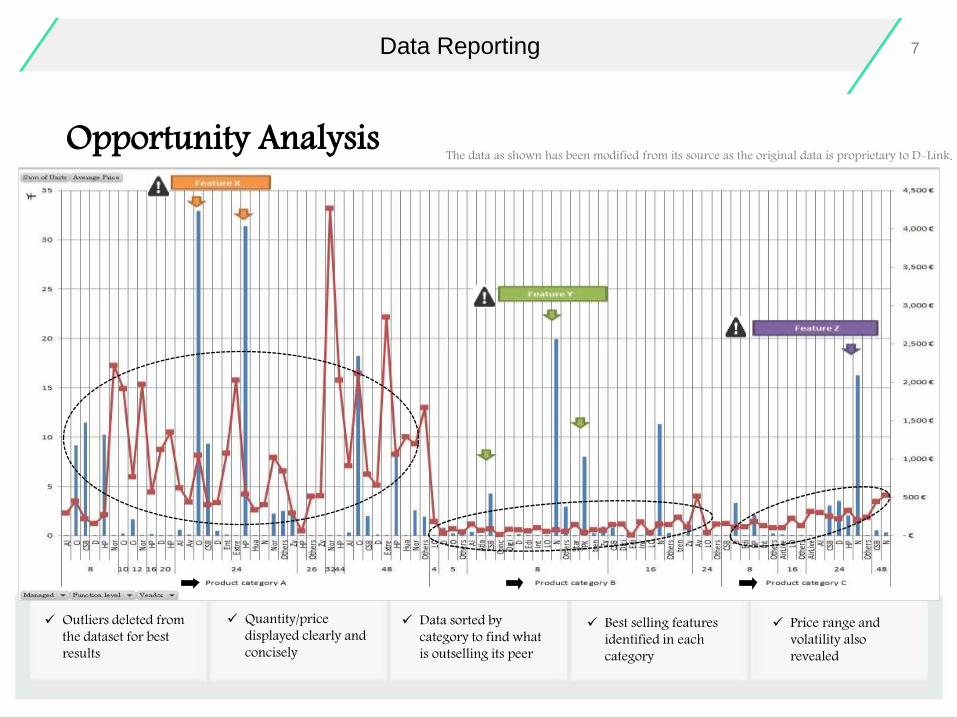
7Data Reporting
Opportunity Analysis The data as shown has been modified from its source as the original data is proprietary to D-Link.
Outliers deleted from the dataset for best results
Quantity/price displayed clearly and concisely
Data sorted by category to find what is outselling its peer
Best selling features identified in each category
Price range and volatility also revealed

Data Reporting
Data Analyser Development
Business Process Improvement

9Data Analyser Development
• I went on to further manipulate the data and established various analysis functions:
Product report
Market analysis
Opportunity analysis
• My team praised me as a “magic wand” to turn data into commercial insights.
• I developed a macro-enhanced data analyser to compare yearly sales of any two products
• I also set up macro-enhanced Excel systems to streamline daily workflow
End-of-life monitor
Sample control system
Quick learner of new systems
Advanced user of Excel with VBA
Extract Data
Data Feeding Data Reporting Data Modelling and Utilisation
Develop Data SystemAnalyse Data
Business Process
Improvement
• I joined D-Link in 2011 as a new user of QlikView.
• Within two weeks I took
over all routine work to
extract QlikView data.
• And I used the data to
conduct monthly price
benchmarking.

10
The data as shown has been modified from its source as the original data is proprietary to D-Link.
Data Analyser Development
Data Analyser
VBA macro-enhanced
A clear and concise overview
User-friendly filters Users can customise charts as they need
I developed this tool to fully utiliseavailable data

11
The data as shown has been modified from its source as the original data is proprietary to D-Link.
Data Analyser Development
Overview
Or click on the button for a clear one-product view
Yearly sales data promptly shown in tables
Red lines indicate average prices
Bars show volume with country breakdown
Users select any two products to view comparison

12
The data as shown has been modified from its source as the original data is proprietary to D-Link.
Data Analyser Development
Filters
Users can opt to view a specific month of interest
Regions/products differentiated by multiple colours
Users can opt to view only specific countries
Users can also opt to view only one product
Bar chart gives the total; pie charts breakdown
Power of data brought to life!

Data Reporting
Data Analyser Development
Business Process Improvement

14
The data as shown has been modified from its source as the original data is proprietary to D-Link.
Business Process Improvement
End-of-life Monitor
It calculates how many months stock to remain
With instant flagging to advice action
Flagging thresholds made easily adjustable
A more efficient phasing-out workflow
I developed this macro-enhanced tool to minimise manual routine

15
The data as shown has been modified from its source as the original data is proprietary to D-Link.
Business Process Improvement
Sample Control
Inbound control: clear quantity and ship-out date
Outbound control: summary of allocations
Follow-up function fixed untraceable invoice problems
Data validation prevents typo mistakes
I developed this monitor to better sample control
More clarity and manageability
Business process improved at all levels

Thank you