yolisa yolande ludidi
TRANSCRIPT

EVALUATING THE EFFECT OF ACADEMIC LITERACY
INTERVENTION PROGRAMME ON THE SATAP ENGLISH SCORES
OF FIRST YEAR STUDENTSAT A UNIVERSITY IN THE
EASTERN CAPE PROVINCE, SOUTH AFRICA.
by
YOLISA YOLANDE LUDIDI
Student number: 753-460-4
Submitted in accordance with the requirements
for the degree of
MASTER OF EDUCATION
WITH SPECIALISATION IN ADULT EDUCATION
at the
UNIVERSITY OF SOUTH AFRICA
SUPERVISOR: DR. AT VAN SCHOOR
C0-SUPERVISOR: PROF.M.M.DICHABA
February 2015
i
Student number: 753-460-4
DECLARATION
I, Yolisa Yolande Ludidi, hereby declare that the dissertation entitled EVALUATING THE
EFFECT OF THE ACADEMIC LITERACY INTERVENTION PROGRAMME ON SATAP ENGLISH
SCORES AT A PUBLIC UNIVERSITY IN THE EASTERN CAPE is my own work and that it has
not been submitted before for any other degree or assessment at any other university.
I also declare that the sources I have used have been indicated, and I have adhered to the
correct referencing techniques and guidelines of the University of South Africa.
__________________________
Signature
Signed on the _________________day of_________________________2014
Butterworth, South Africa
DEDICATION

ii
This dissertation is dedicated, to the loving memory of my late parents, Soga and Saise Ludidi,
my daughter Onele, my son and daughter- in- law NqabomzikaSoga and Dr. Nolwazi (nee’)
Kwinana, my siblings Nomsa, Cikizwa and her husband Billy Tom, whose encouragement, support
and guidance have enabled me to fulfill my potential.
Father- E.W.Soga Ludidi
1915-1978
Mother- M.N Saise.Ludidi (nee’ Ntshona)
1925-2007

iii
ACKNOWLEDGEMENTS
I hereby acknowledge and express my sincere gratitude to the following people for their
assistance, leadership and unwavering support in guiding me to the completion of this research
report:
My supervisor, Dr. At Van Schoor and co-supervisor Prof.M.M.Dichaba for their continued
support, their constructive criticism, and guidance throughout the entire process of writing
this dissertation.
Mr. V.M. Dwayi for his encouragement and for providing an enabling environment at the
Centre for Learning and Teaching Development at Walter Sisulu University.
Miss Nandipa Gila my mentor, Drs. Fred. Mayanja and Leo Qupe for their continued
encouragement and support.
Walter Sisulu University for financial support.
The academic staff of the Centre for Learning and Teaching Development, in particular
the Campus Director, Ms. N. Ceza and the Academic Literacy Lecturer at Butterworth
Campus, Miss N. Dyakopu, for their participation and allowing me to conduct this study.
Ms. Cynthia Formson (UFH) for editing this research report.
The Library staff at Walter Sisulu University, especially Miss S.T. Cingo for her continued
technical support.
To my entire family and friends for their love, prayers and support throughout this study.
To the Almighty, who sustained me with His power to endure until the completion of this
study.

iv
EVALUATING THE EFFECT OF ACADEMIC LITERACY INTERVENTION PROGRAMME ON THE
SATAP ENGLISH TEST SCORES OF FIRST YEAR STUDENTS AT A UNIVERSITY IN THE
EASTERN CAPE PROVINCE, SOUTH AFRICA
STUDENT : Y.Y.Ludidi
DEGREE : Masters of Education-with specialisation in Adult Education
SUPERVISOR : Dr. W.A.Van Schoor
C0-SUPERVISOR: Prof.M.M. Dichaba
ABSTRACT
The effect of the academic literacy intervention programme on the SATAP English scores was
evaluated. This study begins as a longitudinal study in the Faculty of Science, Engineering and
Technology (FSET). 120 subjects from the Electrical, Civil, Building and Mechanical departments in the
FSET were randomly selected to serve as an experimental group. The research design employed a
quantitative methodology. Data was collected using the Standardised Assessment Tests for Access
and Placement (SATAP) English Test. The test was administered to the experimental group as a pre-
test and post-test measure at the beginning of the year and at the end of the year. The SPSS statistical
programme with frequency tables and graphs was utilised to analyse the data obtained. The results
indicated that the difference between the pre-test scores and the post-test scores was statistically
significant. The post-test scores were significantly higher than the pre-test ones. It was concluded that
the academic literacy intervention programme was effective in increasing the SATAP scores and
therefore addressed some of the language needs of students.
Key terms: academic support; academic literacy; students’ language needs; first year university
students; pretest and posttest; academic development; SATAP; extended studies; drop-out; academic
failure.
v
TABLE OF CONTENTS
Declaration i
Dedication ii
Acknowledgements iii
Abstract iv
CHAPTER 1: INTRODUCTION
1.1 Introduction and overview 1
1.2 Contextual background of the research 4
1.3 Relevance and importance of the study 6
1.4 Problem statement and research questions 7
1.5 Aim and objectives of the study 8
1.5.1 Aim of the research 8
1.5.2 Objectives of the study 8
1.6 Key theoretical concepts of the study 8
1.7 Research designs and methods 11
1.7.1 Research design 11
1.7.2 Sampling procedures 11
1.7.3 Data collection 12

vi
1.7.4 Data analysis 12
1.7.5 Ethical considerations 12
1.7.6 Limitations of the study 13
1.8 Demarcation of the study into chapters 13
1.9 Conclusion 14
CHAPTER 2
LITERATURE REVIEW
2.1. Introduction 15
2.2 Theoretical Framework 15
2.2.1 Emancipatory paradigm 16
2.2.2 Social constructivism 17
2.2.3 Deficit-based approach 17
2.3 Drop-out Rates: A cause for concern 18
2.4 Academic Development as a broad concept 21
2.5 Academic Literacy as a specific aspect of Academic Development 23
2.5.1 Different interpretations of Academic Literacy 24
2.5.2 Academic Literacy in the context of the study 24
2.6 Academic Literacy Development 25
2.6.1 International research on Academic Literacy support in Higher Education 26

vii
2.6.2 South African research in Academic Literacy as a support programme 28
2.7 Academic Literacy; WSU context 29
2.7.1 WSU as an institution 29
2.7.2 The Centre for Learning and Teaching Development (CLTD) 30
2.7.3 The extended studies Unit (ESA); Goals, Objectives and Strategies 30
2.7.4 Effectiveness of intervention programmes 30
2.8 Assessment of academic preparedness 33
2.8.1 Which tests have been used? 33
2.8.2 The SATAP and its origin 33
2.9 Extended studies 35
2.10 Conclusion 35
CHAPTER 3
RESEARCH DESIGN, METHODOLOGY AND DISCUSSION
3.1 Introduction 37
3.2 Rationale for the Empirical research 37
3.3 Research Design 38
3.3.1 The pre-experimental design 38
3.3.2 The single -group pre-test post- test design 39
3.4 Population of the study 40
viii
3.4.1 Sampling procedure 40
3.5 Data Collection Method 41
3.5.1 The Standardised Assessment Tests for Access and Placement 42
3.5.2 The academic literacy intervention procedure 42
3.5.3 Measuring instrument 43
3.5.4 Challenges encountered 43
3.5.5 Validity and reliability 43
3.6 Data analysis 44
3.7 Ethical issues 44
3.7.1 Approval for conducting the research 44
3.7.2 Informed consent 45
3.7.3 Confidentiality and anonymity 45
3.7.4 Deception of participants 45
3.7.5 Physical harm, psychological abuse, stress or legal jeopardy 45
3.8 Conclusion 46

ix
CHAPTER 4
DATA PRESENTATION, ANALYSIS AND DISCUSSION OF RESULTS
4.1 Introduction 47
4.2 Demographic profile of participants 48
4.2.1 Age distribution 48
4.2.2 Gender 49
4.3 Comparative analysis of pre-test and protest results of participants 51
4.3.1 Pre-test and post-test scores of participants 51
4.3.2 Descriptive and inferential statistics of pre-test and post-test scores 53
4.3.2.1 Descriptive and inferential statistics of pre-test and post-test scores of all
participants 54
4.3.2.2 Descriptive and inferential statistics of pre-test and post-test scores of the building (construction
Management and quantity surveying 59
4.3.2.3 Descriptive and inferential statistics of pre-test and post-test scores for the electrical
engineering 64
4.3.2.4 Descriptive and inferential statistics of pre-test and post-test scores for the mechanical
engineering 69
4.3.2.5 Summary statistics of pre-test and post-test for the civil engineering 73
4.4 Item specification and item breakdown (Pre-test and Post-test) 78
4.5 Analysis of results and discussion 84

x
4.6 Summary 85
CHAPTER 5
SUMMARY, CONCLUSIONS AND RECOOMMENDATIONS
5.1 Introduction 87
5.2 Summary 87
5.2.1 Fulfilling the aim of the study 88
5.3 Synthesis of research findings 88
5.4 Conclusions 89
5.4.1 Has there been an increase in the SATAP scores after academic literacy
intervention programme has been offered to first-year students in the
FSET? 89
5.4.2 Have the skills gap identified pre-test been improved post-test after intervention? 90
5.5 Limitation and shortcomings of the research study 90
5.6 Recommendations 91
5.6.1 Advocacy 91
5.7 Suggestions for further research 92
5.8 Conclusion 93
xi
REFERENCE LIST 94
APPENDIX A: CONSENT FORM 104
APPENDIX B: ETHICS COMMITTEE FORM 109
APPENDIX C: PRETEST RESULTS 114
APPENDIX D: POSTTEST RESULTS 119
APPENDIX E: MARK CHANGES 123
APPENDIX F: ITEM BREAKDOWN 124
LIST OF TABLES 139
LIST OF FIGURES 140

1
CHAPTER 1
INTRODUCTION
1.1 INTRODUCTION AND OVERVIEW
In South Africa today, the need to address the high drop-out rate tops many departmental and
faculty agendas and increasingly solutions are being sought to reverse the negative trend De Klerk,
Schoeman, Van Deventer and Schalwyk (2006:1). Student attrition (wastage, drop-out, academic
failure) is a phenomenon that has plagued education for many years and this is detrimental to the
student, the institution as well as the country Tinto (1993:19). Decreasing throughputs and low
retention rates have been a serious challenge in South African higher education institutions.
Thousands of young people are dropping out of their university studies, giving up on their career
dreams. Three Eastern Cape Universities, namely, Fort Hare University, Walter Sisulu University
(WSU) and Rhodes University mention similar reasons for this gradually increasing problem. These
reasons are: financial difficulties, bad choice of courses and students difficulty in coping with
academic studies (Walter Sisulu University Student News Agency (WSUSNA).2011.24 Nov:3).
The WSUSNA further claims that the Law School at the University of Fort Hare has had the highest
drop-out rate recently as a result of the “declining level of academic literacy being delivered from
school”, whilst the WSU‟s Acting Director for Marketing, Communication and Development mentions
the differences in the method of teaching at university and at high school, where learners are often
spoon-fed information. At university, students have to learn to work independently and to do
research. They have to be responsible for their projects, manage their time and motivate themselves
much more than in a school (WSUSNA.2011.24 November: 3).
The Council of Higher Education (CHE), which is a statutory body that advises the Minister of
Higher Education, in its 2013 report, highlights the need for a radical reform in the higher education
sector. The report further claims that poor academic preparation at school is the dominant learning-
related reason for poor university performance, but there is no prospect that the schooling sector will

2
be able to produce the numbers of adequately prepared matriculants that higher education
requires in the foreseeable future. One of the proposed changes in the document is extending
undergraduate studies by a year (Council of Higher Education.2012-2013.Annual Report).
In 2005, the Department of Education reported that, of the 120 000 students who enrolled in
higher education in 2000, 36 000 (30%) dropped-out during their first year of study. A further
24 000 dropped-out during their second and third years. Subsequently, the Department issued a
public statement lamenting the cost of the drop- out rate to the National Treasury of R4, 5 billion
in grants and subsidies to Higher Education Institution without a commensurate return in
investment.
Today, one of the major challenges facing most higher education institutions is to provide support
through extended studies and foundation type programmes as part of the formal offerings. De
Klerk et al (2006:1) further bemoan the fact that, while academic development programmes have
in varying forms, been offered in some faculties at WSU, only pockets of in-depth research
appear to have been conducted on the efficacy and appropriateness of such programmes. There
has been much debate as to why students are not achieving success. Many have suggested that
the answer lies in the lack of preparedness among first-year cohorts. Impact
Shay (1994:2) states that concerns about the nature of the school-leaver applying to universities
in South Africa have been voiced for more than a decade now, with an “ increasing number of
students in the educational system, who for reasons of language ,socio-economic status or
cultural background, experience serious and persistent problems in interpreting academic tasks.
With the increasing intake of students from disadvantaged backgrounds, the pressure on
universities to deal with such challenges is growing. As a result, universities in South Africa have
attempted to use a variety of alternative access programmes for many years. This has led to
different curricular routes being established. One of the options is the extended studies
programme, which extends a three year study by an additional year.
Researchers such as Beukes (1991) Buthelezi (1995) Coetzee (2001) De Kadt (2001) and Webb
(2002) all maintain that an insufficient command of English is identified as a key cause of the high
drop-out rate in universities. Weideman (2011: iv) in the preamble to his book also states that
few would argue against the claim that a large number of students at tertiary institutions across
the world have inadequate skills in English, which impedes their development and success. Bock
3
(1998: 25) also attested to this, saying, “in order for students to grasp academic texts, they need
to have knowledge of the context and be competent in the language”.
More recently, Schalkwyk (2008:2) in her study titled “Acquiring academic literacy: A case of first
year extended degree programme students at Stellenbosch University” opined that the higher
education system in South Africa, as elsewhere in the world, is challenged to respond
comprehensively to the gap between learners‟ school attainment and the intellectual demands of
higher education programmes. With the publication of the NPHE three years later, this vision was
given shape in the form of a number of strategic objectives that included improving throughput
and graduation rates, providing for the funding of academic development programmes and
ensuring that equity of access leads to equity of outcomes (Department of Education,2001:10).
Fraser and Killen (2005:85) state that dropout rates continue to rise across a broad spectrum of
school achievement, and lecturers increasingly cite students‟ inability to read and write in a
critical and analytical manner, to discern between fact and opinion, to recognise what is deemed
evidence for an argument and to grasp the discourse of the discipline, in essence academic
illiteracy as central to the problem.
Academic development programmes aimed at fulfilling throughputs and equity objectives were
introduced at WSU in 2005. In addressing the issue of decreasing throughput rates, the Centre
for Learning and Teaching Development (CLTD) developed policies, strategies and action plans
for learning and teaching development. This strategy incorporated the Student Academic
Development programmes. Their mandate was to provide academic support to underprepared
students. The programme was piloted in the Faculty of Science, Engineering and Technology
(FSET). However, now an array of academic support programmes is offered to first-year and
under-prepared students, who are placed in the extended studies programme after tests to
assess their academic preparedness have been administered to them. One of those programmes
is Academic Literacy, which deals with the language proficiency needs of first year students.
Language proficiency has been identified as vital predictors of learners‟ success throughout their
academic life and even in the working environment. The traditional response to the issue of
academic literacy in the tertiary sector has been to develop access or first semester or year
modules aimed at developing students‟ academic literacy, mainly focused on academic writing.
The Academic Literacy intervention programme aims at assisting them in accessing, processing
and interpreting information accurately from a variety of sources by relevant means and enabling

4
them to apply knowledge within acceptable academic conventions. This programme has now
been offered to underprepared students but its effect has not been evaluated. This study
therefore seeks to evaluate the Academic Literacy intervention programme and the effect it has
on the Standardised Assessment Tests for Access and Placement (SATAP) scores, after it has
been offered for a year to first-year students who have been provisionally admitted to the Faculty
of Science and Engineering and Technology (FSET) at WSU.
1.2 Contextual background of the research problem
“The cost of education in institutions of Higher Education is very high, and is exacerbated by the
high failure rate among first year students in particular” Tinto (1993:56). Ramapele (2012:27)
states that institutions of higher learning seem to face various challenges of dealing with under
preparedness of students who register for the first time for post-school level of study. According
to Hrabowsk and Pearson (1993: 234) poor academic performance has shown to impact
negatively on students‟ persistence level of study. “Many institutions have come to understand
the need to both challenge and support the students they admit, and make a commitment to help
them succeed” Winston and Sandor (1994:78). Most universities have extended some of their
programmes by a year on which they provide substantial additional support, through extra
developmental courses and content in the programme. The support is provided very intensively in
the first year, although there is little continued support in subsequent years. The CLTD at WSU
administers placement tests to students that are admitted in the (FSET).
The results of the English Placement tests written by the first year students in these Departments,
show that the students have low academic literacy levels, and most do not have the necessary
language skills to handle university work without additional support. Therefore, most of the
students are at-risk of academic failure. In the Academic Literacy intervention programme,
students are exposed to sophisticated forms of accessing and presenting knowledge, using
academic conventions acceptable in different disciplines. They are involved in different
intervention activities that are aimed at developing different forms of academic literacy and
communication skills, ranging from the receptive skills of listening and reading, to the productive
skills (writing and speaking) in English. Murray (2010: 56) states that there is an increasingly
widespread perception within higher education that the language and literacy skills of students of
both English speaking backgrounds and non-English speaking backgrounds, is in a state of
decline. This situation, some would argue, has forced lecturers to „tone down” their course

5
materials and spend time addressing English language problems many may regard as outside
the scope of their expertise and locus of responsibility. These intervention programmes have
been used for some time now, but their effect has rarely been evaluated. This study, therefore,
seeks to determine if the academic literacy intervention programme makes a difference to the
SATAP scores of the first year students. The SATAP test is a tool that is used at WSU to test the
academic preparedness of students admitted to the (FSET).
This study focused on only four Engineering departments namely Civil, Building, and Electrical
and Mechanical because they are the only departments in Faculty of Science, Engineering and
Technology that administer the SATAP tests to first year students. Students in the above
mentioned departments are admitted based on their grade 12 results used in conjunction with the
SATAP results. These combined results, determine whether a student is placed in the
mainstream or in the extended programme (EP). Those students placed in the extended
programme are offered five academic support or intervention programmes, namely, Life Skills
(LS), Academic Literacy (AL), Writing and Reading Course (WRC), and Peer Assisted Learning
(PAL). During the course of their first academic year, their general academic performance is
tracked and monitored by tracking specialists, who flag them and refer them to academic
advisors, student counsellors and health practitioners, who subsequently offer advice when
needed. The overarching aim of all these courses is to ensure an effective and efficient system-
wide approach to student access and retention, by assisting faculties and cooperating with
related institutional units to promote student access, leading to student success.
The Department of Higher Education and Training (DHET) allocates a specific amount for each
approved extended programme, and currently at WSU there are 10 approved Departments in the
Extended Programme (EP). Since the Department invests money in the EP, there has to be
evidence to show that the intervention programmes, which some institutions call “enrichment
programmes‟ do add value to the students‟ academic preparation and that they contribute to the
improvement of efficiency in the extended curriculum and subsequently leads to improved
retention and throughputs. The alarming failure rate and the poor throughput rates in Higher
Education Institutions are identified as major education problems in the National Plan for Higher
Education (2002). Higher Education Institutions took an initiative to develop courses that would
provide the necessary support for these particular students.

6
One of the intervention programmes offered to the first time students placed in the Extended
Programme at Walter Sisulu University is Academic Literacy, which is the main focus of thisstudy.
The notion of Academic Literacy has been around for some time, but its definition is problematic.
Weingarten (1993:3) said that, if the pedagogical activities of undergraduates are to be effective,
students must have the knowledge and abilities that enable them to march towards the educated
state that merits a culminating degree”. Leibowitz (2001:2) writing some years later expands on
this definition by stating that academic literacy “can be summarised as a culturally specific set of
linguistic and discourse conventions, influenced by written forms utilised primarily in academic
institutions”. Lea and Street (1998: 160) provide a most useful description: “Academic Literacy
practises – reading and writing within disciplines, constitute central processes through which
students learn new subjects and develop their knowledge about new areas of study”.
In the context of WSU and this study, Academic Literacy is a module which falls within the ambit
of academic development as it is taught by academic development practitioners and not by
faculty staff. This module aims at addressing the English language skills‟ gaps identified in the
SATAP test at the beginning of every year. Walter Sisulu University, like all other South African
universities, as a result of as a result of the increasing intake of students from disadvantaged
backgrounds, is experiencing enormous pressure in dealing with underprepared students.
Therefore, these intervention programmes, of which Academic Literacy is a subset, are expected
to have a broader mission of engaging faculties and administration. Todd (2002:67) also asserts
that a weak and marginalised intervention programme can have a detrimental effect on that
particular cohort of students, in that, it would enable the institution to continue a dysfunctional
teaching and curriculum structure that creates barriers for many students and prevents their
ultimate success. This is one reason why it is crucial to evaluate a programme to ensure that it
adds value to students‟ learning.
1.3 Relevance and importance of the study
This research study is timely because its findings will help determine whether the academic
literacy intervention programme offered at WSU has an effect on the SATAP scores of first time
students who are placed in the Extended Programme. The research findings will further assist
academic support and intervention programme practitioners, Faculties with Departments that
have extended their programmes and curriculum designers and developers who design the
programmes, by emphasising the skills gaps identified by the tests.

7
According to Bureau and Romney (1994:130) research indicates that programmes designed to
target first year students increase their likelihood of success during that year and their chances of
completing their undergraduate studies are high. Another benefit of this study is that it will assist
the institution in curbing the high failure rate among first year students in particular. The high
failure rate costs the Department of Higher Education enormously. The English language skills
gaps identified by SATAP practitioners may also be very useful to Faculty language lecturers,
enabling them focus on deficiencies identified by the tests in their daily language teaching.
These research findings will particularly assist the Extended Studies Academy (ESA) within the
Centre for Learning and Teaching Development (CLTD) at WSU where all these skills-based
retention programmes are housed, to improve the design and implementation strategies, resulting
in significant enhancement of future programme performance, increased retention, and improved
throughputs. If this programme is found to be effective, it could be recommended for use across
the entire institution to help all students engaging in academic discourse through the medium of
English as a language of learning.
1.4 PROBLEM STATEMENT AND RESEARCH QUESTIONS
There have been a number of interventions in South African universities for the improvement of
students pass rates, retention and throughputs including Foundation Provisioning, Curriculum
Development, Life Skills programmes, Supplemental Instruction or Peer Assisted Learning and
Mentoring Programmes. Since these intervention programmes have now been implemented,
there is a need for them to be evaluated for their effectiveness and if there has been any
contribution to increased and improved pass rates.
The focus of this evaluation will be on the following main research question:
Does the academic literacy intervention programme improve the SATAP scores of the SATAP
English test of first year students in the FSET?
This sub-question follows;
Have there been improvements in the SATAP test scores of students who have been offered
the Academic Literacy intervention programme?
Have the skills gaps identified in the pre-test been resolved in the post-test?
8
1.5 AIM AND OBJECTIVES OF THE RESEARCH STUDY
1.5.1 Aim of this evaluation:
To evaluate the effect of the Academic Literacy intervention programme on the SATAP scores of
first year students, by comparing the pre-test and post-test scores of participating first year
students and to make recommendations to providers and practitioners of intervention
programmes and also to extended studies curriculum designers and developers.
1.3.2 Objectives
To determine whether Academic Literacy as an intervention programme has had a positive
effect on the language development of students.
To make recommendations to providers and practitioners of intervention programmes and
also extended studies curriculum designers and developers.
1.6 KEY THEORETICAL CONCEPTS OF THE STUDY
For the purpose of this study, the terms identified below are defined as follows:
Academic Literacy
For the purpose of this research study, academic literacy (WSU context) is an academic
development specific course that will enable one to process and interpret information accurately
from a variety of sources and by relevant means and to acquire knowledge using acceptable
academic conventions. Academic Literacy is the key to academic success and it enables
students to properly manage all the information that they are exposed to, particularly that which
will be prescribed in their specific fields of study and course instructors or lecturers (WSU-CLTD
Academic Literacy Course Programme: 2005).

9
Academic support
It encompasses a broad array of educational strategies including tutoring sessions, supplemental
courses and summer learning experiences. It may also refer to a wide variety of instructional
methods, education services and school resources that are provided to students in an effort to
help them accelerate their learning progress, catch up with their peers, meet learning standards
or generally succeed at school.
English Language proficiency needs
Proficiency refers to the ability of students to use the English language to make and
communicate meaning in spoken and written contexts while completing their university studies
DEEWR (2009: 2). The view of English language proficiency as the ability to organise language
to carry out a variety of communication tasks, distinguishes the use of language as a formal
system concerned only with correct use of grammar and sentence structure.
First year university students
It refers to students who have finished high school and are entering their first year of university
studies. It may be also be defined as students who have completed less than the equivalent of 1
full year of undergraduate work (Free Dictionary by Farlex).
Pre-test and post-test
Pre-test is a preliminary test to evaluate the preparedness of a student for further studies. It is
often administered to determine a students‟ baseline knowledge or preparedness for an
educational experience or course of study and also whether the students are sufficiently prepared
to begin a new course of study. A post-test is a test given to students after completion of an
instructional programme or segment and is often used in conjunction with a pre-test to measure
their achievement and the effectiveness of the programme.

10
Academic Development
Academic Development, which Academic Literacy as an academic support programme is a sub-
set of, refers to all initiatives taken, both at the central and local level, in order to support faculty
members to fulfil their different roles e.g.in teaching and in research throughout their academic
careers. Volbrecht and Boughey (2004) define academic development as an open set of
practices concerned with improving the quality of teaching and learning in higher education.
Intervention programme
It is a programme designed to serve students who are at risk of not reaching their academic goals
or maintaining their academic grades. When school-wide screening or progress monitoring
results indicates a deficit in a specific area, an intervention programme is implemented and
progress within that intervention is monitored. It provides content for instruction intended for use
in differentiated and intensive instruction to meet student learning needs in one or more of the
specific areas of reading. It is implemented as extra assistance with the goal of changing or
preventing a problem.
Extended studies programme
It is a programme that strives to assist students who show potential to succeed. The students are
selected and are exposed to a carefully designed supportive learning environment, which
enhances their ability to succeed. These students‟ academic study will be extended by a year of
additional study in order to allow for the inclusion of activities intended to support and develop
them.
Drop-out rate
It is the proportion of pupils from a cohort enrolled in a given grade in a given university year, who
are longer enrolled in the following school year.

11
Academic failure
It is an unsuccessful attempt at academic achievement, generally stemming from the poor
capacity of an individual. It occurs when the primary aims of education cannot be delivered to the
degree that there is a fundamental and ongoing breakdown in a students‟ ability to learn.
Academic failure is the result of failing to turn in satisfactory work when it is due, over a period of
time.
1.7 RESEARCH DESIGNS AND METHODS
1.7.1 Research design
This study, as an evaluation of the effect of the academic literacy intervention programme in
determining the language development of first year students, has followed the quantitative
research approach and a pre-experimental single-group pre-test post-test design. The
quantitative research method was used in this study because “it emphasised objectivity and
quantification of phenomena" McMillan and Schumacher (2006:23).
The pre-experimental single group pre-test post-test design was chosen because the same group
of students, who wrote the SATAP test (pre-test) at beginning of the year, wrote the post-test at
the end of the same year, after the ALIP treatment.
1.7.2 Sampling procedure
The convenient sampling method, which McMillan and Schumacher (2006: 125) also calls
available sampling was used in this study. The researcher made use of this type of sampling
because the subjects were available and selected by their various departments to write the
SATAP tests to determine the academic skills and assist in identifying students who might need
academic support in order to cope with their studies. The target population consisted of first year
students who had been admitted in the four departments, namely, Civil, Electrical, Building and
Mechanical Engineering in the Faculty of Science, Engineering and Technology (FSET). The
sample consisted of 120 first year students who had been selected by the Faculty, between the
ages of 18 to 25 years, both male and female and from the same cultural background. Test
scores, before and after exposure to ALIP, were analysed for this study.
12
1.7.3 Data Collection
Data was collected through pretest and posttest scores of the participants. The single group pre-
test post-test design was used. The researcher used the paper and pencil test, a standardised
test which McMillan and Schumacher (2006:189) claims “provide uniform procedures for
administering and scoring them”. The pre-test was written at the beginning of the year before the
treatment. The SATAP English test was the tool used. The treatment which was Academic
literacy was offered throughout the year as an intervention programme. The same group of
students who wrote the test was again post- tested after the exposure to ALIP. The pre-test and
post-test scores were collected, calculated, compared and finally analysed.
1.7.4 Data analysis
The quantitative data was analysed in a reliable and valid manner by the Statistical Package
Social Science (SPSS) a computer programme that is used for the statistical analysis of data that
allows in-depth preparation and analysis of available data. All the scores were presented in tables
and graphs (histograms and line charts), in order to provide a comparative representation of
various results achieved. The test scores for the pre-tests and posttests were compared
according to the average percentage marks achieved. The data analysed is presented in tables
and figures in chapter 4 of this study.
1.7.5 Ethical considerations
To ensure trustworthiness and their anonymity the researcher consent forms were signed by the
participants. Ethical guidelines were followed as knowledge about research was ensured. The
WSU research ethics form was filled and sent to the research ethics committee. A preliminary
literature review was conducted in order to explore and clarify the researcher‟s own views and
assumptions that may have influenced this study.
1.7.6 Limitations of the study
The limitation of the study was that there was no control group. The researcher cannot be sure
that other events occurring between the pre-test and the post-test did not cause change in the
test scores.

13
1.8 DEMARCATION OF THE STUDY INTO CHAPTERS
Chapter 1: Introduction and background
This chapter outlines the background to the research. Reasons for selecting the problem are
been identified, aims and objectives of the study carefully explained. It also highlights the course
of the research and the justification for choosing the quantitative research method as well as an
overview of the research design and methodology is provided. This chapter serves as an
overview of the path that the research study followed.
Chapter 2: Literature review
This chapter represents the review of literature related to the study. The theoretical argument for
the field of study is supported from various sources.
Chapter 3: Research design and methodology
This chapter describes the approach and research methods used by the researcher. The
research design selected is the quantitative design. Methods are outlined and limitations and
approach are explored. Ethical issues, sampling and data collection techniques are discussed in
this chapter. The data analysis that leads to the findings of the research is also dealt with in this
chapter.
Chapter 4: Data presentation, analysis and discussion of results
In this chapter data were presented, analysed and discussed in light of the relevant literature to
put the argument and the findings into perspective. In a research study the analysis and
discussion of the results ultimately produce the research findings. It is this chapter that indicates
to the researcher whether the choice of methods addresses such key aspects as validity and
reliability.

14
Chapter 5: Summary, conclusions and recommendations
The summary consists of a discussion of the findings of the literature reviewed and of the empirical
study based on the research questions. It also interprets the main research findings.
Recommendations for both practice and research were made and limitations of the study spelt
out.
1.9 CONCLUSION
Chapter one served to orientate the reader to this research study. It began with a description of the
contextual background and relevance of the study, leading to the research problem statement which
referred to the researcher‟s involvement in SATAP testing, noticing students‟ lack of language
proficiency, which may impede their academic performance. An introduction and an explanation of the
research methodology were followed by a description of the trustworthiness of the research. Finally, a
discussion of ethical practices, followed by a chapter outlay concluded the chapter.
15
CHAPTER 2
LITERATURE REVIEW
2.1 INTRODUCTION
According to Hart (1998) a review of literature is important because, without it, one will not be able to
acquire an understanding of one‟s topic, and what has already been done on it, how it has been
researched and what the key issues are.
This is a quantitative study which endeavours to build a logical theoretical framework within which to
locate the inquiry and to discuss the underlying assumptions behind the research question, as proposed
by Marshall and Rossman (1999). In this chapter the researcher presents literature related to the study
within some specified titles. The literature was reviewed in order to explicitly expose the arguments and
perceptions of the researchers, concerning the research question, which is about the effect of the
academic literacy intervention programme on SATAP English scores of first-year students in the Faculty
of Science, Engineering and Technology.
This Literature review tends to contextualize this research work in relation to previous research on the
subject. In this literature review a thorough review of domestic and international publications and relevant
documents on first year support, students‟ English proficiency skills and retention strategies is conducted,
and the theoretical background for the investigation is provided. Sub-headings are used to enhance order
and wider coverage of ideas. The researcher further discusses the relevant literature in detail as
approximately as possible. Henning (2004) states that a good literature review lays the foundation for
research and may be used to argue one‟s discussions.
Chapter 1 has introduced the project and provided framework for academic literacy as an intervention
programme at the Walter Sisulu University (WSU). Decreasing throughput and low retention rates has
necessitated that the current academic programmes be evaluated to find if they have an effect on the
SATAP scores which may lead to better academic performance. Sepota (2012:1) claims that academic
support is becoming an imperative trajectory in both academic and political circles in South Africa. She
further states that it is no longer deemed peripheral but a lynchpin for achieving satisfactorily through in
higher education. This chapter reviews international and South African research in academic support
programmes at higher education institutions.

16
2.2 THEORETICAL FRAMEWORK
Collins (1991) defined a framework as a basic conceptual structure of rules, beliefs, or ideas which one
could use to decide what to do. Similarly, Collins (1991) emphasized theory as this set of rules, beliefs or
ideas that describes and serves as the basis of any action. Various theories and approaches were
selected and incorporated within the post-modernistic paradigm and enhanced it by crafting them within
the emancipatory paradigm. The selected applicable approaches and theories lay intertwined within this
research‟s theoretical framework that served as a guide for the research study. Constructed upon the
emancipatory paradigm, the theoretical framework developed for this study was contextualized to the
South African environment and the WSU context. It included various approaches namely critical, social
constructivism and deficit-based approach.
2.2.1 Emancipatory paradigm
Hutton and Thompson (2000) describe the emancipatory paradigm as viewing the world with its
“…growing inequalities of income and wealth, massive inequalities in relation to cultural recognition and
social diversity, and huge inequalities arising out of access to information. They further state that there is
a widening divide between those who are highly educated, skilled and well- paid specialists and those
who are less skilled but currently employed, and the third of the population, who are poorly educated,
poorly qualified, casualised, unwaged and unemployed. The emancipatory paradigm closely linked to the
principles of critical theory. Neuman (in Bhana and Kanjee)(2001:144) defined critical theory as; “A critical
process of inquiry that goes beyond surface illusions to uncover the real structures in the material world in
order to help people change conditions and build a better world for themselves”. This definition suggests
that critical theory encourages people to look beyond any possible masks hiding either developed
information (e.g. models and theories) or social practices (e.g. apartheid, traditional higher education
practices) which negatively affect their lives, in order to enhance and develop better circumstances for all.
The Centre for Learning and Teaching Development (CLTD) at Walter Sisulu University (WSU) therefore
took on a critical and emancipatory stance, especially when viewing the immense changes within
historical development of education over the past decades, as well as their ever-changing feature as Eloff
and Ebersohn (2004)puts it. This study also critically took into account the applicability of academic and
learning support approaches and practices applied by higher education institutions.
17
2.2.2 Social constructivism
Social constructivism explained the learning process of constructing new knowledge which varied across
different social context and historical times. “It is built up and passed on through constant process of
social interaction” (Donald 2002:72). This was a key point that needed to be taken into account when
developing the Academic Literacy intervention programme because it was not merely a process of
handing over academic literacy knowledge, but taking into account the social tools such as language,
interaction and history, that played a role in the students‟ “cultural capital” as suggested by Bourdieu
(1986). Beekman (2007) proposed a paradigm shift from a deficit-based to asset-based approach for
student counselling and academic support services at Universities, because all students have strengths,
skills and talents. Elloff and Ebersohn (2004) stated that a needs-based approach was efficient in
addressing the challenges facing modern-day societies and was particularly inadequate in the South
Africa context. An asset-based approach focused on identifying the assets (positives and other relevant
resources) which surround the students, instead of focusing on the prevailing deficits, and it is applied
towards the students‟ benefit (Landsberg, 2005:51). An asset-based approach is more applicable and
beneficial in the process of an Academic Literacy intervention programme in an attempt to address the
students‟ learning support needs, more than a deficit approach. The deficit-based practices compelled
universities to set their existing values and expectations as the standard and rate many students as not
good enough, the cultural capital theory suggested an understanding of cultural diversity without an
implicit value judgment.
Bourdieu‟s cultural capital theory Langdon (2004) applied to students from disadvantaged backgrounds,
shows that many of these students appear to be unable to position themselves to take advantage of
opportunities available to them at institutions. They do not always have the cultural capital to succeed in
higher education because they were not exposed to effective schooling, learning and studying. According
to this theory the institution needs to facilitate the development of appropriate types and levels of cultural
capital within the students to improve their chances at success. This was where the CLTD played a role
in infusing the academic literacy intervention course into the extended programme curriculum.
2.2.3 Deficit-based approach
An approach that tends to focus on needs and problems in people or helping people avoid risks
associated with negative outcomes. These risk-based interventions do not sustain change Skodol (2010).
WSU uses the deficit- based approach although Bogeschneider and Olisin (1998) posit that it is
ineffective and sometimes worsens behaviour, as against strengths-based (asset) approach which they
18
claim is sustainable. A major problem in the deficit-based approach is that it often comes too late,
intervening after the problem is already there, rather than working to prevent it in the first place.
2.3 DROP - OUT RATES: A CAUSE FOR CONCERN
Johnson (2002) states that drop-out rates amongst universities are reported to be much higher with
almost one in four students failing to complete their course. Leith (2008) commented that despite millions
of rands being paid to universities, to help retain students, drop-out rate has remained constant in the
past five years globally. It is important that universities understand the factors that contribute to student
drop-out and equally those that support students Tinto (2003). Tinto further proposed that the academic
and social engagement of students with their peers and the wider learning community is paramount in
positive student outcomes. Berger and Tierney 2000) have developed a different theoretical direction that
champions the adaptation of institutions to accommodate the individual nature of students.
Regardless of the theoretical approach it is apparent that considerable student withdrawal is fostered by
their perception of how well the institution values them and how well it responds to their needs. Wilson
(2002) claims that some universities have invested in specific projects to deal with their own particular
areas of concern, some have adopted proactive approaches to retention, including student mentoring by
more experienced peers, academic mentors, departmental action plans, quality teaching, training for
academic staff, dedicated retention officers, some even go further to train final year and post-graduate
students to offer support to first-year students, up to identifying those that may be “high-risk”. Changes to
the curriculum including the introduction of modular schemes, flexible learning locations, e-learning,
student-centred learning, low stakes and formative assessment, collaborative learning and manageable
workload are all encouraged to enhance student achievement.
Despite the changing approach of many Higher Education (HE) providers, student retention and
progression continues to be a cause for concern. a recent report by the select Committee on Public
Accounts in the United Kingdom, the authors report that: there is much that universities can do to improve
retention, good quality management information including on the reasons for leaving is needed. The
report further recommends that additional academic support for students, for example, for those
struggling with the mathematical elements of their course should be provided. Student access to tutors
who can provide pastoral and academic support is important, especially as the numbers of student
entering universities increases.
19
Webb (1999) states that research on literacy levels in the South African schooling system indicates a
deepening crisis and further reported that many of the first-year students at the University of Pretoria had
reading levels of Grade 7-8 students. Morrow (2005) had this to say, in relation to literacy levels evident
in South African schooling: “If the quality of schooling is understood in terms of enabling access to the
modern world, and if such access depends on literacy and numeracy, then improving the quality of
schooling for the majority, and particularly the disadvantaged, still evades us”. There are a number of
interrelated causes of the literacy crisis, which universities have to respond to, the first being the ongoing
impact of the legacy of apartheid education policies that created an extremely negative environment for
literacy development.
Research has also indicated that a large number of students at tertiary institutions across the world have
inadequate language skills which impede their development and success. Coetzee Van Rooy and Van
Rensburg (2001) who offer evidence that the majority of students entering tertiary education have English
language skills below the level of matric second language and therefore do not have sufficient command
of English to afford reasonable opportunity to succeed in tertiary education.
Tinto (2000) postulates that if institutions take student retention seriously they should stop tinkering at the
margins of institutional academic life and make enhancing students retention the linchpin about which
they organise their activities. They should move beyond the provision of add-on service and establish
those educational conditions on campus that promote the retention of all, not just some students.
Research points to several types of support that promote learning and retention, in particular academic
support. At WSU through placement tests which are administered at the beginning of the year for first-
year students, it has been identified that students enter university insufficiently prepared for the rigors of
university study. The CLTD due to the above-mentioned challenges offers an array of students‟ academic
support and intervention programmes namely Life Skills, Writing and Reading Course, Peer Assisted
Learning previously known as the Supplemental Instruction and the Academic Literacy which this study
particularly focuses on. These courses offer much needed support for individual students and groups of
students who might otherwise find themselves out of place, in a setting where they are not familiar with.
For new students this Centre which offers such valuable support serve as a secure knowledgeable point
of entry that enables students to safely navigate the unfamiliar terrain of university.
Tinto (2001) argues that, academic support is effective when it is connected to students‟ daily learning
needs, in ways that enable students to utilize the support they receive to learn and succeed in the
classroom in which they are enrolled. He further sums up this argument by saying that students are more
likely to learn and persist when they find themselves in settings that hold high expectations for their

20
learning and provide needed academic support and frequent feedback about their learning. Research
suggests that students‟ academic support plays a vital role at the college level as students often view
communication with peers as their primary source of academic support Thompson (2008). Student
retention has become one of the most important measures of success for higher education. Tinto (2001)
posits that, from the institutional perspective, improving student retention starts with a thorough
understanding of the causes behind attrition. Such an understanding is the basis for accurately predicting
at-risk students to retain them Dursun (2011). Dursun, using institutional data along with three popular
techniques, developed analytical models to predict first years‟ student attrition of the three model types,
artificial neural networks, decision trees and logistic regression. Artificial neural networks performed the
best with an 81% overall prediction and accuracy on the holdout sample. The variable importance
analysis of the models revealed that the educational and financial variables are the most important
among the predictors used in this study.
Lillis (2011) developed an integrative model that posits that the association between the frequency of
student-faculty interactions and a students‟ intent to stay in college is positive, and becomes more
positive as faculty emotional intelligence increases. He further claims that patterns of student attrition
intentions are observed across different levels of faculty engagement and within and between high and
low emotionally intelligent faculty groups. Findings revealed that student faculty interaction predict student
attrition intentions more strongly for those students assigned to faculty mentors who possess higher level
of emotional intelligence than for those assigned to faculty with lower emotional intelligence scores.
Onsongo (2010) in his article, titled “Assessing the impact of academic support”, states that the
communication skills course offered at Witwatersrand University as an academic support programme is
primarily designed to improve comprehension in English as well as competence in written and spoken
English. He further argues that there are many students who are considered to be “right” candidates for
academic support. The academic support programme recommended for a student provides increased
contact with staff in small group tutorials over an appropriate academic loading the programme
recommended for a student provides increased contact with staff in small group tutorials over an
appropriate academic loading the programme designed to be challenging and to develop the skills and
attitudes necessary for success. The students recommended for academic support are given a chance to
appeal against the recommendation. Unfortunately many of them resist the recommendation without
giving any acceptable reason to explain their poor academic performance. Some of the students
underestimate the academic challenge of the support curriculum and many fail at the end of the year.

21
Johns (2005) states that higher education institutions expect lecturers to succeed, in an effort to prepare
students for any rhetorical or linguistic exigency that may arise, to „fix‟ students illiteracies once and for
all, so that they can get on with the „real‟ academic work. She further argues that instructors need to
motivate students to be literacy researchers, open to and prepared for the many social and linguistic
forces that may influence their literate lives. If our students are to succeed, however, we cannot work
alone. The first-test intervention by the tracking and monitoring team at WSU flags students who fail the
first test, as students-risk of academic failure. The students find it difficult to accept that the first tests
results in the first test can be used as an indication of the inability to succeed at the end of the year. They
consider this procedure as unfair and premature.
A few of them present plausible explanation for their poor performance and give reasonable plans for
improvement. However most of them consider it a demotion and humiliation to be declared to be at-risk of
academic failure. Onsongo (2010), in his article indicates that a few of the students who refuse academic
support manage to pass at the end of the year, most of the students fail one or more courses at the end
of the year. Most of them get excluded by the end of the year or they have to repeat the first year.
Generally, none of these students ever graduate in four years and many drop out.
Onsongo (2010) finally remarks that if the academic support programmes are considered entirely in
isolation and assessed on the basis of the number of graduates they produce, the impact would be
minimal. However if the programmes are considered an essential part of improving throughputs
especially in the pass rate from the first to the second year, then the process of academic monitoring and
assessment of all students throughout the first year has had a remarkable impact. The graduates through
the academic support programme are redeemed, students who otherwise were destined to be drop-outs.
It has been shown that the continuous academic review process has resulted in a significant impact in
pass rates from the first year to the second, within the last six years despite the setbacks experienced in
the implementation of the support programmes. Onsongo further states that more efficient uses of
academic support programme which should be reviewed positively by both staff and students, coupled
with better teaching and learning methods may produce further improvement. However, the decline in the
pass rate from second year to third year suggests that appropriate interventions at second year level,
need to be considered.

22
2.4 ACADEMIC DEVELOPMENT AS A BROAD CONCEPT
In South Africa, Academic Development (AD) was introduced into the higher education system in the
early 1980‟s in response to the perceived needs of the then Department of Education, when small
numbers of black students entering historically white, liberal universities started to increase. Volbrecht
and Boughey (2004) note three „phases‟ in the movement since that time. These phases, broadly termed
“Academic Support”, “Academic Development” and “Institutional Development”, are not distinct from each
other and are not indicative more of dominant discourses constructing what is appropriate as student
support than actual periods of time. The definition of Academic Development as an „open set of practices
concerned with improving the quality of teaching and learning in higher education‟ offered by Volbrecht
and Boughey (2004) attempts to capture this phenomenon with the word „open‟, signalling that the
student support practices which partly constitute contemporary Academic Development work often stem
from very different ideological and discursive positions.
Torr (1991) gives an indication of the discourses underpinning early academic support programmes when
she notes that they were „developed to assist students without the necessary background to be able to
benefit immediately from lectures and tutorials‟. Key then, to early academic support programmes was a
deficit assumption about students they served in the context of an assurance about the „rightness‟ of the
practices which characterized the institutions to which they had been admitted. Early initiatives were
therefore inherently liberal in intent in that they focused on attempting to give black students equal
opportunity by filling the gap between their poor socio-economic and educational backgrounds.
Boughey (2005) identifies a number of activities as characteristic of early academic support work, some
of which continue to this day. The first area of work concerned, access and admissions, attempts to
identify students with the „potential‟ to succeed in higher education in spite of their poor scores on the
matriculation examination and their disadvantaged backgrounds. Work in this area continues today and
has resulted most recently, in the development of the National benchmark Tests (NBTs).
Brew (2004) suggests that academic development “refers to the numerous activities which have to do
with the professional learning in post-compulsory tertiary or higher education” and her definition is
probably the one most often scribed to internationally.
However, within a South African context, academic development more often refers to “educational
development in higher education, that focuses on promoting equity of access and of outcomes” Scott
(2006: 1).

23
At CLTD at WSU we give attention to both aspects because we are involved in both the professional
learning of the academic staff and in the academic development of the students.
2.5 ACADEMIC LITERACY AS A SPECIFIC ASPECT OF ACADEMIC DEVELOPMENT
The term „academic literacy” is complex at a number of levels. Its evolution over a period of time has
resulted in it being applied loosely in a variety of situations by those who have not necessarily kept pace
with the most recent definitions. Within the higher education context, the appropriate discourse of
academic development is academic literacy. Dison (1996) argues that the development of what is called
academic literacy is at the heart of the students‟ ability to succeed at university, applicable to both the first
and second language speakers of English. Very narrowly, academic literacy refers to the students‟ ability
to read and write effectively within the university context in order to succeed from one level to another
Leibowitz (1995). Leibowitz further points out that a broader definition of the term academic literacy
“would include being able to read and write within the academic context with independence,
understanding and a level of engagement in the work”.
Langer (1987: 2) provides a broader view of literature which is in line with the learning expectations of the
higher education context. This socio-cognitive perspective is where literacy can be thought of as a tool in
the sense that the focus is not just on reading and writing, but also on the thinking that accomplishes it.
Research has indicated that a large number of students at tertiary institutions across the world have
inadequate language skills which impede their development and success. Particularly disconcerting are
the results of Coetzee, van Rooy and van Rensburg (2001) who offer evidence that the majority of
students entering tertiary education have English language skills below the level of grade 12 second
language and therefore do not have sufficient command of English to afford reasonable opportunity to
succeed in tertiary education. Research on literacy levels in the South African schooling system indicates
a deepening crisis Rose (2004)
Academic Literacy intervention programme in an attempt to address the students‟ English proficiency
needs more than a deficit approach. Where deficit-based practices compelled universities to set their
existing values and expectations as the standard and rate many students as not good enough, the
cultural theory suggested an understanding of cultural diversity without an input value judgement.
Bourdieu‟s cultural capital theory (Langdon 2004) applied to students from disadvantaged backgrounds
shows that many of these students appear to be unable to position themselves to take advantage of

24
opportunities available to them at institutions. They do not always have the cultural capital to succeed in
higher education, because they were not exposed to effective schooling, learning and studying.
According to this theory the institution needs to facilitate the development of appropriate types and levels
of cultural capital within the students to improve their chances at success. This was where the CLTD
played a role in assisting the institution by infusing Academic Literacy into the Extended programme
curriculum.
2.5.1 Different interpretations of Academic Literacy
Kern (2000: 23) notes that Literacy is an elastic concept; its meaning varies according to the disciplinary
lens through which one examined it”. Weingarter (1993: 14) describes literacy as an ancient proficiency.
Baynham (1995:1) further sets out a number of basic premises for literacy. He lists them as
follows:Literacy is shaped to serve social purpose in creating and exchanging meaning.
Literacy is best understood in its context of use.
Literacy is ideological, like all uses of language, it is neutral. Literacy needs to be understood
in terms of social power.
Literacy can be critical.
“The ideological model acknowledges literacy as a social practice, which is always embedded in socially
constructed epistemological principles” Street (2003: 77). According to Street (2003) literacy is
recognised as a dynamic concept that will differ from context to context, culture to culture. Ballard and
Clandy (1988:8) defined Academic Literacy as a students‟ capacity to use written language to perform
those functions required by the culture in different ways and a level judged to be acceptable by the
reader. They argued that language cannot be separated from the culture within which it was being used,
and a university has a very distinct culture that frames the way it requires language to function. Bock
(1988:25) agreed that in order for students to grasp academic texts, they need to have knowledge of the
context and be competent in the language. Lastly, Boughey (2000: 281) provides a later definition of
academic literacy that suggests that, “…it involves knowing how to speak and act in academic discourses
and that people will acquire such literacy when they participate with others within the discourse.” Flippo
and Carverly (2008:37) argued that “lecturers needed to socialise newcomers into the academe,” which is
what the CLTD at WSU attempts to do with its provision of the many support and intervention
programmes.

25
2.5.2 Academic Literacy in the context of the study
Academic literacy in the context of this study is an intervention programme that will enable students to
process and interpret information accurately from a variety of sources and by relevant means. It is the key
to academic success and will enable students to properly manage all the information that they will be
prescribed by the fields of study and course instructors. Through Academic Literacy the student will be
conscious of ways of accessing and assessing knowledge in a Higher Education institution and also how
to present this knowledge to one‟s peers and more importantly to lecturers in an academically acceptable
way. Students that have been exposed to Academic Literacy will also be able to achieve the stated aims
and objectives by meeting the assessment standards of all learning outcomes. In this way each one will
be on the right track towards crafting own success.
2.6 ACADEMIC LITERACY DEVELOPMENT
According to Hart (2007) research on literacy levels in South African schooling system indicates a
deepening crisis, and the majority of English Second Language learners in South Africa are reading at
frustration level. Literacy levels have been eroded, a longitudinal study of functional literacy test results
recorded by Year 12 English Second Language applicants to Technikons in the Gauteng province is
illustrated below:
Table2. 1: Literate students in Gauteng Province
Year Number of students Functionally literate
1990 568 51%
1994 1314 28%
1998 621 20%
2000 451 18%
(Hough & Horne; 2001)
These figures in Table 2. 1 provide powerful evidence of the extent of the crisis in literacy education in
South Africa. There are a number of interrelated causes of literacy crisis outlined above which universities
have to respond to. The first is the ongoing impact of the legacy of apartheid education policies that
created an extremely negative environment for literacy development in schooling in South Africa.
Vinjevold (1999) found that teachers also either do not use textbooks, or they use them unsystematically

26
because of their own poor content knowledge and reading skills. There is thus, a crippling neglect of the
basic skills on which the future academic progress of students depends as observed by Taylor and
Vinjevold (1999).
2.6.1 International research in academic literacy support in Higher Education
This section focuses on international research in academic literacy support programmes in institutions of
higher learning. Although the definitions of academic literacy vary in their complexity and scope
researchers and practitioners alike agree that all students not just English learners need explicitly
instruction focused on the academic language used in classroom in order to be successful in school and
beyond (Oregon 2000). Murray (2010) claims that even where students have advanced English language
proficiency, this does not equate to having well developed academic literacy, students may be highly
proficient users of English but lack the academic literacies needed to perform well in their studies.
Dean (2004) at Coventry University in the United Kingdom questions where, when and how academic
literacy or writing should be taught, because it has long been a concern in higher education globally. This
strongly felt need for critical comparisons of writing pedagogy across higher education gave rise to what
was termed “The DALic project” .This project is a comparative curriculum development exercise which
begun in 2006, involving a group of academic literacy specialists in the UK, the USA and Australia. It was
initiated to demonstrate how an established model of practice in teaching/ developing academic literacy
works, to apply it in a range of other institutions and to facilitate a gradual furthering of evidence that will
be useful to many others in this field, particularly those endeavouring to integrate literacy instruction to
disciplinary curricular.
According to Wingate (2009), academic writing is an area that is widely recognised as a decisive factor
for student retention and progression. In the Pharmacy Department at the Kings College, London an
online course, the Scientific Writing Online Tool (SWOT) was developed. It aimed at enhancing the
reading and writing abilities required for academic study and professional work.
In the UK, widening participation has posed a challenge for universities, student numbers have rapidly
increased Hassell (2007). According to Lillies (2001) writing is a major challenge for most students
entering university. The predominant approach to learning support at UK universities is remedial- based
on a “deficit model” of student learning Ivan and Lea (2006). Students who are deemed at risk are sent
outside the department to generic study skills courses, often offered in dedicated support units. This
extracurricular approach to teaching writing has been frequently criticised as ineffective because writing

27
cannot be divorced from subject content and knowledge (Lea, Street and Lillis (2006). When writing is
taught outside the discipline, students have little opportunity to understand what their discipline requires
and what their lectures expect. Therefore as North (2005) puts it, the necessity of teaching writing within
the discipline has continually been stressed by researchers of disciplinary genres.
Regarding current understanding of academic literacy, Leki and Braine (2002), describe a range of
research studies and argue that academic literacy includes more than just knowledge of discrete
language skills or appropriate language use in context. It needs to be understood holistically and includes
for example competence in reading, writing, critical thinking, knowledge of independent learning
processes, tolerance of ambiguity effective practice of good judgement and development of a deeper
sense of personal identity. The concept and discourse of “Developmental Education is specifically North
American, while in most other parts of the world, broader terms like Academic Development and learning
Assistance are used.
Boylan (2001) suggests that learning assistance has always been a part of university life in the USA since
there has always been underprepared students at these institutions. He, for example shows how early
admission requirements included a basic literacy in Latin and Greek, in addition to English and thus most
students required tutoring prior to attending university. He further shows that by 1889, 80% of American
College and universities had college preparatory programmes to assist underprepared students who
constituted over half of the student cohort. Informal tutoring and assistance to students were no doubt
part of the programme in most Anglophile countries, however unlike in the US, an awareness of the need
for specific learning assistance to help students meet the demand of tertiary education, did not truly
manifest itself, until the 1980‟s and the beginning of the reforms demanding universal tertiary education in
countries like the UK, Australia, Canada and New Zealand.
Corporate reform in education, including lowering of government per capita expenditure on tertiary
education also lead to the active recruitment of foreign students to make up the financial deficit.
In Australia, the Dawkins reforms in education lead to a broader spectrum of Australians entering
university as well an increase in the demand for programmes to assist them to meet the expectations of
the academy Milne (2000). This change in the number of composition of students admitted to colleges
and universities in Anglophile countries coincided with the relaxation of Apartheid policies at South
African universities where limited numbers of black students were admitted to English medium
universities Boughey (2005).

28
2.6.2 South African research in academic literacy as a support programme
Pavlich and Orkin (1993) allege that in the early 1980‟s, the historically white liberal universities began to
admit small numbers of black students as a result of relaxed state apartheid policies. In 1993 the
apartheid government passed the University Amendment Act (Act 83 0f 1983) also known as the „Quota
Act‟, in an attempt to control the number of black students these universities could admit, which
universities vociferously resisted. Torr (1991) gives an indication of the discourse underpinning early
Academic Support Programmes ASP‟s when she notes that they were developed to assist students
without necessary background to be able to benefit immediately from lecturers and tutorials. Early
initiatives were therefore inherently liberal in intent in that they focused on attempting to give black
students equal opportunity by filling the gap between their poor socio-economic and educational
backgrounds and university.
As a result of a review of Academic development literature, Boughey (2005) identifies a number of
activities as characteristic of early academic support work, some of which continue to this day. The first
area of work concerned access and admissions and attempts to identify students with the potential to
succeed in higher education in spite of their poor scores on the matriculation examination and
disadvantaged backgrounds. The second area of work identified by Boughey relates to attempts to
address the phenomenon. In attempting to assist these „new‟ students, South African academics followed
the individual “deficit” or remediation policy used in other anglophile countries and described student
difficulties as arising out of problems of using English as a second language and sometimes the
deprivation of their background Boughey (2005). Although Boughey and McKenna (2004) refer to this
new phase as the Academic support phase, they explain that many of the assumptions and practices
underlying this phase, are still prevalent in a number of institutions and that the different “phases” of
academic development often occurs simultaneously.
Lea and Street (1998) states that these attempts in academic support could be said to subscribe to the
study skills‟ view of academic literacy, as well as the academic socialisation view since they attempt to
teach the students‟ atomised skills along with the academy's prescribed ways of thinking and operating.
These support programmes, however are constantly at risk of closure since their “additional” nature
makes them vulnerable to budgetary constraints or internal institutional politics, and they are often
inadequately staffed with temporary or poorly qualified teachers, housed in poor facilities and their
purpose is often ill-defined as denoted by Barefoot, Boylan and Boughey (2005).
Boughey (2005) points out that the focus on the first year experience in developmental education can be
contrasted with Academic Developmental phase in South Africa, which meant that the university was
29
seen as a community of practice into which the students needed to be apprenticed and an end goal of
tertiary education, rather than prior to starting the course.
Boughey (2005) identifies a third phase of academic support practises in South Africa, namely the
institutional development phase, where the focus is on “best practises” and although support structures
common to the academic support or „Academic developmental phases are still found, they are part of a
wider institutional focus on „quality‟. In this model rather like the „academic literacy‟s‟ approach, the focus
is on situated literacy, thus it is important for neophytes to be fully involved in their mainstream course in
addition to receiving support and development.
Boughey (2005) describes two ways of integrating mainstream and developmental courses, the
augmented course, where normal tuition hours are increased and support and development forms part of
the course in order to ensure teaching in context and „half courses‟ in which courses are run over a longer
period of time with more opportunities for support and development.
2.7 ACADEMIC LITERACY; WSU CONTEXT
2.7.1 WSU as an institution
WSU which is a newly merged multi-campus higher education institution, which was established in July
2005, through the merger of Border Technikon, Eastern Cape Technikon and the University of Transkei.
It is situated in the second largest province in South Africa and one that is hardest hit by high
unemployment and poverty levels. It is a comprehensive university and therefore has university and
Technikon access programmes and short courses. As a unique comprehensive University, WSU offers a
wealth of academic choices together with articulation and mobility across the qualification spectrum-
ranging from certificated to diplomas, degrees and postgraduate studies. Higher education institutions
today must ensure their viability and relevance and serve the needs of their clients, the government,
commerce and industry and the communities in which they are located. The investment of taxpayers‟
funds into higher education demands a return in the form of graduates who are equipped to drive the
economy.
Strategically situated within the Eastern Cape, WSU straddles a vast spectrum of the urban and rural
divide of the region. This provides the university with the means to engage intensely with the drivers of
development, so that an appropriate programme and research mix can be formulated that will profile the
advantages of both academic and technological programmes.
30
WSU is a strong, vibrant and viable institution with a host of investment and growth opportunities for
research and development partnerships between the academic, governmental, non-governmental and
corporate environments. This will guarantee the advancement of the national agenda for protracted
delivery. The developmental challenges that confront WSU, amongst others include the holistic
development of both academics and learners, provision for concurrent academic support, curriculum
development, academic guidance, including career options and institutional support to Further Education
and Training (FET) colleges and schools.
2.7.2 The Centre for Learning and Teaching Development (CLTD).
In view of the above, the Centre for Learning and Teaching Development was established to address
these developmental challenges, through harnessing new skills, knowledge and attributes in developing
the university as a learning organization of the 21st century. The Centre for Learning and Teaching
Development therefore enables the University to provide institutional and integrated academic support to
learning and teaching as a visible concrete development to the institution‟s effort towards fulfilling its
mission and objectives.
2.7.3 The Extended Studies Unit (ESA): Goals, Objectives and Strategies
ESA focuses on Goal four of the CLTD‟s goals, objectives and strategies, which is to ensure an effective
and efficient system-wide approach to student access and retention by assisting faculties and
cooperating with related institutional units. Its first objective is to provide opportunities that promote
student access leading to academic success. The second is to promote student retention through a Life
Skills curriculum. The third objective is to develop a tracking and monitoring structure for improved
learner performance. In its sixth, seventh and eight strategies, the Centre provides retention programmes
in academic writing skills, end-user computing skills and academic literacy skills. This section focuses on
academic support offered by the Centre for Learning and Teaching Development (CLTD) at Walter Sisulu
University (WSU), the Extended Studies Academy (ESA), its goals objectives and strategies, Academic
Support development, Academic Literacy. This historical perspective shows the Centre‟s clearly
established role at Walter Sisulu University as an Institution and the purpose of its creation.
2.7.4 Effectiveness of intervention programmes
The question of whether academic literacy courses are effective was raised by Van Dyk (2005).
Improving the effectiveness of academic support is perhaps the most important issue confronting
universities. Most entering students arrive with academic skills that do not allow them to participate
effectively in university first year level courses Perin (2001). There has been much debate as to why
31
students are not achieving success. Many have suggested that the answer lies in the lack of
preparedness among first-year cohorts. Shay (1994:2) states that concerns about the school-leaver
applying to universities in South Africa have been voiced for more than a decade now with “ increasing
numbers of students in the educational system who for reasons of language, socio-economic status, or
cultural background, experience serious and persistent problem in interpreting academic tasks. At WSU
and also in other higher education institutions, these academic support programmes have been offered in
varying forms, but not much in-depth research appear to have been conducted as to the efficacy and
appropriateness. Such research has been hindered on a number f levels, by the fact that, as to many
variables impact on the student success, it is difficult to relate to success, or lack thereof to a specific
intervention.
Many of these students leave or drop-out from university because of academic problems. Thus as
Summers (2003) pointed out that many institutions‟ primary strategy for reducing attrition is the early
identification of students likely to drop out and the development and implementation of intervention
services for those students.
Todd (2002) argues that academic support programmes need to go beyond limited programmes to
programmes such as one-on-one counselling for students in academic difficulty. They also must have a
broader mission of engaging the faculty and administration in their academic support mission. He further
asserts that, a weak or marginalized academic support programme can have a detrimental effect of
enabling a school in continuing a dysfunctional teaching and curriculum structure that creates barriers for
many students and prevent their ultimate success.
Smith (2003) posits that, with rising intakes of students from disadvantaged backgrounds, pressure on
universities to deal with high failure rate is growing. A multiple pronged strategy that focuses on the
various facets of learning such as; teaching styles, content, prior learning, learning environment and
background circumstances. Murray (2010: 62) states that if universities are to meet their moral obligation,
they need to identify those students at risk and intervene in a timely fashion, in order to ensure that these
students have every chance of success as students and as graduates.
2.8 ASSESSMENT OF ACADEMIC PREPAREDNESS
Warren (2002:88) recognise that not all students enter higher education at the same level of
preparedness and that guidance may be needed for some students. As mentioned before, universities
are faced with underpreparedness of students for tertiary education. Delyser (2003:169) stated her

32
concern over undergraduate students being underprepared with regard to the writing skills and
techniques needed at university level. Thompson and Cronje‟ (2001:8) also agree on the links of
language skills to information literate person. One of the problems faced by many students is a lack of
linguistic competency, which handicaps them severely in using information effectively.” In South Africa
many students, says Hugo (2003:48), do not become literate at school and struggle with basic literacy at
tertiary level. A large number lack the ability to perform academically as their skill is not in line with the
academic standards of tertiary studies. At university, readers should know how to critically analyse text so
that they are able to form their own perception and critically examine the text and apply own concepts
and ideas. Most students are insufficiently prepared for the rigors of university study.
Students are more likely to succeed in settings that provide faculty staff and students frequent feedback
about their performance. This refers not only to entry assessment of learning skills and the placement
that should follow, but also to early warning systems that alert institutions of students who need
assistance, so that assistance can be provided early enough to make a difference. How do we then
assess academic preparedness of first time university students? Many South African universities have
developed selection and placement tests to admit students whose possible ability to succeed may not be
reflected in their school leaving results Yeld (2003). A placement test is used to assess students „ability at
the beginning of the course and at the end of a course. These tests do not assume prior knowledge of the
topic and instead provide relevant information Yeld (2003). According to Weideman (2006) the purpose of
the these tests is to a large extent determined and required by the higher education context of South
Africa, in which larger numbers of potentially underprepared students have found their way into tertiary
studies. Weideman (2003) further states that these tests are based on the understanding that language is
more the parts it is composed of (grammar, vocabulary, sound) and more than the skills through which
competence is displayed (listening, speaking, reading and writing. The tests provide several texts with
multiple choice questions. The questions attempt to measure the ability to read for meaning, extrapolation
and application, inferencing, ability to separate the essential from the non-essential and similar aspects of
reading. These tests are not achievements tests for the discipline-specific writing tasks which students
have been taught.
2.8.1 Which tests have been used?
The use of Placement tests is a universal practice. Parsad, Lewis and Green (2003) found that 92% of
two year institutions use placement tests scores for placement into remedial education. The two tests that
dominate the market internationally are the ACCUPLACER and the COMPASS developed by the Board
of colleges. The ACCUPLACER suite includes a written essay exam as well as computer adaptive tests

33
in five areas; sentence skills (20 questions), reading comprehension (20 questions), arithmetic (17
questions), elementary algebra (12 questions) and college level, math (20questions). Similarly, the
Compass offers a writing essay as well as untimed computer –adaptive exams in reading, writing skills
and mathematics. Both ACCUPLACER and COMPASS offer school the option of including
supplementary background questions to collect information such as whether English is the students‟ first
language, whether the student studied algebra in high school, and years since the student‟s last math
class. Other tests that are used internationally are the International English Language Testing (IETS) and
the Test of English as a Foreign Language (TOEF).
In South Africa there is a battery of tests that is used by individual institutions and for a variety of
purposes. Most of these tests are originally designed at the University of Cape Town as Alternative
Access Research Project AARP tests. One of these tests is the Test for Academic Literacy Level (TALL),
a test which is used by three South African universities, the University of Pretoria, Stellenbosch University
and the North West University. This test provides a reliable and affordable alternative means of assessing
the academic literacy of new entrants into the higher education sector. There is also the Placement Test
for English Educational Purposes (PTEEP) which is mostly used by the University of Cape Town for
students who have applied to any faculty. It incorporates a combination of teaching, modelling and
practice elements and opportunities.
The latest is the National Benchmark Test (NBT) which aims at giving information on the ability of
prospective students in language, mathematics and numeracy that will supplement the new grade 12 exit
examinatiouns.
2.8.2 The SATAP and its origin
The SATAP English test aims at determining the academic literacy skills that entry level students should
demonstrate as a predictor of the preparedness and success in tertiary education. It assists in identifying
students who might need academic intervention in order to cope with their studies.
These tests are nationally developed by interdisciplinary teams of experts, including academics from
WSU and are used by about 12 institutions in the country. The Language SATAP test aims to assess
students‟ abilities in terms of the following:
To make meaning from the texts that they are likely to encounter in their studies.
To understand words and discourse signals in their contexts.
To identify and track academic argument.
To understand and evaluate the evidential basis of argument.

34
To extrapolate and draw inferences and conclusions from what is stated or given.
To identify main from supporting ideas in the overall organization of a text.
To understand information presented visually (graphs, tables, and flow charts).
To understand basic numerical concepts and information used in text, including basic numerical
manipulations.
The results of the SATAP indicate that a review of learning, teaching and assessment practices is needed
to accommodate the current student profile.
2.8.3 Why was the SATAP chosen?
SATAP tests were chosen by the researcher because they are tests that are officially used by WSU. Also,
studies that have been conducted have proven SATAP to be adequate for assessing and predicting
future academic performance of first year students at tertiary institutions. One such study entitled “Is the
SATAP test an indicator of academic preparedness for first year students” was done at the Cape
Peninsula University of Technology CPUT by Scholtz and Allen-lee (2007: 919-939 ).
The second study by Van Schoor (2010: ) also assessed the academic preparedness of distance
learning students using SATAP scores. His findings were that SATAP scores provide useful diagnostic
information that can be used to develop course materials and to provide students‟ academic
preparedness and contributes to increased success. Therefore SATAP is one of the best tests for testing
academic preparedness in first year students it the best to test academic preparedness?
2.9 EXTENDED STUDIES
In line with the strategic planning, CLTD was established with the specific mandate of putting in place
learning and teaching developmental strategies and plans. WSU through CLTD, sought to centralise the
planning and coordinating function of learning and teaching development while also de-centralising the
implementation thereof. This was adopted within the dictates of academic development practice in
particular whereby the Centre, as a result of its pedagogic authority, was expected to implement its
agenda which one of them is the Extended Programmes Studies. The extended studies programme
strives to assist students from educationally disadvantaged backgrounds. This is done through alternative
access for students who would not automatically qualify for direct admission. A limited number of
students who show potential to succeed are selected and are exposed to a carefully designed supportive
learning environment which enhances their ability to succeed. The CLTD comprises of five units. The
Continuous Professional Development Unit CPDU, the Education and Training and Innovation Unit ETIU,
the Career Development Unit CDU, the Further Education and Training Unit FETU, and lastly the

35
Extended studies Academy ESA which is the unit that deals specifically with the retention of skills-based
academic support programmes which was previously referred to as the Student Academic Development
Unit (StAD). One of its main functions is to coordinate and develop skills-based retention programmes
such as Academic Literacy, Computer and Information Literacy, Life Skills and the Writing and Reading
Centre. It also has a mandate to track and monitor learners‟ academic performance and provides early
intervention which is a shared function with the Career Development Section, in order to increase
retention and improve throughputs.
The pro-active student support strategy has six deliverables, which amongst them is to establish periodic
review of student progress and undertake proactive interventions, where appropriate, by a member of the
student academic development team.
3.0 CONCLUSION
This chapter has presented a theoretical framework that supported the Academic Literacy Intervention
(ALI) provided to the first year students in the University with the extended programme option. Various
approaches were selected and applied to form this study‟s theoretical framework. The ALI was developed
upon the underlying theories and concepts set by the theoretical framework and conducted by the
cooperative effort of the lecturers of the ALI and the personnel of the CLTD at WSU. The research
methodology applied in the inquiry to evaluate the effectiveness of the Academic Literacy Intervention
programme is discussed in chapter three.
Programme evaluation is an area of applied social science research that has grown rapidly over the past
thirty years, and holds great promise to those social scientists who wish to conduct research with high
social relevance. Evaluation research in South Africa was relatively unknown until the 1980‟s, and it is
only in the 1990‟s that social scientists have demonstrated increased interest in the area. Although
programme evaluation is not the sort of activity that one can ever get exactly right, it is exhilarating to
know that this is not just research for its own sake, but research that makes a difference Martin Terre
Blanche & Kevin Durrheim:(2000).
These different forms of evaluation research are often combined in a single evaluation design, directed at
quality improvement Unran, Gabor & Grinell: (2001).Kantor, Schomer and Louw used a single group,
repeated measures design based on pretesting, post testing and subsequent follow-up of participants in a
stress management course, and established significant differences on a number of lifestyle measures.
This research followed the summative kind of evaluation where the same group will be used on pre-test
and post-test design, using the SATAP as an experiment treatment.

36
CHAPTER 3
RESEARCH DESIGN AND METHODOLOGY
3.1 INTRODUCTION
The purpose for conducting a literature review in the previous chapter was to establish a theoretical
foundation for the research that is described in this chapter. It also responded to the research questions
raised in chapter 1. It highlights aspects that need to be addressed in the empirical research in relation
to the general aims which emerged from the research question A significant amount of research
conducted in various countries indicates that language and literacy skills of university entry level
students is generally on the decline. This chapter focuses on the methodology of the study which
includes the following: the research design, data collection, sampling procedure, the pre-experimental
single group pretest -posttest design and the data analysis procedure.
3.2 RATIONALE FOR THE EMPIRICAL RESEARCH
The CLTD at WSU provides an array of academic support, interventions or enrichment programmes, as
some Departments refer to them, but there has been only a small pocket of in-depth research
conducted on the efficacy and appropriateness of these interventions and support programmes. As
Weidman (2003: 1) suggests in his abstract there is much to learn from an external peer or the expert
evaluation by a department that concerns itself with the assessment and development of academic
literacy because such situations provide an opportunity to step back and reflect on the foundations of
one‟s work and redefine its operational focuses.
The aim of this study therefore was to evaluate whether Academic Literacy, as an intervention
programme, has had any effect on the SATAP scores of the first year students admitted to the FSET
and subsequently improved the first year students‟ academic performance. The purpose of the
evaluation was also to assist in the subsequent planning and design of the extended studies curriculum
by probably exploring the skills gaps identified by this research study.
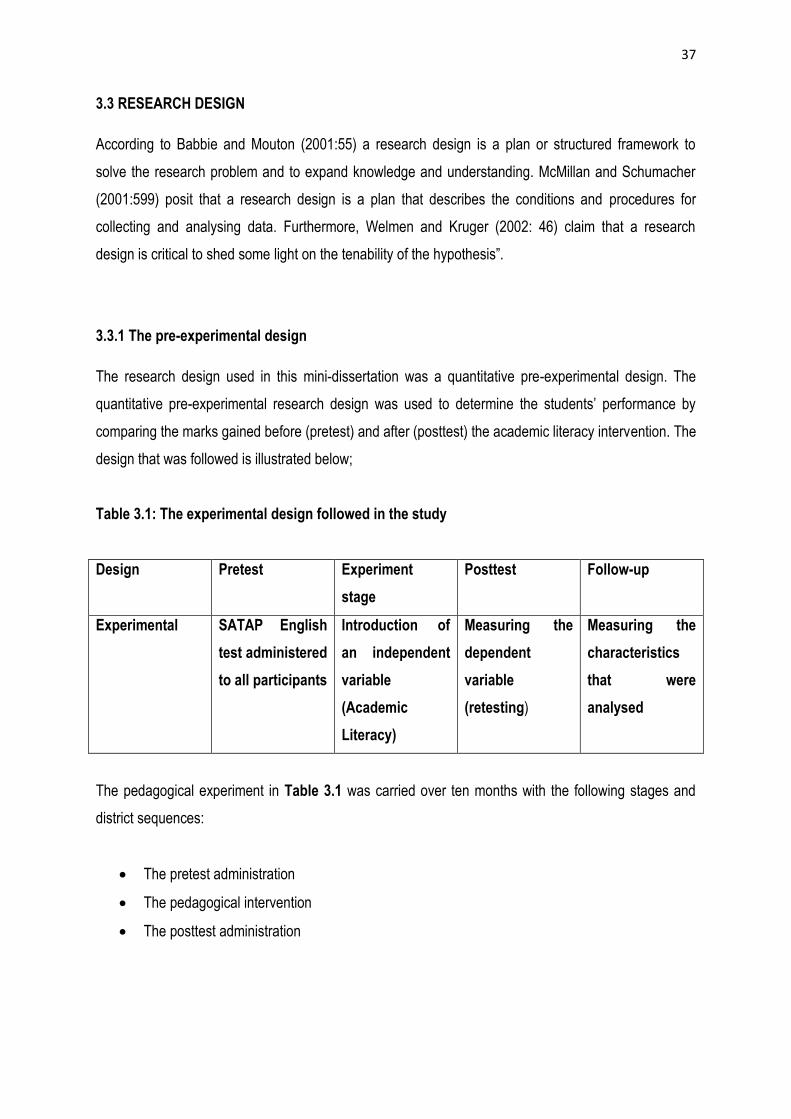
37
3.3 RESEARCH DESIGN
According to Babbie and Mouton (2001:55) a research design is a plan or structured framework to
solve the research problem and to expand knowledge and understanding. McMillan and Schumacher
(2001:599) posit that a research design is a plan that describes the conditions and procedures for
collecting and analysing data. Furthermore, Welmen and Kruger (2002: 46) claim that a research
design is critical to shed some light on the tenability of the hypothesis”.
3.3.1 The pre-experimental design
The research design used in this mini-dissertation was a quantitative pre-experimental design. The
quantitative pre-experimental research design was used to determine the students‟ performance by
comparing the marks gained before (pretest) and after (posttest) the academic literacy intervention. The
design that was followed is illustrated below;
Table 3.1: The experimental design followed in the study
Design Pretest Experiment
stage
Posttest Follow-up
Experimental SATAP English
test administered
to all participants
Introduction of
an independent
variable
(Academic
Literacy)
Measuring the
dependent
variable
(retesting)
Measuring the
characteristics
that were
analysed
The pedagogical experiment in Table 3.1 was carried over ten months with the following stages and
district sequences:
The pretest administration
The pedagogical intervention
The posttest administration

38
An advantage of the pre-experimental is that it gives the researcher the opportunity to determine
changes after the experiment, by using scores from the pre-tests and the post-tests AllPsych (2004:16).
The first SATAP test scores served as baseline scores that were compared to the scores achieved in
the same SATAP tests after the intervention of Academic Literacy support programme. The
disadvantage of a pre-experimental design is that there is an increased chance of error. “It cannot
establish cause and effect and it has no control of the independent variables. It is also difficult to rule
out the rival hypothesis with this design” de Vos (2002:320). The results were important indicators to
confirm the researchers‟ quantitatively derived hypotheses.
According to Firestone (1997:16), quantitative research is based on a positivist philosophy, which
assumes that there are social facts with an objective reality apart from the beliefs of individuals.
Nkobodi (1997:662) also claims that in quantitative research, a large sample can be used; resulting in a
more justified claim for a generalization of the results and one can investigate how changes in one
variable affect changes in other variables”. Using a quantitative approach allows one to measure,
describe, compare, classify, analyse and interpret relevant data relating to the effect of Academic
Literacy as a support programme on the SATAP scores of first-year students.
3.3.2 The single-group pre-test-post-test design
This pre-experimental design involved a single group pre-test post-test design, which allowed the
researcher to determine the impact of an experiment on the participants‟ pre-tests Neuman (1997:31).
The effect was evaluated by looking at the change in performance in the SATAP test administered at
the beginning of the year and the one administered after the intervention, at the end of the year. The
performance of the participants in the two tests was compared. The research design can be illustrated
as follows:
Figure 3.1: Illustration of the single-group pretest-posttest design
Fig.3.1 illustrates the single-group pretest-posttest design and the reason for using only a single group
and excluding the use of a control group, as would be the case in a quasi-experimental design, was the
Single
Group
Intervention Post-test Pre-test

39
logistical constraints. The research was conducted in a year. It would have been logistically unfair to
divide the group into two because the control group would have been deprived of the opportunity to be
exposed to the academic literacy programme, which is a prerequisite in their Faculty. In the single-
group pretest -posttest study a pretest had to be included to determine baseline scores. The
participants were a group of students admitted to four Departments that had extended their
programmes in the Faculty of Science, Engineering and technology (FSET). The number of participants
was the standard quota for the Faculty per SATAP seating in a year. The students who could have
been a control group were the students who were admitted straight into the mainstream, but according
to admissions policy, these students could not be subjected to SATAP writing. The experimental design
is illustrated as follows:
3.4. POPULATION OF THE STUDY
According to Welmen and Kruger (2002: 46) “ ....a population is the study object which may be
individuals, groups, organisation, human products and events or conditions to which they are exposed
and to Calder 1996:9 “ Population is only accessible if it can be identified and it can only be identified if
it is defined. Although the population was defined and identified in this study, permission for access still
had to be obtained from the university. The entire target population in the context of this study
consisted of all first year students that have been admitted in the FSET, which consists of four
Departments namely Civil, Electrical, Building and Mechanical Engineering. These students are
selected by their lecturers based on the performance in their grade 12 results.
3.4.1 The sampling procedure
The sampling procedure that was employed in this study was the convenient sampling method. The
convenient sampling method is a technique where a group of subjects is selected on the basis of being
accessible MacMillan and Schumacher (2006:125). The sample in the context of this study consisted of
120 students who did not obtain very good grades in their matric results. These students were
subjected to the SATAP writing procedure. The outcome of these tests will determine which curricular
route these students will take between the mainstream and the extended studies programme. The
Faculty specifies a quota of students who should be exposed to the tests. This was the group that
consisted the sample that was used. As Cresswell (2008) describes convenience sampling, as when
the researcher selects participants because they are willing or available, this group therefore was

40
readily available and was used as the sample of this study. Mugera (2013) also describes convenience
sampling, which is sometimes called haphazard or accidental sampling as the most common of all
sampling techniques, because, the samples are selected because they are accessible to the
researcher. Subjects are chosen simply because they are easy to recruit. The sample of this study is
comprised of 120 participants, from the same ethnic group which uses the same language. There are
differences in their ages but their educational background is the same. They however had one common
experience;being exposed to SATAP writing for placement and diagnostic purposes. The group
comprised of both male and female students.
3.5 DATA COLLECTION METHOD
As a means of collecting data the researcher used pre-tests and pos-tests, with the SATAP English test
as an instrument. This instrument was appropriate for this type of study as it was primarily quantitative
in nature and also had a standardised type of evaluation. According to Yee and Neimer (1996:68) a
pre-test and post-test design permits researchers to concentrate on observing and identifying the
changes that occur in each participant in a more reliable manner than any other design. This allows
researchers to make stronger inferences from the sample to the target population. This study followed a
longitudinal panel study that allowed the researcher the advantage of surveying the same sample of
students at two moments in time. The researcher was able to how much students had changed
between the two points in time, which were before the intervention of the Academic Literacy as a
support programme and after the intervention.
Figure 3.1 and 3.2 provide a summary of the data collection methods used to collect data from the
SATAP tests:
Table 3.2: Definition of Pretests and Posttests marks
Pre-test mark Post-test mark
Mark received for the students‟ first
SATAP English test.
Test was marked before the intervention
of academic literacy programme.
Mark received for the students‟ second
SATAP English test.
Test was marked after the intervention of
academic literacy programme

41
Test was marked by means of a
memorandum.
Test was marked by means of a
memorandum.
Table: 3.3: Illustration of the number of Departments and participants involved
DEPTS NUMBER of
STUDENTS
EXPERIMENT PERIOD
Building 30 Academic
Literacy
9 months
Civil 30 Academic
Literacy
9 months
Electrical 30 Academic
Literacy
9 months
Mechanical 30 Academic
Literacy
9 months
Total 120
3.5.1 The Standardised Assessment Test for Access and Placement (SATAP)
Standardised tests provide uniform procedures for administering and scoring them MacMillan and
Schumacher (2006).The same questions are asked each time the test is used and they are usually
prepared commercially by measuring experts. Their results are usually objective and relatively
uninfluenced by the person administering the instrument.
3.5.2 The academic literacy intervention procedure
The actual Academic Literacy intervention took place over the period of a year. Each week, the
Academic Literacy facilitator had a one-hour period on two days in each Department.

42
3.5.3 Measuring instrument
“............measurement refers to the process of describing abstract concepts in terms of specific
indicators by assigning numbers or other symbols to these indicators in accordance with specific rules”
Sullivan & De Jong in De Vos et al.(2002:166).
The measuring instrument used was the memorandum developed by academics from various
institutions in a test development workshop. The students‟ SATAP‟s multiple choice questions were
marked by the researcher, by comparing the answers given by the students to the answers given in the
memorandum. Powell (1997:41) states that “test-retest” correlation is a commonly used method where
the researcher uses the “same data collection instrument to observe or collect scores twice for the
same group of subjects”. The quantitative data collection process was completed.
3.5.4 Challenges encountered
Collecting data over a long period posed some problems to the researcher when the time for writing the
post-test came. The study was meant to use the same participants in order to observe any differences
in performance after the academic literacy intervention programme had been offered to them. Some
participants were lost along the way, some changed courses, others moved to different locations, and
yet others no longer wanted to participate, claiming to be busy with preparation for the examinations in
their core subjects. The researcher had to pursue them and also persuade them to participate.
Fortunately they were all found and the post-tests were administered.
3.5.5 Validity and reliability
The pre-test and post-test design permits researchers to concentrate on observing and identifying the
changes that occur in each participant in a more reliable manner than any other design allowing
researchers to make stronger inferences from the sample to the target population Yee & Neimer
(1996:28). “Longitudinal pretest and posttest design better equips Higher Education researchers to
estimate the genuine impact of intervention programmes on educational outcomes” Astin (1991:67).

43
3.6 DATA ANALYSIS
According to Welmer and Kruger (2002: ), researchers proceed inductively and “are inclined to study
individual cases carefully, also known as ideographic research, rather than study the average
tendencies of large groups as is the case in nomothetic research. Interpretations and discussion were
based on the numerical data presented in the Tables and above. Each figure was discussed separately
with its accompanying graph. The SPSS Statistical Programme was utilised to analyse the data. Data
were entered into a Microsoft Excel spreadsheet for organisational purposes. The statistical test that
was used was the t test method and paired test method. This method of analysis is appropriate for this
study as it is a statistical measure that is used to assess quantitative data. The data for this analysis
were obtained in the SATAP test scores. Frequency tables were also used to explain the differences
between the pre and posttest scores of the four groups.
The interpretation of the test results was based on marks obtained. The changes in percentages were
also discussed. Statistical methods such as histograms, averages and percentages were used to
compare the different variables. Data scores emerging from the documents were measured.
3.7 ETHICAL ISSUES
Ethical principles were applied as they served to safeguard the dignity, rights, safety and well-being of
all the participants in this research study Babbie and Mouton (2002:522).According to Graziano and
Raulin (2004:268) participants have the right to make their own decisions but they can only make
reasonable decisions if they have the relevant information on which to base their decision, the informed
consent principle. The participants were sent a consent form (Appendix A)
3.7.1 Approval for conducting the research
Signed consent was received from the lecturers of Academic Literacy and the Campus coordinator for
the Centre for Learning and Teaching Development (CLTD), after sending each a letter briefly
explaining the research study process and ethical obligations to be followed. Consent was also
requested and received from the programme coordinators of the four departments that participated in
the research process.

44
3.7.2 Informed consent
The participants, namely, first year students in the extended programmes of the Faculty of Science
Engineering and Technology and Lecturers of the Academic Literacy wereadequately informed of the
aims, process and ethical procedures of the research study. Participation was voluntary and
participants held the right to discontinue their participation at any stage of the research project without
any penalty. Participants were asked to sign a voluntary consent form that stipulated an understanding
of the research in which they would participate and giving the researcher permission to include their
inputs in the research study.
3.7.3 Confidentiality and anonymity
All the data that was collected was handled in a professional manner, where neither the participants‟
names nor any other information that could lead to their identification was disclosed. All data were kept
in a safe place under lock and key and will be destroyed two years after completion of the research, as
stipulated by university policy.
3.7.4 Deception of participants
Neuman (1997:449) depicts deception of participants as “telling half-truths or lies in order to get
individuals to participate in a research”. In this study the researcher did not engage in any form of
deception regarding the aim, content, practices or nature of this research. It was agreed upon that
participants and their institutions would receive feedback on request with regards to the research
procedure.
3.7.5 Physical harm, psychological abuse, stress or legal jeopardy
No participant was harmed or abused in any physical, psychological, legal or social manner while
participating in this research. The study was conducted within the normal process of students‟
attendance. Students were not disturbed by the research process; instead, they gained more
knowledge from the extra support, than those in the mainstream courses.

45
3.8 CONCLUSION
The research methodology and design were discussed in detail in this chapter. This study was
conducted in order to evaluate whether the academic literacy intervention programme had any effect on
the scores of the SATAP English test. The procedure that was followed was the use of pre-tests and
post-tests before and after the experiment group was exposed to the Academic Literacy intervention
programme over the period of a year. The method of data collection, data analysis and ethical issues
were also presented. Data were analysed by means of the SPSS statistical programme. Detailed
procedures that were followed have been sufficiently laid out in this chapter. The following chapter
presents the results and findings and the scores can be found in Appendix A and B after the final
chapter.
46
CHAPTER 4
DATA PRESENTATION, FINDINGS AND INTERPRETATION OF RESULTS
4.1 INTRODUCTION
The aim of the study was to evaluate the effect of the Academic Literacy intervention
programme on the SATAP scores of first year students, by comparing the pre-test and
post-test scores of participating first year students and to make recommendations to
providers and practitioners of intervention programmes and also to extended studies
curriculum designers and developers. This chapter focuses on the research results and
the findings of the study. It presents the findings that are gained through the process of
quantitative data collection and analysis. This includes the participants‟ marks obtained for
their pre- and post- tests, which highlight changes that occurred in their test performance.
Students completed a test prior to receiving instruction in Academic Literacy, which
exposed students to sophisticated forms of accessing and presenting knowledge that is
available in the academic world. The dominant quantitative data collection and analysis
process was undertaken, in which the students‟ academic performance was determined by
comparing the marks they obtained for the tests before and after the intervention
programme. This is a visual presentation of the baseline marks obtained before the
experiment. It is important to note that the test scores obtained before the Academic
Literacy intervention programme are referred to as pre-tests and the test scores obtained
after the Academic Literacy (AL) intervention programme are referred to as post-tests.
The findings are presented in tables as well as charts and inferential statistics. Section 4.2
presents the demographic profile of the participants. The participants were from the
departments; building (construction management and quantity surveying), electrical
engineering, mechanical engineering and civil engineering. The pretests and post test
results will be presented in section 4.3. A comparative analysis of the pre-test and post-
test results by department will be presented in section 4.4. The section will start with the
overall comparison of the results. Section 4.5 presents the item specification and item

47
breakdown comparative analysis of the pre-test and post test results. The last section
which is 4.6 presents the discussion of results.
4.2 DEMOGRAPHIC PROFILE OF PARTICIPANTS
The study had 120 students participating, 30 from each programme. For the purposes of
the study it was necessary to determine the ages and gender of the participants in the
experimental group. Thus, this section will describe the participant‟s age distribution and
gender. The data are presented in the form of a frequency table and for clarification; a
brief explanation followed each table. Frequency is depicted by f and a percentage by %.
4.2.1 Age distribution
Close to half of the participants were aged between 18 – 20 years as shown in Table 4.1.
Table 4.1:
Frequency table of the ages of participants in the four Departments
Age Frequency % Rank
18 – 20 years 58 48% 1
21 – 23 years 25 21% 3
Above 23 years old 37 31% 2
120 100.0%
Table 4.1 shows that most of the participants were between the ages of 18 and 23, which
is the appropriate age level for entry to the university. In this study it was found that a
noticeable percentage of students were older than 23. Reasons for this could be that they
had begun their school career much later than the age of 7, or that they had repeated
grades in their previous schooling. It could also be due to their socio-economic situation in
their homes.
The distribution of the ages of participants‟ across the age groups show that the majority
were below 24 years of age as depicted by the pie chart in Figure 4.1.

48
Figure 4.1: Pie chart showing percentage distribution of participants by age
Figure 4.1 is a visual presentation of the demographic item of age. It clearly shows that
21% (25) of the students that enter university are students that should be entering the job
market, 48% (58) are between 21-23 years of age while 31% (37) of the students are
above 23 years old. This developing trend is a cause for concern and is unfavourable to
both the students and the institution. This will result in their joining the job market-very late
in their lives.
4.2.2 Gender
Close to 70% of the participants were males as shown in Table 4.2.
18 - 20 years 48%
21 - 23 years 21%
Above 23 years old 31%
Experimental group

49
Table 4.2: Frequency table of participant’s gender in the four Departments
Gender Frequency % Rank
Female 37 31% 2
Male 83 69% 1
120 100.0%
Table 4.2 indicates that in this experimental group there were more males than females. Nevertheless
the distribution was typically representative of the clientele of the first entry level of the (FSET) at WSU.
Out of a total of 120 respondents 69% (83) were male and 31% (37) were female. However, this does
not match the gender breakdown of the overall student population in general at WSU. The general
gender distribution in the university show more females than males.
Figure 4.2: Pie chart showing percentage distribution of participants by gender
Figure 4.2 is a visual presentation of the demographic item of gender. This study found that the Faculty
of Science, Engineering and Technology (FSET) is male dominated. This distribution was typically
representative of the gender distribution in the Engineering Departments.
Females 31%
Males 69%
Experimental group

50
4.3 COMPARATIVE ANALYSIS OF PRETEST AND POSTTEST RESULTS OF
PARTICIPANTS
The test marks obtained before the academic Literacy intervention are referred to as pre-
tests and those after the intervention as post-tests.
4.3.1 Pre-test and post-test scores of participants
Table 4.3 indicates the pre -tests and post test scores of the participants.
Table 4.3: Frequency table of pre-test and post-test scores with percentages
Score range Pre-test Post-test
Frequency % Frequency %
< 39 85 71% - -
40 – 49 25 21% 8 7%
50 – 59 10 8% 20 17%
60 – 69 - - 30 25%
70+ - - 62 51%
120 100.0% 120 100.0%
This table was drawn to give a visual presentation of the marks obtained in the pre- test
before the Academic Literacy intervention programme and the post- tests results after the
intervention of Academic Literacy support programme. These were results in Table 4.3
indicate that there was a noticeable mark increase in the post-test scores compared to the
pre-test scores. Most students had moved from the low score ranges to the upper ones.
Table 4.3 above indicates the percentage of participant students who obtained scores in
the different scoring ranges of the SATAP English Test. It indicates that the percentage
scores of students who passed increased from 8% to 93%, thus giving an indication that
the intervention had played a very positive role on their SATAP scoring. The score range
70+ increased by 62% which was the most improved range. Thus, in the post intervention
test, the highest number of students faIl within the 70> score range, indicating a significant
improvement in the performance of the participants. This further indicates that the

51
participants may now be better prepared for the academic rigors of higher education. The
40-49 score range is the only one that showed a decrease of 14 %. Only 7% of the
participants in the post-tests fell in the 40-49 range.
The illustration of the distribution of scores is shown in Figure 4.3.
Figure 4.3: Multiple bar chart illustrating the pre-test and post-test score ranges
received by the 120 participant students
The findings in Figure 4.3 indicate how the participants scored in the pre-test and post-
test. This figure presents the distribution of scores in five score ranges. For the pre-test the
study found that 71% (85) of the students scored below 40% in the SATAP English test,
21% (25) of the participants scored in the 40-49 score range and only 8% (10) scored
above 50%. This paints a bleak picture for the both the throughput and retention rate of
the FSET. This could be a result of the discrepancies and inequities in their previous
schooling systems. These students may have come from a schooling background that was
characterised by under-resourcing, inappropriate approaches to learning and teaching or
socio economic inadequacies.
<39 40 - 49 50 - 59 60 - 69 70 +
0
10
20
30
40
50
60
70
80
% n
o o
f st
ud
en
ts

52
In terms of the post-test all participants scored higher marks than in the pre-intervention
tests as depicted in Figure 4.3. 51% (62) of the participants scored above 70%, 25% (30)
scored in the score range of 60-69, whilst 17% (20) scored in the in 50-59 range. Only 7%
(8) scored in the 40-49 score range, below 40.
4.3.2 Descriptive and inferential statistics of pre-test and post-test scores
This section presents the comparative analysis of the pre-test and post-test scores for the
overall group and also by department. Data analysis consists of the following approach:
• Descriptive statistics: This approach depicts the preliminary analysis of the data
collected for the research. The summary measures used to describe the data include the
summary measures like the mean, median, standard deviation, the range and etc.
• Normality tests and plots: Normality tests and plots were done to determine
whether the data was normally distributed or not. The approach was undertaken to
determine whether parametric or non-parametric tests can be used to compare means
across the paired data.
• Paired t-tests: A matched pair test is done when repeated observations are taken
from the same object. A matched paired t-test is done when one wants to find difference in
means between two related samples when data is normally distributed and data is
measured on an interval or ratio scale.
The assumptions are:
Assumption 1: The paired differences are independent.
Assumption 2: The paired differences are all identically normally distributed (same mean
and variance)
In this case the paired t-test was used to determine difference between pre-test and post-
test scores when data was normally distributed. The null hypothesis to be tested was:
Ho: The mean difference between pairs is zero
Ha: The mean difference is not zero

53
Thus the null Hypothesis (Ho) states that there was no change in the pre- and post-test
scores, and there is no statistically significance/difference between the means of the pre-
test and post-test scores whilst the alternative Hypothesis (Ha) states that there was a
change in the pre-test and post test scores, and there is a statistically significant/difference
between the means of the pre-test and post-test scores.
To test the hypothesis, the paired t-test was performed through the Statistical Package for
Social Sciences (SPSS). The paired t-test is used to compare the values of means from
two related samples, for example in a 'before (pre-test) and after (post-test)' scenario. The
difference between the means of the samples is unlikely to be equal to zero (due to
sampling variation) and the hypothesis test is designed to answer the question "is the
observed difference sufficiently large to indicate that the null hypothesis or alternative
hypothesis is true?” Each hypothesis is carried out under a section.
4.3.2.1 Descriptive and inferential statistics of pre-test and post-test scores of all
participants
The summary statistics for the pre-event and post-events for all participants are shown in Table 4.4.
Table 4.4: Summary statistics of pre-test and post-test scores as a percentage for all
participants
Summary
Statistics
Score
Pre-test Post-test di=Mark change
Mean 32.88 58.24 25.36
Median 31.25 57.81 25.00
Standard deviation 10.43 11.45 9.85
Skewness 0.379 0.031 -0.351
Kurtosis -0.985 -0.827 1.004
Maximum 54.69 84.38 54.69
Minimum 17.19 34.38 -7.81

54
Range 37.50 50.00 62.50
Coefficient of variation 31.72 19.66 38.84
The minimum and maximum scores for the pre-test were 17.19 and 54.69 respectively. The arithmetic
mean was 32.88 with a standard deviation of 10.43.
The minimum and maximum for the post-test were 84.38 and 34.38 respectively. The mean was 58.24
with a standard deviation of 11.45. In terms of the difference, the minimum and maximum values were -
7.81 and 54.69 respectively. The mean difference average was 25.36. This is far off from zero and thus
the null hypothesis of mean difference being zero might be rejected. The coefficients of variation were
31.72%, 19.66% and 38.84% for the pre-test, post-test and differences respectively. Thus, there was
large variability in the differences.
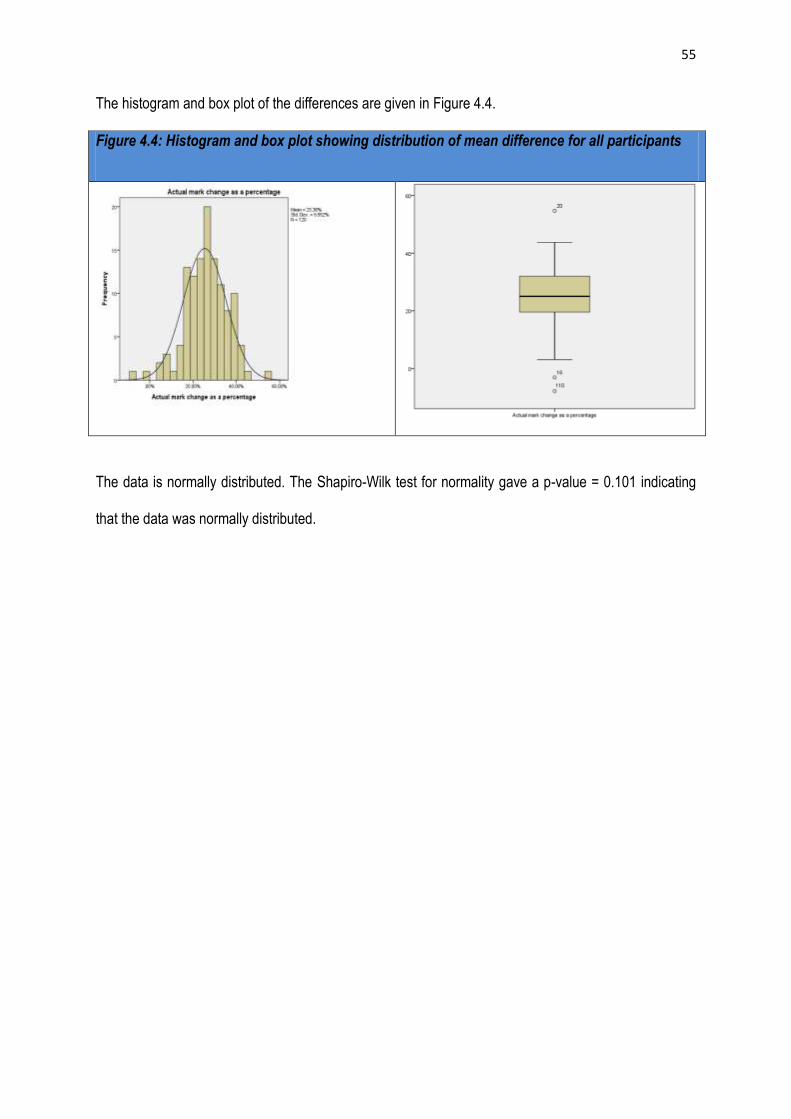
55
The histogram and box plot of the differences are given in Figure 4.4.
Figure 4.4: Histogram and box plot showing distribution of mean difference for all participants
The data is normally distributed. The Shapiro-Wilk test for normality gave a p-value = 0.101 indicating
that the data was normally distributed.

56
An error bar was constructed to determine whether the confidence intervals for the mean overlap. The
information is shown in Figure 4.5.
Figure 4.5: Mean difference 95% confidence interval
error bars for all participants
The confidence intervals do not overlap. At 95% confidence interval, one can conclude from the
intervals that the mean score of pre-test is significantly lower than the post test. This mean that the
intervention had an impact on the performance of the participants as can be seen from the 95%
confidence interval of the means which do not overlap. Since data was normally distributed, the paired
t-test was used to test the hypothesis whether the means are the same. The hypothesis was:
Ho: µd = 0
H1: µd ≠ 0
The following output was obtained.
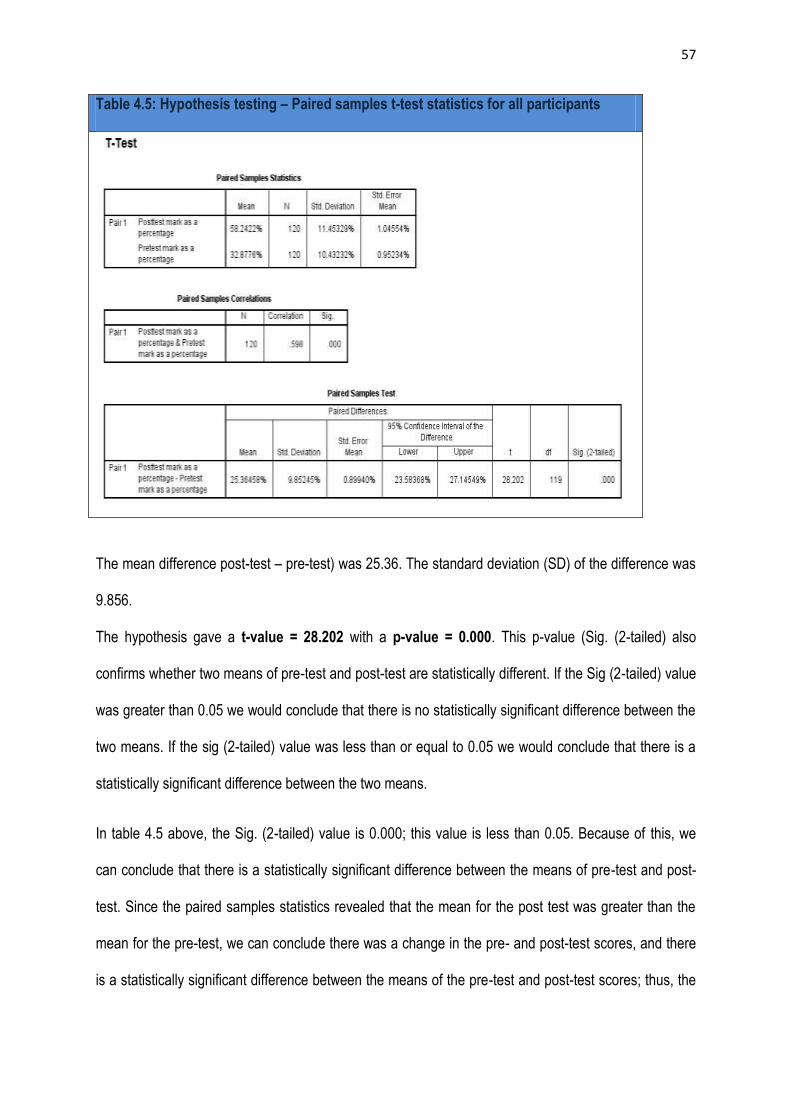
57
Table 4.5: Hypothesis testing – Paired samples t-test statistics for all participants
The mean difference post-test – pre-test) was 25.36. The standard deviation (SD) of the difference was
9.856.
The hypothesis gave a t-value = 28.202 with a p-value = 0.000. This p-value (Sig. (2-tailed) also
confirms whether two means of pre-test and post-test are statistically different. If the Sig (2-tailed) value
was greater than 0.05 we would conclude that there is no statistically significant difference between the
two means. If the sig (2-tailed) value was less than or equal to 0.05 we would conclude that there is a
statistically significant difference between the two means.
In table 4.5 above, the Sig. (2-tailed) value is 0.000; this value is less than 0.05. Because of this, we
can conclude that there is a statistically significant difference between the means of pre-test and post-
test. Since the paired samples statistics revealed that the mean for the post test was greater than the
mean for the pre-test, we can conclude there was a change in the pre- and post-test scores, and there
is a statistically significant difference between the means of the pre-test and post-test scores; thus, the

58
null hypothesis of equal means was rejected. The 95% confidence interval for the mean difference µd
was 23.58 to 27.15 which does not include zero signifying mean differences. The above results from
the quantitative pre-experimental design indicated an improved performance of participants from the
pre- to the post-test scores. There was also an improvement in the performance of the majority of
students, where the marks generally increased from the first and the last assessment of all participants.
4.3.2.2 Descriptive and inferential statistics of pre-test and post-test scores of the
building (construction, management and quantity survey) department
The summary statistics for the pre-event and post-events for the building department are shown in
Table 4.6.
Table 4.6: Summary statistics of pre-test and post-test scores as a percentage for the
building (construction, management and quality survey) department
Summary
Statistics
Score
Pre-test Post-test di=Mark change
Mean 34.32 63.80 29.48
Median 32.81 65.62 28.13
Standard deviation 10.02 9.49 11.11
Skewness 0.094 -0.660 -0.488
Kurtosis -1.004 0.615 1.683
Maximum 34.00 84.38 54.69
Minimum 12.00 42.19 -3.12
Range 22,00 42.19 57.81
Coefficient of variation 29.20 14.87 37.69
The minimum and maximum scores for the pre-test were 34 and 12 respectively resulting in a range of
22. The arithmetic mean was 34.32 with a standard deviation of 10.02. Thus before intervention
students had an average of 34%. It was slightly higher than the mean for all programmes.

59
The minimum and maximum scores for the post-test were 84.38 and 42.19 respectively. The mean was
63.80 with a standard deviation of 9.49. After the intervention, the participants from the building
department had an average of approximately 64%. In terms of the difference, the minimum and
maximum values were -3.12 and 57.81 respectively. The mean difference average was 29.48. This was
far off from zero and thus the null hypothesis of mean difference being zero might be rejected. The
coefficients of variation were 29.20%, 14.87% and 37.69% for the pre-test, post-test and differences
respectively. Thus, there was large variability in the differences.

60
The histogram and box plot of the differences are given in Figure 4.6.
Figure 4.6: Histogram and box plot showing distribution of mean difference for the building
department participants
The Shapiro-Wilk test gave a p-value = 0.305 indicating that the data was normally distributed.
However there was a potential outlier to the left as depicted in the boxplot in Figure 4.6.
An error bar was constructed to determine whether the confidence intervals for the mean overlap. The
information is shown in Figure 4.7.

61
Figure 4.7: Mean difference 95% confidence interval
error bars for the building department participants
The confidence intervals do not overlap. At 95% confidence interval, one can conclude from the
intervals that the mean score of pre-test is significantly lower than the post test. This means that the
intervention had an impact on the performance of the building department participants as can be seen
from the 95% confidence interval of the means which do not overlap.
Since data was normally distributed, the paired t-test was used to test the hypothesis whether the
means are the same. The hypothesis was:
Ho: µd = 0
H1: µd ≠ 0

62
The following output was obtained.
Table 4.7: Hypothesis testing – Paired samples t-test statistics for the building departmental
participants
The mean difference (post-test – pre-test) is 29.48. The standard deviation (SD) of the difference is
11.11.
The hypothesis gave a t-value = 14.537 with a p-value = 0.000. It is highly significant. Since p- value is
less than 0.05, the null hypothesis of mean difference zero was rejected at the 5% level of significance
and concluded that there was a statistically significant difference between the means of pre-test and
post-test. Since the mean for the post test was greater than the mean for the pre-test, we can conclude
there was a change in the pre- and post-test scores, and there is a statistically significant/difference
between the means of the building department participants. The 95% confidence interval for the mean
difference µd was 25.33 to 33.63. this does not include zero signifying mean differences. It shows that
on the average a participant improved by at least 25 marks.

63
4.3.2.3 Descriptive and inferential statistics of pre-test and post-test scores of the
electrical engineering department
The summary statistics for the pre-event and post-events for the electrical engineering department are
shown in Table 4.8.
Table 4.8: Summary statistics of pre-test and post-test scores as a percentage for the
electrical engineering department
Summary
Statistics
Score
Pre-test Post-test di=Mark change
Mean 31.82 59.32 27.50
Median 29.69 60.93 28.13
Standard deviation 9.67 10.12 6.71
Skewness 0.631 -0.308 -0.223
Kurtosis -0.429 -0.788 -1.028
Maximum 54.69 75.00 39.06
Minimum 18.75 39.06 15.63
Range 35.94 35.94 23.44
Coefficient of variation 30.39 17.06 24.40
The minimum and maximum scores for the pre-test were 18.75 and 54.69 respectively resulting in a
range of 35.94. The arithmetic mean was 31.82 with a standard deviation of 9.67 giving a coefficient of
variation of 30.39%. It can be noted that before intervention students had an average of 32% in the
electrical engineering department.
The minimum and maximum for the post-test were 75 and 39.06 respectively. The mean was 59.32
with a standard deviation of 10.12 giving a coefficient of variation of 17.06%. After the intervention, the
participants from the electrical engineering department had an average of approximately 59%. In terms

64
of the difference, the minimum and maximum values were 15.63 and 39.06 respectively. The mean
difference average was 27.5. This was far off from zero and thus the null hypothesis of mean difference
being zero might be rejected. The coefficient of variation of the mean difference was 24.40. There was
large variability in the pre-test scores.
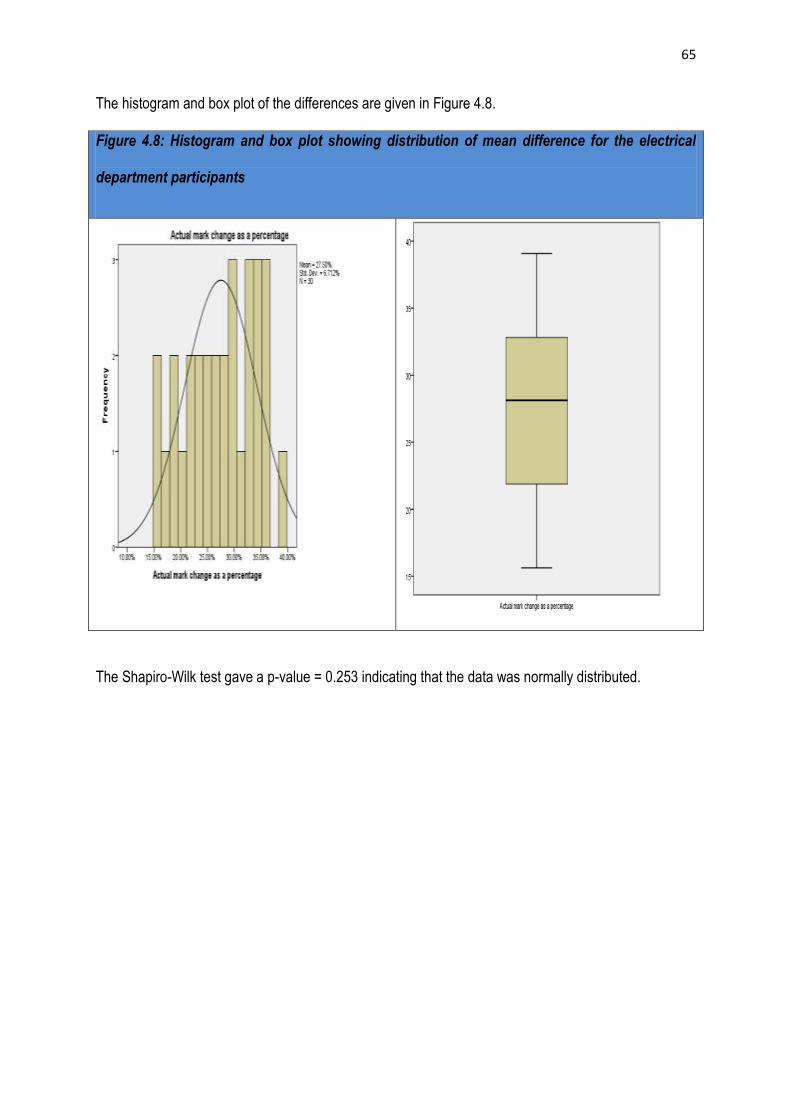
65
The histogram and box plot of the differences are given in Figure 4.8.
Figure 4.8: Histogram and box plot showing distribution of mean difference for the electrical
department participants
The Shapiro-Wilk test gave a p-value = 0.253 indicating that the data was normally distributed.

66
An error bar was constructed to determine whether the confidence intervals for the mean overlap. The
information is shown in Figure 4.9.
Figure 4.9: Mean difference 95% confidence interval
error bars for the electrical engineering department participants
The confidence intervals do not overlap. At 95% confidence interval, one can conclude from the
intervals that the mean score of pre-test is significantly lower than the post test. This mean that the
intervention had an impact on the performance of the electrical engineering department participants as
can be seen from the 95% confidence interval of the means which do not overlap.
The paired t-test was used to test the hypothesis whether the means are the same. The hypothesis
was:

67
Ho: µd = 0
H1: µd ≠ 0
The following output was obtained.
Table 4.9: Hypothesis testing – Paired samples t-test statistics for the electrical engineering
departmental participants
The mean difference (post-test – pre-test) is 27.5. The standard deviation (SD) of the difference is 6.71.
The hypothesis gave a t-value = 22.44 with a p-value = 0.000. It is highly significant. Since p- value is
less than 0.05, the null hypothesis of mean difference zero was rejected at the 5% level of significance
and concluded that there was a statistically significant difference between the means of pre-test and
post-test for electrical engineering department. The 95% confidence interval for the mean difference µd
was 24.99 to 30.00. Since zero is not contained in the interval we confirm that the means are different.
The electrical engineering participants improved by at least 25 marks.

68
4.3.2.4 Descriptive and inferential statistics of pre-test and post-test scores for the
mechanical engineering participants
The summary statistics for the pre-event and post-events for the participants are shown in Table 4.10.
Table 4.10: Summary statistics of pre-test and post-test scores as a percentage for the
mechanical engineering participants
Summary
Statistics
Score
Pre-test Post-test di=Mark change
Mean 32.66 57.08 24.43
Median 29.69 53.91 25.00
Standard deviation 11.43 13.82 7.41
Skewness 0.394 0.412 0.189
Kurtosis -1.190 -0.973 -0.845
Maximum 53.13 81.25 39.06
Minimum 17.19 34.38 12.50
Range 35.94 46.88 26.56
Coefficient of variation 35.00 19.66 30.33
The minimum and maximum scores for the pre-test were 17.19 and 53.13 respectively. The arithmetic
mean was 32.66 with a standard deviation of 11.43.
The minimum and maximum for the post-test were 81.25 and 34.38 respectively. The mean was 57.04
with a standard deviation of 13.82. In terms of the difference, the minimum and maximum values were
12.50 and 39.06 respectively. The mean difference average was 24.43. It was lower than the overall
mean. This is far off from zero and thus the null hypothesis of mean difference being zero might be
rejected. The coefficients of variation were 35.94%, 46.88% and 26.56% for the pre-test, post-test and
differences respectively. Thus, there was large variability in the post-test.

69
The histogram and box plot of the differences are given in Figure 4.10.
Figure 4.10: Histogram and box plot showing distribution of mean difference for the mechanical
engineering participants
The data is normally distributed. The Shapiro-Wilk test for normality gave a p-value = 0.331 indicating
that the data was normally distributed.
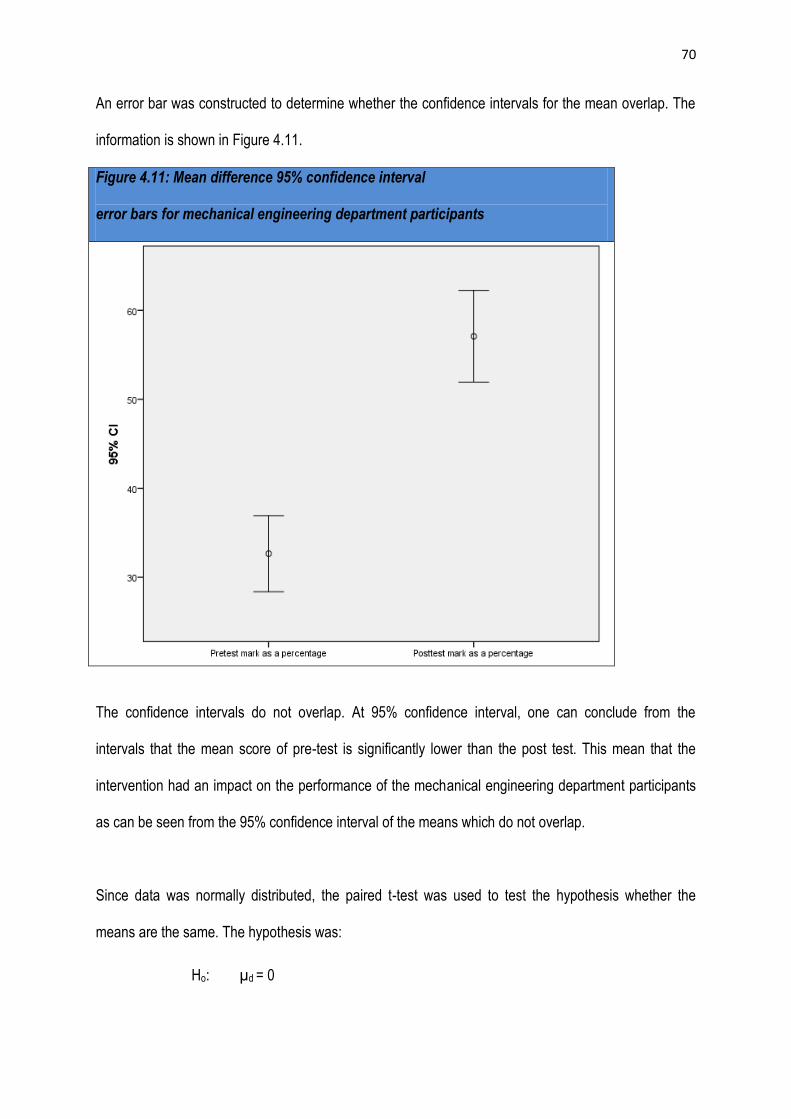
70
An error bar was constructed to determine whether the confidence intervals for the mean overlap. The
information is shown in Figure 4.11.
Figure 4.11: Mean difference 95% confidence interval
error bars for mechanical engineering department participants
The confidence intervals do not overlap. At 95% confidence interval, one can conclude from the
intervals that the mean score of pre-test is significantly lower than the post test. This mean that the
intervention had an impact on the performance of the mechanical engineering department participants
as can be seen from the 95% confidence interval of the means which do not overlap.
Since data was normally distributed, the paired t-test was used to test the hypothesis whether the
means are the same. The hypothesis was:
Ho: µd = 0
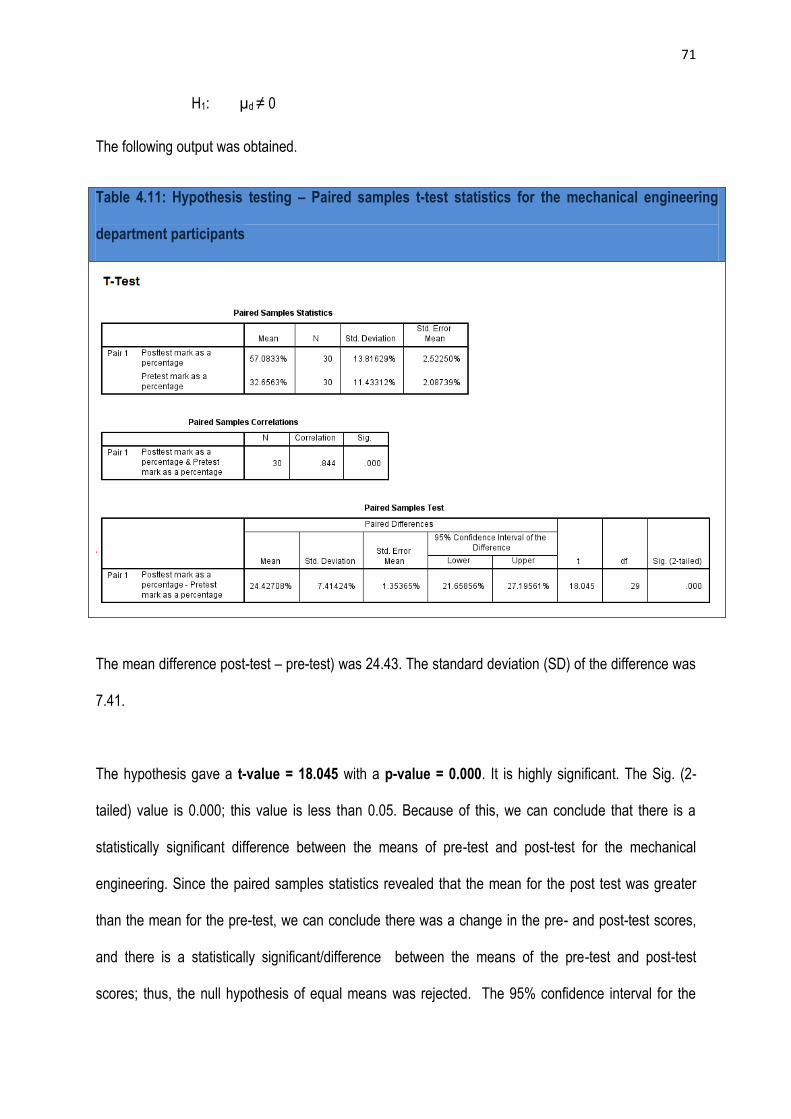
71
H1: µd ≠ 0
The following output was obtained.
Table 4.11: Hypothesis testing – Paired samples t-test statistics for the mechanical engineering
department participants
The mean difference post-test – pre-test) was 24.43. The standard deviation (SD) of the difference was
7.41.
The hypothesis gave a t-value = 18.045 with a p-value = 0.000. It is highly significant. The Sig. (2-
tailed) value is 0.000; this value is less than 0.05. Because of this, we can conclude that there is a
statistically significant difference between the means of pre-test and post-test for the mechanical
engineering. Since the paired samples statistics revealed that the mean for the post test was greater
than the mean for the pre-test, we can conclude there was a change in the pre- and post-test scores,
and there is a statistically significant/difference between the means of the pre-test and post-test
scores; thus, the null hypothesis of equal means was rejected. The 95% confidence interval for the

72
mean difference µd was 21.66 to 27.20 which does not include zero signifying mean differences. The
above results from the quantitative pre-experimental design indicated an improved performance of
mechanical engineering participants from the pre- to the post-test scores. There was also an
improvement in the performance of the majority of students, where the marks generally increased from
the first and the last assessment of all participants.
4.3.2.5 Descriptive and inferential statistics of pre-test and post-test scores for the
civil engineering participants
The summary statistics for the pre-event and post-events for the participants are shown in Table 4.12.
Table 4.12: Summary statistics of pre-test and post-test scores as a percentage for the
civil engineering participants
Summary
Statistics
Score
Pre-test Post-test di=Mark change
Mean 32.71 52.76 20.05
Median 30.47 53.13 20.31
Standard deviation 10.88 9.44 11.07
Skewness 0.473 0.367 -0.292
Kurtosis -0.910 -0.199 0.368
Maximum 54.69 75.00 40.63
Minimum 17.19 35.94 -7.81
Range 37.50 39.06 48.44
Coefficient of variation 33.26 17.89 55.21
The minimum and maximum scores for the pre-test were 17.19 and 54.69 respectively. The arithmetic
mean was 32.71 with a standard deviation of 10.88 giving a coefficient of variation of 33.26. The
minimum and maximum for the post-test were 75and 35.94 respectively. The mean was 52.76 with a
standard deviation of 9.44 giving a coefficient of variation of 17.89. In terms of the difference, the

73
minimum and maximum values were -7.81 and 40.63 respectively. The mean difference average was
20.05. This is far off from zero and thus the null hypothesis of mean difference being zero might be
rejected. There was large variability in the differences.
The histogram and box plot of the differences are given in Figure 4.12.
Figure 4.12: Histogram and box plot showing distribution of mean difference for the civil
engineering department participants
AZ
The data is normally distributed. The Shapiro-Wilk test for normality gave a p-value = 0.500 indicating
that the data was normally distributed.
An error bar was constructed to determine whether the confidence intervals for the mean overlap. The
information is shown in Figure 4.13.
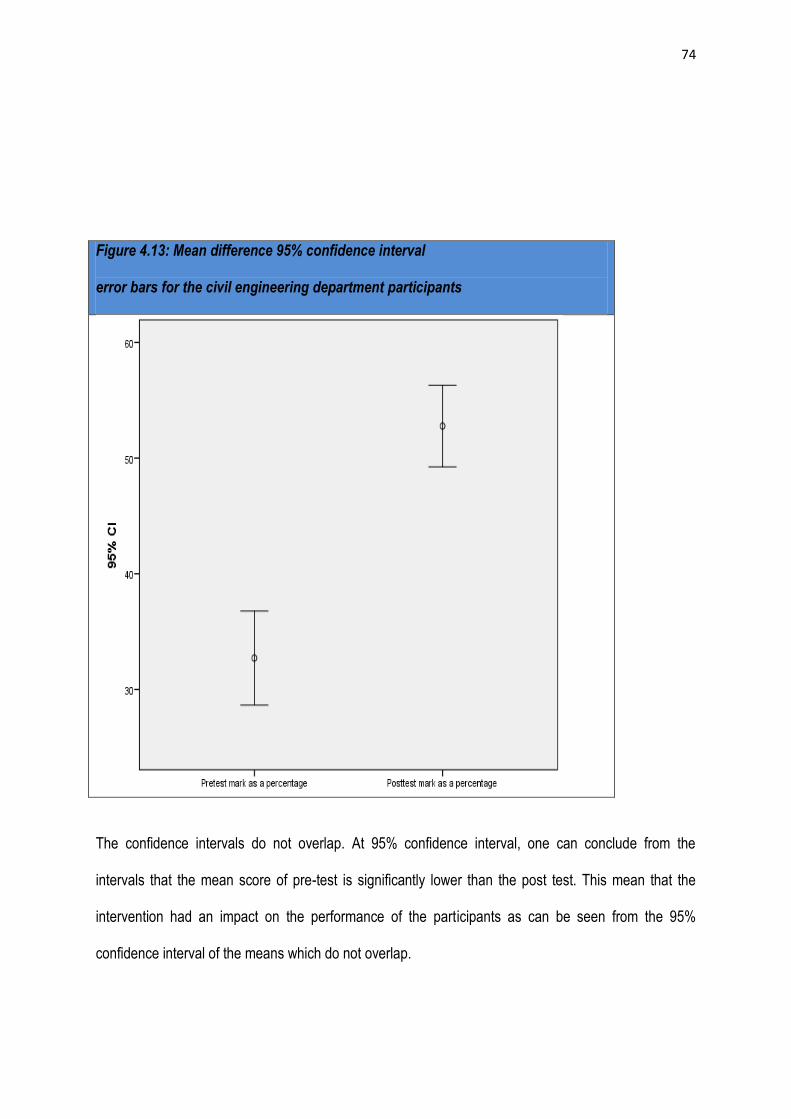
74
Figure 4.13: Mean difference 95% confidence interval
error bars for the civil engineering department participants
The confidence intervals do not overlap. At 95% confidence interval, one can conclude from the
intervals that the mean score of pre-test is significantly lower than the post test. This mean that the
intervention had an impact on the performance of the participants as can be seen from the 95%
confidence interval of the means which do not overlap.

75
Since data was normally distributed, the paired t-test was used to test the hypothesis whether the
means are the same. The hypothesis was:
Ho: µd = 0
H1: µd ≠ 0
The following output was obtained.
Table 4.13: Hypothesis testing – Paired samples t-test statistics for the civil engineering department
participants
The mean difference post-test – pre-test) was 20.05. The standard deviation (SD) of the difference was
11.07.
The hypothesis gave a t-value = 9.92 with a p-value = 0.000. Since the p-value is less than 0.05.
Because of this, we can conclude that there is a statistically significant difference between the means of
pre-test and post-test. Since the paired samples statistics revealed that the mean for the post test was
greater than the mean for the pre-test, we can conclude there was a change in the pre- and post-test

76
scores, and there is a statistically significant/difference between the means of the pre-test and post-
test scores; thus, the null hypothesis of equal means was rejected. The 95% confidence interval for the
mean difference µd was 15.92 to 24.19 which does not include zero signifying mean differences. The
above results from the quantitative pre-experimental design indicated an improved performance of
participants from the pre- to the post-test scores.
4.4 ITEM SPECIFICATION AND ITEM BREAKDOWN (PRE-TEST AND POST-
TEST)
This study utilised the SATAP English Test as its experimental instrument. SATAP is a
standardised test and therefore it may not be displayed because of its nature. Nevertheless, the
English aspects that have been
tested may be discussed and analysed. The researcher envisages that the results of this study
will inform the CLTD at WSU about the value and effectiveness of the intervention programmes,
thus providing guidelines on how they might be improved and how faculties might be advised in
this regard. The SATAP English Test comprised sixty four questions. The aspects tested are ten
in total. The table below depicts the aspects tested and the number of questions asked per
aspect.

77
Table 4.14: SATAP language aspects that are tested and number of questions per aspect.
English language aspects testes No .of questions Questions
Metaphorical Expression 9 1,32,33,36,40,43,46,47,48
Extrapolation, application and inferencing 9 4,7,18,19,31,34,37,39,45
Separating the essential and the non-essential 14 10,15,20,25,26,35,50,51,52,
53,54,55,56,57
Understanding relations between parts of a text by recognising indicators
in discourse
5 6,9,11,17,28
Understanding relations between parts of text by recognising indicators
of cohesion
8 5,8,12,14,22,30,39,40
Understanding basic numerical concepts and/or information used in the
text
1 27
Understanding the communicative function of sentences 4 2,3,21,24,
Understanding text genre (including audience, purpose, register....) 3 41,44,49
Vocabulary 4 13,16,23,29
Understanding information presented visually 7 58,59,60,61,62,63,64
Total 64
An analysis was done to determine English language aspects of the SATAP English
test which improved dramatically after the Academic Literacy intervention programme.
Table 4.15 shows the means of the pre-test and post-test of the aspects.
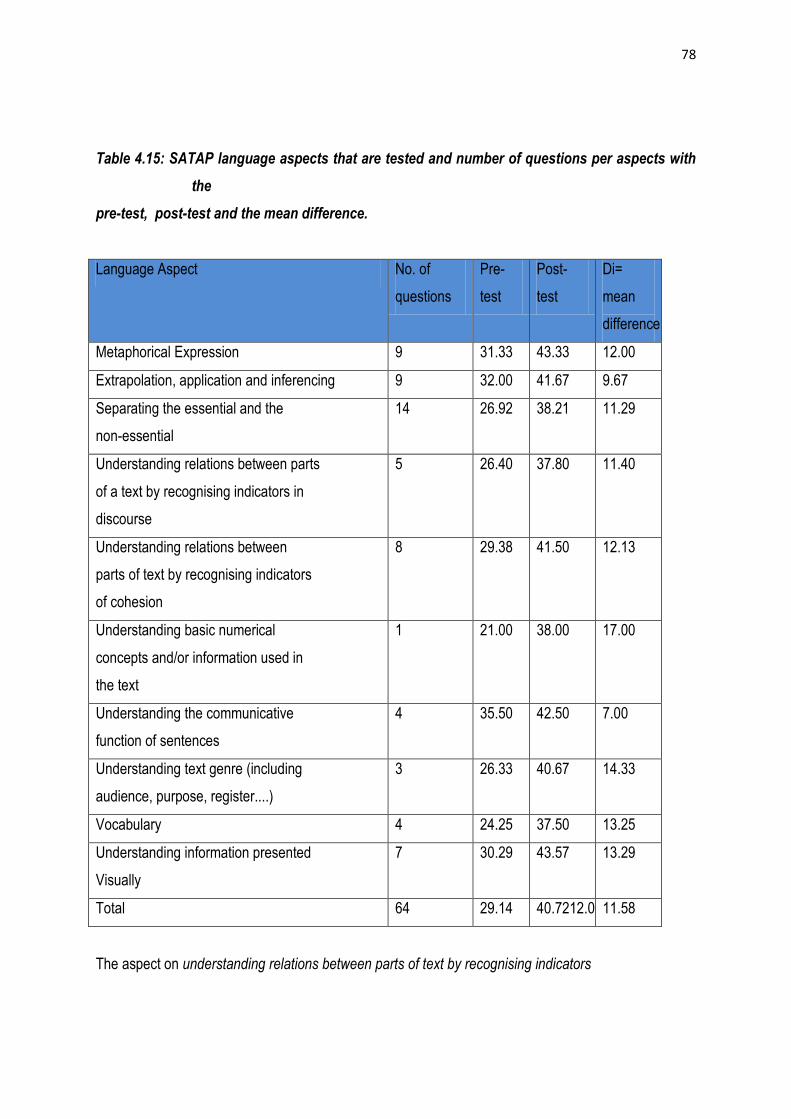
78
Table 4.15: SATAP language aspects that are tested and number of questions per aspects with
the
pre-test, post-test and the mean difference.
Language Aspect No. of
questions
Pre-
test
Post-
test
Di=
mean
difference
Metaphorical Expression 9 31.33 43.33 12.00
Extrapolation, application and inferencing 9 32.00 41.67 9.67
Separating the essential and the
non-essential
14 26.92 38.21 11.29
Understanding relations between parts
of a text by recognising indicators in
discourse
5 26.40 37.80 11.40
Understanding relations between
parts of text by recognising indicators
of cohesion
8 29.38 41.50 12.13
Understanding basic numerical
concepts and/or information used in
the text
1 21.00 38.00 17.00
Understanding the communicative
function of sentences
4 35.50 42.50 7.00
Understanding text genre (including
audience, purpose, register....)
3 26.33 40.67 14.33
Vocabulary 4 24.25 37.50 13.25
Understanding information presented
Visually
7 30.29 43.57 13.29
Total 64 29.14 40.7212.00 11.58
The aspect on understanding relations between parts of text by recognising indicators

79
of cohesion had the highest mean change difference of 17.00 whilst the aspect on understanding the communicative
function of sentences had the lowest mean change difference of 7.00.
Figure 4.14: Illustration of the language aspect from pre-test and post-test
The post-test scores were higher in all aspects. The histogram and box plot of the differences are given in Figure 4.14.

80
Figure 4.15: Histogram and box plot showing distribution of mean difference for the aspects
The data is normally distributed. The Shapiro-Wilk test for normality gave a p-value = 0.459 indicating
that the data was normally distributed.

81
An error bar was constructed to determine whether the confidence intervals for the mean overlap. The
information is shown in Figure 4.15.
Figure 4.16: Mean difference 95% confidence interval
error bars for the aspects
The confidence intervals do not overlap. At 95% confidence interval, one can conclude from the
intervals that the mean score of pre-test is significantly lower than the post test. This mean that the
intervention had an impact on the performance of the participants with respect to the aspects as can be
seen from the 95% confidence interval of the means which do not overlap.
Since data was normally distributed, the paired t-test was used to test the hypothesis whether the
means are the same. The hypothesis was:

82
Ho: µd = 0
H1: µd ≠ 0
The following output was obtained.
Table 4.16: Hypothesis testing – Paired samples t-test statistics for the difference in performance of
the aspects
The mean difference post-test – pre-test) was 11.58. The standard deviation (SD) of the difference was
4.29.
The hypothesis gave a t-value = 21.609 with a p-value = 0.000. Since the p-value is less than 0.05.
Because of this, we can conclude that there is a statistically significant difference between the means of
pre-test and post-test for the aspects. Since the paired samples statistics revealed that the mean for the
post test was greater than the mean for the pre-test, we can conclude there was a change in the pre-
and post-test scores, and there is a statistically significant/difference between the means of the pre-test
and post-test scores; thus, the null hypothesis of equal means was rejected for the aspects. The 95%

83
confidence interval for the mean difference µd was 10.51 to 1.65 which does not include zero signifying
mean differences. The above results from the quantitative pre-experimental design indicated an
improved performance of participants from the pre- to the post-test scores in terms of the aspects.
4.5 ANALYSIS OF RESULTS AND DISCUSSIONS
The effect of the Academic literacy intervention programme on the SATAP English test scores of all the
participants is analysed. The marks obtained by the students‟ pre-test and post-test were taken and
compared for analysis.
Tables and Figures served as visual presentation of the scores obtained for the pre and post-tests as
well as the percentage increases that occurred when the pre and post-tests marks were compared.
According to Table 4.4and Figure 4.5, all participants received a mark increase between their pre and
post-tests varied from -7.81% to a maximum of 54.69%. Some students‟ marks increased dramatically,
especially those who obtained low marks in their pre-tests. The improvement in the post-tests may have
been impacted by multiple variables because the students participated in numerous intervention
programmes that occurred simultaneously during the year.
With hundreds of variables having an impact on students‟ performance, the likelihood that one
intervention is responsible for the result is unlikely. For instance, these students have been exposed in
an English environment for about ten months by the time they write the post-tests. This environment is
likely to contribute to their basic interpersonal communications. These students had also had much
more experience in university tests by the time they wrote the post-tests. There was likely to be less
stress, because the pre-tests were written in the first stressful week at university. Nonetheless, whether
this change would have occurred without the application of the treatment or is an independent variable
cannot be claimed categorically. It could also be that the mere maturation by the participants caused
the change. Some students‟ marks increased only slightly, especially those that had a high mark in the

84
pre-tests. It is further notable that the scores for the pre-tests varied much more than those for the post-
tests. This does indicate that intervention programmes do have an effect on students‟ performance.
These results serve as supplementary evidence for the argument of various researchers in the field of
academic support that, academic intervention support does have an impact on student learning.
The results obtained in this study do highlight the urgent need for student support, especially for first
year students at university. A number of meta-analyses have sought to determine the overall influence
of intervention and support programmes on student outcomes. Collectively, literature suggest that
effective studying requires not only that the student possess knowledge of appropriately studying
techniques and practices, but also sustained and deliberate effort, self- regulation, ability to concentrate
and a sense of responsibility for , and value in one‟s own learning. Literature also suggests that
academic learning centres are vital in creating conducive learning environment, thus institutions should
ensure contemporary academic learning centres that offer intervention and support programmes
Aquino (2011:1116)
Finally future research is needed to further investigate how learning environment that integrates the
proposed framework for confluent academic interventions affects students‟ learning behaviour and
enhances students‟ education development. It is noted that the findings of this study are derived from a
single cohort of students from the same institution, thus the extent to which results are generalizable to
other content areas, therefore it furthers future investigation.

85
4.6 SUMMARY
This chapter dealt with the presentation and analysis of the results obtained from the study. It can be
concluded that the study yielded positive results. The findings lead to the acceptance of both alternative
hypotheses, which indicated a change in the pre- and post-test scores. The data analysis in this
chapter indicates that the intervention of Academic Literacy was effective in improving the SATAP
scores of first year Engineering students. Only 2 participants did not improve their scores. However, a
comparison with a control group would have reinforced this finding. It is hoped that this research will
assist the Academic Literacy section in aligning their support programme curriculum to be responsive to
the students‟ language learning needs.

86
CHAPTER 5
SUMMARY, CONCLUSIONS AND RECOMMENDATIONS
5.1 INTRODUCTION
According to Welman and Kruger (2002), a chapter on findings, conclusions and recommendations
should not merely repeat the results in the preceding section, but explain their meaning and
implications in the light of the purpose for which the research was undertaken. The purpose of this
chapter is, therefore, to summarise and draw conclusions regarding the elemental findings of this study.
This chapter also provides suggestions on how individuals can be guided to develop their academic
literacy skills as well as some suggestions on possible directions for further research in this field and
other related areas. The focus of this study was to evaluate the effect of the academic literacy
intervention programme on the SATAP English scores of first year FSET students. The problem of
inadequate academic literacy skills and the inhibiting effect it has on student performance were
described and contextualised in Chapter 1. Chapter 2 was devoted to a literature study on the
theoretical foundation of the study. Literature on the context of higher education students and academic
literacy intervention provided the researcher with knowledge about the research topic. In Chapter 3 the
research methodology that guided the data collection was described. Findings were derived from a
quantitative pre- and post-experimental design and analysed in Chapter 4. The summary of the findings
and conclusions are presented in the final chapter. Chapter 5 further makes recommendations and
offers suggestions for further research.
5.2 SUMMARY
The research was conducted within a theoretical and contextual framework which was constructed on
the emancipatory framework, containing various intertwined approaches and theories. This theoretical
framework served as a guide which oriented the research study process. This research study used a
quantitative pre-experimental design to collect and analyse data. According to the data collected and
analysed, all students‟ marks (with the exception of a few), increased in the post-test, which indicated a
positive effect of the intervention on the academic literacy skills and academic performance in the
SATAP English paper. The fact that students under study have passed the course increases their
chances of gaining access to higher educational institutions, and the fact that they have improved their

87
English Literacy skills increases their chances of succeeding at tertiary level”. Chapter 5 therefore
serves as an explanation of the findings derived and offered in Chapter 4. Reference was made to the
research context, research question, research aim, and method and research design. The research
aims were fulfilled by the conclusions drawn from the findings of this study. A discussion of the
recommendations and limitations of the study were also presented in the final chapter.
5.2.1 Fulfilling the aim of the study
The aim of the study was to evaluate the effect of the academic literacy intervention programme on
SATAP English scores of FSET first year students at the WSU who have the option of the extended
programme. Firstly, entry level students in the departments under study were subjected to a SATAP
test, which sought to identify the gaps in their English language skills. These weaknesses may have
been the result of their previous schooling provision. After the weaknesses were identified were
identified, the SATAP report was submitted to Academic Literacy lecturers, who focused their teaching
on the aspects identified in the test. A post-test was subsequently written after a year of instruction in
Academic Literacy as an intervention programme. Their academic performance on the SATAP test was
evaluated by collecting, comparing and analysing the students‟ test marks form before and after the
intervention. The pre- intervention test, therefore, identified the areas on which the curriculum planners
and designers needed to place greater emphasis during intervention. The aim of the study was
achieved and it was evident that the academic literacy intervention programme did increase the
students‟ SATAP English scores. In Chapter 1 the research questions were identified as follows:
Does the Academic Literacy intervention programme improve the STAP English scores of first-
year students in the FSET?
Was there an improvement in the SATAP scores after they were exposed to Academic Literacy
as an intervention programme?
Have the skills gaps identified in the pre-test been improved in the post-test?

88
5.3 SYNTHESIS OF RESEARCH FINDINGS
The synthesis of research findings provides a balance between the empirical findings and the literature
reviewed. Findings are highlighted before a conclusion is reached. The synthesis of research findings
is based on the main research questions:
Does the academic literacy intervention programme improve the scores of the SATAP English
test of first year students in the FSET?
This will be followed by the sub-questions:
Was there an improvement in the SATAP scores after they were exposed to the Academic
Literacy as an intervention programme?
Have the skills gaps identified in the pre-test been improved in the post-test?
The main research question formed the basis of the entire study, because an increase on the SATAP
scores after the intervention could mean that the language proficiency of the entire students has also
drastically improved as is shown in the mark increase. The mark increase may minimise the risk of
academic failure in these students; thus, providing them with a life-long opportunity to become
academically literate. It may also impact positively on the throughput and retention rates of the
institution.
5.4 CONCLUSIONS
This study was based on the main research question which was: Does the academic literacy
intervention programme have an effect on the SATAP scores of first –year students in the Faculty of
Science Engineering and Technology? Conclusions are drawn from the findings and discussed below.
The study was conducted in such a manner that its outcomes would assisted in addressing the
following research sub- questions:
Was there an increase in the SATAP scores after the academic literacy intervention
programme was offered to first-year students in the FSET?
Were the skills gaps identified in the pre-test improved in the post-tests after intervention?
What follows are the responses to these sub-questions.

89
5.4.1
Was there an increase in the SATAP scores after academic literacy intervention programme was
offered to first-year students in the FSET?
The main purpose of the study was to evaluate the effect of the Academic Literacy intervention
programme on the SATAP English scores of first-year students in the FSET. The sub-question,
therefore, was whether there had been an increase in the students‟ scores. The immediate response
was yes, the intervention had a significant effect on the scores, which is evident in Appendix: C, Table
4.5 and Figure: 4.5. The data gathered showed that the intervention programme was effective in terms
of improved scores and the percentages of each student. Although the study evaluated the Academic
Literacy intervention programme only, the possibility that the possibility that other factors may have
contributed to the increase in the marks of the students cannot be ruled out.
5.4.2
Have the skills gap identified in the pre-test been improved in the post-tests after the intervention?
Weideman (2006: vi, in the preamble to his book, states that language proficiency is an important
predictor of learner success, albeit not the only one. This sub-question requires the study to show
clearly whether the skills gaps that were identified from the pre-intervention tests (the findings in
Chapter 4,Table: Figure: ) have improved in the post-tests. This intervention may provide students in
the programme with an early opportunity to develop their academic language proficiency. The
intervention programme may further provide students with an opportunity to become academically
literate. The value of such support programmes is that they minimise the risk of academic failure.

90
5.5 LIMITATIONS AND SHORTCOMINGS OF THE RESEARCH
In the process of analysing the data that were collected more than once, several limitations of the study
became evident. These limitations constantly considered in this research. A primary limitation of the
study was the very nature of the study itself. The sample selected for this study was from one of the
four campuses of the Walter Sisulu University. The population consisted of students in the Extended
Programme who are exposed to the CLTD‟s intervention programmes. There were 30 students each
from the four Departments that participated in the study. Some students changed Departments during
the study and decided to discontinue their decided to discontinue their participation in the tests. The
researcher had to pursue them and persuade them to participate in the post-testing phase. Even
though these limitations placed constraints onto this research study, the findings still constitute a
valuable input to the applicable field of research.
5.6 RECOMMENDATIONS
This final section makes recommendations based on the findings of the research project and the
answers to the research questions which were provided in Chapter 1. Rather than offering academic
literacy academic literacy only to students in the Extended Programme, Mainstream lecturers also need
to build or infuse academic literacy skills into their offerings and be prepared to scaffold student
participation in these programmes.
The improvement in scores indicates that all students at entry level need to be exposed to tests that will
identify their strengths and weaknesses, and assess their academic preparedness, so that the support
that is provided for them is tailored to their generic language needs. It is further recommended that all
the intervention programmes offered by the CLTD be marketed extensively in all faculties and means to
make them easily accessible be devised. It is also recommended that an Academic Literacy policy be
instituted where all incoming students will be tested for Academic Literacy skills.
Peer Assisted Learning (PAL) sessions could also be used in a constructivist way through peer support
and group work. If needs be, the support could also be provided beyond first year and to mainstream
students as well as a university-wide programme. Management and lecturers could also be persuaded
of the need for more slots in the time-table for this programme, as Nassimbeni and De Jager (2002: )

91
found academics‟ attitudes to be one of the biggest challenges in the provision of new ventures in
universities.
It is further recommended that a holistic integrated approach (an asset or developmental approach as
opposed to a deficit approach) currently used by the WSU, be followed by integrating academic support
in high risk courses and also in the mainstream curricula route, to the benefit of prepared students. It is
finally recommended that the current name for this course be intensively discussed and decided upon,
as Academic Literacy is a very broad concept which is more pluralistic in nature, having a number of
sub-literacies. This can be misleading and confusing when a singular literacy is named.
5.6.1 Advocacy
Advocacy according to the Alliance for Justice (2008: 1) is the act of pleading for or supporting a cause
whose main objective is to sensitise, with a view to influencing decisions. Faculties have to buy into
these intervention programmes and collaboration between faculties and the CLTD should be
encouraged to avoid challenges such as time frames and difficulty in getting class periods for
intervention practitioners. Academics and students need to be educated in the importance of these
programmes to the entire institution. The CLTD should collaborate with Faculties to enhance students‟
language skills for students to ensure that they are adequately equipped with language skills that will
prepare them for the rigors of university study. It is important to market the Academic Literacy
intervention programme broadly to the WSU community. Academic Literacy should be considered an
essential part of improving throughputs especially in the pass rate of first year students, and the
process of academic monitoring of all first years should be emphasised. A more efficient use of the
academic support programmes which should be viewed positively by both staff and students coupled
with better teaching and learning skills may produce further improvement. Professional development for
lecturers is also a crucial ingredient in improving reading outcomes and preventing reading difficulties.
Lecturers‟ teaching skills should also be strengthened and lecturers‟ knowledge of the reading process
increased. The integration of newer research on reading should be incorporated into their teaching
practices (Snow: 2008).

92
5.7 SUGGESTIONS FOR FURTHER RESEARCH
The researcher recommends continuous research in the field of Academic Literacy in order to keep
abreast with new developments and also to keep pace with the most recent definitions and approaches.
Kern (2000:23) notes that “Literacy is an elastic concept; its meaning varies according to the
disciplinary lens through which one examines it”. Any two people will thus seldom hold the same
conceptual framework of the term. It therefore needs to be continually revisited. A longitudinal study
could again be conducted to determine what value academic literacy skills have on the students‟
academic success, institutional throughput and retention rate. This study could also be done on two
groups, those in the extended programme and those in the mainstream programme as a control group
would provide more valid results for the enquiry.
In conclusion, it was evident from the various analyses that students significantly improved their
academic literacy skills performance in the tests. This was noticeable in the increase in marks in the
post-test scores after the intervention. This identifies Academic Literacy as a beneficial and a
worthwhile programme.
5.8 CONCLUSION
The field of study encompassing academic literacy is constantly evolving and, consequently, difficult to
pin down. Improved academic literacy interventions should therefore be designed and adapted to suit
the changing student body and also the changing environments. The curriculum should also be re-
aligned to suit different emerging situations. That the students improved their English language skills,
which is confirmed by the quantitative results of improved SATAP scores points to the fact that
Academic Literacy is beneficial and worthwhile. Students who have completed the Academic Literacy
course now have several options open to them. The fact that they have gone through the programme
increases their chances of gaining access to a number of academic institutions and having improved
their English literacy skills increases their chances of succeeding at the tertiary level. The programme
serves to bridge the divide between students‟ scholastic deprivation and access to higher education.

93
Reference List
AllPsych, 2004 Research methods. Chapter 5: Experimental design.
Retrieved April 6, 2008 from http://allpsych.com/researchmethods/preexperimentaldesign.html
Astin, A.W., 1991 Assessment for excellence: the philosophy and practice of assessment and
evaluation in higher education, New York: American Council on Education/ Macmillan.
Barefoot, B.O., 2005 Achieving and sustaining institutional excellence for the first year of
college, San Fransisco Jossey – Bass.
Barefoot, B.O., 2000 “The first year experience: Are we making it better?” About Campus.
Baynham, M. & Prinsloo, M., 2008 Renewing literacy studies, In Literacies, Global and Local, M.
Prinsloo M. (eds.) Amsterdam: John Benjamins, 1-16.
Bean, J.P., 1983 The application of a model of turnover in work organisation to the student
attrition process, The Review of Higher Education, 6, 127 – 148.
Beukes, A, 1991a Language teaching and the politics of language. Journal for Language 25:89-
100.

94
Boylan, H.R., Bliss, L.B. & Bonham, BS, 1997 Program components and their relationship to
student performance. Journal of Developmental Education, 20(3) 2 – 9.
Boylan, H.R., 2001 Asking the case for Developmental Education: Research in Developmental
Education, 12.(2) 1-4
Retrievefromhttp://www.nade72.net/documents/Articles/Makingthecase.pdf.
Bhana, A. & Khanjee, A., Epistemological and methodological issues in community
psychology, In: Seedat, M.(ed.). Duncan, N & Lazarus, S., 2001 (Eds.) Theory,Method and
practice in Community psychology: South African and other perspectives. Cape Town: Oxford
University Press.
Bock, H. K., 1988 Academic Literacy: Starting Point or Goal? In G.Taylor, B.Ballard,
V.Beasley,H.K Bock,J.Lanchy & P.Nightangle.Literacy by degrees. Milton Keyness: Open
University press.24-41.?
Bock, M. & Hewlitt, L., 1993 Critical Language Awareness (CLA): Applying CLA to an
introductory first year course. South African Journal of Applied Language Studies 2 (1) 73-78.
Boughey, C., 2007 Educational Development in South Africa: from social reproduction to
capitalist expansion? Higher Education Policy, 20 (1),5-18.
Boughey C., 2009 Academic Development for Improved Efficiency in the Higher Education and
training system in South Africa.
Boughey, C Epistemological access to the university: An alternative perspective, South African
Journal, 19 (3).

95
Boughey, C., 2009 Academic Development for improved Efficiency in the Higher Education and
training system in South Africa.
Bourdieu, P., 1984 Distinction: a social critique of the judgement of taste
Translated by Richard Nice, London, Routlegde and Kegan.
Bourdieu, P., 1986 What makes social class? On the theoretical and practical existence of
groups. Berkeley Journal of Sociology, 32 (1), 1-17.
Chadwick, B.A., 1992, Bahr, HM & Albrecht, SL 1984 Social Science Research Methods,
Englewood, Cliff, New Jersey: Prentice Hall, Inc.
Cliff, A.F., Yeld, N., & Haslo, M., 2003 Assessing the academic literacy skills of entry level
students, using the placement test in English and educational purposes (PTEEP). Paper, Bi-
annual Conference of European Association for Research in Learning and Instruction (EARLI),
Padova, Italy, 22 October.2003.
(CHE) Council on Higher Education, 2013 Pretoria: Department of Education.
Cresswell, J.W., 2002 Research design. A qualitative and quantitative, and mixed method
approaches. (2nd ed.). London: SAGE Publications.
Cresswell, J.W., 1998 Research design: qualitative and quantitative approaches, Sage
Publications
Creswell, J.W., & Miller, T.L., 2000 Research design. Qualitative, quantitative and mixed methods
approaches, (2nd ed.) London: Sage Publications.
96
Creswell, J.W., 2005 Education Research: Planning,Conducting and Evaluating Quantitative &
Qualitative Research (fourth edition) New Jersey,Pearson.
Deinum, J., (2008) NPT-ZAF-237, Walter Sisulu University: Needs Analysis.
De Vos, A.S., Strydom, H., Fouche, C.B. & Delport, C.S.L.,2002 Research at grassroots: For the
social sciences and human service professions. (2nd ed.). Pretoria: Van Schaik.
Department of Education 2002: Language policy for higher education. Pretoria: Ministry of
Education.
Department of Education, 2001 National plan for higher education in South Africa. [online]
Available at: http://education.pwv.gov.za/ DoE sites/Higher [Higher [Accessed: 17/06/2012].
Department of Education, Employment and Workplace, 2009 Good Practice Principles for
English language proficiency for International students in Australian universities, Canberra,
Australia: Author.
Department of Education, 2001 National Plan for Higher education in South Africa, [ 0nline]
Available at: http://education.pwv.gov.za/ Dre sites/ Higher [accessed 14/01/2014.
Dunworth, K., 2009 An investigation into post entry English language assessment in Australian
universities , Journal of Academic Language and Learning 3 (1), A1-A13.
Eiselen, R. & Geyser, H., 2003 Factors distinguishing between achievers and at risk students: a
qualitative and quantitative synthesis. South African Journal of Higher Education, 17 (2) 118-
130.

97
Elloff , T. & Ebersohn, L., 2001 The implications of an asst-based approach to early
intervention.Perspectives in Education.19: 148-156.
Evans, I., 2008 The Nkosinathi Literacy Project: Kwazulu-Natal, South Africa, Gifted education
international, Vol. 24, nos. 2/3, 341-355.
Fraser,W. & Killen, R., 2005 The perceptions of students and lecturers and some factors
influencing academic performance at two South African Universities.Perspectives in
Education.Vol.23 (1) 25-40.
Hart, M., 2007 Conversations About Foundation and Extended Curriculum Provision. Cape
Peninsula University of Technology.
Hendricks, M., 2009 Grade-appropriate literacy and South African grade seven learners’
classroom writing in English. Early Child Development and Care, Vol. 179, no.3, April 2009. 271-
284.
Henning, E., van Rensburg, W, & Smit, B 2004 Finding your way in research. Pretoria: Van
Schaik.
Johns, A., 1997 Text, Role and Context: Developing Academic Literacies: Cambridge,
Cambridge University Press.
Jackson, F., 2005 Devine Interventions Needs Analysis for Post-graduate Academic Literacy and
Curriculum Development in a South African School of Theology, Language and education: an
international journal, Vol. 19, no.1, 50-73.

98
Kern, R., 2000 Literacy and Language teaching, Oxford University Press.
Kiely, R., Berry, R. & Andrews, S., 2009 Observing, noticing and understanding: two case
studies in language awareness in the development of academic literacy. Language Awareness,
Vol. 18, nos. ¾, 329-344.
Landsberg, E., Kruger, D. & Nel, N., (Eds.), 2005 Addressing barriers to learning. Pretoria: Van
Schaik.
Lea, M. & Street, B.V., 1998 Student writing in higher education: An academic literacies
approach, Studies in Higher Education, 23(2) 157- 172.
Leibowitz, B., 1995 Transition: Acquiring Academic Literacy at the University of Western Cape.
Academic Development 1(1), 33-46.
Leibowitz, B., 2000 The importance of writing and teaching writing in the academy. In Routes to
Writing in South Africa, ed. B. Leibowitz and Y. Mohamed. Cape Town: SUK Road International.
Leibowitz, B., 2001 Students’prior learning and their acquisition of academic literacy at a
multilingual South African university, Unplublished PhD thesis. England: University of
Sheffield.
Leibowitz, B., 1995 Transitions: Acquiring Academic Literacy at the University of the Western
Cape. Academic Development 1 (1), 33-46.
Lillis, T.M., 2001 Student writing: Access, Regulation, Desire, New York: Routledge.

99
Longden, B., 2004 Interpreting student early departure from higher education through the lens
of cultural capital. Tertiary Education and Management.
Marshall,C. & Rossman, G.B., 1999 Designing qualitative research (3rd ed.). Thousand Oaks,
C.A:Sage.
McMillan, J.H. & Schumacher, S., 2006 Research in Education: Evidence- based Enquiry.
Boston: New York: Pearson.
McMillan, J.H. & Schumacher, S., 2001 Research in Education: A conceptual introduction (5th
ed.) New York: Longman.
Mouton, J., 2001 How to succeed in your masters and doctoral studies. A South African guide
and resource book, Pretoria: Van Schaik.
Murray, N.L., 2010 Conceptualising the English language needs of first year university students.
The international Journal of the first Year in Higher Education, 1 (1) 55-64.
Neuman, W.L., 1997 Social research methods. Qualitative and quantitative approaches
(3rd .ed.). Boston: Allyn and Bacon.
NPT-237 2007 Walter Sisulu Project Document (Unpublished).
Onsongo, W.M., 2010 Assessing the impact of academic support: University of Witswatersrand
first year Engineering.

100
Scott, I., 1994 The role of academic development programmes in the construction and
development of higher education, A draft position paper produced for the IDT-sponsored
investigation into future mechanism for Academic Development programmes.
Scott, I., 2007 Addressing diversity and development in South Africa: Challenges for educational
expertise and scholarship. Paper presented at foundational Provision Meeting of CHE in
Pretoria.
Scott, I., 2009a Implications of student performance patterns for curriculum and teaching
development in higher education. Powerpoint presentation slides at University of Johannesburg
16 April 2009.
Scott, I., 2009b Academic development in South African higher education, In Bitzer, E. (Ed)
Higher Education in South Africa: A scholarly look behind the scene, South Africa SUN Press.
Southern Africa, Stellenbosch, January 2008, 205-220.
Tempest, J., 2004 South Africa Survey 2003/4, South African Institute of Race relations.
Tinto, V., 1999 Taking student retention seriously: Rethinking the first year of College. NACADA
Journal,19(2): 5-9.
Tinto, V., 2005 Epilogue: Moving from theory to action In A. Seidman (Ed) College student
retention: Formula for student success, Wesport, CT: Ace Praeger.
Tinto, V., 2007 Research and practice of student retention: What next? Journal of College
Student Retention: Research, Theory &Practice * (1) 1-19.

101
Tinto, V., 1993 Leaving Colllege: Rethinking the causes and curses of student attrition (2nd Ed.)
Chicago,IL: University of Chicago.
Volbrecht, T. & Boughey, C., 2004 Curriculum responsiveness from the margins: a reappraisal of
Academic Development in South Africa, In Griesel, H. (ed) Curriculum Responsiveness: Case
Studies in Higher Education SAUVCA Pretoria: 57-68.
Van Schalkwyk, S., 2008 Acquiring academic literacy: A Case of first-year extended degree
programme students at the Stellenbosch University. PhD Dissertation, Stellenbosch University,
2008.
Van Schoor, W. A., 2010 The assessment of academic preparedness in an ODL institution
SA ePublication, Volume32
Van Wyk, A., 2003 Access to Higher Education in South Africa: Bridging the Divide Through
Academic Literacy, TESOL Journal Vol. 12, no.3, 2003. 29-36.
Van Wyk, A.L. & Greyhing, W.J., 2008 Developing reading in a first-year academic literacy
course, Stellenbosch Papers in Linguistics, Society of Linguistics.
Welmen, J.C. & Kruger, S.J., 2002 Research Methodology. 2nd edition, Cape Town, Southern
Africa: Oxford.
Volbrecht, T. & Boughey, C., 2010 Curriculum responsiveness from the margins? A reappraisal
of academic development in South Africa. IN H. Griesel (Ed.), Curriculum Responsiveness: Case
Studies in Higher Education. Pretoria: SAUVCA.2004.
102
Vygosky, L., 1978 Mind in Society. The Development of Higher Psychological Processes,
Cambridge, M.A.: Harvard University Press.
Webb, E.J., Campbell, D.R., Schwartz, D.R. & Secrest, L., 2000 Unobstructive measures (rev. ed)
Thousand Oaks, CA: Sage Publications.
Weingarter, R.H., 1993 Undergraduate education: Goals and means, Oryx Press: Phoenix.
Yeld, N., 2009 Changing issues, changing questions, changing approaches. Paper presented at
the Colloquium on the use of admission, placement and benchmark tests in South African
universities, University of the Western Cape.
103
APPENDIX A –Pre-test scores
Student No. Marks obtained Percentage obtained%
Building (Construction Management & Quantity Surveying)
Student 1 21 33%
Student 2 27 27%
Student 3 24 38%
Student 4 12 19%
Student 5 28 44%
Student 6 31 49%
Student 7 19 30%
Student 8 12 19%
Student 9 15 24%
Student 10 25 39%
Student 11 27 42%
Student 12 21 33%
Student 13 18 28%
Student 14 14 22%
Student 15 24 38%
Student 16 33 52%
Student 17 16 25%
Student 18 20 31%
Student 19 13 20%
Student 20 19 30%
Student 21 29 45%
Student 22 34 53%
Student 23 14 22%
Student 24 27 42%

104
Student 25 30 47%
Student 26 21 33%
Student 27 15 24%
Student 28 20 31%
Student 29 24 38%
Student 30 26 41%
Electrical Engineering
Student 1 20 31%
Student 2 19 30%
Student 3 31 49%
Student 4 14 24%
Student 5 19 30%
Student 6 27 42%
Student 7 16 25%
Student 8 13 20%
Student 9 15 24%
Student 10 28 44%
Student 11 24 38%
Student 12 12 19%
Student 13 17 27%
Student 14 16 25%
Student15 19 30%
Student 16 21 33%
Student 17 12 19%
Student 18 25 39%
Student 19 18 28%
Student 20 16 25%
Student 21 35 55%
Student 22 31 49%
Student 23 16 25%
Student 24 27 42%
105
Student 25 21 33%
Student 26 14 22%
Student 27 26 41%
Student 28 14 22%
Student 29 24 38%
Student 30 21 33%
Student 1 17 27%
Student 2 12 19%
Student 3 15 24%
Student 4 25 39%
Student 5 31 49%
Student 6 12 19%
Student 7 19 30%
Student 8 21 33%
Student 9 19 30%
Student 10 15 24%
Student 11 12 19%
Student 12 31 49%
Student 13 27 42%
Student 14 16 25%
Student 15 13 20%
Student 16 19 30%
Student 17 31 49%
Student 18 17 27%
Student 19 21 33%
Student 20 31 49%
Student 21 12 19%
Student 22 24 38%
Student 23 33 52%
Student 24 19 30%
Student 25 15 24%
Student 26 34 53%

106
Student 27 30 47%
Student 28 26 41%
Student 29 19 30%
Student 30 11 17%
Civil Engineering
Student 1 15 24%
Student 2 21 33%
Student 3 17 27%
Student 4 28 44%
Student 5 12 19%
Student 6 25 39%
Student 7 18 28%
Student 8 14 22%
Student 9 33 52%
Student 10 20 31%
Student 11 21 33%
Student 12 19 30%
Student 13 24 38%
Student 14 16 25%
Student 15 31 49%
Student 16 19 30%
Student 17 27 42%
Student 18 17 27%
Student 19 32 50%
Student 20 30 47%
Student 21 16 25%
Student 22 35 55%
Student 23 13 20%
Student 24 15 24%
Student 25 12 19%

107
Student 26 28 44%
Student 27 11 17%
Student 28 14 22%
Student 29 24 38%
Student 30 21 33%

108
APPENDIX B - Posttest scores
Student No. Marks obtained Percentage obtained%
Building (Construction Management & Quantity Surveying)
Student 1 44 69%
Student 2 42 66%
Student 3 42 66%
Student 4 36 56%
Student 5 43 67%
Student 6 44 69%
Student 7 47 73%
Student 8 28 44%
Student 9 30 49%
Student 10 41 64%
Student 11 41 64%
Student 12 38 59%
Student 13 44 69%
Student 14 42 66%
Student 15 44 69%
Student 16 31 48%
Student 17 34 53%
Student 18 44 69%
Student 19 38 59%
Student 20 54 84%
Student 21 48 75%
Student 22 44 69%
Student 23 38 59%
Student 24 45 70%
Student 25 43 67%
Student 26 40 66%

109
Student 27 42 63%
Student 28 46 72%
Student 29 48 75%
Student 30 44 69%
Electrical Engineering
Student 1 45 70%
Student 2 42 63%
Student 3 45 70%
Student 4 36 56%
Student 5 40 66%
Student 6 48 75%
Student 7 39 61%
Student 8 31 48%
Student 9 30 49%
Student 10 39 61%
Student 11 47 73%
Student 12 28 44%
Student 13 39 61%
Student 14 33 52%
Student15 37 58%
Student 16 42 63%
Student 17 25 39%
Student 18 37 58%
Student 19 32 50%
Student 20 31 48%
Student 21 45 70%
Student 22 41 64%
Student 23 35 55%
Student 24 47 73%
Student 25 40 66%
Student 26 26 41%

110
Student 27 42 63%
Student 28 33 52%
Student 29 46 72%
Student 30 38 59%
Mechanical Engineering
Student 1 57 89%
Student 2 52 81%
Student 3 43 67%
Student 4 58 91%
Student 5 52 81%
Student 6 42 67%
Student 7 51 80%
Student 8 48 75%
Student 9 52 81%
Student 10 46 72%
Student 11 48 75%
Student 12 52 81%
Student 13 51 80%
Student 14 50 78%
Student 15 49 77%
Student 16 46 72%
Student 17 48 75%
Student 18 44 69%
Student 19 51 80%
Student 20 50 78%
Student 21 52 81%
Student 22 49 77%
Student 23 42 63%
Student 24 47 73%
Student 25 45 70%
Student 26 48 75%

111
Student 27 51 80%
Student 28 50 78%
Student 29 45 70%
Student 30 57 89%
Civil Engineering
Student 1 41 64%
Student 2 34 53%
Student 3 35 55%
Student 4 31 49%
Student 5 37 58%
Student 6 41 64%
Student 7 44 69%
Student 8 40 63%
Student 9 38 59%
Student 10 35 55%
Student 11 34 53%
Student 12 60 94%
Student 13 28 44%
Student 14 35 55%
Student 15 36 56%
Student 16 31 49%
Student 17 32 50%
Student 18 42 63%
Student 19 44 69%
Student 20 25 39%
Student 21 59 92%
Student 22 37 58%
Student 23 33 52%
Student 24 25 39%

112
Student 25 32 50%
Student 26 35 55%
Student 27 37 58%
Student 28 30 49%
Student 29 35 55%
Student 30 42 63%

113
APPENDIX C- Pretest, Prosttest scores, Mark change and Mark change Percentage
Student No. Pretest mark Posttest mark Mark
change
%
change
Building (Construction Management & Quantity Surveying)
Student 1 21 44 23 35.9
Student 2 27 42 15 23.4
Student 3 24 42 18 28.1
Student 4 12 36 24 37.5
Student 5 28 43 15 23.4
Student 6 31 44 13 20.3
Student 7 19 27 8
Student 8 12 28 16 25
Student 9 15 30 15 23.2
Student 10 25 41 16 25
Student 11 27 41 14 21.8
Student 12 21 38 17 26.5
Student 13 18 44 26 40.6
Student 14 14 42 28 43.7
Student 15 24 44 20 31.2
Student 16 33 31 -2 -3.1
Student 17 16 34 18 28.1
Student 18 20 44 24 37.5
Student 19 13 38 25 39
Student 20 19 54 35 54.6
Student 21 29 48 19 29.6
Student 22 34 44 10 15.6
Student 23 14 38 24 37.5
Student 24 27 45 18 28.1
Student 25 30 43 13 20.3
Student 26 21 40 19 29.6
Student 27 15 42 27 42.1
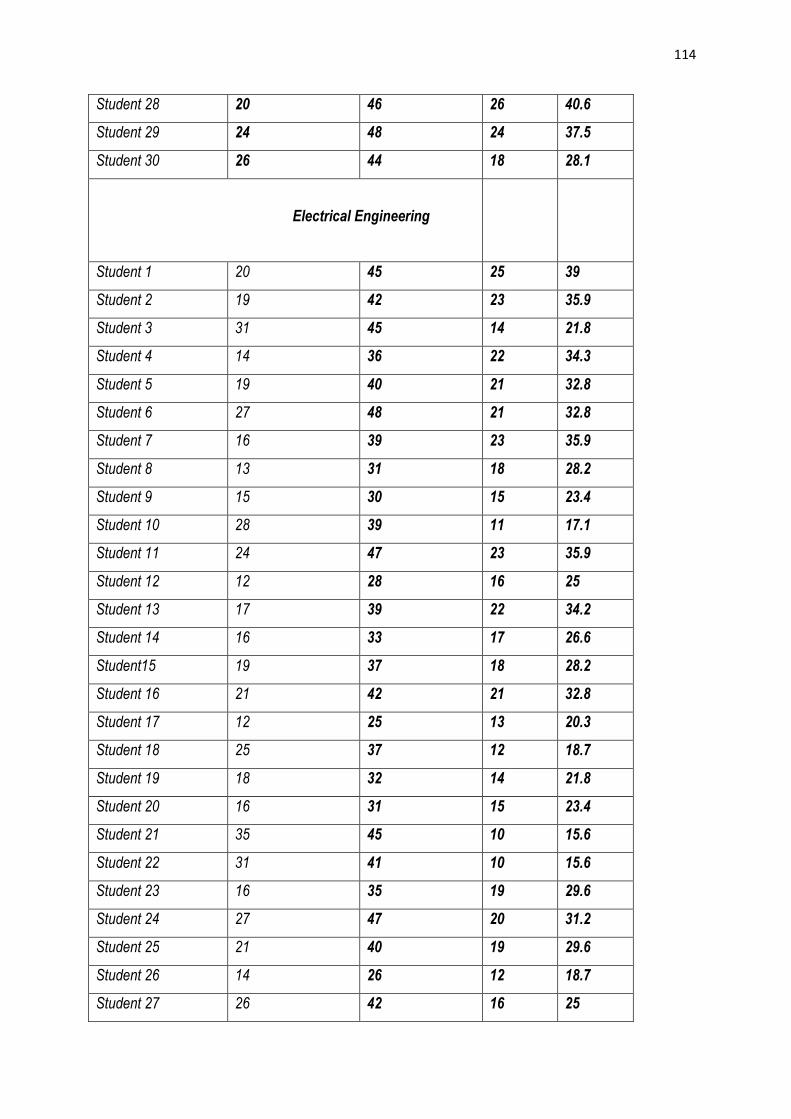
114
Student 28 20 46 26 40.6
Student 29 24 48 24 37.5
Student 30 26 44 18 28.1
Electrical Engineering
Student 1 20 45 25 39
Student 2 19 42 23 35.9
Student 3 31 45 14 21.8
Student 4 14 36 22 34.3
Student 5 19 40 21 32.8
Student 6 27 48 21 32.8
Student 7 16 39 23 35.9
Student 8 13 31 18 28.2
Student 9 15 30 15 23.4
Student 10 28 39 11 17.1
Student 11 24 47 23 35.9
Student 12 12 28 16 25
Student 13 17 39 22 34.2
Student 14 16 33 17 26.6
Student15 19 37 18 28.2
Student 16 21 42 21 32.8
Student 17 12 25 13 20.3
Student 18 25 37 12 18.7
Student 19 18 32 14 21.8
Student 20 16 31 15 23.4
Student 21 35 45 10 15.6
Student 22 31 41 10 15.6
Student 23 16 35 19 29.6
Student 24 27 47 20 31.2
Student 25 21 40 19 29.6
Student 26 14 26 12 18.7
Student 27 26 42 16 25

115
Student 28 14 33 19 29.6
Student 29 24 46 22 34.2
Student 30 21 38 17 26.6
Mechanical
Engineering
Student 1 17 37 20 31.2
Student 2 12 32 20 31.2
Student 3 15 33 18 28
Student 4 25 48 23 35.9
Student 5 31 52 21 32.8
Student 6 12 32 20 31.2
Student 7 19 31 12 18,7
Student 8 21 38 17 26.5
Student 9 19 32 13 20.3
Student 10 15 26 11 17.1
Student 11 12 28 16 25
Student 12 31 52 21 32.8
Student 13 27 51 24 37
Student 14 16 30 14 21.8
Student 15 13 29 16 25
Student 16 19 36 17 26.5
Student 17 31 48 17 26.5
Student 18 17 34 17 26.5
Student 19 21 31 10 15.6
Student 20 31 40 11 17.1
Student 21 12 22 10 15.6
Student 22 24 49 25 39
Student 23 33 42 5 40.6
Student 24 19 27 8 12.5
Student 25 15 25 10 15.6
Student 26 34 48 14 21.8

116
Student 27 30 41 11 17.1
Student 28 26 40 14 21.8
Student 29 19 35 16 25
Student 30 11 27 16 25
Civil Engineering
Student 1 15 41 26 40.6
Student 2 21 34 13 20.3
Student 3 17 35 18 28,1
Student 4 28 31 3 4.6
Student 5 12 37 25 39
Student 6 25 41 16 25
Student 7 18 34 26 40.6
Student 8 14 30 26 40.6
Student 9 33 48 5 7.8
Student 10 20 35 15 23.4
Student 11 21 34 13 20.3
Student 12 19 30 11 17.1
Student 13 24 28 4 18.4
Student 14 16 35 19 29.6
Student 15 31 36 5 7.8
Student 16 19 31 12 18.7
Student 17 27 32 5 7.8
Student 18 17 42 25 39
Student 19 32 44 12 18.7
Student 20 30 25 5 7.8
Student 21 16 29 13 20.3
Student 22 35 37 2 3.1
Student 23 13 23 10 15.6
Student 24 15 25 10 15.6
Student 25 12 27 15 23.4

117
Student 26 28 35 7 10.9
Student 27 11 27 16 25
Student 28 14 30 16 25
Student 29 24 35 11 17.1
Student 30 21 42 21 32.8

118
APPENDIX D- Item specification and item breakdown
Question Item specification Pre-test
Item
breakdown
Posttest
Item
Breakdown
1. Metaphorical expression 37% 43%
2. Communicative function of sentences 37% 45%
3. Communicative function of sentences 30% 43%
4. Extrapolation, application and inferencing 40% 46%
5. Relations between parts of a text through
devices of cohesion
39% 44%
6. Relations between parts of a text through
devices of cohesion
40% 48%
7. Extrapolation, application and inferencing 34% 42%
8. Relations between parts of a text through
devices of cohesion
16% 23%
9. Relations between parts of a text through
devices of cohesion
38% 44%
10. Essential and Non-Essential 44% 52%
11. Relations between parts 13% 21%
12. Relations between parts of text through
devices of cohesion
14% 33%
13. Vocabulary 30% 45%
14. Understanding relations between parts of
text by recognising indicators in discourse
35% 42%
15. Separating the essential from the non-
essential
31% 41%
16. Vocabulary 10% 29%
17. Understanding relations between parts of
text by recognising indicators in discourse
21% 40%
18. Extrapolation, application and inferencing 13% 28%

119
19. Extrapolation, application and inferencing 33% 42%
20. Separating the essential from the non-
essential
29% 40%
21. Understanding the communicative
function of sentences
36% 40%
22. Understanding relations between parts of
text through devices of cohesion
33% 41%
23. Vocabulary 39% 46%
24. Understanding the communicative
function of sentences
39% 42%
25. Separating the essential from the non-
essential
19% 36%
26. Separating the essential from the non-
essential
31% 40%
27. Understanding basic numerical concepts
and/or information used in text
21% 38%
28. Understanding relations between parts of
text by recognizing indicators in discourse
20% 36%
29. Vocabulary 18% 30%
30. Understanding relations between parts of
text by recognising indicators in discourse
25% 40%
31. Extrapolation, application and inferencing 14% 26%
32. Metaphorical expression 23% 37%
33. Metaphorical expression 28% 40%
34. Extrapolation, application and inferencing 39% 52%
35. Separating the essential from the non-
essential
33% 44%
36. Metaphorical expression 48% 60%
37. Extrapolation, application and inferencing 44% 54%
38.. Extrapolation, application and inferencing 29% 40%
39. Understanding relations between parts of
text through devices of cohesion
50% 64%
40. Metaphorical expression 28% 41%

120
41. Understanding text genre (including
audience, purpose, register…)
21% 36%
42. Understanding relations between parts of
text through devices of cohesion
23% 45%
43. Metaphorical expression 19% 30%
44. Understanding text genre (including
audience, purpose, register…)
35% 44%
45. Extrapolation application and inferencing 42% 45%
46. Metaphorical expression 38% 47%
47. Metaphorical expression 36% 48%
48. Metaphorical expression 25% 44%
49. Understanding text genre (including
audience, purpose, register…)
23% 42%
50. Separating the essential from non-
essential
14% 26%
51. Separating the essential from the non-
essential
9% 20%
52. Separating the essential from the non-
essential
12% 25%
53. Separating the essential from non-
essential
19% 32%
54. Separating the essential from the non-
essential
19% 24%
55. Separating the essential from the non-
essential
56% 69%
56. Separating the essential from the non-
essential
33% 46%
57. Separating the essential from non-
essential
28% 40%
58. Understanding information presented
visually
42% 54%
59. Understanding information presented
visually
46% 56%

121
60. Understanding information presented
visually
25% 40%
61. Understanding information presented
visually
30% 48%
62. Understanding information presented
visually
26% 40%
63. Understanding information presented
visually
12% 23%
64. Understanding information presented
visually
31% 44%

122
APPENDIX E - Consent Letter
Walter Sisulu University
Private Bag
Butterworth
4960
20 March 2012
Walter Sisulu University
Private Bag
Mthatha
5100
Dear Sir
I am currently pursuing a master‟s qualification (M.ED.) at the University of South Africa UNISA in the
field of Adult Education. In order for me to complete my degree, I have decided to do a research at the
Faculty of Science, Engineering and Technology (FSET), Extended Programme, Butterworth Campus.
My mini-dissertation is entitled: An evaluation of the effectiveness of Academic literacy course as a
support programme, in addressing the students‟ language needs.
I am requesting permission to conduct research at the FSET so that as a Centre we can strengthen the
academic support that is provided to students in the Extended Programme. This letter serves to inform
you that the information gathered will be solely for research purposes and that responses will be treated
with the utmost confidentiality and participants will remain anonymous. Participants can withdraw at any
stage.
For your perusal, I have attached the consent forms for students and the lecturer and the curriculum for
Academic Literacy Course.
Yours truly
-------------------
Y.Y. Xorile -Ludidi
Testing for Access and Placement & FET Coordinator
Walter Sisulu University
Tel: +27 47 401 6390
Email: [email protected]

123
APPENDIX F- Research Ethics Form
DIRECTORATE OF RESEARCH DEVELOPMENT
RESEARCH ETHICS FORM
This form has eight sections. Applicants must complete section one and at least one of the
other six sections and the administrative section where applicable. The appropriate
recommendations, signatures and dates should be obtained before submission to the
Directorate of Research Development.
SECTION ONE: GENERAL
1.1 Name of Principal Researcher:……………………………………………………..
Department:…………………………………………………………………………
Faculty:……………………………………………………………………………..
Title and Qualifications…………………………………………………………….
Office Tel:………………………………..Cell………………………………….…
Fax:………………………………………Email:…………………………………..
1.2 Name(s) of Co- Researcher(s):……………………………………………………..
Department:…………………………………………………………………………

124
Faculty:………………………………………………………………….………….
Title and Qualifications……………………………………………………………..
Office Tel:………………………………..Cell……………………………………
Fax:………………………………………Email:………………………………….
Name(s) of Co- Researcher(s):……………………………………………………..
Department:…………………………………………………………………………
Faculty:………………………………………………………………….………….
Title and Qualifications……………………………………………………………..
Office Tel:………………………………..Cell……………………………………
Fax:………………………………………Email:………………………………….
Project Details
1.3 Full title and Abstract of the Project:
1.4 Research Problem

125
1.5 Research Objectives
1.6 Research Methodology
1.7 Expected Significance of Study
1.8 Other relevant Project Information
1.9 Proposed duration of Project (give start and end dates):
1.10 Place of Fieldwork:
1.11 Experimental Site:
126
General Ethical Concerns
1.12 Is this a degree oriented research? If yes, give names and titles of supervisor(s),
Departments and telephone contacts
1.13 If researcher does not posses a doctorate degree, give names and titles of
mentor(s), Departments and telephone contacts
1.14 Where confidentiality is required in the research project, explain how it will be
ensured and guaranteed?
1.15 Explain how the findings of the research project will be disseminated taking into
consideration recognition of ethical concerns?
1.16 It is required that consent is sought if human subjects are involved. Explain whether
consent will be verbal or written. Attach a copy of the consent statement which will
be applied to this study.
1.17 It is required that researchers declare any conflict of interest. Explain any conflict of
interest (who, and how, and extent of conflict of interest). Failure to disclose any
conflict of interest may result to disciplinary action.
1.18 Explain any physical, biological, chemical, safety, psychological or any related
concerns/harm this research project can cause in its execution.

127
1.19 Is this a collaborative research with other institutions? If yes, give names, titles,
qualifications, email addresses and telephone numbers of collaborators. Will
additional ethical clearance be required from institutions of collaborators?
1.20 Will there be recorded media (audio, video or other – specify) involved in the
execution of the research project? If yes, explain.
1.21 How will the research be funded? If human subjects are participants, have costs for
transportation, feeding, and honoraria been factored into the budget? Explain.
SECTION TWO: BIOMEDICAL RESEARCH ETHICS
2.1 Indicate type of research: Basic research/ applied research/ clinical/medical
equipment trial/experimental/epidemiological/ observational/ psychological/other –
specify
2.2 Explain statistical concerns for sampling and statistical techniques to be used
2.3 Indicate which of the following procedures will be used for data gathering?
Structured interview/ Questionnaire administration/Review of existing records/
medical examination/urine and analysis/fecal samples and analysis/ body fluids and
128
analysis/blood sampling and analysis/biopsy/ plant components/experimental
animals/other (specify)
2.4 Indicate which type of human subjects are included in the research: humans in
existing data/healthy persons/patients/individuals who are sick (or ill)/males/
females/ pregnant persons/professional/ prisoners/fetuses/ cadavers/ other types of
human material (specify)
2.5 Explain how samples and specimens will be disposed of.
2.6 Are there any financial benefits given to the researchers by pharmaceutical
companies? If so, please indicate and explain how this does not affect research
objectives.
2.7 Indicate and explain what types of risks are involved in the execution of the project
and steps to be taken to reduce the risks? The risks should include pain, discomfort,
stress and strain, accidents and other complications

129
2.8 Are the methods used tested, recognized and established? If no, how were the
methods derived?
2.9 Is there a pilot study phase of the project? If yes, does it take into consideration the
anticipated risks and how they can be reduced?
2.10 Will there be need for interim analyses? If yes, explain.
SECTION THREE: ANIMAL AND PLANT RESEARCH ETHICS
3.1 Indicate type of research: Basic research/ applied research/ diagnostic
procedures/animal biology/animal production/animal management/environmental
study/ production of biological products/ psychological/other – specify
3.2 Which of the following procedures will be performed on the animal in the execution
of the project? Observations with interferences/conscious & unconscious
intervention/physiological challenges/surgical/invasive intervention/genetically
modified animal/ death/other (specify)
130
3.3 Why must animal(s)/plant(s) be used in the research? Is there no alternative method
that can be used to carry out the same project?
3.4 Which animal(s)/plant(s) will be employed for the research project?
3.5 Explain why the choice of the animal(s)/plant(s)
3.6. The use of animals/plants in research should be minimized as much as possible. Can
the animals/plants or animal material be used for another research project? What will
be the fate of the animal(s)/plant(s) at the end of the project? Will the animal(s) be
euthanised? If so give generic name(s) of drug, the dosage and the route of its
administration.
3.7 What is the number of animal(s)/plant(s) to be used in the research project? Is that
the most minimum? Explain how the number can be further cut down.
3.8 From where will the animal(s)/plant(s) be obtained and how will the transportation
to research site be carried out?

131
3.9 Where and how will the animals be housed during the execution of the research
project? How many animals will be put in one cage or pen? Is the housing site
quarantined? If plants, where and how will they be grown/kept during the execution
of the project?
3.10 What diet will the animal(s) be put on? What will be the chemicals/fertilizers/manure
used for the plant(s) during the experiments? Is there any special care required? If
so explain.
3.11 Who and how will the animal(s)/plant(s) be monitored after work hours, during
weekends, public holiday and vacation?
SECTION FOUR: HUMAN AND SOCIAL SCIENCES RESEARCH ETHICS
4.1 What type of research is this?
4.2 Are the interviews structured or otherwise? Explain the type of questionnaire being
administered (open ended questions or otherwise).
4.3 Describe the rationale and reason for choosing the study population

132
4.4 What is the purpose of the study? (Is it a pilot study or a full study?) Is this study
going to generate new knowledge or will confirm existing knowledge?
4.5 Describe how recruitment will be conducted taking into consideration social and
cultural aspects, screening measures and authorization.
4.6 Which processes will be used in obtaining informed consents, and why are these
processes chosen over others?
4.7 What methods will be used for non disclosure of sensitive data/information, and
what risks are associated therein?
4.8 What are the direct and indirect benefits to participants of the study?
4.9 Explain how the study complies with legislation and individual rights to privacy
4.10 Is there any conflict of interest? If so, how is it accommodated without compromise
in the conducting of the research?

133
SECTION FIVE: BUSINESS, MANAGEMENT AND LAW RESEARCH ETHICS
5.1 What type of research is this?
5.1 Will information be collected from corporations and companies or other agencies
about individuals without their direct consent? If so, how will the information be
sought and why will individual consent not be sought?
6.3 If recorded media (audio, video or other) will be used in the execution of the
research project, specify where the materials will be retained after the study; for
how long will they be retained; and how they will they eventually be disposed of.
SECTION SIX: EDUCATION RESEARCH ETHICS
6.1 What type of research is this?
6.2 Will information be collected from institutions such as universities, schools,
employers, government and related, or other agencies about individuals without their
direct consent? If so, how will the information be sought and why will individual
consent not be sought?
6.3 If recorded media (audio, video or other) will be used in the execution of the
research project, specify where the materials will be retained after the study; for
how long will they be retained; and how they will they eventually be disposed of.

134
6.4 Will children be engaged in the research? If so which age grouping? Will the children
be those in the care of a local authority, orphanage, foster home, or living with their
parents? Please explain.
6.5 Does the research focus on participants with special educational needs? Physically or
mentally ill? Vulnerable in other ways? Racial or ethnic minority? Please explain.
6.6 Does the research advance knowledge in Education?
SECTION SEVEN: OTHER SPECIALIZED RESEARCH ETHICS
7.1 Which of the following health and safety hazards to other animals, humans and or
environment will be introduced during the execution of the research project?
Teratogens/carcinogens/anaesthetic gases/genetically modified organisms/ biological
/ chemical / radioactive /geological hazards/other (specify)
7.2 If plant or animal, is it an endangered/exotic species?
7.3 Do you have understanding of ethical issues, guidelines, and good code of conduct in
performing research that deals with hazardous, toxic and ionizing radioactive
materials/exotic or endangered species? Explain your understanding in relation to the
study you intend to undertake, if applicable.

135
7.4 Why did you choose to conduct research using hazardous, toxic and ionizing
radioactive materials/ exotic or endangered species? Could you not have avoided
using the materials? If not, explain why?
7.5 What measures will you take to ensure that only the most minimum quantities of
materials are used through out the experiments? Such measures should include
keeping a logbook.
7.6 How would you control exposure of hazardous, toxic, ionizing and non ionizing
radiations to staff, students, university community, and the biophysical environment?
7.7 Do you have adequate knowledge of appropriate accident and emergency
procedures in place during the conduct of the research activities?
7.8 Explain how you will dispose of the wastes that will be generated during the research
activities.
7.9 Will appropriate warning signs be displayed where necessary? If yes, which signs,
and if no why not?
SECTION EIGHT: ADMINISTRATIVE SECTION
I, ……………………………….confirm that the information provided in this form to the best of my
knowledge is accurate, and that the project will be executed in accordance with the
University Research Ethics Policy, the University Mentoring Policy, and the University
Research Policy.
136
Signature of (Principal) Researcher:
Date:
Faculty Research Ethics Committee
1. Name of Faculty Research Committee Chair:
Recommended/Not recommended (delete where applicable)
If not recommended, why?
Date:
Signature:
2. Name of Executive Dean of Faculty:
Recommended/Not recommended (delete where applicable)
If not recommended, why?
Date:
Signature:
137
University Research Ethics Committee
UREC recommendation(s), date of consideration and Signatures of Director: Research
Development and Chair of UREC:
1. Recommended/Not recommended (delete where applicable)
If not recommended, why?
Date:
Signature of Director: Research Development:
2. Recommended/Not recommended (delete where applicable)
If not recommended, why?
Date:
Signature of Chair:
138
APPENDIX G: LIST OF TABLES
Table 2.1 Literate students in Gauteng province 25
Table 3.1 The experimental design followed in the study 38
Table 3.2 Definition of Pre-test and Post-test scores 41
Table 3.3 Illustration of the number of Departments and participants involved 42
Table 4.1 Frequency table of the age of participants in the four departments 48
Table 4.2 Frequency table of participants‟ gender in the four departments 49
Table 4.3 Frequency tables of pre-test and post-test 51
Table 4.4 Summary statistics of pre-test and post-test scores of all participants 54
Table 4.5 Hypothesis testing- Paired samples t-test statistics for all participants 58
Table 4.6 Summary statistics and pre-test scores as a percentage for the Building Department 59
Table 4.7 Hypothesis testing- paired samples t-test statistics for the Building Department 63
Table 4.8 Summary statistics for the Building departmental participants 64
Table 4.9 Hypothesis testing-paired samples t-test statistics for the Electrical Department 68
Table 4.10 Summary statistics of pre-test and post-test scores as a percentage for the Mechanical
Department 69
Table 4.11 Hypothesis testing-paired sample t-test statistics for the Mechanical Department
participants 72
Table 4.12 Summary statistics of the pre-test and post-test scores as a percentage for the Civil
Department participants 73
Table 4.13 Hypothesis testing-paired samples t-test statistics for the civil engineering Department
participants
Table 4.14 SATAP language aspects that are tested and number of questions per aspect 79

139
Table 4.15 SATAP language aspects that are tested and number of questions per aspect and pre-test,
post-test and the mean difference
Table 4.16 Hypothesis testing –paired samples t-test statistics for the difference in performance 83
APPENDIX H: LIST OF FIGURES
Figure 3.1 Illustration of the single-group pre-test-post-test design 39
Figure 4.1 Percentage of the age of the participants in ranges 49
Figure 4.2 Percentage of gender distribution 50
Figure 4.3 Multiple bar chart illustrating the pre-test and post-test score ranges received by 120
participants 51
Figure 4.4 Histogram and box plot showing distribution of mean difference for all participants 56
Figure 4.5 Mean difference 95% confidence interval error bars for all participants 57
Figure 4.6 Histogram and box plot showing distribution of mean difference for the Building
Department participants 61
Figure 4.7 Mean difference 95% confidence interval error bars for the Building Department
Participants 62
Figure 4.8 Histogram and box plot showing distribution of mean difference for the Electrical
Department participants 66
Figure 4.9 Mean difference 95% confidence interval error bars for the Electrical Engineering
Department 67
Figure 4.10 Histogram and box plot showing distribution of mean difference for the Mechanical
Engineering participants 70
Figure 4.11 Mean difference interval error bars for Mechanical Engineering Department
Participants 71
Figure 4.12 Histogram and box plot showing distribution of mean difference for the Civil Engineering
Department participants 74
Figure 4.13 Mean difference 95% confidence interval error bars for the civil engineering Departmental

140
Participants 75
Figure 4.14 Illustration of the Language aspects from pre-test and post-test 80
Figure 4.15 Histogram and box plot showing distribution of mean difference for the aspects 81
Figure 4.16 Mean difference 95% confidence interval erroe bars for language aspects 82