yolo county housing agenda regular meeting … ych agenda packet.pdf · yolo county housing agenda...
TRANSCRIPT

YOLO COUNTY HOUSING
AGENDA
REGULAR MEETING
May 11, 2016 3:00 p.m.
YOLO COUNTY HOUSING
HOUSING COMMISSION
CECILIA AGUIAR-CURRYROBB DAVIS
MARK JOHANNESSENTOM STALLARD
HELEN MACLEOD THOMSONJENNIFER WIENECKE-FRIEDMAN
KAREN VANDERFORD
BOARD OF SUPERVISORS CHAMBERS625 COURT STREET, ROOM 206WOODLAND, CALIFORNIA 95695
LISA A. BAKERCHIEF EXECUTIVE OFFICER
HOPE WELTONAGENCY COUNSEL
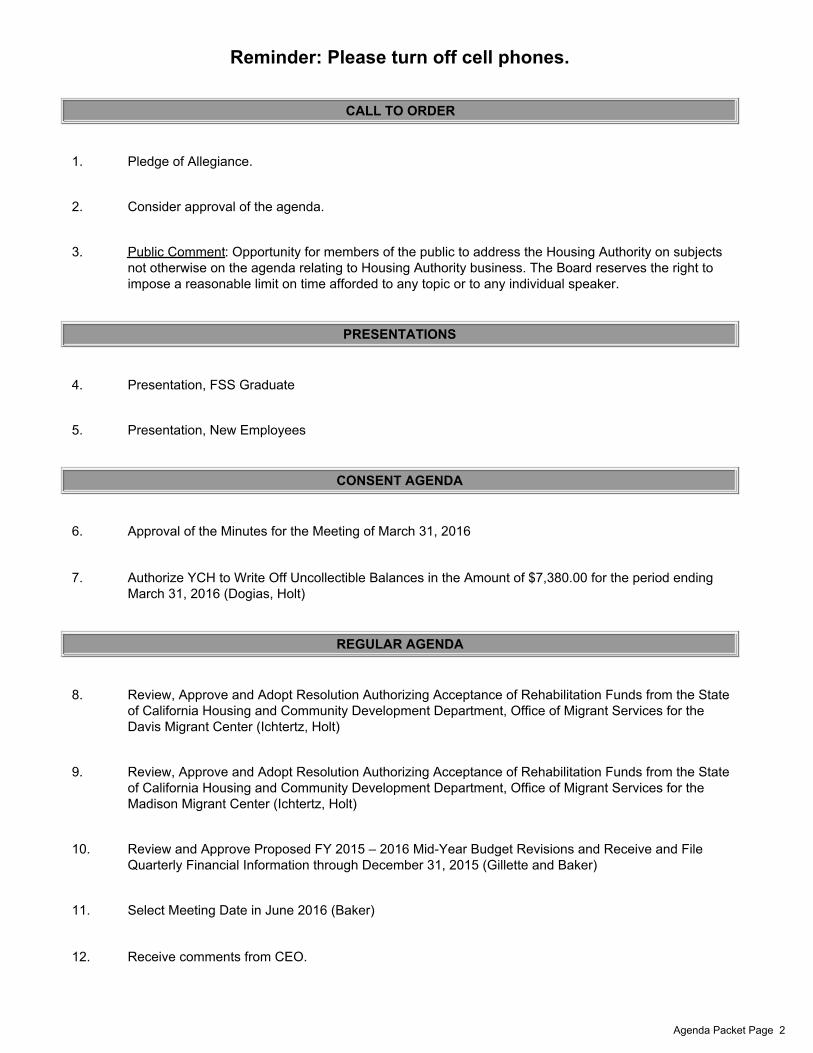
Reminder: Please turn off cell phones.
CALL TO ORDER
1. Pledge of Allegiance. 2. Consider approval of the agenda. 3. Public Comment: Opportunity for members of the public to address the Housing Authority on subjects
not otherwise on the agenda relating to Housing Authority business. The Board reserves the right toimpose a reasonable limit on time afforded to any topic or to any individual speaker.
PRESENTATIONS
4. Presentation, FSS Graduate 5. Presentation, New Employees
CONSENT AGENDA
6. Approval of the Minutes for the Meeting of March 31, 2016 7. Authorize YCH to Write Off Uncollectible Balances in the Amount of $7,380.00 for the period ending
March 31, 2016 (Dogias, Holt)
REGULAR AGENDA
8. Review, Approve and Adopt Resolution Authorizing Acceptance of Rehabilitation Funds from the State
of California Housing and Community Development Department, Office of Migrant Services for theDavis Migrant Center (Ichtertz, Holt)
9. Review, Approve and Adopt Resolution Authorizing Acceptance of Rehabilitation Funds from the State
of California Housing and Community Development Department, Office of Migrant Services for theMadison Migrant Center (Ichtertz, Holt)
10. Review and Approve Proposed FY 2015 – 2016 Mid-Year Budget Revisions and Receive and File
Quarterly Financial Information through December 31, 2015 (Gillette and Baker) 11. Select Meeting Date in June 2016 (Baker) 12. Receive comments from CEO.
Agenda Packet Page 2
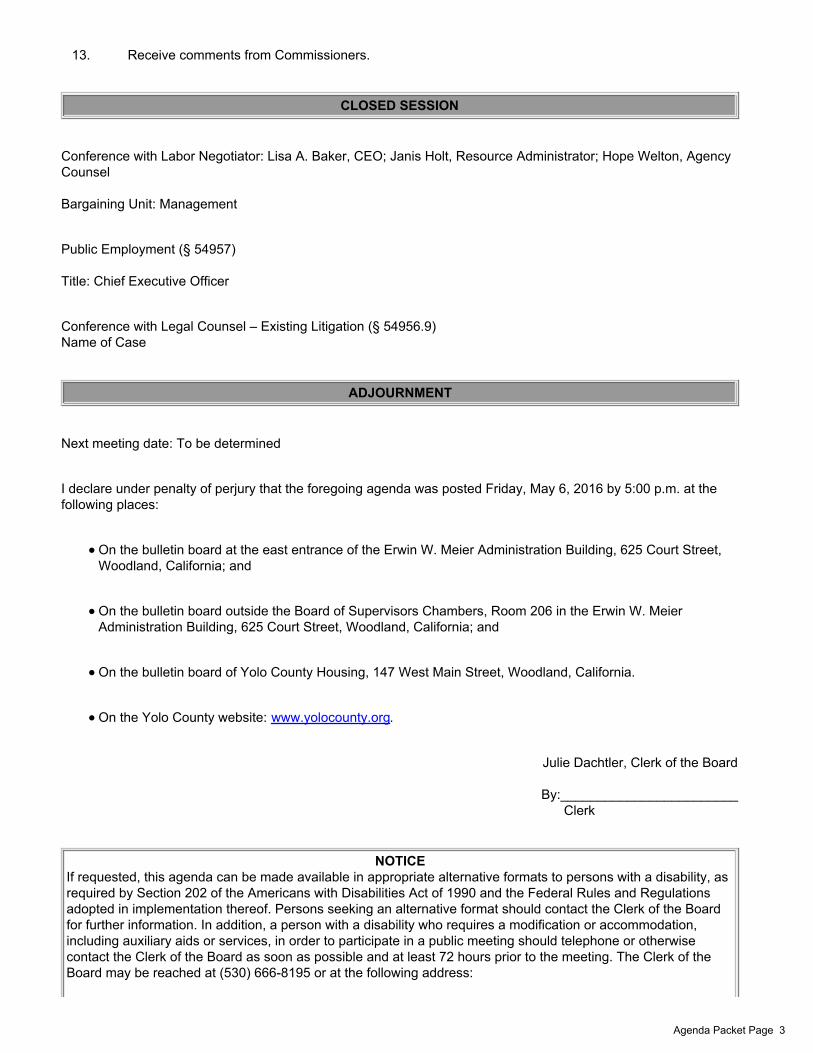
13. Receive comments from Commissioners.
CLOSED SESSION
Conference with Labor Negotiator: Lisa A. Baker, CEO; Janis Holt, Resource Administrator; Hope Welton, AgencyCounsel
Bargaining Unit: Management Public Employment (§ 54957)
Title: Chief Executive Officer Conference with Legal Counsel – Existing Litigation (§ 54956.9)Name of Case
ADJOURNMENT
Next meeting date: To be determined I declare under penalty of perjury that the foregoing agenda was posted Friday, May 6, 2016 by 5:00 p.m. at thefollowing places:
On the bulletin board at the east entrance of the Erwin W. Meier Administration Building, 625 Court Street,Woodland, California; and
On the bulletin board outside the Board of Supervisors Chambers, Room 206 in the Erwin W. MeierAdministration Building, 625 Court Street, Woodland, California; and
On the bulletin board of Yolo County Housing, 147 West Main Street, Woodland, California.
On the Yolo County website: www.yolocounty.org.
Julie Dachtler, Clerk of the Board
By:________________________Clerk
NOTICEIf requested, this agenda can be made available in appropriate alternative formats to persons with a disability, asrequired by Section 202 of the Americans with Disabilities Act of 1990 and the Federal Rules and Regulationsadopted in implementation thereof. Persons seeking an alternative format should contact the Clerk of the Boardfor further information. In addition, a person with a disability who requires a modification or accommodation,including auxiliary aids or services, in order to participate in a public meeting should telephone or otherwisecontact the Clerk of the Board as soon as possible and at least 72 hours prior to the meeting. The Clerk of theBoard may be reached at (530) 666-8195 or at the following address:
Agenda Packet Page 3
Yolo County Housingc/o Clerk of the Board of Supervisors
County of Yolo625 Court Street, Room 204, Woodland, CA 95695
Agenda Packet Page 4

Consent 6.
Yolo County HousingMeeting Date: 05/11/2016
InformationSUBJECTApproval of the Minutes for the Meeting of March 31, 2016
AttachmentsAtt. Minutes
Form ReviewForm Started By: Julie Dachtler Started On: 05/06/2016 03:01 PMFinal Approval Date: 05/06/2016
Agenda Packet Page 5
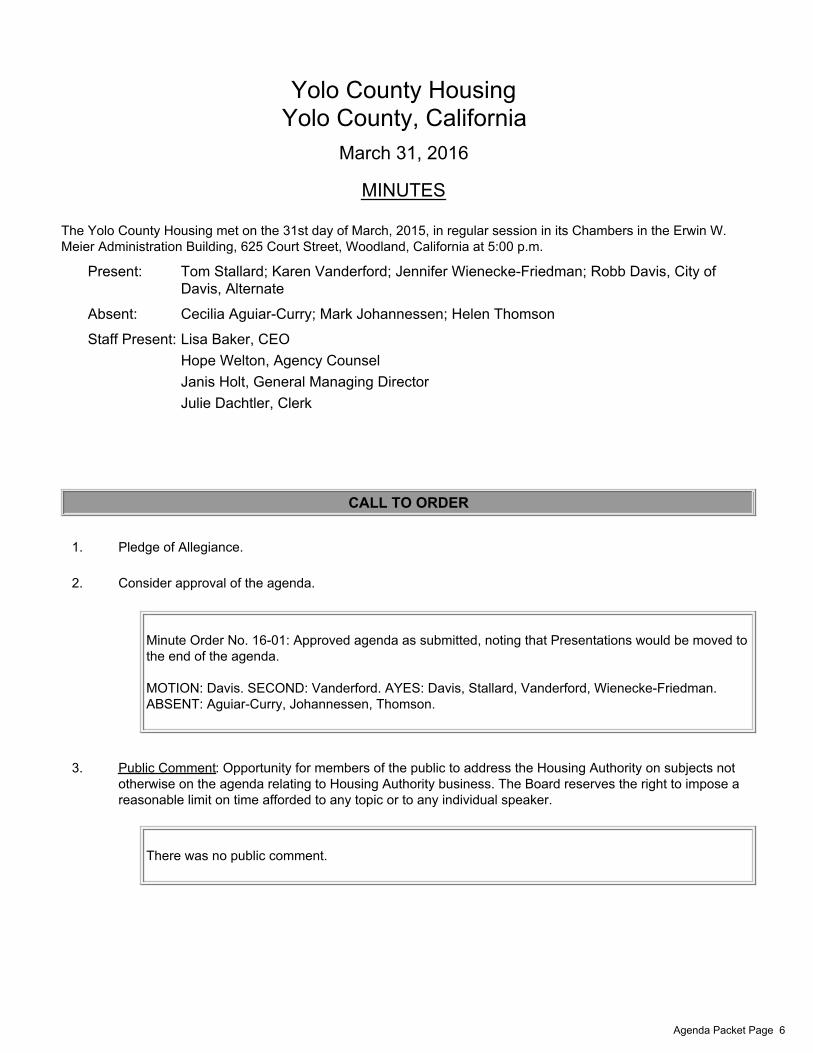
Yolo County HousingYolo County, California
March 31, 2016
MINUTES
The Yolo County Housing met on the 31st day of March, 2015, in regular session in its Chambers in the Erwin W.Meier Administration Building, 625 Court Street, Woodland, California at 5:00 p.m.
Present: Tom Stallard; Karen Vanderford; Jennifer Wienecke-Friedman; Robb Davis, City ofDavis, Alternate
Absent: Cecilia Aguiar-Curry; Mark Johannessen; Helen Thomson
Staff Present: Lisa Baker, CEO Hope Welton, Agency Counsel Janis Holt, General Managing Director Julie Dachtler, Clerk
CALL TO ORDER
1. Pledge of Allegiance.
2. Consider approval of the agenda.
Minute Order No. 16-01: Approved agenda as submitted, noting that Presentations would be moved tothe end of the agenda. MOTION: Davis. SECOND: Vanderford. AYES: Davis, Stallard, Vanderford, Wienecke-Friedman.ABSENT: Aguiar-Curry, Johannessen, Thomson.
3. Public Comment: Opportunity for members of the public to address the Housing Authority on subjects nototherwise on the agenda relating to Housing Authority business. The Board reserves the right to impose areasonable limit on time afforded to any topic or to any individual speaker.
There was no public comment.
Agenda Packet Page 6
PRESENTATIONS
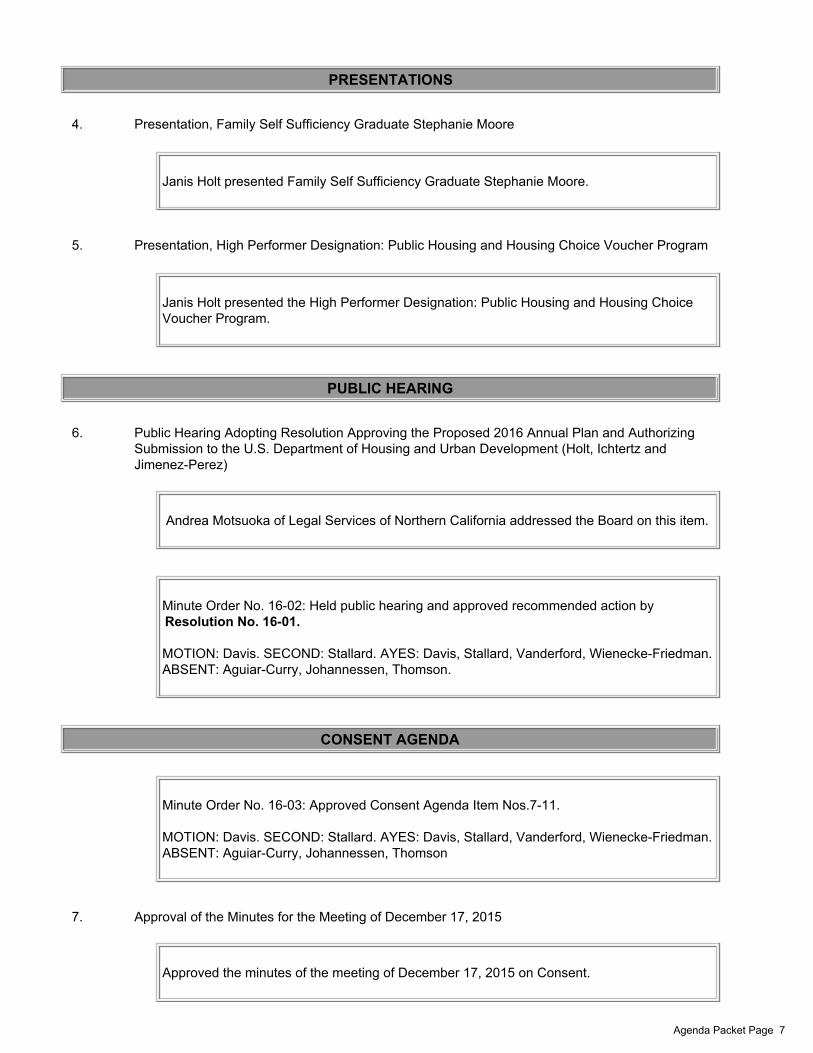
4. Presentation, Family Self Sufficiency Graduate Stephanie Moore
Janis Holt presented Family Self Sufficiency Graduate Stephanie Moore.
5. Presentation, High Performer Designation: Public Housing and Housing Choice Voucher Program
Janis Holt presented the High Performer Designation: Public Housing and Housing ChoiceVoucher Program.
PUBLIC HEARING
6. Public Hearing Adopting Resolution Approving the Proposed 2016 Annual Plan and AuthorizingSubmission to the U.S. Department of Housing and Urban Development (Holt, Ichtertz andJimenez-Perez)
Andrea Motsuoka of Legal Services of Northern California addressed the Board on this item.
Minute Order No. 16-02: Held public hearing and approved recommended action byResolution No. 16-01.
MOTION: Davis. SECOND: Stallard. AYES: Davis, Stallard, Vanderford, Wienecke-Friedman.ABSENT: Aguiar-Curry, Johannessen, Thomson.
CONSENT AGENDA
Minute Order No. 16-03: Approved Consent Agenda Item Nos.7-11.
MOTION: Davis. SECOND: Stallard. AYES: Davis, Stallard, Vanderford, Wienecke-Friedman.ABSENT: Aguiar-Curry, Johannessen, Thomson
7. Approval of the Minutes for the Meeting of December 17, 2015
Approved the minutes of the meeting of December 17, 2015 on Consent.
Agenda Packet Page 7

8. Review and Approve FY 2016 General Bargaining Unit Memorandum of Understanding (Baker andHolt)
Approved Agreement No. 16-01 on Consent.
9. Review, Approve and Adopt Resolution for PEMHCA Contributions (Holt)
Approved Resolution No. 16-02 on Consent.
10. Review and Approve Revision to Senior Accountant Position to Confidential Exempt SeniorAccountant (Holt and Gillette)
Approved recommended action on Consent.
11. Review and Approve Proposed Contract with New Hope CDC to deliver services (Baker, Holt,Gillette)
Approved recommended action on Consent.
REGULAR AGENDA
12. Receive 2014-2015 Audit Report (Gillette)
Minute Order No. 16-04: Approved recommended action.
MOTION: Davis. SECOND: Vanderford. AYES: Davis, Stallard, Vanderford,Wienecke-Friedman. ABSENT: Aguiar-Curry, Johannessen, Thomson.
13. Receive Verbal Report from CEO on JPA Formation
CEO Lisa Baker provided a brief update noting they met with attorneys for the individualcities, in which they believe it is more appropriate for the cities to create housing authoritiesthat then creates the JPA. They are working with County Counsel’s Office on the remainingissues around the JPA formation, GASB and the status of the Housing Authority’s Board.They are making progress and hope to have some resolution in the next 2-3 months. Thismeans that there will need to be another meeting of the existing Board in April.
Agenda Packet Page 8
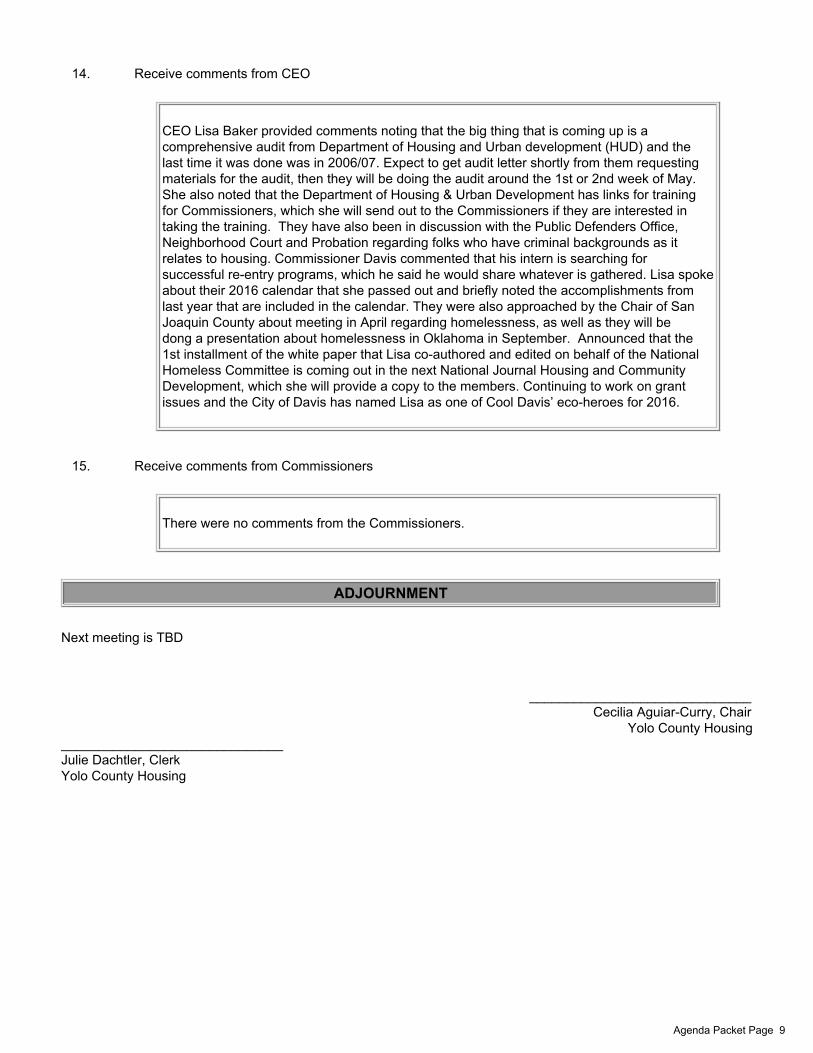
14. Receive comments from CEO
CEO Lisa Baker provided comments noting that the big thing that is coming up is acomprehensive audit from Department of Housing and Urban development (HUD) and thelast time it was done was in 2006/07. Expect to get audit letter shortly from them requestingmaterials for the audit, then they will be doing the audit around the 1st or 2nd week of May.She also noted that the Department of Housing & Urban Development has links for trainingfor Commissioners, which she will send out to the Commissioners if they are interested intaking the training. They have also been in discussion with the Public Defenders Office,Neighborhood Court and Probation regarding folks who have criminal backgrounds as itrelates to housing. Commissioner Davis commented that his intern is searching forsuccessful re-entry programs, which he said he would share whatever is gathered. Lisa spokeabout their 2016 calendar that she passed out and briefly noted the accomplishments fromlast year that are included in the calendar. They were also approached by the Chair of SanJoaquin County about meeting in April regarding homelessness, as well as they will bedong a presentation about homelessness in Oklahoma in September. Announced that the1st installment of the white paper that Lisa co-authored and edited on behalf of the NationalHomeless Committee is coming out in the next National Journal Housing and CommunityDevelopment, which she will provide a copy to the members. Continuing to work on grantissues and the City of Davis has named Lisa as one of Cool Davis’ eco-heroes for 2016.
15. Receive comments from Commissioners
There were no comments from the Commissioners.
ADJOURNMENT
Next meeting is TBD
______________________________Cecilia Aguiar-Curry, Chair
Yolo County Housing______________________________Julie Dachtler, ClerkYolo County Housing
Agenda Packet Page 9
Consent 7.
Yolo County HousingMeeting Date: 05/11/2016
InformationSUBJECTAuthorize YCH to Write Off Uncollectible Balances in the Amount of $7,380.00 forthe period ending March 31, 2016 (Dogias, Holt)
AttachmentsStaff Report
Form ReviewForm Started By: Julie Dachtler Started On: 05/06/2016 03:30 PMFinal Approval Date: 05/06/2016
Agenda Packet Page 10
Yolo County Housing
Lisa A. Baker, Chief Executive Officer
147 W. Main Street Woodland: (530) 6625428
WOODLAND, CA 95695 Sacramento: (916) 4448982
TTY: (800) 5451833, ext. 626
DATE: May 3, 2016 TO: YCH Housing Commission FROM: Lisa A. Baker, Chief Executive Officer PREPARED BY: Tom Dogias, Real Estate Services Supervisor and Jim Gillette,
Finance Director SUBJECT: Authorize YCH to Write Off Uncollectible Balances in the Amount of $7,380.00 for the period ending March 31, 2016. RECOMMENDED ACTIONS: That the Housing Commissioners: 1. Authorize staff to write off bad debts of the Yolo County Housing Low Income Public Housing Program of $7,380.00 for the period ending March 31, 2016. BACKGROUND/DISCUSSION According to policy, the process of writing off bad debts takes place regularly. At this time, staff requests that the Commission authorize the write off of debts that have not been collected over the last year. The bad debts primarily consist of tenants who have moved out without rendering payment on their final closing bills. Housing Services staff has provided a list of tenant balances that they request be written off. Staff’s efforts to locate the tenants and collect payment on these accounts have been exhausted.
Agenda Packet Page 11
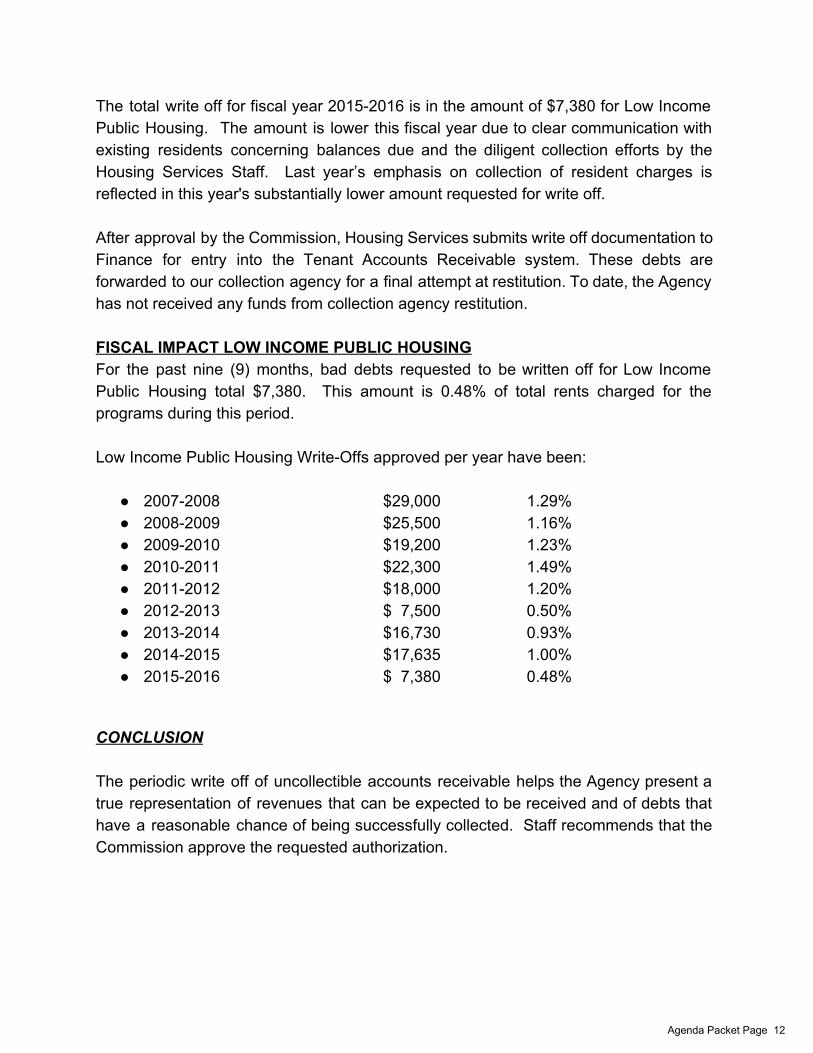
The total write off for fiscal year 20152016 is in the amount of $7,380 for Low Income Public Housing. The amount is lower this fiscal year due to clear communication with existing residents concerning balances due and the diligent collection efforts by the Housing Services Staff. Last year’s emphasis on collection of resident charges is reflected in this year's substantially lower amount requested for write off. After approval by the Commission, Housing Services submits write off documentation to Finance for entry into the Tenant Accounts Receivable system. These debts are forwarded to our collection agency for a final attempt at restitution. To date, the Agency has not received any funds from collection agency restitution. FISCAL IMPACT LOW INCOME PUBLIC HOUSING For the past nine (9) months, bad debts requested to be written off for Low Income Public Housing total $7,380. This amount is 0.48% of total rents charged for the programs during this period. Low Income Public Housing WriteOffs approved per year have been:
20072008 $29,000 1.29% 20082009 $25,500 1.16% 20092010 $19,200 1.23% 20102011 $22,300 1.49% 20112012 $18,000 1.20% 20122013 $ 7,500 0.50% 20132014 $16,730 0.93% 20142015 $17,635 1.00% 20152016 $ 7,380 0.48%
CONCLUSION The periodic write off of uncollectible accounts receivable helps the Agency present a true representation of revenues that can be expected to be received and of debts that have a reasonable chance of being successfully collected. Staff recommends that the Commission approve the requested authorization.
Agenda Packet Page 12
Regular 8.
Yolo County HousingMeeting Date: 05/11/2016
InformationSUBJECTReview, Approve and Adopt Resolution Authorizing Acceptance of RehabilitationFunds from the State of California Housing and Community DevelopmentDepartment, Office of Migrant Services for the Davis Migrant Center (Ichtertz, Holt)
AttachmentsStaff Report
Form ReviewForm Started By: Julie Dachtler Started On: 05/06/2016 03:32 PMFinal Approval Date: 05/06/2016
Agenda Packet Page 13
Yolo County Housing Lisa A. Baker, Executive Director
147 W. Main Street Woodland: (530) 6625428 WOODLAND, CA 95695 Sacramento: (916) 4448982 TTY: (800) 5451833, ext.
626
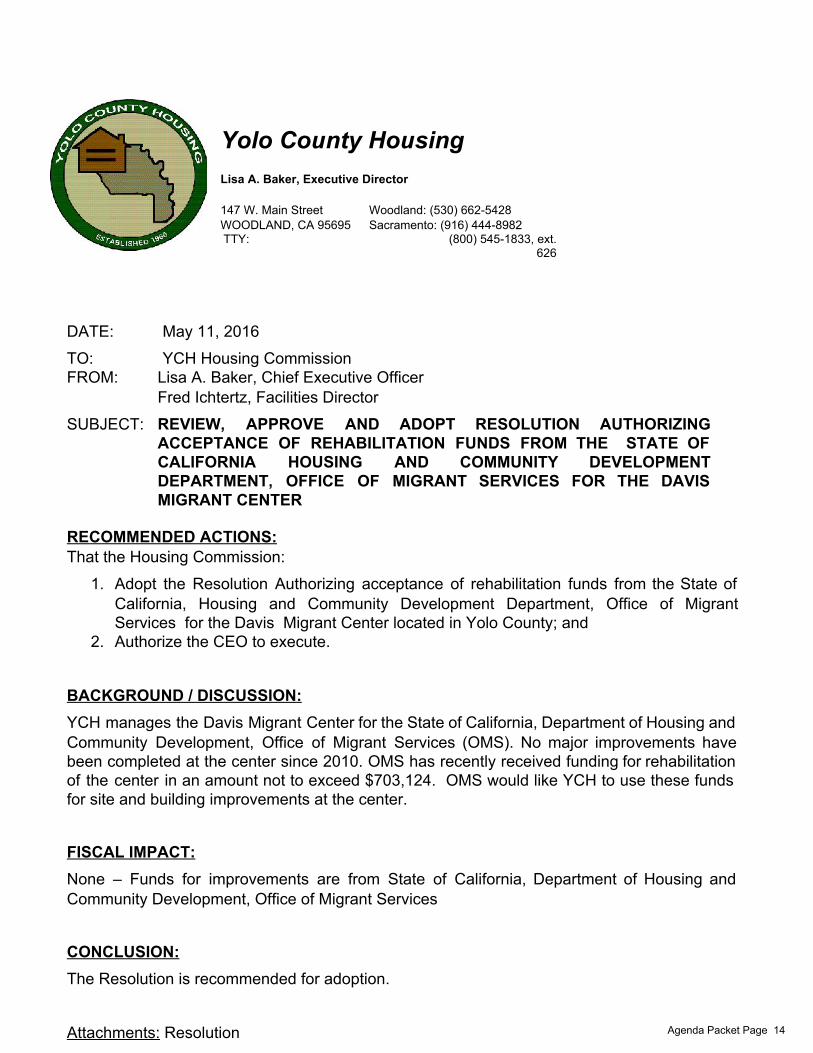
DATE: May 11, 2016 TO: YCH Housing Commission FROM: Lisa A. Baker, Chief Executive Officer
Fred Ichtertz, Facilities Director SUBJECT: REVIEW, APPROVE AND ADOPT RESOLUTION AUTHORIZING
ACCEPTANCE OF REHABILITATION FUNDS FROM THE STATE OF CALIFORNIA HOUSING AND COMMUNITY DEVELOPMENT DEPARTMENT, OFFICE OF MIGRANT SERVICES FOR THE DAVIS MIGRANT CENTER
RECOMMENDED ACTIONS: That the Housing Commission:
1. Adopt the Resolution Authorizing acceptance of rehabilitation funds from the State of California, Housing and Community Development Department, Office of Migrant Services for the Davis Migrant Center located in Yolo County; and
2. Authorize the CEO to execute.
BACKGROUND / DISCUSSION: YCH manages the Davis Migrant Center for the State of California, Department of Housing and Community Development, Office of Migrant Services (OMS). No major improvements have been completed at the center since 2010. OMS has recently received funding for rehabilitation of the center in an amount not to exceed $703,124. OMS would like YCH to use these funds for site and building improvements at the center.
FISCAL IMPACT: None – Funds for improvements are from State of California, Department of Housing and Community Development, Office of Migrant Services CONCLUSION: The Resolution is recommended for adoption. Attachments: Resolution Agenda Packet Page 14

HOUSING AUTHORITY OF THE COUNTY OF YOLO RESOLUTION NO.______
RESOLUTION APPROVING REHABILITATION FUNDS BETWEEN THE STATE OF CALIFORNIA DEPARTMENT OF HOUSING AND COMMUNITY DEVELOPMENT
AND THE HOUSING AUTHORITY OF THE COUNTY OF YOLO FOR DAVIS MIGRANT CENTER
WHEREAS the State of California (the “State”), Department of Housing and Community Development (“Department”) has a current contractual relationship with the HousingAuthority of the County of Yolo, through its Office of Migrant Services Program (OMS) (“Program”) for the purposes of managing and maintaining the OMS Davis Migrant Center, which was formalized through the execution of Standard Agreement #15OMS10860.
WHEREAS the OMS Program and the Housing Authority of the County of Yolo, acting through its Housing Commission have agreed that the OMS Center is in need of rehabilitation and improvements to best serve the health and safety needs of the residents in accordance with the California Codes of Regulations Sections 76007665.
NOW THEREFORE BE IT RESOLVED THAT:
Therefore, the Housing Commission of the Housing Authority of the County of Yolo commits to facilitate the rehabilitation and improvements at the Davis Migrant Center and agrees to provide direct project management and oversight to the work performed in accordance with all OMS Program requirements, all applicable State and Federal rules and laws, and in a manner consistent and in compliance with the Standard Agreement between the Housing Authority of the County of Yolo and the Department and whereas;
The Commission of the Housing Authority of the County of Yolo does hereby accept the agreement #15OMS10860 in the amount not to exceed $703,124 and;
This resolution authorizes Lisa A. Baker, Chief Executive Officer of the Housing Authority of the County of Yolo to execute Standard Agreement and any amendments or modifications thereto, as well as any other documents which are related to the Program, as the Department may deemd appropriate, on behalf of the Housing Commission of the Housing Authority of the County of Yolo
PASSED AND ADOPTED this 11th day of May, 2016 by the following votes:
AYES: NOES: ABSENT: ABSTAIN: ______________________________ Cecilia AguiarCurry, Chair
Yolo Housing Commission Attest: Yolo County Housing Commission By _________
Agenda Packet Page 15
Regular 9.
Yolo County HousingMeeting Date: 05/11/2016
InformationSUBJECTReview, Approve and Adopt Resolution Authorizing Acceptance of RehabilitationFunds from the State of California Housing and Community DevelopmentDepartment, Office of Migrant Services for the Madison Migrant Center (Ichtertz,Holt)
AttachmentsStaff Report
Form ReviewForm Started By: Julie Dachtler Started On: 05/06/2016 03:33 PMFinal Approval Date: 05/06/2016
Agenda Packet Page 16
Yolo County Housing Lisa A. Baker, Executive Director
147 W. Main Street Woodland: (530) 6625428 WOODLAND, CA 95695 Sacramento: (916) 4448982 TTY: (800) 5451833, ext.
626
DATE: May 11, 2016 TO: YCH Housing Commission FROM: Lisa A. Baker, Chief Executive Officer
Fred Ichtertz, Facilities Director SUBJECT: REVIEW, APPROVE AND ADOPT RESOLUTION AUTHORIZING
ACCEPTANCE OF REHABILITATION FUNDS FROM THE STATE OF CALIFORNIA, HOUSING AND COMMUNITY DEVELOPMENT DEPARTMENT, OFFICE OF MIGRANT SERVICES FOR THE MADISON MIGRANT CENTER
RECOMMENDED ACTIONS: That the Housing Commission:
1. Adopt the Resolution Authorizing acceptance of rehabilitation funds from the State of California, Housing and Community Development Department, Office of Migrant Services for the Madison Migrant Center located in the Township of Madison, Yolo County; and
2. Authorize the CEO to execute.
BACKGROUND / DISCUSSION: YCH manages the Madison Migrant Center for the State of California, Department of Housing and Community Development, Office of Migrant Services (OMS). No major improvements have been completed at the center since 1998. OMS has recently received funding for rehabilitation of the center in an amount not to exceed $671,928. OMS would like YCH to use these funds for site and building improvements at the center.
FISCAL IMPACT: None – Funds for improvements are from State of California, Department of Housing and Community Development, Office of Migrant Services
Agenda Packet Page 17
CONCLUSION: The Resolution is recommended for adoption. Attachments: Resolution
Agenda Packet Page 18
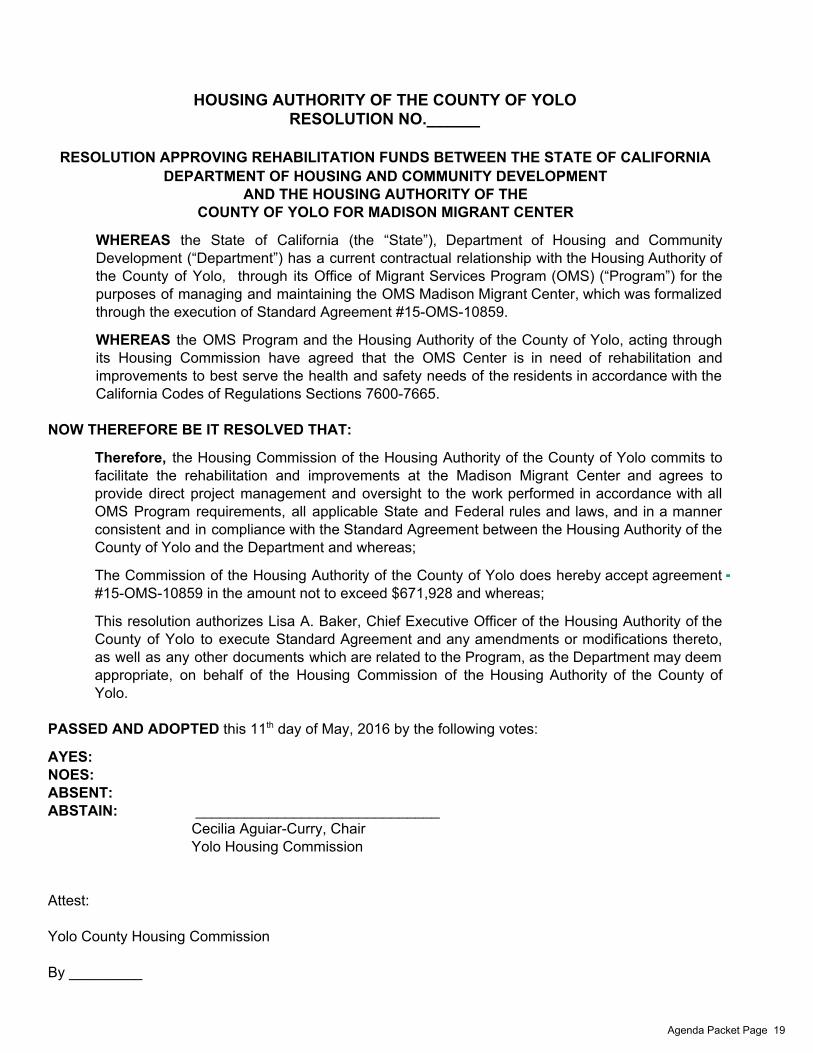
HOUSING AUTHORITY OF THE COUNTY OF YOLO RESOLUTION NO.______
RESOLUTION APPROVING REHABILITATION FUNDS BETWEEN THE STATE OF CALIFORNIA DEPARTMENT OF HOUSING AND COMMUNITY DEVELOPMENT
AND THE HOUSING AUTHORITY OF THE COUNTY OF YOLO FOR MADISON MIGRANT CENTER
WHEREAS the State of California (the “State”), Department of Housing and Community Development (“Department”) has a current contractual relationship with the HousingAuthority of the County of Yolo, through its Office of Migrant Services Program (OMS) (“Program”) for the purposes of managing and maintaining the OMS Madison Migrant Center, which was formalized through the execution of Standard Agreement #15OMS10859.
WHEREAS the OMS Program and the Housing Authority of the County of Yolo, acting through its Housing Commission have agreed that the OMS Center is in need of rehabilitation and improvements to best serve the health and safety needs of the residents in accordance with the California Codes of Regulations Sections 76007665.
NOW THEREFORE BE IT RESOLVED THAT:
Therefore, the Housing Commission of the Housing Authority of the County of Yolo commits to facilitate the rehabilitation and improvements at the Madison Migrant Center and agrees to provide direct project management and oversight to the work performed in accordance with all OMS Program requirements, all applicable State and Federal rules and laws, and in a manner consistent and in compliance with the Standard Agreement between the Housing Authority of the County of Yolo and the Department and whereas;
The Commission of the Housing Authority of the County of Yolo does hereby accept agreement #15OMS10859 in the amount not to exceed $671,928 and whereas;
This resolution authorizes Lisa A. Baker, Chief Executive Officer of the Housing Authority of the County of Yolo to execute Standard Agreement and any amendments or modifications thereto, as well as any other documents which are related to the Program, as the Department may deem appropriate, on behalf of the Housing Commission of the Housing Authority of the County of Yolo.
PASSED AND ADOPTED this 11th day of May, 2016 by the following votes:
AYES: NOES: ABSENT: ABSTAIN: ______________________________ Cecilia AguiarCurry, Chair
Yolo Housing Commission Attest: Yolo County Housing Commission By _________
Agenda Packet Page 19
Regular 10.
Yolo County HousingMeeting Date: 05/11/2016
InformationSUBJECTReview and Approve Proposed FY 2015 – 2016 Mid-Year Budget Revisions andReceive and File Quarterly Financial Information through December 31, 2015(Gillette and Baker)
AttachmentsStaff ReportAtt. A. Analysis
Form ReviewForm Started By: Julie Dachtler Started On: 05/06/2016 03:34 PMFinal Approval Date: 05/06/2016
Agenda Packet Page 20
Yolo County Housing Lisa A. Baker, Chief Executive Officer
147 W. Main Street Woodland: (530) 6625428 WOODLAND, CA 95695 Sacramento: (916) 4448982
TTY: (800) 5451833, ext. 626
DATE: May 11, 2016 TO: YCH Housing Commission FROM: Lisa A. Baker, Chief Executive Officer PREPARED BY: Jim Gillette, Finance Director
SUBJECT: REVIEW AND APPROVE THE PROPOSED FY 20152016 MIDYEAR BUDGET REVISIONS AND RECEIVE AND FILE FINANCIAL INFORMATION THROUGH December 31, 2015
RECOMMENDED ACTIONS: That the Housing Commission:
1. Appropriate additional identified revenue and approve the budgeting and expenditure of the additional funds as identified in the midyear budget revision; and
2. Approve the expenditure of funds for line item expenses that were not included in the original budget; and
3. Authorize the Chief Executive Officer to implement the revised budget and recommendations.
BACKGROUND / DISCUSSION The Department of Housing and Urban Development (HUD) requires a board approved budget be in place prior to the beginning of the Yolo County Housing (YCH) fiscal year. When this original budget is prepared, the best information available is used. However there are many unknowns when the budget is prepared in March, April and May prior to the fiscal year’s July 1 beginning. HUD funding is appropriated on a calendar year basis and the level of funding for the 2nd half of the agency fiscal year is completely unknown. As part of YCH's commitment to prudent financial management, staff does a midyear review of the annual budget to ensure that revenue and expenditure projections are prepared with the best available information. As part of the midyear budget revision process, Real Estate Services, Housing Assistance and Central Office management and staff have met with Finance staff
Working together to provide quality affordable housing and community development services for all
Agenda Packet Page 21
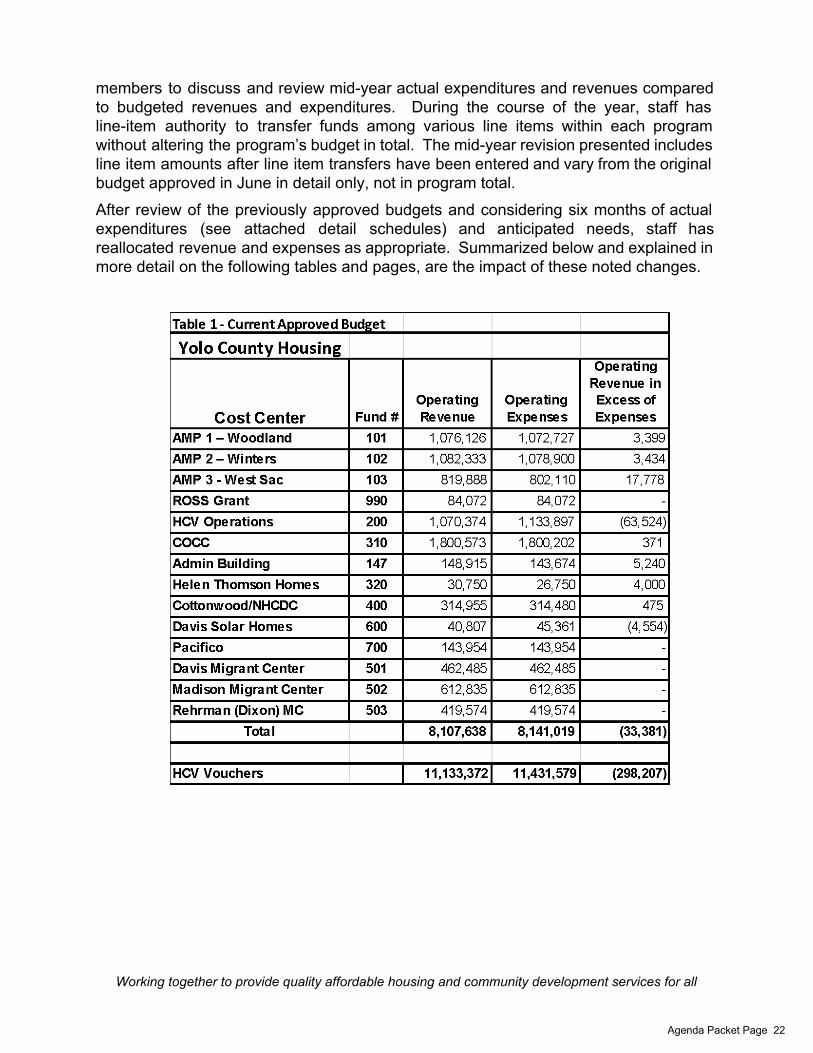
members to discuss and review midyear actual expenditures and revenues compared to budgeted revenues and expenditures. During the course of the year, staff has lineitem authority to transfer funds among various line items within each program without altering the program’s budget in total. The midyear revision presented includes line item amounts after line item transfers have been entered and vary from the original budget approved in June in detail only, not in program total. After review of the previously approved budgets and considering six months of actual expenditures (see attached detail schedules) and anticipated needs, staff has reallocated revenue and expenses as appropriate. Summarized below and explained in more detail on the following tables and pages, are the impact of these noted changes.
Working together to provide quality affordable housing and community development services for all
Agenda Packet Page 22
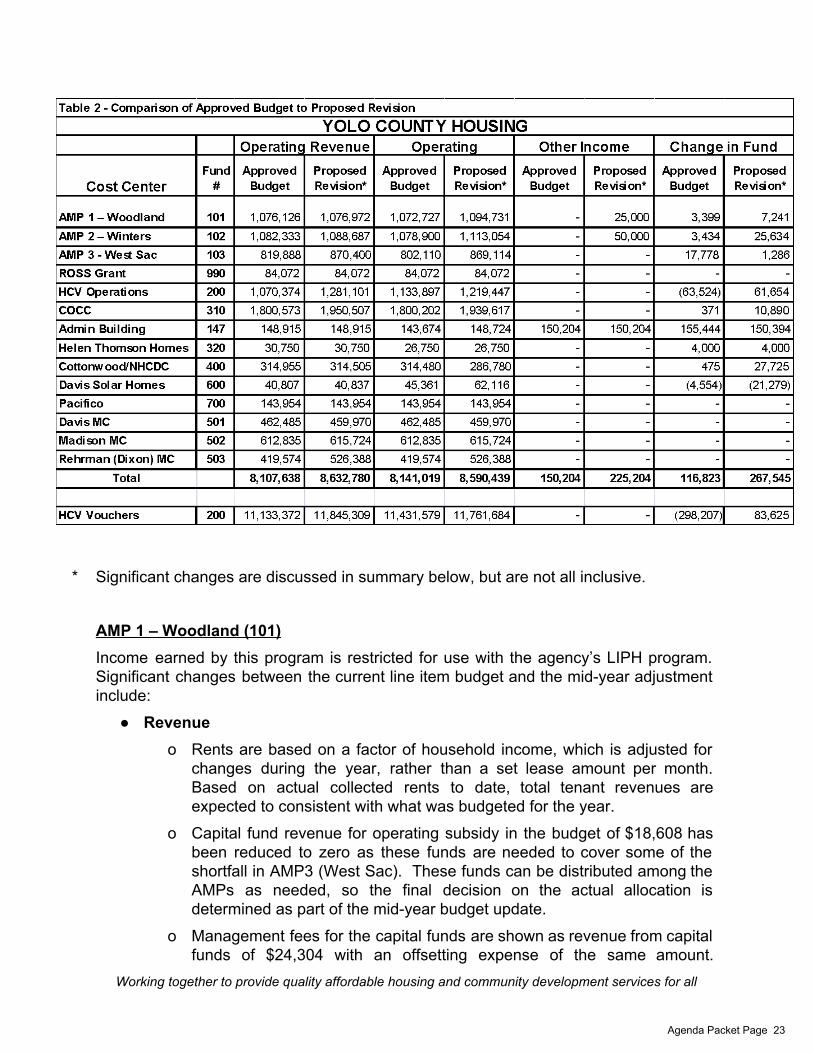
* Significant changes are discussed in summary below, but are not all inclusive. AMP 1 – Woodland (101) Income earned by this program is restricted for use with the agency’s LIPH program. Significant changes between the current line item budget and the midyear adjustment include:
Revenue o Rents are based on a factor of household income, which is adjusted for
changes during the year, rather than a set lease amount per month. Based on actual collected rents to date, total tenant revenues are expected to consistent with what was budgeted for the year.
o Capital fund revenue for operating subsidy in the budget of $18,608 has been reduced to zero as these funds are needed to cover some of the shortfall in AMP3 (West Sac). These funds can be distributed among the AMPs as needed, so the final decision on the actual allocation is determined as part of the midyear budget update.
o Management fees for the capital funds are shown as revenue from capital funds of $24,304 with an offsetting expense of the same amount.
Working together to provide quality affordable housing and community development services for all
Agenda Packet Page 23
Previously, these items had been netted out to zero from a budget perspective.
Expenses o Other than transfers between line items based on actual expenditures, the
primary reason for the increased expenses was separating out the $24,304 of capital fund management fee expense from the related revenue, as noted above, which is paid to COCC.
o In accordance with the Board approved plan for OPEB prefunding, projected OPEB contributions are based on an initial budget estimate (including potential use of reserves) plus expected savings or increased revenue projected at the midyear budget update. $17,759 of this is expected to be taken from a current reserve balance of approximately $325,000. The amount of the actual contribution to OPEB may be adjusted slightly based on changes in actual expenses incurred at the end of the fiscal year.
Other Income/Expense o $25,000 of capital funds are expected to be used for the purchase of
appliance inventory before the end of the year. This inventory will be retained as an asset of AMP (on the balance sheet) until utilized in the various programs and expensed to those programs, as appropriate.
AMP 2 – Winters (102) Income earned by this program is restricted for use with the agency’s LIPH program. Significant changes between the current line item budget and the midyear adjustment include:
Revenue o Rents are based on a factor of household income, which is adjusted for
changes during the year, rather than a set lease amount per month. Based on actual collected rents to date, total tenant revenues are expected to be consistent with what was budgeted for the year.
o Capital fund revenue for operating subsidy in the budget of $48,608 has been reduced to $29,608, so $19,000 of these funds can be used to cover some of the shortfall in AMP3 (West Sac). These funds can be distributed among the AMPs as needed, so the final decision on the actual allocation is determined as part of the midyear budget update.
o Management fees for the capital funds are shown as revenue from capital funds of $24,304 with an offsetting expense of the same amount. Previously, these items had been netted out to zero from a budget perspective.
Working together to provide quality affordable housing and community development services for all
Agenda Packet Page 24
Expenses o Other than transfers between line items based on actual expenditures,
the primary reason for the increased expenses was separating out the $24,304 of capital fund management fee expense from the related revenue, as noted above, which is paid to COCC.
o In accordance with the Board approved plan for OPEB prefunding, projected OPEB contributions are based on an initial budget estimate (including potential use of reserves) plus expected savings or increased revenue projected at the midyear budget update. $24,366 of this is expected to be taken from a current reserve balance of approximately $350,000. The amount of the actual contribution to OPEB may be adjusted slightly based on changes in actual expenses incurred at the end of the fiscal year.
Other Income/Expense o $50,000 of capital funds are expected to be used for well repairs and
improvements which will be captured as fixed assets on the balance sheet.
AMP 3 West Sacramento (103) Income earned by this program is restricted for use with the agency’s LIPH program. Significant changes between the current line item budget and the midyear adjustment include:
Revenue o Rents are based on a factor of household income, which is adjusted for
changes during the year, rather than a set lease amount per month. Based on actual collected rents to date, total tenant revenues are expected to consistent with what was budgeted for the year.
o The budget for capital fund operating subsidy revenue has been increased by $37,608 ($18,608 from AMP1 and $19,000 from AMP2) in order to cover some of the shortfall in revenue and additional expenses expected at this property during the year. These funds can be distributed among the AMPs as needed, so the final decision on the actual allocation is determined as part of the midyear budget update.
o Management fees for the capital funds are shown as revenue from capital funds of $24,304 with an offsetting expense of the same amount. Previously, these items had been netted out to zero from a budget perspective.
Expenses o Other than transfers between line items based on actual expenditures,
the primary reason for the increased expenses was separating out the
Working together to provide quality affordable housing and community development services for all
Agenda Packet Page 25
$24,304 of capital fund management fee expense from the related revenue, as noted above, which is paid to COCC.
o Depending on where the work was actually done, the reason for the increased costs may be: Properties for seniors typically experience lower turnover than familyoriented units, but turnover can occur in clusters at one time due to changing life situations. In addition, units with disabled seniors can experience additional wear and tear to the interiors. These factors can make the cost of actually turning units in a senior complex significantly more expensive per unit. Therefore we have conservatively estimated spending another $25,000 for maintenance during the final quarter of the year and have increased the budget to $125,000.
o In accordance with the Board approved plan for OPEB prefunding, projected OPEB contributions are based on an initial budget estimate (including potential use of reserves) plus expected savings or increased revenue projected at the midyear budget update. Due to limited reserves of $150,000 and higher than projected operating costs that had to be covered by additional capital fund revenue from the other AMPs, no OPEB contribution is expected during the year. The amount of the actual contribution to OPEB may be adjusted slightly based on changes in actual expenses incurred at the end of the fiscal year.
Other Income/Expense o No capital funds are expected to be used for the purchase or
construction of any capital assets for this property during the year. ROSS Grant (990)
This program is funded by a separate HUD grant to provide services to public housing tenants in order to help them become more self sufficient. In 2014, YCH received a $243,000 grant to provide this service over three years. The attached budget shows the current 12 month portion of this grant which for reimbursement of expenses.
There are no significant changes to this budget for the year. HVC Operations (200Administration) During the year, it was discovered that two of the amounts reported to HUD in the Voucher Management System (VMS) did not agree with the related amounts in the general ledger for the program. Dating back to 2010, when more detailed VMS reporting was introduced, $179,634 of Net Restricted Position (NRP) related to HAP payments had been reported as part of the Unrestricted Net Position (UNP) related to the administration of those payments. This reporting error was discussed with HUD and the
Working together to provide quality affordable housing and community development services for all
Agenda Packet Page 26
necessary reclassification of the amounts in the VMS report has been done. There is no impact on the general ledger. Earlier in the year, payment standards were increased by the Commission to keep pace with higher rents in Yolo and a number of rental rate increases from landlords were approved. The impact of these items was to increase the average cost per voucher. In order to avoid shortfall, staff has not issued any new vouchers since January. We continue to monitor the situation and have been in discussion with HUD to ensure we do not go into shortfall. Income earned by this program is restricted for use with the agency’s HCV program. Significant changes between the current line item budget and the midyear adjustment include:
Revenue: o Admin Fee Revenue has been increased to by HUD to 80% of the HUD
contracted amount based on the current Federal budget which has translated into $102,876 of additional projected admin revenue for the year.
o HUD adjustments to admin fees related to 2014 amounted to another $107,851 of admin funds than originally budgeted.
Expenses o Additional temporary staff have been brought in during the year in order to
help with the migration to new back office software platform and to purge the waitlist for the voucher program in preparation for reopening the list.
o In accordance with the Board approved plan for OPEB prefunding, projected OPEB contributions are based on an initial budget estimate (including potential use of reserves) plus expected savings or increased revenue projected at the midyear budget update. Some of the additional admin revenue received from HUD will be used to fund the current OPEB contribution for this program. The amount of the actual contribution to OPEB may be adjusted slightly based on changes in actual expenses incurred at the end of the fiscal year.
HCV Vouchers (200HAP) Housing Assistance Payments (HAP), made on behalf of Housing Choice Voucher holders, are a direct pass through from HUD to individual landlords on behalf of eligible tenants. HAP is separate from funds earned by the HCV program for program administration. Any excess or shortage of allocation received to vouchers paid becomes part of the Net Restricted Position or NRP (formerly known as Net Restricted Assets or NRA) and is reported monthly to HUD and reconciled annually during the audit.
Working together to provide quality affordable housing and community development services for all
Agenda Packet Page 27

That additional expense line items shown in the budget are a result of the new back office system migration that allows much greater detail for tracking various aspects of this program. The net increase in fund balance noted on the schedule is the contribution to NRP during the year that will be used in the future to continue to grow or maintain the program. COCC (310) Significant changes between the current line item budget and the midyear adjustment include:
Revenue o In general, actual revenue is in line with the initial budget projections. o A focus on cost reduction related to copying and printing costs is showing
dividends as you see the copier usage charge revenue from the programs has been reduced by $24,000 to an estimated total of $48,623, which is approximately the same as the cost in incurred by COCC for the machines and related supplies.
o IT and Maintenance charges are based on the actual hours worked for the various programs by COCC staff. Due to some restructuring of the migrant maintenance program and converting a parttime maintenance person to full time additional hours of work were billed. This additional revenue was partially offset by the additional staffing costs noted in the expense section.
Expenses o A raise of 4% to all staff (retroactive to the beginning of the fiscal year)
was provided, but had not been anticipated in the original budget. This cost was partially offset by a reduction in benefits as staff is now picking up a larger share of the retirement cost.
o Some additional maintenance staff at COCC were transferred from the migrant program or converted to full time. As noted above, these costs were absorbed through additional hours billed to the programs for actual work done.
o The increase in administrative payroll costs was also due to the addition of a paid intern in the finance department. The cost of this program for the year is being reimbursed through a work experience program from the County.
o In accordance with the Board approved plan for OPEB prefunding, projected OPEB contributions are based on an initial budget estimate (including potential use of reserves) plus expected savings or increased revenue projected at the midyear budget update. The OPEB contribution for the year is expected to be $100,000. The amount of the actual
Working together to provide quality affordable housing and community development services for all
Agenda Packet Page 28
contribution to OPEB may be adjusted based on changes in actual expenses incurred and revenues earned at the end of the fiscal year.
Admin Building (147)
Overall revenue and expense amounts are consistent with the budget. The small increase in expenses noted is related to a pending alarm system upgrade that will be more extensive than originally planned.
Helen Thompson Homes (320) This is a cost reimbursement contract between YCH and the Yolo County Alcohol, Drug and Mental Health program for operation and maintenance of two homes (West Sacramento and Woodland). YCH provides management and maintenance, while another entity provides services to the residents. We invoice the County for the entire amount of the contract at the end of the year. The difference between the total contract amount and costs incurred is placed in a replacement reserve account for the properties. The annual amount deposited to the replacement reserve account is typically about $4,000, which is shown as an increase in fund balance on the attached schedule. YCH receives an $8,100 administrative fee for maintaining the homes. New Hope CDC/Cottonwood Meadows (400) New Hope CDC (NHCDC) has continued to evolve and now is a general partner in 3 real estate partnerships as well as the sole owner of Cottonwood Meadows Senior Apartments. Since the NHCDC investment activities are such a small part of the overall activities, the fee revenue and various expenses are included in the same budget as Cottonwood. Cottonwood is a fortyseven unit senior apartment complex comprised of 14 low rent units and 33 market rate units. Its construction was partially funded by the California Department of Housing and Community Development (HCD) and some bank debt. Significant changes between the current line item budget and the midyear revision include:
Revenue o Rental revenue for Cottonwood and fee revenue for NHCDC are
consistent with projections. Expenses
o Expenses are consistent with budget projections, except the budget for interest had included the total debt service costs (both principal and
Working together to provide quality affordable housing and community development services for all
Agenda Packet Page 29
interest). This has now been reduced by $30,000 to just the interest amount.
Davis Solar Homes (600) The Davis Solar program is a rural farmworker program with construction of these seven agricultural housing units originally funded by the U.S. Department of Agriculture Rural Development. The last of these loans was repaid during the 2015 fiscal year and the units are now debt free with only a restricted use agreement with USDA remaining on title.
Revenue o Dwelling rent and other revenue are consistent with the original budget
amounts. Expenses
o Unanticipated costs for roof and HVAC repairs of $16,000 will be taken out of the $90,000 of reserves on the property.
Pacifico (700) This program is designed to be a cost reimbursement program from the City of Davis. In this program, all revenue is remitted to the City of Davis and approved expenses are reimbursed by the City of Davis. Significant changes between the current line item budget and the midyear revision include:
Revenue o The revenue shown on the attached schedules represents the cost
amount being reimbursed by the City of Davis, which is consistent with the budget.
o Based on the structure of the program, rental receipts are treated as a liability to the City of Davis and paid quarterly. This project continues to have slightly positive cash flow.
Expenses o Expenses are trending consistent with the original budget.
Davis Migrant Center (501) The migrant center program is designed to be a cost reimbursement program from the Office of Migrant Services (OMS) which is part of the California Department of Housing and Community Development (HCD). In this program, all revenue is remitted to OMS and approved expenses are reimbursed by OMS
Working together to provide quality affordable housing and community development services for all
Agenda Packet Page 30
Significant changes between the current line item budget and the midyear revision include:
Revenue o Revenue includes a 20% advance from OMS which is then amortized over
the last three months of the program, so actual revenue is frontloaded in the attached schedule.
Expenses o Expenses are consistent with budget projections.
Madison Migrant Center (502) The migrant center program is designed to be a cost reimbursement program from the Office of Migrant Services (OMS) which is part of the California Department of Housing and Community Development (HCD). In this program, all revenue is remitted to OMS and approved expenses are reimbursed from OMS Significant changes between the current line item budget and the midyear revision include:
Revenue o Revenue includes a 20% advance from OMS which is then amortized over
the last three months of the program, so actual revenue is frontloaded in the attached schedule.
Expenses o Expenses are consistent with budget projections.
Rehrman (Dixon) Migrant Center (503) The migrant center program is designed to be a cost reimbursement program from the Office of Migrant Services (OMS) which is part of the California Department of Housing and Community Development (HCD). In this program, all revenue is remitted to OMS and approved expenses are reimbursed from OMS Significant changes between the current line item budget and the midyear revision include:
Revenue o Revenue includes a 20% advance from OMS which is then amortized over
the last three months of the program, so actual revenue is frontloaded in the attached schedule.
o Subsequent to the issuance of the budget, OMS approved $106,814 of additional power pole replacement work to be done at the center.
Working together to provide quality affordable housing and community development services for all
Agenda Packet Page 31
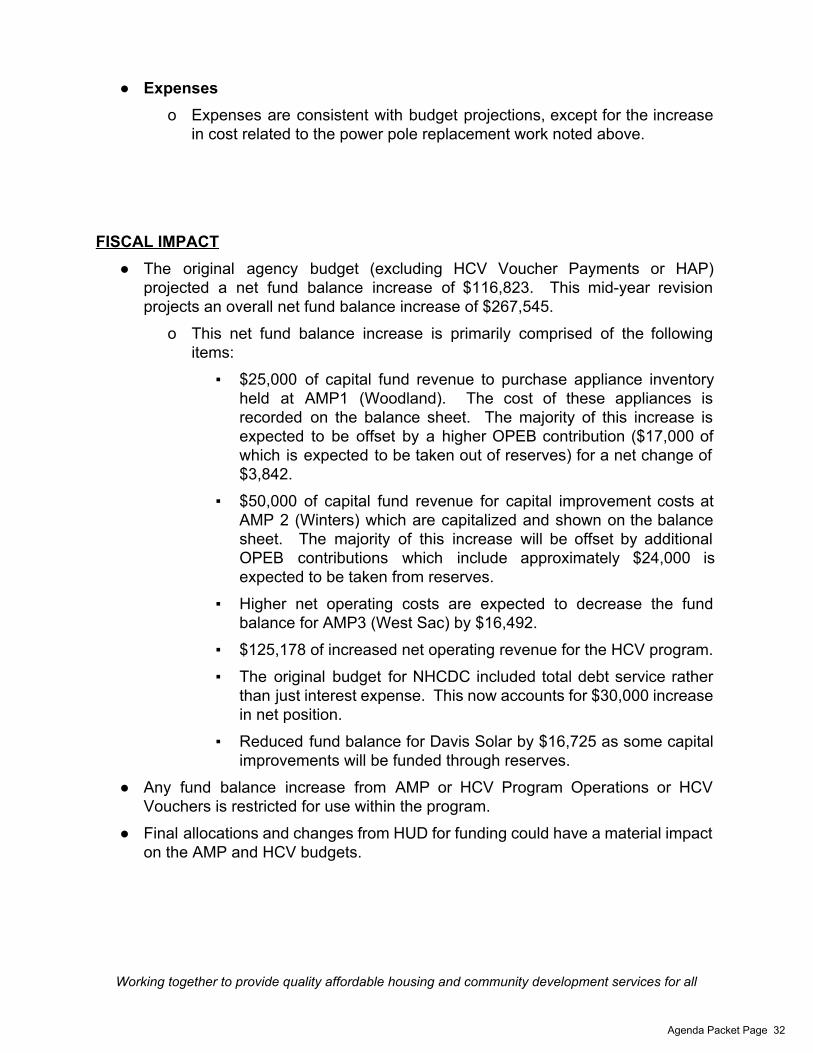
Expenses o Expenses are consistent with budget projections, except for the increase
in cost related to the power pole replacement work noted above. FISCAL IMPACT
The original agency budget (excluding HCV Voucher Payments or HAP) projected a net fund balance increase of $116,823. This midyear revision projects an overall net fund balance increase of $267,545.
o This net fund balance increase is primarily comprised of the following items:
$25,000 of capital fund revenue to purchase appliance inventory held at AMP1 (Woodland). The cost of these appliances is recorded on the balance sheet. The majority of this increase is expected to be offset by a higher OPEB contribution ($17,000 of which is expected to be taken out of reserves) for a net change of $3,842.
$50,000 of capital fund revenue for capital improvement costs at AMP 2 (Winters) which are capitalized and shown on the balance sheet. The majority of this increase will be offset by additional OPEB contributions which include approximately $24,000 is expected to be taken from reserves.
Higher net operating costs are expected to decrease the fund balance for AMP3 (West Sac) by $16,492.
$125,178 of increased net operating revenue for the HCV program. The original budget for NHCDC included total debt service rather
than just interest expense. This now accounts for $30,000 increase in net position.
Reduced fund balance for Davis Solar by $16,725 as some capital improvements will be funded through reserves.
Any fund balance increase from AMP or HCV Program Operations or HCV Vouchers is restricted for use within the program.
Final allocations and changes from HUD for funding could have a material impact on the AMP and HCV budgets.
Working together to provide quality affordable housing and community development services for all
Agenda Packet Page 32

CONCLUSION Ignoring depreciation and excluding HCV vouchers, the midyear budget analysis reveals that YCH is positioned to complete the year about $150,000 better than our original estimates. Staff recommends acceptance of the December Operating Statements and approval of the 20152016 MidYear Budget Revision and the associated Recommendations as detailed above.
Working together to provide quality affordable housing and community development services for all
Agenda Packet Page 33
G:\Budgets\Budget 2015‐16\Mid‐year Update\[Mid‐year Budget Analysis FY2016 v4.xlsx]Mid‐year Budget Analysis FY2016
Yolo HousingMid‐year Budget Updates FY2015‐16
Account Line Description Jul‐15 Aug‐15 Sep‐15 Oct‐15 Nov‐15 Dec‐15 YTD thru Dec‐15
Approved Budget
Budget Revisions
Revised Budget
Remaining Budget
% Remaining
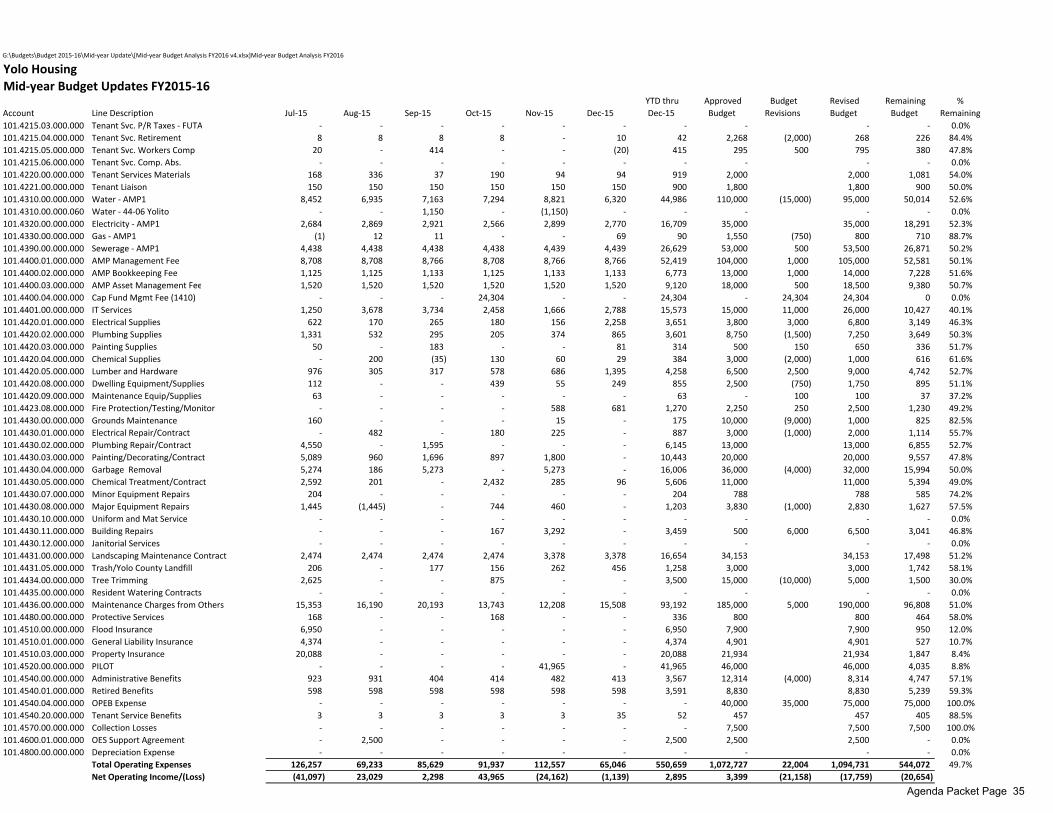
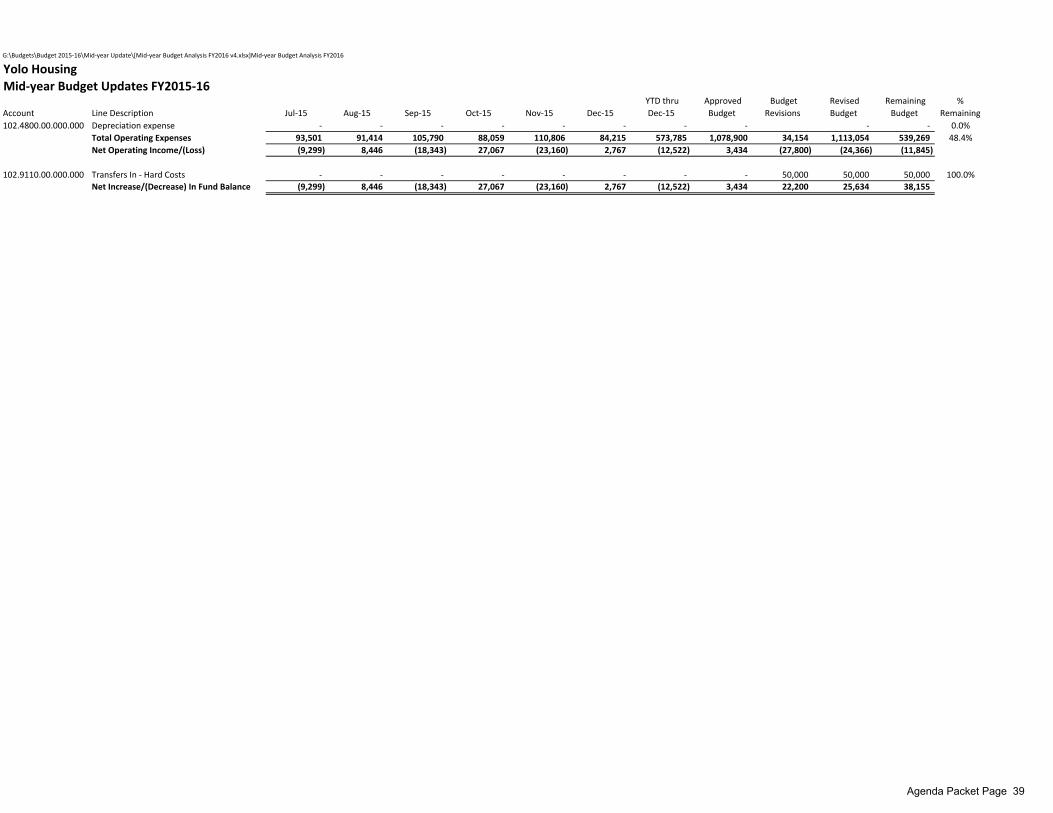
AMP1 (Woodland)101.3110.00.000.010 Dwelling Rent 44‐01 Yolano 21,655 22,092 22,207 22,579 22,670 22,178 133,380 250,000 4,000 254,000 120,620 47.5%101.3110.00.000.050 Dwelling Rent 44‐05 Ridgecut (Knights Landin 1,552 2,140 2,269 1,635 1,751 1,751 11,098 20,000 20,000 8,902 44.5%101.3110.00.000.060 Dwelling Rent 44‐06 Yolito 2,663 2,621 2,684 2,958 2,958 3,196 17,080 42,000 (8,000) 34,000 16,920 49.8%101.3110.00.000.070 Dwelling Rent 44‐07 Donnelly 23,029 24,061 23,869 21,483 23,090 24,741 140,273 273,000 4,000 277,000 136,727 49.4%101.3111.00.000.060 Retro Rent‐4406‐Yolito ‐ ‐ ‐ ‐ ‐ ‐ ‐ ‐ ‐ ‐ 0.0%101.3111.00.010.000 Retro Rent‐44‐01 Yolano ‐ ‐ ‐ ‐ ‐ ‐ ‐ 500 (500) ‐ ‐ 0.0%101.3111.00.070.000 Retro Rent‐4407‐Donnelly ‐ ‐ ‐ ‐ ‐ ‐ ‐ 500 (500) ‐ ‐ 0.0%101.3200.00.000.000 HUD Operating Subsidy 35,517 35,517 35,669 35,651 35,651 35,651 213,655 434,658 434,658 221,003 50.8%101.3210.00.000.000 CF Trans In ‐ Operating Funds (1406) ‐ ‐ ‐ ‐ ‐ ‐ ‐ 18,608 (18,608) (0) (0) 100.0%101.3220.00.000.000 CF Trans In ‐ Mgmt Impr (1408) ‐ 3,375 ‐ 97 ‐ ‐ 3,472 15,000 15,000 11,528 76.9%101.3230.00.000.000 CF Trans In ‐ Soft Costs ‐ 2,027 ‐ 24,207 ‐ (24,582) 1,652 5,000 (3,000) 2,000 348 17.4%101.3610.00.000.000 Interest Income 69 77 64 64 73 64 411 525 300 825 414 50.2%101.3690.00.000.000 Other Income ‐ ‐ ‐ 2,003 2,003 ‐ 4,005 8,510 8,510 4,505 52.9%101.3690.00.000.010 Other Income ‐ 44‐01 Yolano 430 100 825 722 ‐ 626 2,703 3,750 3,750 1,047 27.9%101.3690.00.000.050 Other Income ‐ 44‐05 Ridgecut ‐ 53 20 ‐ ‐ ‐ 73 25 100 125 52 41.8%101.3690.00.000.060 Other Income ‐ 44‐06 Yolito 206 ‐ 20 ‐ ‐ ‐ 226 50 250 300 74 24.8%101.3690.00.000.070 Other Income‐ 44‐07 Donnelly 40 200 300 200 200 281 1,221 4,000 (1,500) 2,500 1,279 51.2%101.9111.04.000.000 Transfer In ‐Cap Fund Mgmt Fee for COCC ‐ ‐ ‐ 24,304 ‐ ‐ 24,304 ‐ 24,304 24,304 0 0.0%
Total Operating Revenue 85,160 92,262 87,927 135,902 88,395 63,907 553,554 1,076,126 846 1,076,972 523,418 48.6%
101.4110.00.000.000 Administrative Salaries 5,819 6,159 8,539 5,887 5,858 7,664 39,926 66,975 5,000 71,975 32,049 44.5%101.4125.01.000.000 Admin. P/R Taxes‐ Social Security/Medicare 424 449 623 429 426 562 2,912 5,124 5,124 2,211 43.2%101.4125.02.000.000 Admin. P/R Taxes‐ ‐SUI ‐ ‐ ‐ ‐ ‐ ‐ ‐ 673 673 673 100.0%101.4125.04.000.000 Admin. Retirement 796 841 1,172 813 800 720 5,143 10,863 10,863 5,721 52.7%101.4125.05.000.000 Admin. Workers Comp 129 ‐ 658 ‐ ‐ 408 1,195 2,267 250 2,517 1,322 52.5%101.4125.06.000.000 Admin. Comp. Abs. ‐ ‐ ‐ ‐ ‐ ‐ ‐ ‐ ‐ ‐ 0.0%101.4130.00.000.000 Legal Fees 2,460 ‐ 265 ‐ ‐ ‐ 2,725 12,000 (7,000) 5,000 2,275 45.5%101.4140.00.000.000 Training (131) 259 314 ‐ 154 311 907 3,500 (2,000) 1,500 593 39.6%101.4150.00.000.000 Travel 136 337 ‐ 173 ‐ 137 782 4,000 (2,500) 1,500 718 47.8%101.4170.04.000.000 Contract Services Plan Updates ‐ ‐ ‐ ‐ ‐ 1,922 1,922 5,000 5,000 3,078 61.6%101.4170.05.000.000 Contract Service ‐ ‐ ‐ ‐ ‐ 461 461 ‐ 9,100 9,100 8,639 94.9%101.4170.10.000.000 Professional Services ‐ 202 ‐ ‐ ‐ ‐ 202 2,000 (1,750) 250 48 19.3%101.4171.00.000.000 Auditing ‐ 2,333 4,582 ‐ ‐ ‐ 6,915 17,000 (3,000) 14,000 7,085 50.6%101.4180.00.000.000 147 Rent 2,428 2,428 2,428 2,428 2,428 2,428 14,567 29,133 29,133 14,567 50.0%101.4190.00.000.000 Postage 57 97 59 113 79 63 468 500 500 1,000 532 53.2%101.4190.01.000.000 Office Supplies 579 12 ‐ 41 224 63 919 1,500 300 1,800 881 49.0%101.4190.02.000.000 Printing & Copier Usage Charges 332 396 303 507 441 61 2,039 9,480 (5,500) 3,980 1,940 48.8%101.4190.03.000.000 Telephone 260 210 252 307 270 235 1,534 3,000 3,000 1,466 48.9%101.4190.04.000.000 Fair Housing Services ‐ ‐ ‐ 417 ‐ ‐ 417 1,750 (900) 850 433 51.0%101.4190.05.000.000 Dues and Subscriptions ‐ ‐ ‐ ‐ 215 40 255 300 300 45 15.2%101.4190.07.000.000 Computer Support & License Fees 6,915 ‐ ‐ 2,500 ‐ 200 9,615 5,750 4,000 9,750 135 1.4%101.4190.11.000.000 Office Equipment ‐ ‐ ‐ ‐ ‐ ‐ ‐ ‐ ‐ ‐ 0.0%101.4190.12.000.000 Office Machines/Leases 112 202 ‐ 89 112 89 605 900 900 295 32.8%101.4190.13.000.000 Administrative Other ‐ ‐ ‐ ‐ ‐ ‐ ‐ ‐ ‐ ‐ 0.0%101.4190.14.000.000 Criminal Background Checks 49 34 101 195 ‐ 28 407 2,500 (1,500) 1,000 593 59.3%101.4190.15.000.000 Personnel Cost (Temps) ‐ ‐ ‐ ‐ ‐ ‐ ‐ ‐ ‐ ‐ 0.0%101.4190.18.000.000 Taxes, Fees and Assessments 40 ‐ ‐ ‐ ‐ ‐ 40 250 250 210 83.9%101.4190.20.000.000 Advertising 100 ‐ 200 ‐ 201 ‐ 501 1,150 1,150 649 56.4%101.4190.23.000.000 Computer Equipment ‐ ‐ ‐ ‐ ‐ 414 414 ‐ 1,000 1,000 586 58.6%101.4210.00.000.010 Tenant Service Salaries 883 1,068 1,100 829 786 (4,390) 275 13,980 (13,000) 980 705 71.9%101.4215.01.000.000 Tenant Svc. P/R Taxes‐ Social Security/Medica 67 81 84 63 60 (337) 19 1,069 (500) 569 551 96.7%101.4215.02.000.000 Tenant Svc. P/R Taxes‐‐SUI 52 63 65 3 ‐ (115) 67 443 (300) 143 75 52.7%
Agenda Packet Page 34
G:\Budgets\Budget 2015‐16\Mid‐year Update\[Mid‐year Budget Analysis FY2016 v4.xlsx]Mid‐year Budget Analysis FY2016
Yolo HousingMid‐year Budget Updates FY2015‐16
Account Line Description Jul‐15 Aug‐15 Sep‐15 Oct‐15 Nov‐15 Dec‐15 YTD thru Dec‐15
Approved Budget
Budget Revisions
Revised Budget
Remaining Budget
% Remaining
101.4215.03.000.000 Tenant Svc. P/R Taxes ‐ FUTA ‐ ‐ ‐ ‐ ‐ ‐ ‐ ‐ ‐ ‐ 0.0%101.4215.04.000.000 Tenant Svc. Retirement 8 8 8 8 ‐ 10 42 2,268 (2,000) 268 226 84.4%101.4215.05.000.000 Tenant Svc. Workers Comp 20 ‐ 414 ‐ ‐ (20) 415 295 500 795 380 47.8%101.4215.06.000.000 Tenant Svc. Comp. Abs. ‐ ‐ ‐ ‐ ‐ ‐ ‐ ‐ ‐ ‐ 0.0%101.4220.00.000.000 Tenant Services Materials 168 336 37 190 94 94 919 2,000 2,000 1,081 54.0%101.4221.00.000.000 Tenant Liaison 150 150 150 150 150 150 900 1,800 1,800 900 50.0%101.4310.00.000.000 Water ‐ AMP1 8,452 6,935 7,163 7,294 8,821 6,320 44,986 110,000 (15,000) 95,000 50,014 52.6%101.4310.00.000.060 Water ‐ 44‐06 Yolito ‐ ‐ 1,150 ‐ (1,150) ‐ ‐ ‐ ‐ ‐ 0.0%101.4320.00.000.000 Electricity ‐ AMP1 2,684 2,869 2,921 2,566 2,899 2,770 16,709 35,000 35,000 18,291 52.3%101.4330.00.000.000 Gas ‐ AMP1 (1) 12 11 ‐ ‐ 69 90 1,550 (750) 800 710 88.7%101.4390.00.000.000 Sewerage ‐ AMP1 4,438 4,438 4,438 4,438 4,439 4,439 26,629 53,000 500 53,500 26,871 50.2%101.4400.01.000.000 AMP Management Fee 8,708 8,708 8,766 8,708 8,766 8,766 52,419 104,000 1,000 105,000 52,581 50.1%101.4400.02.000.000 AMP Bookkeeping Fee 1,125 1,125 1,133 1,125 1,133 1,133 6,773 13,000 1,000 14,000 7,228 51.6%101.4400.03.000.000 AMP Asset Management Fee 1,520 1,520 1,520 1,520 1,520 1,520 9,120 18,000 500 18,500 9,380 50.7%101.4400.04.000.000 Cap Fund Mgmt Fee (1410) ‐ ‐ ‐ 24,304 ‐ ‐ 24,304 ‐ 24,304 24,304 0 0.0%101.4401.00.000.000 IT Services 1,250 3,678 3,734 2,458 1,666 2,788 15,573 15,000 11,000 26,000 10,427 40.1%101.4420.01.000.000 Electrical Supplies 622 170 265 180 156 2,258 3,651 3,800 3,000 6,800 3,149 46.3%101.4420.02.000.000 Plumbing Supplies 1,331 532 295 205 374 865 3,601 8,750 (1,500) 7,250 3,649 50.3%101.4420.03.000.000 Painting Supplies 50 ‐ 183 ‐ ‐ 81 314 500 150 650 336 51.7%101.4420.04.000.000 Chemical Supplies ‐ 200 (35) 130 60 29 384 3,000 (2,000) 1,000 616 61.6%101.4420.05.000.000 Lumber and Hardware 976 305 317 578 686 1,395 4,258 6,500 2,500 9,000 4,742 52.7%101.4420.08.000.000 Dwelling Equipment/Supplies 112 ‐ ‐ 439 55 249 855 2,500 (750) 1,750 895 51.1%101.4420.09.000.000 Maintenance Equip/Supplies 63 ‐ ‐ ‐ ‐ ‐ 63 ‐ 100 100 37 37.2%101.4423.08.000.000 Fire Protection/Testing/Monitor ‐ ‐ ‐ ‐ 588 681 1,270 2,250 250 2,500 1,230 49.2%101.4430.00.000.000 Grounds Maintenance 160 ‐ ‐ ‐ 15 ‐ 175 10,000 (9,000) 1,000 825 82.5%101.4430.01.000.000 Electrical Repair/Contract ‐ 482 ‐ 180 225 ‐ 887 3,000 (1,000) 2,000 1,114 55.7%101.4430.02.000.000 Plumbing Repair/Contract 4,550 ‐ 1,595 ‐ ‐ ‐ 6,145 13,000 13,000 6,855 52.7%101.4430.03.000.000 Painting/Decorating/Contract 5,089 960 1,696 897 1,800 ‐ 10,443 20,000 20,000 9,557 47.8%101.4430.04.000.000 Garbage Removal 5,274 186 5,273 ‐ 5,273 ‐ 16,006 36,000 (4,000) 32,000 15,994 50.0%101.4430.05.000.000 Chemical Treatment/Contract 2,592 201 ‐ 2,432 285 96 5,606 11,000 11,000 5,394 49.0%101.4430.07.000.000 Minor Equipment Repairs 204 ‐ ‐ ‐ ‐ ‐ 204 788 788 585 74.2%101.4430.08.000.000 Major Equipment Repairs 1,445 (1,445) ‐ 744 460 ‐ 1,203 3,830 (1,000) 2,830 1,627 57.5%101.4430.10.000.000 Uniform and Mat Service ‐ ‐ ‐ ‐ ‐ ‐ ‐ ‐ ‐ ‐ 0.0%101.4430.11.000.000 Building Repairs ‐ ‐ ‐ 167 3,292 ‐ 3,459 500 6,000 6,500 3,041 46.8%101.4430.12.000.000 Janitorial Services ‐ ‐ ‐ ‐ ‐ ‐ ‐ ‐ ‐ ‐ 0.0%101.4431.00.000.000 Landscaping Maintenance Contract 2,474 2,474 2,474 2,474 3,378 3,378 16,654 34,153 34,153 17,498 51.2%101.4431.05.000.000 Trash/Yolo County Landfill 206 ‐ 177 156 262 456 1,258 3,000 3,000 1,742 58.1%101.4434.00.000.000 Tree Trimming 2,625 ‐ ‐ 875 ‐ ‐ 3,500 15,000 (10,000) 5,000 1,500 30.0%101.4435.00.000.000 Resident Watering Contracts ‐ ‐ ‐ ‐ ‐ ‐ ‐ ‐ ‐ ‐ 0.0%101.4436.00.000.000 Maintenance Charges from Others 15,353 16,190 20,193 13,743 12,208 15,508 93,192 185,000 5,000 190,000 96,808 51.0%101.4480.00.000.000 Protective Services 168 ‐ ‐ 168 ‐ ‐ 336 800 800 464 58.0%101.4510.00.000.000 Flood Insurance 6,950 ‐ ‐ ‐ ‐ ‐ 6,950 7,900 7,900 950 12.0%101.4510.01.000.000 General Liability Insurance 4,374 ‐ ‐ ‐ ‐ ‐ 4,374 4,901 4,901 527 10.7%101.4510.03.000.000 Property Insurance 20,088 ‐ ‐ ‐ ‐ ‐ 20,088 21,934 21,934 1,847 8.4%101.4520.00.000.000 PILOT ‐ ‐ ‐ ‐ 41,965 ‐ 41,965 46,000 46,000 4,035 8.8%101.4540.00.000.000 Administrative Benefits 923 931 404 414 482 413 3,567 12,314 (4,000) 8,314 4,747 57.1%101.4540.01.000.000 Retired Benefits 598 598 598 598 598 598 3,591 8,830 8,830 5,239 59.3%101.4540.04.000.000 OPEB Expense ‐ ‐ ‐ ‐ ‐ ‐ ‐ 40,000 35,000 75,000 75,000 100.0%101.4540.20.000.000 Tenant Service Benefits 3 3 3 3 3 35 52 457 457 405 88.5%101.4570.00.000.000 Collection Losses ‐ ‐ ‐ ‐ ‐ ‐ ‐ 7,500 7,500 7,500 100.0%101.4600.01.000.000 OES Support Agreement ‐ 2,500 ‐ ‐ ‐ ‐ 2,500 2,500 2,500 ‐ 0.0%101.4800.00.000.000 Depreciation Expense ‐ ‐ ‐ ‐ ‐ ‐ ‐ ‐ ‐ ‐ 0.0%
Total Operating Expenses 126,257 69,233 85,629 91,937 112,557 65,046 550,659 1,072,727 22,004 1,094,731 544,072 49.7%Net Operating Income/(Loss) (41,097) 23,029 2,298 43,965 (24,162) (1,139) 2,895 3,399 (21,158) (17,759) (20,654)
Agenda Packet Page 35
G:\Budgets\Budget 2015‐16\Mid‐year Update\[Mid‐year Budget Analysis FY2016 v4.xlsx]Mid‐year Budget Analysis FY2016
Yolo HousingMid‐year Budget Updates FY2015‐16
Account Line Description Jul‐15 Aug‐15 Sep‐15 Oct‐15 Nov‐15 Dec‐15 YTD thru Dec‐15
Approved Budget
Budget Revisions
Revised Budget
Remaining Budget
% Remaining
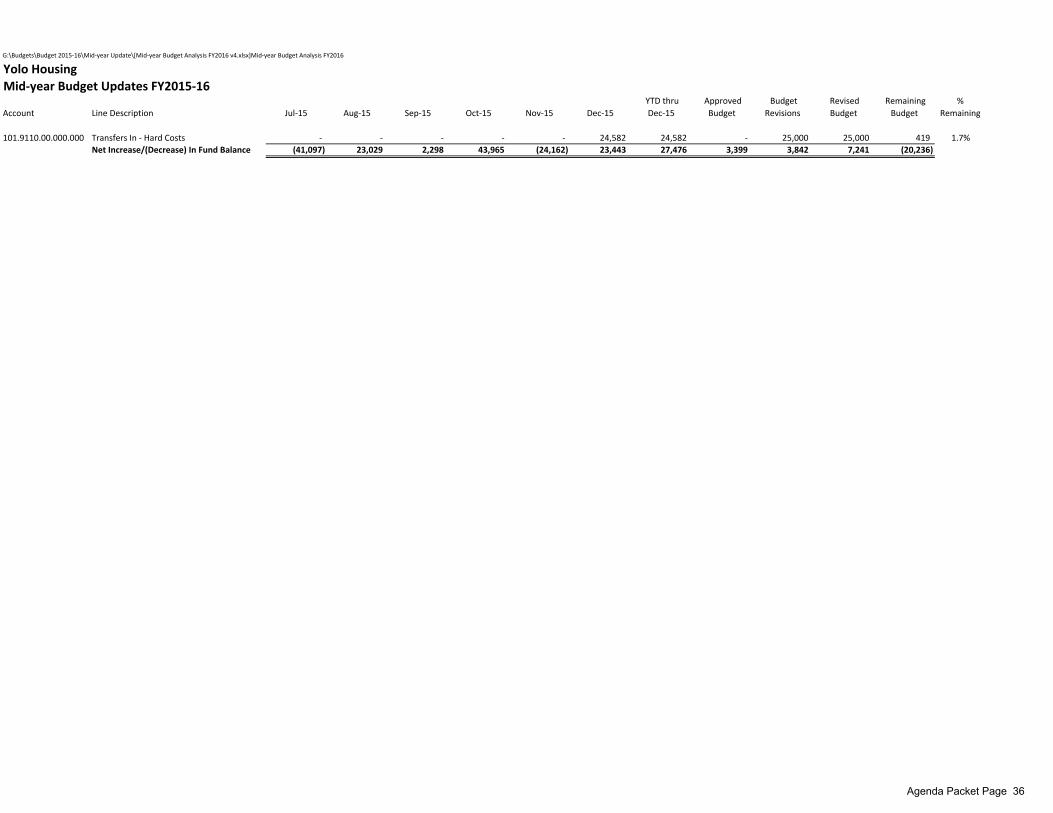
101.9110.00.000.000 Transfers In ‐ Hard Costs ‐ ‐ ‐ ‐ ‐ 24,582 24,582 ‐ 25,000 25,000 419 1.7%Net Increase/(Decrease) In Fund Balance (41,097) 23,029 2,298 43,965 (24,162) 23,443 27,476 3,399 3,842 7,241 (20,236)
Agenda Packet Page 36
G:\Budgets\Budget 2015‐16\Mid‐year Update\[Mid‐year Budget Analysis FY2016 v4.xlsx]Mid‐year Budget Analysis FY2016
Yolo HousingMid‐year Budget Updates FY2015‐16
Account Line Description Jul‐15 Aug‐15 Sep‐15 Oct‐15 Nov‐15 Dec‐15 YTD thru Dec‐15
Approved Budget
Budget Revisions
Revised Budget
Remaining Budget
% Remaining
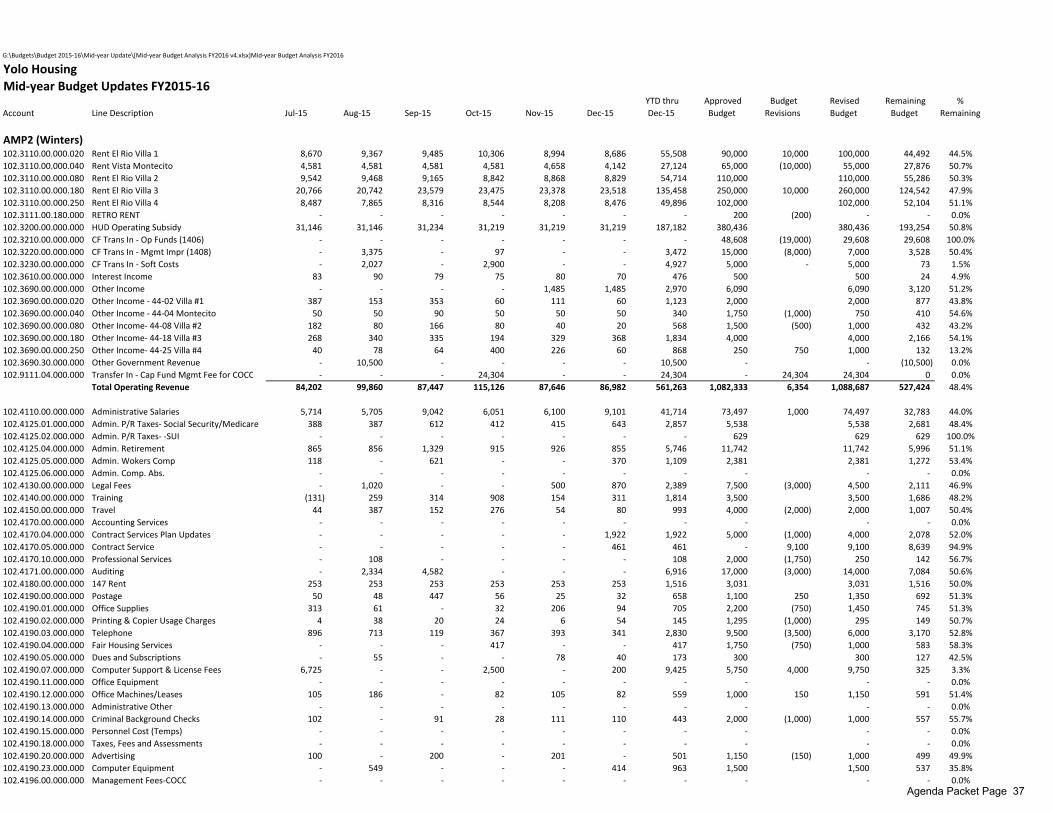
AMP2 (Winters)102.3110.00.000.020 Rent El Rio Villa 1 8,670 9,367 9,485 10,306 8,994 8,686 55,508 90,000 10,000 100,000 44,492 44.5%102.3110.00.000.040 Rent Vista Montecito 4,581 4,581 4,581 4,581 4,658 4,142 27,124 65,000 (10,000) 55,000 27,876 50.7%102.3110.00.000.080 Rent El Rio Villa 2 9,542 9,468 9,165 8,842 8,868 8,829 54,714 110,000 110,000 55,286 50.3%102.3110.00.000.180 Rent El Rio Villa 3 20,766 20,742 23,579 23,475 23,378 23,518 135,458 250,000 10,000 260,000 124,542 47.9%102.3110.00.000.250 Rent El Rio Villa 4 8,487 7,865 8,316 8,544 8,208 8,476 49,896 102,000 102,000 52,104 51.1%102.3111.00.180.000 RETRO RENT ‐ ‐ ‐ ‐ ‐ ‐ ‐ 200 (200) ‐ ‐ 0.0%102.3200.00.000.000 HUD Operating Subsidy 31,146 31,146 31,234 31,219 31,219 31,219 187,182 380,436 380,436 193,254 50.8%102.3210.00.000.000 CF Trans In ‐ Op Funds (1406) ‐ ‐ ‐ ‐ ‐ ‐ ‐ 48,608 (19,000) 29,608 29,608 100.0%102.3220.00.000.000 CF Trans In ‐ Mgmt Impr (1408) ‐ 3,375 ‐ 97 ‐ ‐ 3,472 15,000 (8,000) 7,000 3,528 50.4%102.3230.00.000.000 CF Trans In ‐ Soft Costs ‐ 2,027 ‐ 2,900 ‐ ‐ 4,927 5,000 ‐ 5,000 73 1.5%102.3610.00.000.000 Interest Income 83 90 79 75 80 70 476 500 500 24 4.9%102.3690.00.000.000 Other Income ‐ ‐ ‐ ‐ 1,485 1,485 2,970 6,090 6,090 3,120 51.2%102.3690.00.000.020 Other Income ‐ 44‐02 Villa #1 387 153 353 60 111 60 1,123 2,000 2,000 877 43.8%102.3690.00.000.040 Other Income ‐ 44‐04 Montecito 50 50 90 50 50 50 340 1,750 (1,000) 750 410 54.6%102.3690.00.000.080 Other Income‐ 44‐08 Villa #2 182 80 166 80 40 20 568 1,500 (500) 1,000 432 43.2%102.3690.00.000.180 Other Income‐ 44‐18 Villa #3 268 340 335 194 329 368 1,834 4,000 4,000 2,166 54.1%102.3690.00.000.250 Other Income‐ 44‐25 Villa #4 40 78 64 400 226 60 868 250 750 1,000 132 13.2%102.3690.30.000.000 Other Government Revenue ‐ 10,500 ‐ ‐ ‐ ‐ 10,500 ‐ ‐ (10,500) 0.0%102.9111.04.000.000 Transfer In ‐ Cap Fund Mgmt Fee for COCC ‐ ‐ ‐ 24,304 ‐ ‐ 24,304 ‐ 24,304 24,304 0 0.0%
Total Operating Revenue 84,202 99,860 87,447 115,126 87,646 86,982 561,263 1,082,333 6,354 1,088,687 527,424 48.4%
102.4110.00.000.000 Administrative Salaries 5,714 5,705 9,042 6,051 6,100 9,101 41,714 73,497 1,000 74,497 32,783 44.0%102.4125.01.000.000 Admin. P/R Taxes‐ Social Security/Medicare 388 387 612 412 415 643 2,857 5,538 5,538 2,681 48.4%102.4125.02.000.000 Admin. P/R Taxes‐ ‐SUI ‐ ‐ ‐ ‐ ‐ ‐ ‐ 629 629 629 100.0%102.4125.04.000.000 Admin. Retirement 865 856 1,329 915 926 855 5,746 11,742 11,742 5,996 51.1%102.4125.05.000.000 Admin. Wokers Comp 118 ‐ 621 ‐ ‐ 370 1,109 2,381 2,381 1,272 53.4%102.4125.06.000.000 Admin. Comp. Abs. ‐ ‐ ‐ ‐ ‐ ‐ ‐ ‐ ‐ ‐ 0.0%102.4130.00.000.000 Legal Fees ‐ 1,020 ‐ ‐ 500 870 2,389 7,500 (3,000) 4,500 2,111 46.9%102.4140.00.000.000 Training (131) 259 314 908 154 311 1,814 3,500 3,500 1,686 48.2%102.4150.00.000.000 Travel 44 387 152 276 54 80 993 4,000 (2,000) 2,000 1,007 50.4%102.4170.00.000.000 Accounting Services ‐ ‐ ‐ ‐ ‐ ‐ ‐ ‐ ‐ ‐ 0.0%102.4170.04.000.000 Contract Services Plan Updates ‐ ‐ ‐ ‐ ‐ 1,922 1,922 5,000 (1,000) 4,000 2,078 52.0%102.4170.05.000.000 Contract Service ‐ ‐ ‐ ‐ ‐ 461 461 ‐ 9,100 9,100 8,639 94.9%102.4170.10.000.000 Professional Services ‐ 108 ‐ ‐ ‐ ‐ 108 2,000 (1,750) 250 142 56.7%102.4171.00.000.000 Auditing ‐ 2,334 4,582 ‐ ‐ ‐ 6,916 17,000 (3,000) 14,000 7,084 50.6%102.4180.00.000.000 147 Rent 253 253 253 253 253 253 1,516 3,031 3,031 1,516 50.0%102.4190.00.000.000 Postage 50 48 447 56 25 32 658 1,100 250 1,350 692 51.3%102.4190.01.000.000 Office Supplies 313 61 ‐ 32 206 94 705 2,200 (750) 1,450 745 51.3%102.4190.02.000.000 Printing & Copier Usage Charges 4 38 20 24 6 54 145 1,295 (1,000) 295 149 50.7%102.4190.03.000.000 Telephone 896 713 119 367 393 341 2,830 9,500 (3,500) 6,000 3,170 52.8%102.4190.04.000.000 Fair Housing Services ‐ ‐ ‐ 417 ‐ ‐ 417 1,750 (750) 1,000 583 58.3%102.4190.05.000.000 Dues and Subscriptions ‐ 55 ‐ ‐ 78 40 173 300 300 127 42.5%102.4190.07.000.000 Computer Support & License Fees 6,725 ‐ ‐ 2,500 ‐ 200 9,425 5,750 4,000 9,750 325 3.3%102.4190.11.000.000 Office Equipment ‐ ‐ ‐ ‐ ‐ ‐ ‐ ‐ ‐ ‐ 0.0%102.4190.12.000.000 Office Machines/Leases 105 186 ‐ 82 105 82 559 1,000 150 1,150 591 51.4%102.4190.13.000.000 Administrative Other ‐ ‐ ‐ ‐ ‐ ‐ ‐ ‐ ‐ ‐ 0.0%102.4190.14.000.000 Criminal Background Checks 102 ‐ 91 28 111 110 443 2,000 (1,000) 1,000 557 55.7%102.4190.15.000.000 Personnel Cost (Temps) ‐ ‐ ‐ ‐ ‐ ‐ ‐ ‐ ‐ ‐ 0.0%102.4190.18.000.000 Taxes, Fees and Assessments ‐ ‐ ‐ ‐ ‐ ‐ ‐ ‐ ‐ ‐ 0.0%102.4190.20.000.000 Advertising 100 ‐ 200 ‐ 201 ‐ 501 1,150 (150) 1,000 499 49.9%102.4190.23.000.000 Computer Equipment ‐ 549 ‐ ‐ ‐ 414 963 1,500 1,500 537 35.8%102.4196.00.000.000 Management Fees‐COCC ‐ ‐ ‐ ‐ ‐ ‐ ‐ ‐ ‐ ‐ 0.0%
Agenda Packet Page 37
G:\Budgets\Budget 2015‐16\Mid‐year Update\[Mid‐year Budget Analysis FY2016 v4.xlsx]Mid‐year Budget Analysis FY2016
Yolo HousingMid‐year Budget Updates FY2015‐16
Account Line Description Jul‐15 Aug‐15 Sep‐15 Oct‐15 Nov‐15 Dec‐15 YTD thru Dec‐15
Approved Budget
Budget Revisions
Revised Budget
Remaining Budget
% Remaining
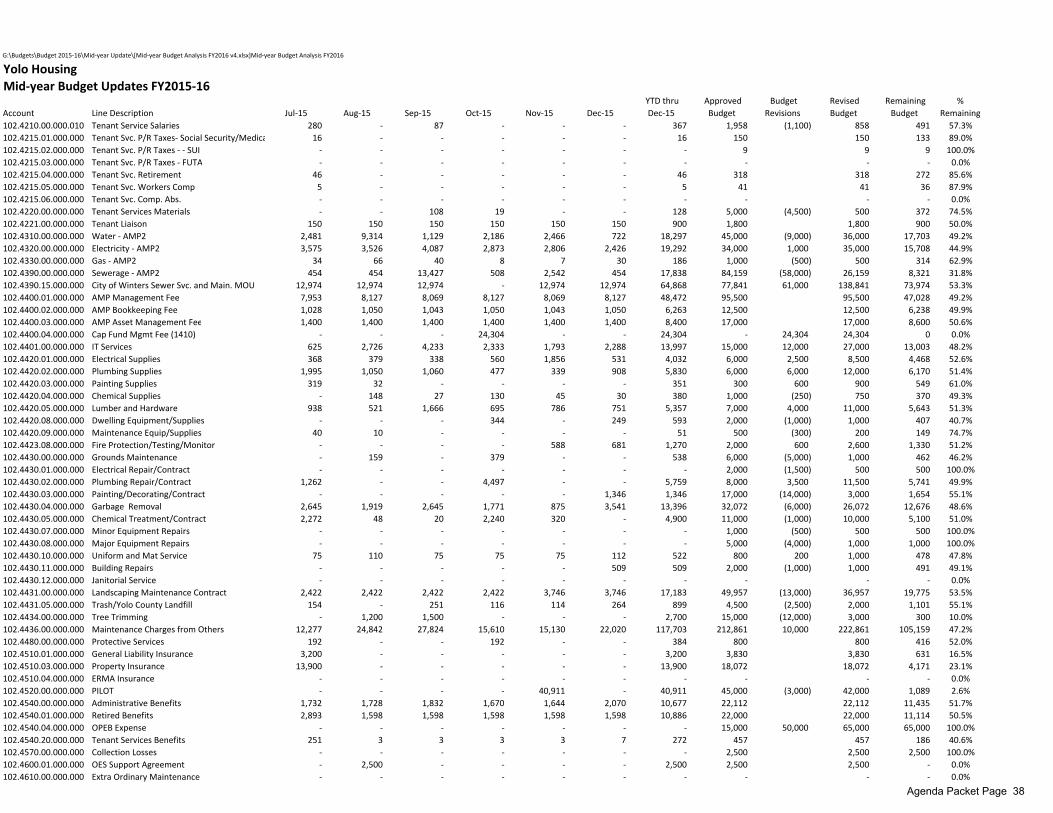
102.4210.00.000.010 Tenant Service Salaries 280 ‐ 87 ‐ ‐ ‐ 367 1,958 (1,100) 858 491 57.3%102.4215.01.000.000 Tenant Svc. P/R Taxes‐ Social Security/Medica 16 ‐ ‐ ‐ ‐ ‐ 16 150 150 133 89.0%102.4215.02.000.000 Tenant Svc. P/R Taxes ‐ ‐ SUI ‐ ‐ ‐ ‐ ‐ ‐ ‐ 9 9 9 100.0%102.4215.03.000.000 Tenant Svc. P/R Taxes ‐ FUTA ‐ ‐ ‐ ‐ ‐ ‐ ‐ ‐ ‐ ‐ 0.0%102.4215.04.000.000 Tenant Svc. Retirement 46 ‐ ‐ ‐ ‐ ‐ 46 318 318 272 85.6%102.4215.05.000.000 Tenant Svc. Workers Comp 5 ‐ ‐ ‐ ‐ ‐ 5 41 41 36 87.9%102.4215.06.000.000 Tenant Svc. Comp. Abs. ‐ ‐ ‐ ‐ ‐ ‐ ‐ ‐ ‐ ‐ 0.0%102.4220.00.000.000 Tenant Services Materials ‐ ‐ 108 19 ‐ ‐ 128 5,000 (4,500) 500 372 74.5%102.4221.00.000.000 Tenant Liaison 150 150 150 150 150 150 900 1,800 1,800 900 50.0%102.4310.00.000.000 Water ‐ AMP2 2,481 9,314 1,129 2,186 2,466 722 18,297 45,000 (9,000) 36,000 17,703 49.2%102.4320.00.000.000 Electricity ‐ AMP2 3,575 3,526 4,087 2,873 2,806 2,426 19,292 34,000 1,000 35,000 15,708 44.9%102.4330.00.000.000 Gas ‐ AMP2 34 66 40 8 7 30 186 1,000 (500) 500 314 62.9%102.4390.00.000.000 Sewerage ‐ AMP2 454 454 13,427 508 2,542 454 17,838 84,159 (58,000) 26,159 8,321 31.8%102.4390.15.000.000 City of Winters Sewer Svc. and Main. MOU 12,974 12,974 12,974 ‐ 12,974 12,974 64,868 77,841 61,000 138,841 73,974 53.3%102.4400.01.000.000 AMP Management Fee 7,953 8,127 8,069 8,127 8,069 8,127 48,472 95,500 95,500 47,028 49.2%102.4400.02.000.000 AMP Bookkeeping Fee 1,028 1,050 1,043 1,050 1,043 1,050 6,263 12,500 12,500 6,238 49.9%102.4400.03.000.000 AMP Asset Management Fee 1,400 1,400 1,400 1,400 1,400 1,400 8,400 17,000 17,000 8,600 50.6%102.4400.04.000.000 Cap Fund Mgmt Fee (1410) ‐ ‐ ‐ 24,304 ‐ ‐ 24,304 ‐ 24,304 24,304 0 0.0%102.4401.00.000.000 IT Services 625 2,726 4,233 2,333 1,793 2,288 13,997 15,000 12,000 27,000 13,003 48.2%102.4420.01.000.000 Electrical Supplies 368 379 338 560 1,856 531 4,032 6,000 2,500 8,500 4,468 52.6%102.4420.02.000.000 Plumbing Supplies 1,995 1,050 1,060 477 339 908 5,830 6,000 6,000 12,000 6,170 51.4%102.4420.03.000.000 Painting Supplies 319 32 ‐ ‐ ‐ ‐ 351 300 600 900 549 61.0%102.4420.04.000.000 Chemical Supplies ‐ 148 27 130 45 30 380 1,000 (250) 750 370 49.3%102.4420.05.000.000 Lumber and Hardware 938 521 1,666 695 786 751 5,357 7,000 4,000 11,000 5,643 51.3%102.4420.08.000.000 Dwelling Equipment/Supplies ‐ ‐ ‐ 344 ‐ 249 593 2,000 (1,000) 1,000 407 40.7%102.4420.09.000.000 Maintenance Equip/Supplies 40 10 ‐ ‐ ‐ ‐ 51 500 (300) 200 149 74.7%102.4423.08.000.000 Fire Protection/Testing/Monitor ‐ ‐ ‐ ‐ 588 681 1,270 2,000 600 2,600 1,330 51.2%102.4430.00.000.000 Grounds Maintenance ‐ 159 ‐ 379 ‐ ‐ 538 6,000 (5,000) 1,000 462 46.2%102.4430.01.000.000 Electrical Repair/Contract ‐ ‐ ‐ ‐ ‐ ‐ ‐ 2,000 (1,500) 500 500 100.0%102.4430.02.000.000 Plumbing Repair/Contract 1,262 ‐ ‐ 4,497 ‐ ‐ 5,759 8,000 3,500 11,500 5,741 49.9%102.4430.03.000.000 Painting/Decorating/Contract ‐ ‐ ‐ ‐ ‐ 1,346 1,346 17,000 (14,000) 3,000 1,654 55.1%102.4430.04.000.000 Garbage Removal 2,645 1,919 2,645 1,771 875 3,541 13,396 32,072 (6,000) 26,072 12,676 48.6%102.4430.05.000.000 Chemical Treatment/Contract 2,272 48 20 2,240 320 ‐ 4,900 11,000 (1,000) 10,000 5,100 51.0%102.4430.07.000.000 Minor Equipment Repairs ‐ ‐ ‐ ‐ ‐ ‐ ‐ 1,000 (500) 500 500 100.0%102.4430.08.000.000 Major Equipment Repairs ‐ ‐ ‐ ‐ ‐ ‐ ‐ 5,000 (4,000) 1,000 1,000 100.0%102.4430.10.000.000 Uniform and Mat Service 75 110 75 75 75 112 522 800 200 1,000 478 47.8%102.4430.11.000.000 Building Repairs ‐ ‐ ‐ ‐ ‐ 509 509 2,000 (1,000) 1,000 491 49.1%102.4430.12.000.000 Janitorial Service ‐ ‐ ‐ ‐ ‐ ‐ ‐ ‐ ‐ ‐ 0.0%102.4431.00.000.000 Landscaping Maintenance Contract 2,422 2,422 2,422 2,422 3,746 3,746 17,183 49,957 (13,000) 36,957 19,775 53.5%102.4431.05.000.000 Trash/Yolo County Landfill 154 ‐ 251 116 114 264 899 4,500 (2,500) 2,000 1,101 55.1%102.4434.00.000.000 Tree Trimming ‐ 1,200 1,500 ‐ ‐ ‐ 2,700 15,000 (12,000) 3,000 300 10.0%102.4436.00.000.000 Maintenance Charges from Others 12,277 24,842 27,824 15,610 15,130 22,020 117,703 212,861 10,000 222,861 105,159 47.2%102.4480.00.000.000 Protective Services 192 ‐ ‐ 192 ‐ ‐ 384 800 800 416 52.0%102.4510.01.000.000 General Liability Insurance 3,200 ‐ ‐ ‐ ‐ ‐ 3,200 3,830 3,830 631 16.5%102.4510.03.000.000 Property Insurance 13,900 ‐ ‐ ‐ ‐ ‐ 13,900 18,072 18,072 4,171 23.1%102.4510.04.000.000 ERMA Insurance ‐ ‐ ‐ ‐ ‐ ‐ ‐ ‐ ‐ ‐ 0.0%102.4520.00.000.000 PILOT ‐ ‐ ‐ ‐ 40,911 ‐ 40,911 45,000 (3,000) 42,000 1,089 2.6%102.4540.00.000.000 Administrative Benefits 1,732 1,728 1,832 1,670 1,644 2,070 10,677 22,112 22,112 11,435 51.7%102.4540.01.000.000 Retired Benefits 2,893 1,598 1,598 1,598 1,598 1,598 10,886 22,000 22,000 11,114 50.5%102.4540.04.000.000 OPEB Expense ‐ ‐ ‐ ‐ ‐ ‐ ‐ 15,000 50,000 65,000 65,000 100.0%102.4540.20.000.000 Tenant Services Benefits 251 3 3 3 3 7 272 457 457 186 40.6%102.4570.00.000.000 Collection Losses ‐ ‐ ‐ ‐ ‐ ‐ ‐ 2,500 2,500 2,500 100.0%102.4600.01.000.000 OES Support Agreement ‐ 2,500 ‐ ‐ ‐ ‐ 2,500 2,500 2,500 ‐ 0.0%102.4610.00.000.000 Extra Ordinary Maintenance ‐ ‐ ‐ ‐ ‐ ‐ ‐ ‐ ‐ ‐ 0.0%
Agenda Packet Page 38
G:\Budgets\Budget 2015‐16\Mid‐year Update\[Mid‐year Budget Analysis FY2016 v4.xlsx]Mid‐year Budget Analysis FY2016
Yolo HousingMid‐year Budget Updates FY2015‐16
Account Line Description Jul‐15 Aug‐15 Sep‐15 Oct‐15 Nov‐15 Dec‐15 YTD thru Dec‐15
Approved Budget
Budget Revisions
Revised Budget
Remaining Budget
% Remaining
102.4800.00.000.000 Depreciation expense ‐ ‐ ‐ ‐ ‐ ‐ ‐ ‐ ‐ ‐ 0.0%Total Operating Expenses 93,501 91,414 105,790 88,059 110,806 84,215 573,785 1,078,900 34,154 1,113,054 539,269 48.4%Net Operating Income/(Loss) (9,299) 8,446 (18,343) 27,067 (23,160) 2,767 (12,522) 3,434 (27,800) (24,366) (11,845)
102.9110.00.000.000 Transfers In ‐ Hard Costs ‐ ‐ ‐ ‐ ‐ ‐ ‐ ‐ 50,000 50,000 50,000 100.0%Net Increase/(Decrease) In Fund Balance (9,299) 8,446 (18,343) 27,067 (23,160) 2,767 (12,522) 3,434 22,200 25,634 38,155
Agenda Packet Page 39
G:\Budgets\Budget 2015‐16\Mid‐year Update\[Mid‐year Budget Analysis FY2016 v4.xlsx]Mid‐year Budget Analysis FY2016
Yolo HousingMid‐year Budget Updates FY2015‐16
Account Line Description Jul‐15 Aug‐15 Sep‐15 Oct‐15 Nov‐15 Dec‐15 YTD thru Dec‐15
Approved Budget
Budget Revisions
Revised Budget
Remaining Budget
% Remaining
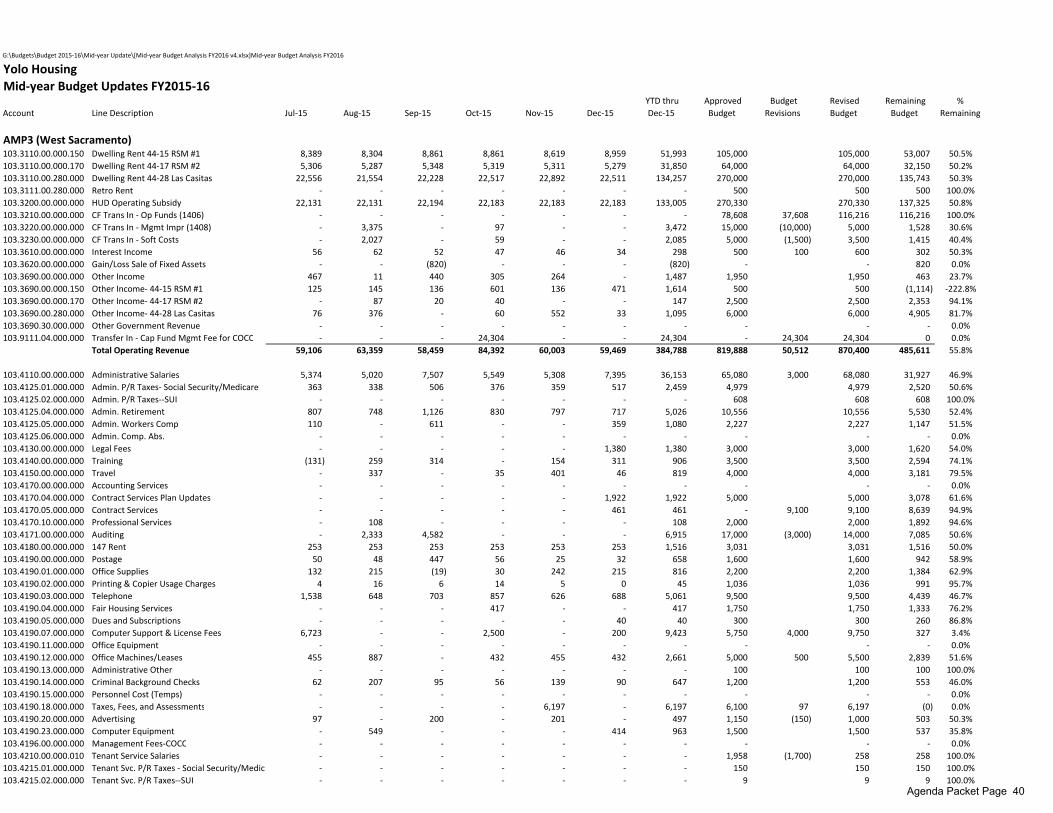
AMP3 (West Sacramento)103.3110.00.000.150 Dwelling Rent 44‐15 RSM #1 8,389 8,304 8,861 8,861 8,619 8,959 51,993 105,000 105,000 53,007 50.5%103.3110.00.000.170 Dwelling Rent 44‐17 RSM #2 5,306 5,287 5,348 5,319 5,311 5,279 31,850 64,000 64,000 32,150 50.2%103.3110.00.280.000 Dwelling Rent 44‐28 Las Casitas 22,556 21,554 22,228 22,517 22,892 22,511 134,257 270,000 270,000 135,743 50.3%103.3111.00.280.000 Retro Rent ‐ ‐ ‐ ‐ ‐ ‐ ‐ 500 500 500 100.0%103.3200.00.000.000 HUD Operating Subsidy 22,131 22,131 22,194 22,183 22,183 22,183 133,005 270,330 270,330 137,325 50.8%103.3210.00.000.000 CF Trans In ‐ Op Funds (1406) ‐ ‐ ‐ ‐ ‐ ‐ ‐ 78,608 37,608 116,216 116,216 100.0%103.3220.00.000.000 CF Trans In ‐ Mgmt Impr (1408) ‐ 3,375 ‐ 97 ‐ ‐ 3,472 15,000 (10,000) 5,000 1,528 30.6%103.3230.00.000.000 CF Trans In ‐ Soft Costs ‐ 2,027 ‐ 59 ‐ ‐ 2,085 5,000 (1,500) 3,500 1,415 40.4%103.3610.00.000.000 Interest Income 56 62 52 47 46 34 298 500 100 600 302 50.3%103.3620.00.000.000 Gain/Loss Sale of Fixed Assets ‐ ‐ (820) ‐ ‐ ‐ (820) ‐ ‐ 820 0.0%103.3690.00.000.000 Other Income 467 11 440 305 264 ‐ 1,487 1,950 1,950 463 23.7%103.3690.00.000.150 Other Income‐ 44‐15 RSM #1 125 145 136 601 136 471 1,614 500 500 (1,114) ‐222.8%103.3690.00.000.170 Other Income‐ 44‐17 RSM #2 ‐ 87 20 40 ‐ ‐ 147 2,500 2,500 2,353 94.1%103.3690.00.280.000 Other Income‐ 44‐28 Las Casitas 76 376 ‐ 60 552 33 1,095 6,000 6,000 4,905 81.7%103.3690.30.000.000 Other Government Revenue ‐ ‐ ‐ ‐ ‐ ‐ ‐ ‐ ‐ ‐ 0.0%103.9111.04.000.000 Transfer In ‐ Cap Fund Mgmt Fee for COCC ‐ ‐ ‐ 24,304 ‐ ‐ 24,304 ‐ 24,304 24,304 0 0.0%
Total Operating Revenue 59,106 63,359 58,459 84,392 60,003 59,469 384,788 819,888 50,512 870,400 485,611 55.8%
103.4110.00.000.000 Administrative Salaries 5,374 5,020 7,507 5,549 5,308 7,395 36,153 65,080 3,000 68,080 31,927 46.9%103.4125.01.000.000 Admin. P/R Taxes‐ Social Security/Medicare 363 338 506 376 359 517 2,459 4,979 4,979 2,520 50.6%103.4125.02.000.000 Admin. P/R Taxes‐‐SUI ‐ ‐ ‐ ‐ ‐ ‐ ‐ 608 608 608 100.0%103.4125.04.000.000 Admin. Retirement 807 748 1,126 830 797 717 5,026 10,556 10,556 5,530 52.4%103.4125.05.000.000 Admin. Workers Comp 110 ‐ 611 ‐ ‐ 359 1,080 2,227 2,227 1,147 51.5%103.4125.06.000.000 Admin. Comp. Abs. ‐ ‐ ‐ ‐ ‐ ‐ ‐ ‐ ‐ ‐ 0.0%103.4130.00.000.000 Legal Fees ‐ ‐ ‐ ‐ ‐ 1,380 1,380 3,000 3,000 1,620 54.0%103.4140.00.000.000 Training (131) 259 314 ‐ 154 311 906 3,500 3,500 2,594 74.1%103.4150.00.000.000 Travel ‐ 337 ‐ 35 401 46 819 4,000 4,000 3,181 79.5%103.4170.00.000.000 Accounting Services ‐ ‐ ‐ ‐ ‐ ‐ ‐ ‐ ‐ ‐ 0.0%103.4170.04.000.000 Contract Services Plan Updates ‐ ‐ ‐ ‐ ‐ 1,922 1,922 5,000 5,000 3,078 61.6%103.4170.05.000.000 Contract Services ‐ ‐ ‐ ‐ ‐ 461 461 ‐ 9,100 9,100 8,639 94.9%103.4170.10.000.000 Professional Services ‐ 108 ‐ ‐ ‐ ‐ 108 2,000 2,000 1,892 94.6%103.4171.00.000.000 Auditing ‐ 2,333 4,582 ‐ ‐ ‐ 6,915 17,000 (3,000) 14,000 7,085 50.6%103.4180.00.000.000 147 Rent 253 253 253 253 253 253 1,516 3,031 3,031 1,516 50.0%103.4190.00.000.000 Postage 50 48 447 56 25 32 658 1,600 1,600 942 58.9%103.4190.01.000.000 Office Supplies 132 215 (19) 30 242 215 816 2,200 2,200 1,384 62.9%103.4190.02.000.000 Printing & Copier Usage Charges 4 16 6 14 5 0 45 1,036 1,036 991 95.7%103.4190.03.000.000 Telephone 1,538 648 703 857 626 688 5,061 9,500 9,500 4,439 46.7%103.4190.04.000.000 Fair Housing Services ‐ ‐ ‐ 417 ‐ ‐ 417 1,750 1,750 1,333 76.2%103.4190.05.000.000 Dues and Subscriptions ‐ ‐ ‐ ‐ ‐ 40 40 300 300 260 86.8%103.4190.07.000.000 Computer Support & License Fees 6,723 ‐ ‐ 2,500 ‐ 200 9,423 5,750 4,000 9,750 327 3.4%103.4190.11.000.000 Office Equipment ‐ ‐ ‐ ‐ ‐ ‐ ‐ ‐ ‐ ‐ 0.0%103.4190.12.000.000 Office Machines/Leases 455 887 ‐ 432 455 432 2,661 5,000 500 5,500 2,839 51.6%103.4190.13.000.000 Administrative Other ‐ ‐ ‐ ‐ ‐ ‐ ‐ 100 100 100 100.0%103.4190.14.000.000 Criminal Background Checks 62 207 95 56 139 90 647 1,200 1,200 553 46.0%103.4190.15.000.000 Personnel Cost (Temps) ‐ ‐ ‐ ‐ ‐ ‐ ‐ ‐ ‐ ‐ 0.0%103.4190.18.000.000 Taxes, Fees, and Assessments ‐ ‐ ‐ ‐ 6,197 ‐ 6,197 6,100 97 6,197 (0) 0.0%103.4190.20.000.000 Advertising 97 ‐ 200 ‐ 201 ‐ 497 1,150 (150) 1,000 503 50.3%103.4190.23.000.000 Computer Equipment ‐ 549 ‐ ‐ ‐ 414 963 1,500 1,500 537 35.8%103.4196.00.000.000 Management Fees‐COCC ‐ ‐ ‐ ‐ ‐ ‐ ‐ ‐ ‐ ‐ 0.0%103.4210.00.000.010 Tenant Service Salaries ‐ ‐ ‐ ‐ ‐ ‐ ‐ 1,958 (1,700) 258 258 100.0%103.4215.01.000.000 Tenant Svc. P/R Taxes ‐ Social Security/Medica ‐ ‐ ‐ ‐ ‐ ‐ ‐ 150 150 150 100.0%103.4215.02.000.000 Tenant Svc. P/R Taxes‐‐SUI ‐ ‐ ‐ ‐ ‐ ‐ ‐ 9 9 9 100.0%
Agenda Packet Page 40

G:\Budgets\Budget 2015‐16\Mid‐year Update\[Mid‐year Budget Analysis FY2016 v4.xlsx]Mid‐year Budget Analysis FY2016
Yolo HousingMid‐year Budget Updates FY2015‐16
Account Line Description Jul‐15 Aug‐15 Sep‐15 Oct‐15 Nov‐15 Dec‐15 YTD thru Dec‐15
Approved Budget
Budget Revisions
Revised Budget
Remaining Budget
% Remaining
103.4215.03.000.000 Tenant Svc. P/R Taxes ‐ FUTA ‐ ‐ ‐ ‐ ‐ ‐ ‐ ‐ ‐ ‐ 0.0%103.4215.04.000.000 Tenant Svc. Retirement ‐ ‐ ‐ ‐ ‐ ‐ ‐ 318 318 318 100.0%103.4215.05.000.000 Tenant Svc. Workers Comp ‐ ‐ ‐ ‐ ‐ ‐ ‐ 41 41 41 100.0%103.4215.06.000.000 Tenant Svc. Comp. Abs. ‐ ‐ ‐ ‐ ‐ ‐ ‐ ‐ ‐ ‐ 0.0%103.4220.00.000.000 Tenant Services Materials ‐ ‐ ‐ ‐ ‐ ‐ ‐ ‐ ‐ ‐ 0.0%103.4221.00.000.000 Tenant Liaison 150 150 150 150 150 250 1,000 1,800 403 2,203 1,203 54.6%103.4310.00.000.000 Water ‐ AMP3 2,480 2,346 4,840 2,734 2,213 1,965 16,579 40,000 (7,000) 33,000 16,421 49.8%103.4320.00.000.000 Electricity ‐ AMP3 2,540 2,420 1,863 1,929 2,219 2,690 13,660 35,000 (10,000) 25,000 11,340 45.4%103.4330.00.000.000 Gas ‐ AMP3 11 279 318 131 318 753 1,810 7,500 (2,500) 5,000 3,190 63.8%103.4390.00.000.000 Sewerage ‐ AMP3 3,720 4,137 4,137 4,137 4,137 4,137 24,403 47,000 3,000 50,000 25,597 51.2%103.4400.01.000.000 AMP Management Fee 7,721 7,779 7,953 7,895 7,837 8,011 47,195 95,000 95,000 47,805 50.3%103.4400.02.000.000 AMP Bookkeeping Fee 998 1,005 1,028 1,020 1,013 1,035 6,098 12,000 12,000 5,903 49.2%103.4400.03.000.000 AMP Asset Management Fee 1,390 1,390 1,390 1,390 1,390 1,390 8,340 16,000 16,000 7,660 47.9%103.4400.04.000.000 Cap Fund Mgmt Fee (1410) ‐ ‐ ‐ 24,304 ‐ ‐ 24,304 ‐ 24,304 24,304 0 0.0%103.4401.00.000.000 IT Services 1,000 2,728 4,421 3,583 3,791 2,663 18,186 15,000 8,000 23,000 4,814 20.9%103.4420.01.000.000 Electrical Supplies 802 389 248 11 1,123 274 2,847 3,000 2,000 5,000 2,153 43.1%103.4420.02.000.000 Plumbing Supplies 555 850 551 326 405 829 3,516 3,000 3,500 6,500 2,984 45.9%103.4420.03.000.000 Painting Supplies ‐ ‐ ‐ 104 ‐ 32 136 150 150 14 9.4%103.4420.04.000.000 Chemical Supplies 13 159 42 259 45 ‐ 517 1,300 (300) 1,000 483 48.3%103.4420.05.000.000 Lumber and Hardware 377 971 141 592 447 374 2,902 6,000 6,000 3,098 51.6%103.4420.08.000.000 Dwelling Equipment/Supplies 1,231 ‐ 7,034 496 807 249 9,816 10,500 5,000 15,500 5,684 36.7%103.4420.09.000.000 Maintenance Equip/Supplies 61 13 ‐ ‐ ‐ 46 120 1,700 (1,200) 500 380 75.9%103.4423.08.000.000 Fire Protection/Testing/Monitor 764 307 ‐ 1,982 588 1,778 5,420 3,300 4,500 7,800 2,380 30.5%103.4430.00.000.000 Grounds Maintenance 28 325 ‐ ‐ 240 ‐ 593 1,600 (250) 1,350 757 56.1%103.4430.01.000.000 Electrical Repair/Contract ‐ ‐ ‐ ‐ ‐ 240 240 1,000 (500) 500 260 52.0%103.4430.02.000.000 Plumbing Repair/Contract 102 793 ‐ ‐ ‐ ‐ 894 2,500 (500) 2,000 1,106 55.3%103.4430.03.000.000 Painting/Decorating/Contract 3,540 765 ‐ ‐ ‐ ‐ 4,305 14,000 (4,500) 9,500 5,195 54.7%103.4430.04.000.000 Garbage Removal 2,917 3,085 3,334 3,275 3,063 3,063 18,738 35,006 35,006 16,269 46.5%103.4430.05.000.000 Chemical Treatment/Contract 2,358 106 257 2,489 180 141 5,531 11,000 11,000 5,469 49.7%103.4430.07.000.000 Minor Equipment Repairs ‐ 115 ‐ ‐ ‐ ‐ 115 1,200 (1,000) 200 85 42.6%103.4430.08.000.000 Major Equip Repair / Maint ‐ ‐ ‐ ‐ ‐ ‐ ‐ 4,000 3,000 7,000 7,000 100.0%103.4430.10.000.000 Uniform and Mat Service 36 36 71 ‐ 107 107 355 800 800 445 55.6%103.4430.11.000.000 Building Repairs 130 135 583 1,855 1,203 ‐ 3,906 4,000 2,000 6,000 2,094 34.9%103.4430.12.000.000 Janitorial Service ‐ ‐ ‐ ‐ ‐ ‐ ‐ ‐ ‐ ‐ 0.0%103.4431.00.000.000 Landscape Maintenance Contract 1,919 1,919 1,919 1,919 2,929 2,929 13,536 40,153 (13,000) 27,153 13,616 50.1%103.4431.05.000.000 Trash/Yolo County Landfill 55 ‐ 116 44 20 26 261 500 500 239 47.7%103.4434.00.000.000 Tree Trimming 375 3,680 ‐ ‐ ‐ ‐ 4,055 15,000 (10,000) 5,000 945 18.9%103.4435.00.000.000 Resident Watering Contracts ‐ ‐ ‐ ‐ ‐ ‐ ‐ ‐ ‐ ‐ 0.0%103.4436.00.000.000 Maintenance Charges from Others 15,259 7,723 15,195 10,110 13,695 8,444 70,426 65,000 60,000 125,000 54,574 43.7%103.4480.00.000.000 Protective Services 290 ‐ ‐ 290 ‐ ‐ 579 2,500 (1,500) 1,000 421 42.1%103.4510.00.000.000 Flood Insurance ‐ ‐ 31,583 ‐ ‐ ‐ 31,583 49,194 49,194 17,611 35.8%103.4510.01.000.000 General Liability Insurance 3,424 ‐ ‐ ‐ ‐ ‐ 3,424 3,657 3,657 233 6.4%103.4510.03.000.000 Property Insurance 13,162 ‐ ‐ ‐ ‐ ‐ 13,162 15,668 15,668 2,506 16.0%103.4520.00.000.000 PILOT ‐ ‐ ‐ ‐ 33,452 ‐ 33,452 40,000 (5,000) 35,000 1,548 4.4%103.4540.00.000.000 Admin Benefits 1,812 1,737 1,600 1,688 1,644 2,051 10,533 21,982 (1,000) 20,982 10,449 49.8%103.4540.01.000.000 Retired Benefits 598 598 598 598 598 598 3,591 9,000 (2,000) 7,000 3,409 48.7%103.4540.04.000.000 OPEB Expense ‐ ‐ ‐ ‐ ‐ ‐ ‐ ‐ ‐ ‐ ‐ 0.0%103.4540.20.000.000 Tenant Service Benefits 3 3 3 3 3 7 24 457 (300) 157 133 84.9%103.4570.00.000.000 Collection Losses ‐ ‐ ‐ ‐ ‐ ‐ ‐ 2,500 2,500 2,500 100.0%103.4600.01.000.000 OES Support Agreement ‐ 2,500 ‐ ‐ ‐ ‐ 2,500 2,500 2,500 ‐ 0.0%103.4610.00.000.000 Extra Ordinary Maintenance ‐ ‐ ‐ ‐ ‐ ‐ ‐ ‐ ‐ ‐ 0.0%103.4800.00.000.000 Depreciation Expense ‐ ‐ ‐ ‐ ‐ ‐ ‐ ‐ ‐ ‐ 0.0%
Total Operating Expenses 85,658 60,408 105,705 84,718 98,781 59,552 494,822 802,110 67,004 869,114 374,291 43.1%Net Operating Income/(Loss) (26,553) 2,951 (47,246) (326) (38,778) (83) (110,034) 17,778 (16,492) 1,286 111,320
Agenda Packet Page 41
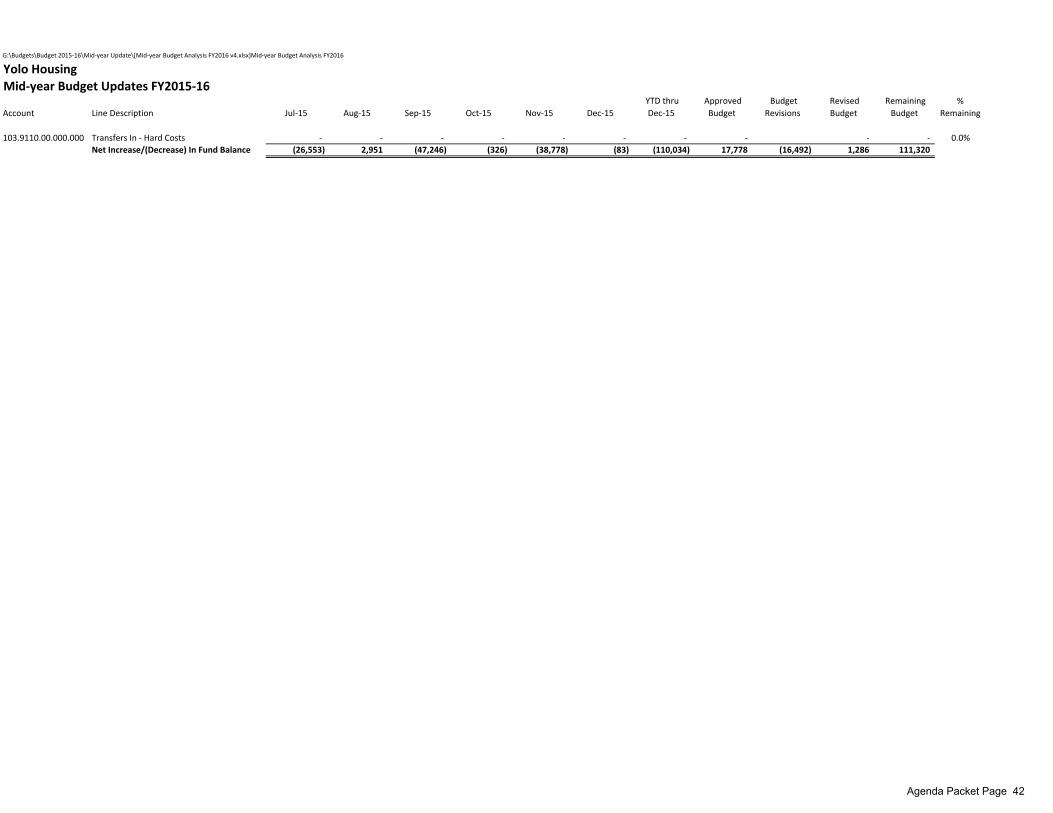
G:\Budgets\Budget 2015‐16\Mid‐year Update\[Mid‐year Budget Analysis FY2016 v4.xlsx]Mid‐year Budget Analysis FY2016
Yolo HousingMid‐year Budget Updates FY2015‐16
Account Line Description Jul‐15 Aug‐15 Sep‐15 Oct‐15 Nov‐15 Dec‐15 YTD thru Dec‐15
Approved Budget
Budget Revisions
Revised Budget
Remaining Budget
% Remaining
103.9110.00.000.000 Transfers In ‐ Hard Costs ‐ ‐ ‐ ‐ ‐ ‐ ‐ ‐ ‐ ‐ 0.0%Net Increase/(Decrease) In Fund Balance (26,553) 2,951 (47,246) (326) (38,778) (83) (110,034) 17,778 (16,492) 1,286 111,320
Agenda Packet Page 42
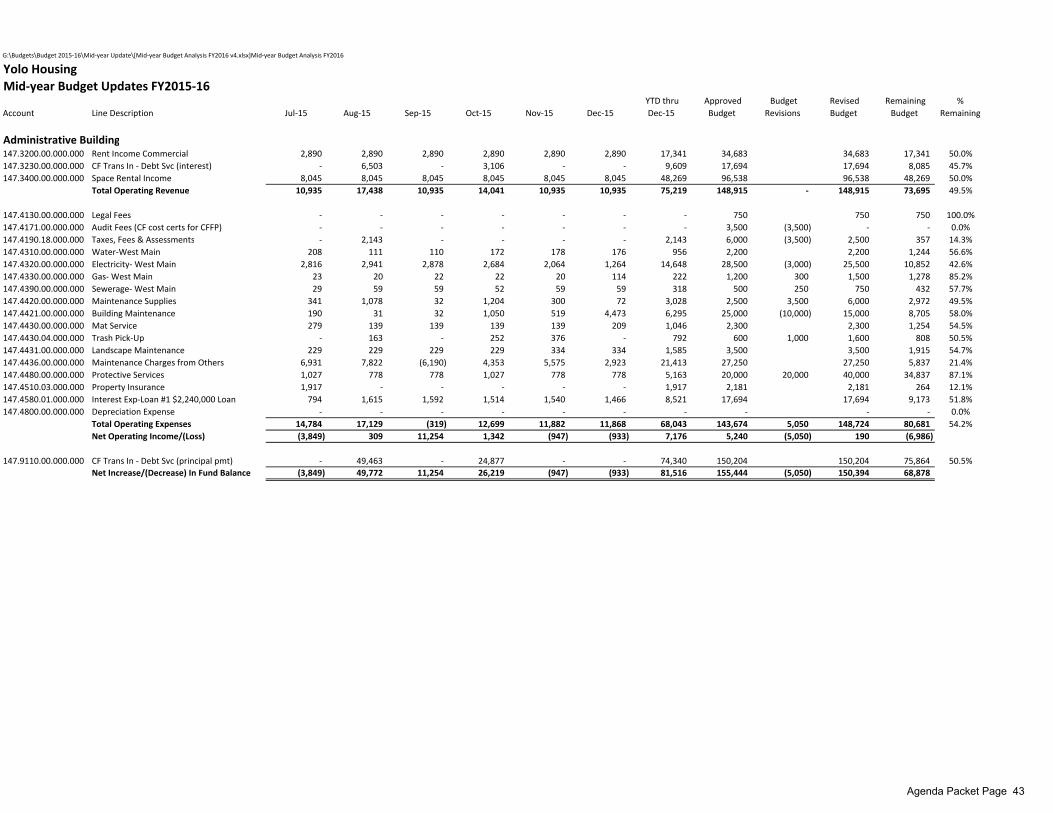
G:\Budgets\Budget 2015‐16\Mid‐year Update\[Mid‐year Budget Analysis FY2016 v4.xlsx]Mid‐year Budget Analysis FY2016
Yolo HousingMid‐year Budget Updates FY2015‐16
Account Line Description Jul‐15 Aug‐15 Sep‐15 Oct‐15 Nov‐15 Dec‐15 YTD thru Dec‐15
Approved Budget
Budget Revisions
Revised Budget
Remaining Budget
% Remaining
Administrative Building147.3200.00.000.000 Rent Income Commercial 2,890 2,890 2,890 2,890 2,890 2,890 17,341 34,683 34,683 17,341 50.0%147.3230.00.000.000 CF Trans In ‐ Debt Svc (interest) ‐ 6,503 ‐ 3,106 ‐ ‐ 9,609 17,694 17,694 8,085 45.7%147.3400.00.000.000 Space Rental Income 8,045 8,045 8,045 8,045 8,045 8,045 48,269 96,538 96,538 48,269 50.0%
Total Operating Revenue 10,935 17,438 10,935 14,041 10,935 10,935 75,219 148,915 ‐ 148,915 73,695 49.5%
147.4130.00.000.000 Legal Fees ‐ ‐ ‐ ‐ ‐ ‐ ‐ 750 750 750 100.0%147.4171.00.000.000 Audit Fees (CF cost certs for CFFP) ‐ ‐ ‐ ‐ ‐ ‐ ‐ 3,500 (3,500) ‐ ‐ 0.0%147.4190.18.000.000 Taxes, Fees & Assessments ‐ 2,143 ‐ ‐ ‐ ‐ 2,143 6,000 (3,500) 2,500 357 14.3%147.4310.00.000.000 Water‐West Main 208 111 110 172 178 176 956 2,200 2,200 1,244 56.6%147.4320.00.000.000 Electricity‐ West Main 2,816 2,941 2,878 2,684 2,064 1,264 14,648 28,500 (3,000) 25,500 10,852 42.6%147.4330.00.000.000 Gas‐ West Main 23 20 22 22 20 114 222 1,200 300 1,500 1,278 85.2%147.4390.00.000.000 Sewerage‐ West Main 29 59 59 52 59 59 318 500 250 750 432 57.7%147.4420.00.000.000 Maintenance Supplies 341 1,078 32 1,204 300 72 3,028 2,500 3,500 6,000 2,972 49.5%147.4421.00.000.000 Building Maintenance 190 31 32 1,050 519 4,473 6,295 25,000 (10,000) 15,000 8,705 58.0%147.4430.00.000.000 Mat Service 279 139 139 139 139 209 1,046 2,300 2,300 1,254 54.5%147.4430.04.000.000 Trash Pick‐Up ‐ 163 ‐ 252 376 ‐ 792 600 1,000 1,600 808 50.5%147.4431.00.000.000 Landscape Maintenance 229 229 229 229 334 334 1,585 3,500 3,500 1,915 54.7%147.4436.00.000.000 Maintenance Charges from Others 6,931 7,822 (6,190) 4,353 5,575 2,923 21,413 27,250 27,250 5,837 21.4%147.4480.00.000.000 Protective Services 1,027 778 778 1,027 778 778 5,163 20,000 20,000 40,000 34,837 87.1%147.4510.03.000.000 Property Insurance 1,917 ‐ ‐ ‐ ‐ ‐ 1,917 2,181 2,181 264 12.1%147.4580.01.000.000 Interest Exp‐Loan #1 $2,240,000 Loan 794 1,615 1,592 1,514 1,540 1,466 8,521 17,694 17,694 9,173 51.8%147.4800.00.000.000 Depreciation Expense ‐ ‐ ‐ ‐ ‐ ‐ ‐ ‐ ‐ ‐ 0.0%
Total Operating Expenses 14,784 17,129 (319) 12,699 11,882 11,868 68,043 143,674 5,050 148,724 80,681 54.2%Net Operating Income/(Loss) (3,849) 309 11,254 1,342 (947) (933) 7,176 5,240 (5,050) 190 (6,986)
147.9110.00.000.000 CF Trans In ‐ Debt Svc (principal pmt) ‐ 49,463 ‐ 24,877 ‐ ‐ 74,340 150,204 150,204 75,864 50.5%Net Increase/(Decrease) In Fund Balance (3,849) 49,772 11,254 26,219 (947) (933) 81,516 155,444 (5,050) 150,394 68,878
Agenda Packet Page 43
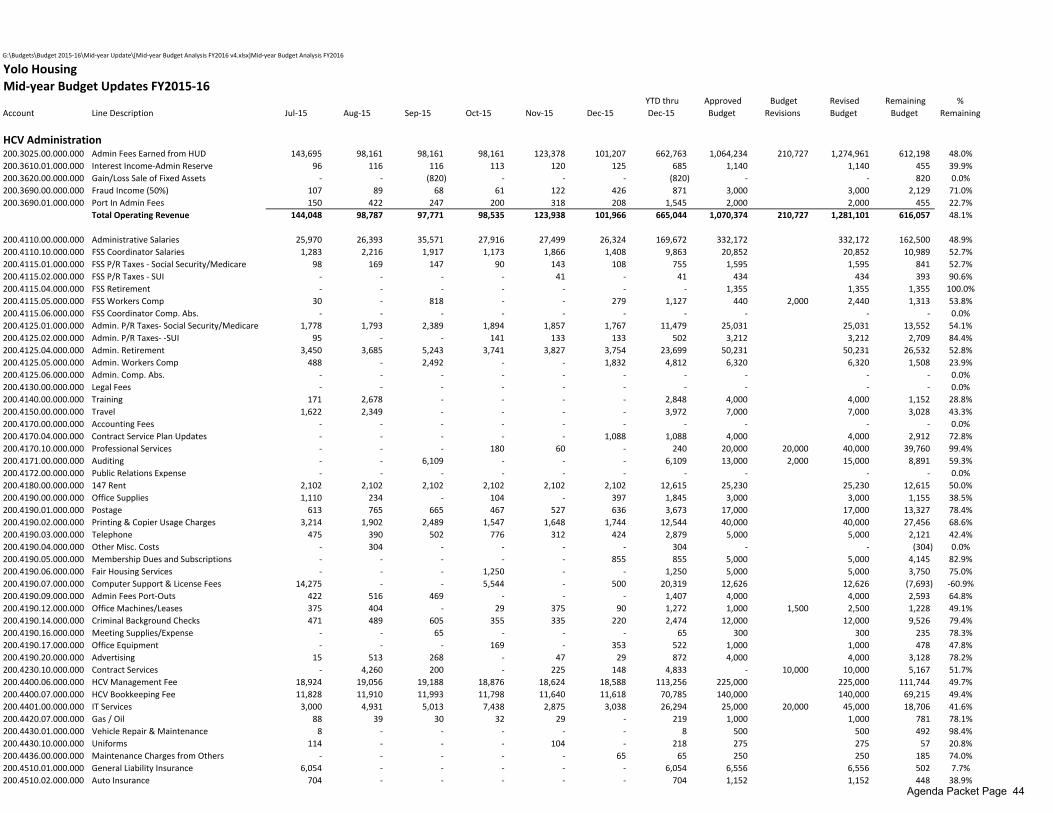
G:\Budgets\Budget 2015‐16\Mid‐year Update\[Mid‐year Budget Analysis FY2016 v4.xlsx]Mid‐year Budget Analysis FY2016
Yolo HousingMid‐year Budget Updates FY2015‐16
Account Line Description Jul‐15 Aug‐15 Sep‐15 Oct‐15 Nov‐15 Dec‐15 YTD thru Dec‐15
Approved Budget
Budget Revisions
Revised Budget
Remaining Budget
% Remaining
HCV Administration200.3025.00.000.000 Admin Fees Earned from HUD 143,695 98,161 98,161 98,161 123,378 101,207 662,763 1,064,234 210,727 1,274,961 612,198 48.0%200.3610.01.000.000 Interest Income‐Admin Reserve 96 116 116 113 120 125 685 1,140 1,140 455 39.9%200.3620.00.000.000 Gain/Loss Sale of Fixed Assets ‐ ‐ (820) ‐ ‐ ‐ (820) ‐ ‐ 820 0.0%200.3690.00.000.000 Fraud Income (50%) 107 89 68 61 122 426 871 3,000 3,000 2,129 71.0%200.3690.01.000.000 Port In Admin Fees 150 422 247 200 318 208 1,545 2,000 2,000 455 22.7%
Total Operating Revenue 144,048 98,787 97,771 98,535 123,938 101,966 665,044 1,070,374 210,727 1,281,101 616,057 48.1%
200.4110.00.000.000 Administrative Salaries 25,970 26,393 35,571 27,916 27,499 26,324 169,672 332,172 332,172 162,500 48.9%200.4110.10.000.000 FSS Coordinator Salaries 1,283 2,216 1,917 1,173 1,866 1,408 9,863 20,852 20,852 10,989 52.7%200.4115.01.000.000 FSS P/R Taxes ‐ Social Security/Medicare 98 169 147 90 143 108 755 1,595 1,595 841 52.7%200.4115.02.000.000 FSS P/R Taxes ‐ SUI ‐ ‐ ‐ ‐ 41 ‐ 41 434 434 393 90.6%200.4115.04.000.000 FSS Retirement ‐ ‐ ‐ ‐ ‐ ‐ ‐ 1,355 1,355 1,355 100.0%200.4115.05.000.000 FSS Workers Comp 30 ‐ 818 ‐ ‐ 279 1,127 440 2,000 2,440 1,313 53.8%200.4115.06.000.000 FSS Coordinator Comp. Abs. ‐ ‐ ‐ ‐ ‐ ‐ ‐ ‐ ‐ ‐ 0.0%200.4125.01.000.000 Admin. P/R Taxes‐ Social Security/Medicare 1,778 1,793 2,389 1,894 1,857 1,767 11,479 25,031 25,031 13,552 54.1%200.4125.02.000.000 Admin. P/R Taxes‐ ‐SUI 95 ‐ ‐ 141 133 133 502 3,212 3,212 2,709 84.4%200.4125.04.000.000 Admin. Retirement 3,450 3,685 5,243 3,741 3,827 3,754 23,699 50,231 50,231 26,532 52.8%200.4125.05.000.000 Admin. Workers Comp 488 ‐ 2,492 ‐ ‐ 1,832 4,812 6,320 6,320 1,508 23.9%200.4125.06.000.000 Admin. Comp. Abs. ‐ ‐ ‐ ‐ ‐ ‐ ‐ ‐ ‐ ‐ 0.0%200.4130.00.000.000 Legal Fees ‐ ‐ ‐ ‐ ‐ ‐ ‐ ‐ ‐ ‐ 0.0%200.4140.00.000.000 Training 171 2,678 ‐ ‐ ‐ ‐ 2,848 4,000 4,000 1,152 28.8%200.4150.00.000.000 Travel 1,622 2,349 ‐ ‐ ‐ ‐ 3,972 7,000 7,000 3,028 43.3%200.4170.00.000.000 Accounting Fees ‐ ‐ ‐ ‐ ‐ ‐ ‐ ‐ ‐ ‐ 0.0%200.4170.04.000.000 Contract Service Plan Updates ‐ ‐ ‐ ‐ ‐ 1,088 1,088 4,000 4,000 2,912 72.8%200.4170.10.000.000 Professional Services ‐ ‐ ‐ 180 60 ‐ 240 20,000 20,000 40,000 39,760 99.4%200.4171.00.000.000 Auditing ‐ ‐ 6,109 ‐ ‐ ‐ 6,109 13,000 2,000 15,000 8,891 59.3%200.4172.00.000.000 Public Relations Expense ‐ ‐ ‐ ‐ ‐ ‐ ‐ ‐ ‐ ‐ 0.0%200.4180.00.000.000 147 Rent 2,102 2,102 2,102 2,102 2,102 2,102 12,615 25,230 25,230 12,615 50.0%200.4190.00.000.000 Office Supplies 1,110 234 ‐ 104 ‐ 397 1,845 3,000 3,000 1,155 38.5%200.4190.01.000.000 Postage 613 765 665 467 527 636 3,673 17,000 17,000 13,327 78.4%200.4190.02.000.000 Printing & Copier Usage Charges 3,214 1,902 2,489 1,547 1,648 1,744 12,544 40,000 40,000 27,456 68.6%200.4190.03.000.000 Telephone 475 390 502 776 312 424 2,879 5,000 5,000 2,121 42.4%200.4190.04.000.000 Other Misc. Costs ‐ 304 ‐ ‐ ‐ ‐ 304 ‐ ‐ (304) 0.0%200.4190.05.000.000 Membership Dues and Subscriptions ‐ ‐ ‐ ‐ ‐ 855 855 5,000 5,000 4,145 82.9%200.4190.06.000.000 Fair Housing Services ‐ ‐ ‐ 1,250 ‐ ‐ 1,250 5,000 5,000 3,750 75.0%200.4190.07.000.000 Computer Support & License Fees 14,275 ‐ ‐ 5,544 ‐ 500 20,319 12,626 12,626 (7,693) ‐60.9%200.4190.09.000.000 Admin Fees Port‐Outs 422 516 469 ‐ ‐ ‐ 1,407 4,000 4,000 2,593 64.8%200.4190.12.000.000 Office Machines/Leases 375 404 ‐ 29 375 90 1,272 1,000 1,500 2,500 1,228 49.1%200.4190.14.000.000 Criminal Background Checks 471 489 605 355 335 220 2,474 12,000 12,000 9,526 79.4%200.4190.16.000.000 Meeting Supplies/Expense ‐ ‐ 65 ‐ ‐ ‐ 65 300 300 235 78.3%200.4190.17.000.000 Office Equipment ‐ ‐ ‐ 169 ‐ 353 522 1,000 1,000 478 47.8%200.4190.20.000.000 Advertising 15 513 268 ‐ 47 29 872 4,000 4,000 3,128 78.2%200.4230.10.000.000 Contract Services ‐ 4,260 200 ‐ 225 148 4,833 ‐ 10,000 10,000 5,167 51.7%200.4400.06.000.000 HCV Management Fee 18,924 19,056 19,188 18,876 18,624 18,588 113,256 225,000 225,000 111,744 49.7%200.4400.07.000.000 HCV Bookkeeping Fee 11,828 11,910 11,993 11,798 11,640 11,618 70,785 140,000 140,000 69,215 49.4%200.4401.00.000.000 IT Services 3,000 4,931 5,013 7,438 2,875 3,038 26,294 25,000 20,000 45,000 18,706 41.6%200.4420.07.000.000 Gas / Oil 88 39 30 32 29 ‐ 219 1,000 1,000 781 78.1%200.4430.01.000.000 Vehicle Repair & Maintenance 8 ‐ ‐ ‐ ‐ ‐ 8 500 500 492 98.4%200.4430.10.000.000 Uniforms 114 ‐ ‐ ‐ 104 ‐ 218 275 275 57 20.8%200.4436.00.000.000 Maintenance Charges from Others ‐ ‐ ‐ ‐ ‐ 65 65 250 250 185 74.0%200.4510.01.000.000 General Liability Insurance 6,054 ‐ ‐ ‐ ‐ ‐ 6,054 6,556 6,556 502 7.7%200.4510.02.000.000 Auto Insurance 704 ‐ ‐ ‐ ‐ ‐ 704 1,152 1,152 448 38.9%
Agenda Packet Page 44
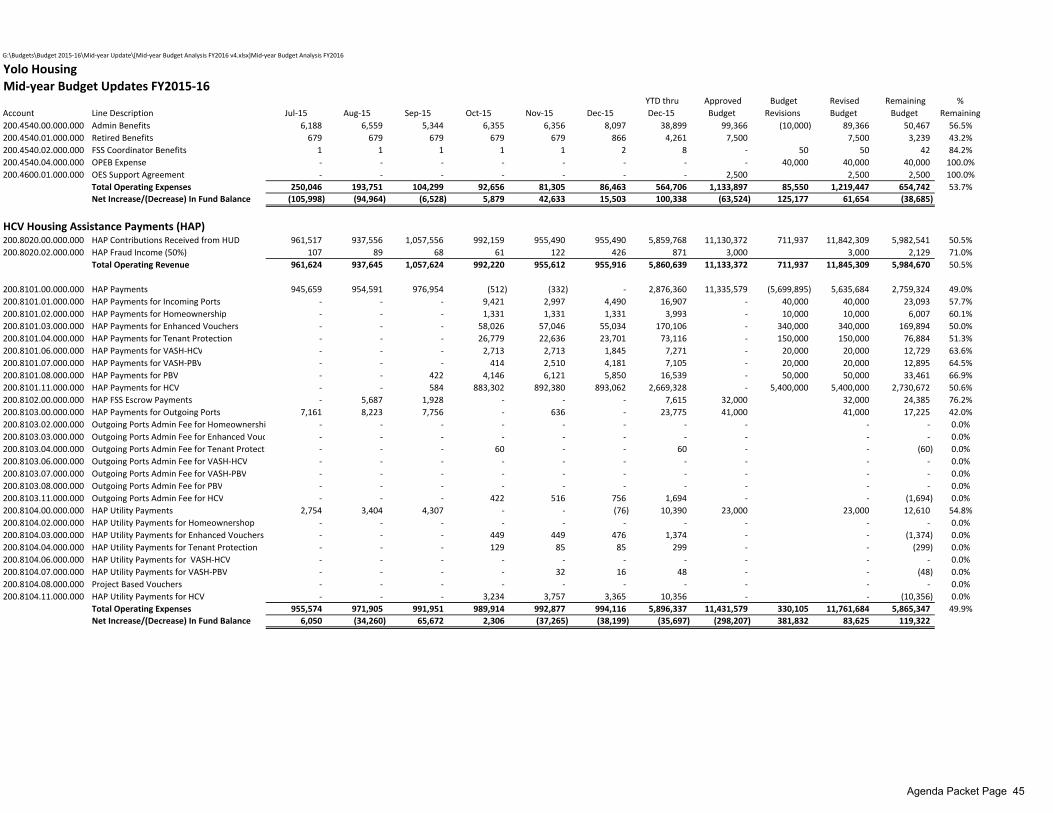
G:\Budgets\Budget 2015‐16\Mid‐year Update\[Mid‐year Budget Analysis FY2016 v4.xlsx]Mid‐year Budget Analysis FY2016
Yolo HousingMid‐year Budget Updates FY2015‐16
Account Line Description Jul‐15 Aug‐15 Sep‐15 Oct‐15 Nov‐15 Dec‐15 YTD thru Dec‐15
Approved Budget
Budget Revisions
Revised Budget
Remaining Budget
% Remaining
200.4540.00.000.000 Admin Benefits 6,188 6,559 5,344 6,355 6,356 8,097 38,899 99,366 (10,000) 89,366 50,467 56.5%200.4540.01.000.000 Retired Benefits 679 679 679 679 679 866 4,261 7,500 7,500 3,239 43.2%200.4540.02.000.000 FSS Coordinator Benefits 1 1 1 1 1 2 8 ‐ 50 50 42 84.2%200.4540.04.000.000 OPEB Expense ‐ ‐ ‐ ‐ ‐ ‐ ‐ ‐ 40,000 40,000 40,000 100.0%200.4600.01.000.000 OES Support Agreement ‐ ‐ ‐ ‐ ‐ ‐ ‐ 2,500 2,500 2,500 100.0%
Total Operating Expenses 250,046 193,751 104,299 92,656 81,305 86,463 564,706 1,133,897 85,550 1,219,447 654,742 53.7%Net Increase/(Decrease) In Fund Balance (105,998) (94,964) (6,528) 5,879 42,633 15,503 100,338 (63,524) 125,177 61,654 (38,685)
HCV Housing Assistance Payments (HAP)200.8020.00.000.000 HAP Contributions Received from HUD 961,517 937,556 1,057,556 992,159 955,490 955,490 5,859,768 11,130,372 711,937 11,842,309 5,982,541 50.5%200.8020.02.000.000 HAP Fraud Income (50%) 107 89 68 61 122 426 871 3,000 3,000 2,129 71.0%
Total Operating Revenue 961,624 937,645 1,057,624 992,220 955,612 955,916 5,860,639 11,133,372 711,937 11,845,309 5,984,670 50.5%
200.8101.00.000.000 HAP Payments 945,659 954,591 976,954 (512) (332) ‐ 2,876,360 11,335,579 (5,699,895) 5,635,684 2,759,324 49.0%200.8101.01.000.000 HAP Payments for Incoming Ports ‐ ‐ ‐ 9,421 2,997 4,490 16,907 ‐ 40,000 40,000 23,093 57.7%200.8101.02.000.000 HAP Payments for Homeownership ‐ ‐ ‐ 1,331 1,331 1,331 3,993 ‐ 10,000 10,000 6,007 60.1%200.8101.03.000.000 HAP Payments for Enhanced Vouchers ‐ ‐ ‐ 58,026 57,046 55,034 170,106 ‐ 340,000 340,000 169,894 50.0%200.8101.04.000.000 HAP Payments for Tenant Protection ‐ ‐ ‐ 26,779 22,636 23,701 73,116 ‐ 150,000 150,000 76,884 51.3%200.8101.06.000.000 HAP Payments for VASH‐HCV ‐ ‐ ‐ 2,713 2,713 1,845 7,271 ‐ 20,000 20,000 12,729 63.6%200.8101.07.000.000 HAP Payments for VASH‐PBV ‐ ‐ ‐ 414 2,510 4,181 7,105 ‐ 20,000 20,000 12,895 64.5%200.8101.08.000.000 HAP Payments for PBV ‐ ‐ 422 4,146 6,121 5,850 16,539 ‐ 50,000 50,000 33,461 66.9%200.8101.11.000.000 HAP Payments for HCV ‐ ‐ 584 883,302 892,380 893,062 2,669,328 ‐ 5,400,000 5,400,000 2,730,672 50.6%200.8102.00.000.000 HAP FSS Escrow Payments ‐ 5,687 1,928 ‐ ‐ ‐ 7,615 32,000 32,000 24,385 76.2%200.8103.00.000.000 HAP Payments for Outgoing Ports 7,161 8,223 7,756 ‐ 636 ‐ 23,775 41,000 41,000 17,225 42.0%200.8103.02.000.000 Outgoing Ports Admin Fee for Homeownershi ‐ ‐ ‐ ‐ ‐ ‐ ‐ ‐ ‐ ‐ 0.0%200.8103.03.000.000 Outgoing Ports Admin Fee for Enhanced Vouc ‐ ‐ ‐ ‐ ‐ ‐ ‐ ‐ ‐ ‐ 0.0%200.8103.04.000.000 Outgoing Ports Admin Fee for Tenant Protecti ‐ ‐ ‐ 60 ‐ ‐ 60 ‐ ‐ (60) 0.0%200.8103.06.000.000 Outgoing Ports Admin Fee for VASH‐HCV ‐ ‐ ‐ ‐ ‐ ‐ ‐ ‐ ‐ ‐ 0.0%200.8103.07.000.000 Outgoing Ports Admin Fee for VASH‐PBV ‐ ‐ ‐ ‐ ‐ ‐ ‐ ‐ ‐ ‐ 0.0%200.8103.08.000.000 Outgoing Ports Admin Fee for PBV ‐ ‐ ‐ ‐ ‐ ‐ ‐ ‐ ‐ ‐ 0.0%200.8103.11.000.000 Outgoing Ports Admin Fee for HCV ‐ ‐ ‐ 422 516 756 1,694 ‐ ‐ (1,694) 0.0%200.8104.00.000.000 HAP Utility Payments 2,754 3,404 4,307 ‐ ‐ (76) 10,390 23,000 23,000 12,610 54.8%200.8104.02.000.000 HAP Utility Payments for Homeownershop ‐ ‐ ‐ ‐ ‐ ‐ ‐ ‐ ‐ ‐ 0.0%200.8104.03.000.000 HAP Utility Payments for Enhanced Vouchers ‐ ‐ ‐ 449 449 476 1,374 ‐ ‐ (1,374) 0.0%200.8104.04.000.000 HAP Utility Payments for Tenant Protection ‐ ‐ ‐ 129 85 85 299 ‐ ‐ (299) 0.0%200.8104.06.000.000 HAP Utility Payments for VASH‐HCV ‐ ‐ ‐ ‐ ‐ ‐ ‐ ‐ ‐ ‐ 0.0%200.8104.07.000.000 HAP Utility Payments for VASH‐PBV ‐ ‐ ‐ ‐ 32 16 48 ‐ ‐ (48) 0.0%200.8104.08.000.000 Project Based Vouchers ‐ ‐ ‐ ‐ ‐ ‐ ‐ ‐ ‐ ‐ 0.0%200.8104.11.000.000 HAP Utility Payments for HCV ‐ ‐ ‐ 3,234 3,757 3,365 10,356 ‐ ‐ (10,356) 0.0%
Total Operating Expenses 955,574 971,905 991,951 989,914 992,877 994,116 5,896,337 11,431,579 330,105 11,761,684 5,865,347 49.9%Net Increase/(Decrease) In Fund Balance 6,050 (34,260) 65,672 2,306 (37,265) (38,199) (35,697) (298,207) 381,832 83,625 119,322
Agenda Packet Page 45
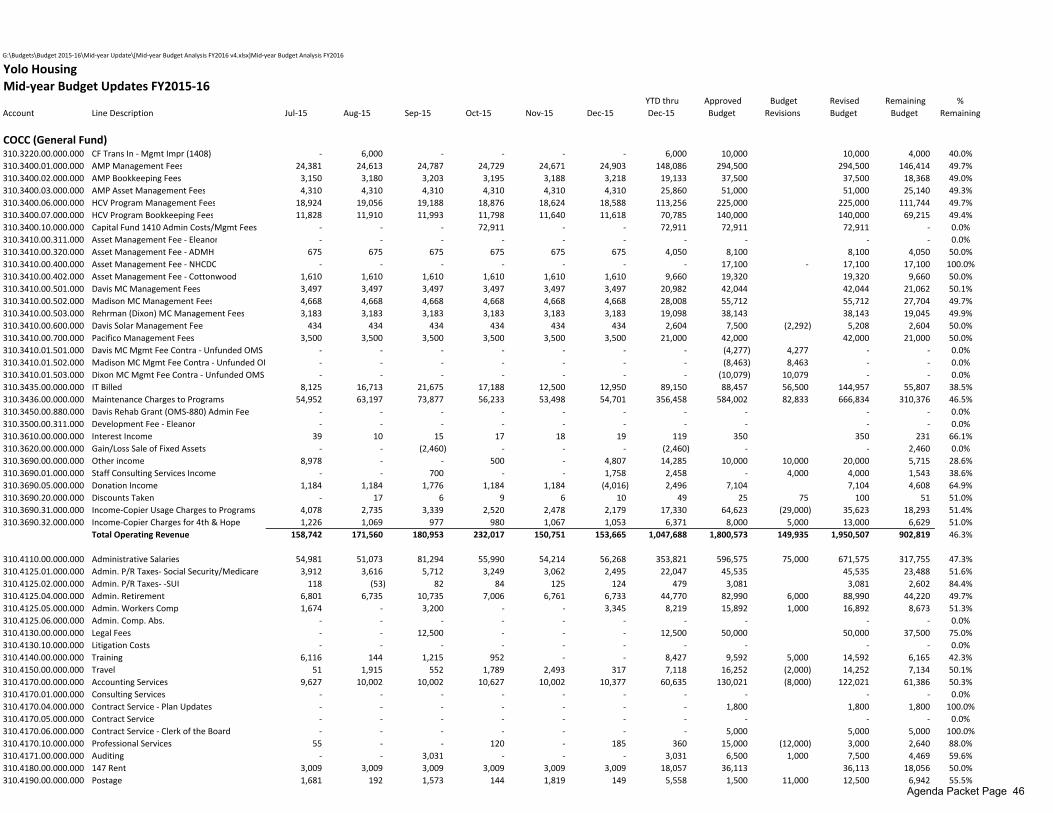
G:\Budgets\Budget 2015‐16\Mid‐year Update\[Mid‐year Budget Analysis FY2016 v4.xlsx]Mid‐year Budget Analysis FY2016
Yolo HousingMid‐year Budget Updates FY2015‐16
Account Line Description Jul‐15 Aug‐15 Sep‐15 Oct‐15 Nov‐15 Dec‐15 YTD thru Dec‐15
Approved Budget
Budget Revisions
Revised Budget
Remaining Budget
% Remaining
COCC (General Fund)310.3220.00.000.000 CF Trans In ‐ Mgmt Impr (1408) ‐ 6,000 ‐ ‐ ‐ ‐ 6,000 10,000 10,000 4,000 40.0%310.3400.01.000.000 AMP Management Fees 24,381 24,613 24,787 24,729 24,671 24,903 148,086 294,500 294,500 146,414 49.7%310.3400.02.000.000 AMP Bookkeeping Fees 3,150 3,180 3,203 3,195 3,188 3,218 19,133 37,500 37,500 18,368 49.0%310.3400.03.000.000 AMP Asset Management Fees 4,310 4,310 4,310 4,310 4,310 4,310 25,860 51,000 51,000 25,140 49.3%310.3400.06.000.000 HCV Program Management Fees 18,924 19,056 19,188 18,876 18,624 18,588 113,256 225,000 225,000 111,744 49.7%310.3400.07.000.000 HCV Program Bookkeeping Fees 11,828 11,910 11,993 11,798 11,640 11,618 70,785 140,000 140,000 69,215 49.4%310.3400.10.000.000 Capital Fund 1410 Admin Costs/Mgmt Fees ‐ ‐ ‐ 72,911 ‐ ‐ 72,911 72,911 72,911 ‐ 0.0%310.3410.00.311.000 Asset Management Fee ‐ Eleanor ‐ ‐ ‐ ‐ ‐ ‐ ‐ ‐ ‐ ‐ 0.0%310.3410.00.320.000 Asset Management Fee ‐ ADMH 675 675 675 675 675 675 4,050 8,100 8,100 4,050 50.0%310.3410.00.400.000 Asset Management Fee ‐ NHCDC ‐ ‐ ‐ ‐ ‐ ‐ ‐ 17,100 ‐ 17,100 17,100 100.0%310.3410.00.402.000 Asset Management Fee ‐ Cottonwood 1,610 1,610 1,610 1,610 1,610 1,610 9,660 19,320 19,320 9,660 50.0%310.3410.00.501.000 Davis MC Management Fees 3,497 3,497 3,497 3,497 3,497 3,497 20,982 42,044 42,044 21,062 50.1%310.3410.00.502.000 Madison MC Management Fees 4,668 4,668 4,668 4,668 4,668 4,668 28,008 55,712 55,712 27,704 49.7%310.3410.00.503.000 Rehrman (Dixon) MC Management Fees 3,183 3,183 3,183 3,183 3,183 3,183 19,098 38,143 38,143 19,045 49.9%310.3410.00.600.000 Davis Solar Management Fee 434 434 434 434 434 434 2,604 7,500 (2,292) 5,208 2,604 50.0%310.3410.00.700.000 Pacifico Management Fees 3,500 3,500 3,500 3,500 3,500 3,500 21,000 42,000 42,000 21,000 50.0%310.3410.01.501.000 Davis MC Mgmt Fee Contra ‐ Unfunded OMS C ‐ ‐ ‐ ‐ ‐ ‐ ‐ (4,277) 4,277 ‐ ‐ 0.0%310.3410.01.502.000 Madison MC Mgmt Fee Contra ‐ Unfunded OM ‐ ‐ ‐ ‐ ‐ ‐ ‐ (8,463) 8,463 ‐ ‐ 0.0%310.3410.01.503.000 Dixon MC Mgmt Fee Contra ‐ Unfunded OMS ‐ ‐ ‐ ‐ ‐ ‐ ‐ (10,079) 10,079 ‐ ‐ 0.0%310.3435.00.000.000 IT Billed 8,125 16,713 21,675 17,188 12,500 12,950 89,150 88,457 56,500 144,957 55,807 38.5%310.3436.00.000.000 Maintenance Charges to Programs 54,952 63,197 73,877 56,233 53,498 54,701 356,458 584,002 82,833 666,834 310,376 46.5%310.3450.00.880.000 Davis Rehab Grant (OMS‐880) Admin Fee ‐ ‐ ‐ ‐ ‐ ‐ ‐ ‐ ‐ ‐ 0.0%310.3500.00.311.000 Development Fee ‐ Eleanor ‐ ‐ ‐ ‐ ‐ ‐ ‐ ‐ ‐ ‐ 0.0%310.3610.00.000.000 Interest Income 39 10 15 17 18 19 119 350 350 231 66.1%310.3620.00.000.000 Gain/Loss Sale of Fixed Assets ‐ ‐ (2,460) ‐ ‐ ‐ (2,460) ‐ ‐ 2,460 0.0%310.3690.00.000.000 Other income 8,978 ‐ ‐ 500 ‐ 4,807 14,285 10,000 10,000 20,000 5,715 28.6%310.3690.01.000.000 Staff Consulting Services Income ‐ ‐ 700 ‐ ‐ 1,758 2,458 ‐ 4,000 4,000 1,543 38.6%310.3690.05.000.000 Donation Income 1,184 1,184 1,776 1,184 1,184 (4,016) 2,496 7,104 7,104 4,608 64.9%310.3690.20.000.000 Discounts Taken ‐ 17 6 9 6 10 49 25 75 100 51 51.0%310.3690.31.000.000 Income‐Copier Usage Charges to Programs 4,078 2,735 3,339 2,520 2,478 2,179 17,330 64,623 (29,000) 35,623 18,293 51.4%310.3690.32.000.000 Income‐Copier Charges for 4th & Hope 1,226 1,069 977 980 1,067 1,053 6,371 8,000 5,000 13,000 6,629 51.0%
Total Operating Revenue 158,742 171,560 180,953 232,017 150,751 153,665 1,047,688 1,800,573 149,935 1,950,507 902,819 46.3%
310.4110.00.000.000 Administrative Salaries 54,981 51,073 81,294 55,990 54,214 56,268 353,821 596,575 75,000 671,575 317,755 47.3%310.4125.01.000.000 Admin. P/R Taxes‐ Social Security/Medicare 3,912 3,616 5,712 3,249 3,062 2,495 22,047 45,535 45,535 23,488 51.6%310.4125.02.000.000 Admin. P/R Taxes‐ ‐SUI 118 (53) 82 84 125 124 479 3,081 3,081 2,602 84.4%310.4125.04.000.000 Admin. Retirement 6,801 6,735 10,735 7,006 6,761 6,733 44,770 82,990 6,000 88,990 44,220 49.7%310.4125.05.000.000 Admin. Workers Comp 1,674 ‐ 3,200 ‐ ‐ 3,345 8,219 15,892 1,000 16,892 8,673 51.3%310.4125.06.000.000 Admin. Comp. Abs. ‐ ‐ ‐ ‐ ‐ ‐ ‐ ‐ ‐ ‐ 0.0%310.4130.00.000.000 Legal Fees ‐ ‐ 12,500 ‐ ‐ ‐ 12,500 50,000 50,000 37,500 75.0%310.4130.10.000.000 Litigation Costs ‐ ‐ ‐ ‐ ‐ ‐ ‐ ‐ ‐ ‐ 0.0%310.4140.00.000.000 Training 6,116 144 1,215 952 ‐ ‐ 8,427 9,592 5,000 14,592 6,165 42.3%310.4150.00.000.000 Travel 51 1,915 552 1,789 2,493 317 7,118 16,252 (2,000) 14,252 7,134 50.1%310.4170.00.000.000 Accounting Services 9,627 10,002 10,002 10,627 10,002 10,377 60,635 130,021 (8,000) 122,021 61,386 50.3%310.4170.01.000.000 Consulting Services ‐ ‐ ‐ ‐ ‐ ‐ ‐ ‐ ‐ ‐ 0.0%310.4170.04.000.000 Contract Service ‐ Plan Updates ‐ ‐ ‐ ‐ ‐ ‐ ‐ 1,800 1,800 1,800 100.0%310.4170.05.000.000 Contract Service ‐ ‐ ‐ ‐ ‐ ‐ ‐ ‐ ‐ ‐ 0.0%310.4170.06.000.000 Contract Service ‐ Clerk of the Board ‐ ‐ ‐ ‐ ‐ ‐ ‐ 5,000 5,000 5,000 100.0%310.4170.10.000.000 Professional Services 55 ‐ ‐ 120 ‐ 185 360 15,000 (12,000) 3,000 2,640 88.0%310.4171.00.000.000 Auditing ‐ ‐ 3,031 ‐ ‐ ‐ 3,031 6,500 1,000 7,500 4,469 59.6%310.4180.00.000.000 147 Rent 3,009 3,009 3,009 3,009 3,009 3,009 18,057 36,113 36,113 18,056 50.0%310.4190.00.000.000 Postage 1,681 192 1,573 144 1,819 149 5,558 1,500 11,000 12,500 6,942 55.5%
Agenda Packet Page 46

G:\Budgets\Budget 2015‐16\Mid‐year Update\[Mid‐year Budget Analysis FY2016 v4.xlsx]Mid‐year Budget Analysis FY2016
Yolo HousingMid‐year Budget Updates FY2015‐16
Account Line Description Jul‐15 Aug‐15 Sep‐15 Oct‐15 Nov‐15 Dec‐15 YTD thru Dec‐15
Approved Budget
Budget Revisions
Revised Budget
Remaining Budget
% Remaining
310.4190.01.000.000 Office Supplies 1,079 582 586 7 1,192 111 3,557 8,500 (1,500) 7,000 3,443 49.2%310.4190.02.000.000 Printing & Copier Usage Charges 1,453 829 508 654 101 489 4,034 11,392 (3,000) 8,392 4,359 51.9%310.4190.03.000.000 Telephone 3,389 2,623 1,233 1,644 729 1,070 10,688 25,000 (4,000) 21,000 10,312 49.1%310.4190.04.000.000 Board Stipends ‐ 250 350 350 (50) 300 1,200 4,400 4,400 3,200 72.7%310.4190.05.000.000 Dues & Subscriptions 850 ‐ ‐ ‐ ‐ ‐ 850 3,315 (1,500) 1,815 965 53.2%310.4190.07.000.000 Computer Support & License Fees 5,610 ‐ ‐ ‐ ‐ 100 5,710 15,000 (5,000) 10,000 4,290 42.9%310.4190.08.000.000 Computer Services ‐ ‐ ‐ ‐ 2,760 263 3,023 6,000 6,000 2,977 49.6%310.4190.11.000.000 Office Equipment ‐ ‐ ‐ ‐ ‐ ‐ ‐ ‐ ‐ ‐ 0.0%310.4190.12.000.000 Office Machines/Leases 3,060 6,073 ‐ 3,013 3,060 3,013 18,219 26,000 10,000 36,000 17,781 49.4%310.4190.13.000.000 Meeting Expense 123 46 36 ‐ 21 ‐ 226 2,500 (1,750) 750 524 69.8%310.4190.14.000.000 Advertising (206) ‐ 200 673 ‐ ‐ 667 2,500 (1,000) 1,500 833 55.6%310.4190.16.000.000 P/R Processing Fee 202 222 339 250 229 227 1,468 6,000 6,000 4,532 75.5%310.4190.23.000.000 Computer Equipment ‐ ‐ ‐ ‐ 78 414 492 7,000 7,000 6,508 93.0%310.4310.00.000.000 Water ‐ Davis Lot Fee ‐ 2 2 2 2 2 10 20 20 10 49.0%310.4410.00.000.000 Maintenance Salaries 24,274 26,683 37,851 24,758 25,846 24,603 164,014 294,240 40,000 334,240 170,225 50.9%310.4415.01.000.000 Maintenance P/R Taxes‐ Social Security/Medi 1,743 1,926 2,724 1,779 1,862 1,768 11,802 21,665 21,665 9,863 45.5%310.4415.02.000.000 Maintenance P/R Taxes‐ ‐SUI ‐ ‐ ‐ ‐ ‐ ‐ ‐ 2,604 2,604 2,604 100.0%310.4415.03.000.000 Maintenance P/R Taxes ‐ FUTA ‐ ‐ ‐ ‐ ‐ ‐ ‐ ‐ ‐ ‐ 0.0%310.4415.04.000.000 Maintenance Retirement 3,451 3,529 5,280 3,520 3,574 3,491 22,846 45,935 45,935 23,089 50.3%310.4415.05.000.000 Maintenance Workers Comp 2,896 ‐ 2,454 ‐ ‐ 9,152 14,502 30,006 30,006 15,504 51.7%310.4415.06.000.000 Maintenance Comp. Abs. ‐ ‐ ‐ ‐ ‐ ‐ ‐ ‐ ‐ ‐ 0.0%310.4420.00.000.000 Maintenance Supplies ‐ ‐ ‐ ‐ ‐ ‐ ‐ ‐ ‐ ‐ 0.0%310.4420.01.000.000 Maintenance Contracts ‐ ‐ ‐ ‐ ‐ ‐ ‐ ‐ ‐ ‐ 0.0%310.4420.07.000.000 Gas & Oil Vehicles/Repairs Fleet Vehicles 2,263 1,686 1,495 1,227 1,020 22 7,714 24,000 (8,000) 16,000 8,286 51.8%310.4430.01.000.000 Janitorial Services ‐ ‐ ‐ ‐ ‐ ‐ ‐ ‐ ‐ ‐ 0.0%310.4430.06.000.000 Trash Truck‐ Insurance/Fuel/Repairs 2,772 369 558 360 230 19 4,308 14,500 (5,000) 9,500 5,192 54.7%310.4430.08.000.000 Automotive Repairs ‐ ‐ ‐ ‐ ‐ ‐ ‐ 3,000 (3,000) ‐ ‐ 0.0%310.4430.10.000.000 Uniform and Mat Service ‐ 56 116 ‐ 1,995 ‐ 2,167 500 4,000 4,500 2,333 51.8%310.4431.00.000.000 Landscape Maintenance ‐ ‐ ‐ ‐ ‐ ‐ ‐ ‐ ‐ ‐ 0.0%310.4436.00.000.000 Maintenance Charges from Others ‐ ‐ ‐ ‐ 165 ‐ 165 ‐ 165 165 ‐ 0.0%310.4480.00.000.000 Protective Services ‐ ‐ ‐ ‐ ‐ ‐ ‐ ‐ ‐ ‐ 0.0%310.4510.01.000.000 General Liability Insurance 213 ‐ ‐ ‐ 250 ‐ 463 263 263 (201) ‐76.5%310.4510.02.000.000 Auto Insurance 5,767 ‐ ‐ ‐ ‐ ‐ 5,767 9,142 9,142 3,376 36.9%310.4540.00.000.000 Admin Benefits 6,831 6,833 6,153 6,069 6,287 7,184 39,356 107,384 (26,000) 81,384 42,028 51.6%310.4540.01.000.000 Retired Admin Benefits 1,725 707 1,386 1,386 1,386 1,386 7,974 25,000 (5,000) 20,000 12,026 60.1%310.4540.04.000.000 OPEB Expense ‐ ‐ ‐ ‐ ‐ ‐ ‐ 25,000 75,000 100,000 100,000 100.0%310.4540.10.000.000 Maintenance Benefits 6,479 4,977 3,813 3,813 3,813 4,050 26,946 59,484 (3,000) 56,484 29,538 52.3%310.4550.00.000.000 Bank Fees & Finance Chgs 659 23 107 (81) ‐ ‐ 708 ‐ 1,000 1,000 292 29.2%310.4600.01.000.000 OES Support Agreement ‐ 3,359 ‐ ‐ ‐ ‐ 3,359 4,000 4,000 641 16.0%310.4800.00.000.000 Depreciation Expense ‐ ‐ ‐ ‐ ‐ ‐ ‐ ‐ ‐ ‐ 0.0%
Total Operating Expenses 162,657 137,407 198,098 132,397 136,034 140,664 907,257 1,800,202 139,415 1,939,617 1,032,360 53.2%Net Increase/(Decrease) In Fund Balance (3,915) 34,153 (17,145) 99,620 14,717 13,001 140,431 371 10,520 10,890 (129,540)
Agenda Packet Page 47
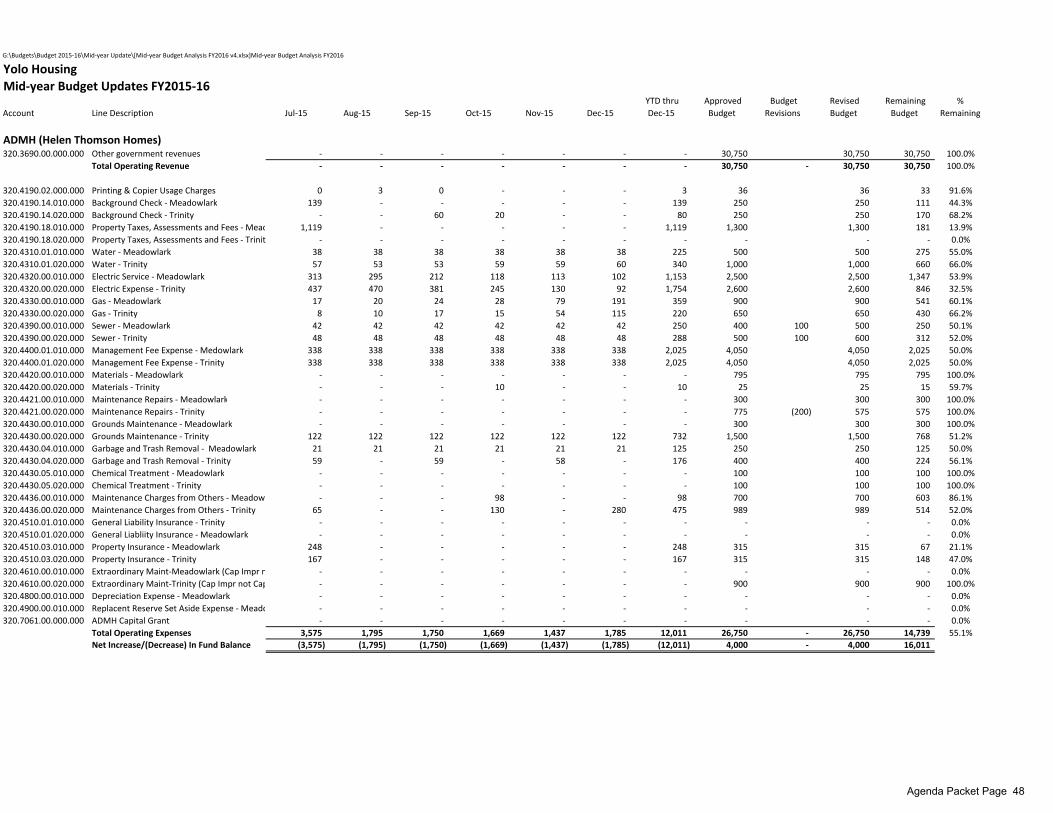
G:\Budgets\Budget 2015‐16\Mid‐year Update\[Mid‐year Budget Analysis FY2016 v4.xlsx]Mid‐year Budget Analysis FY2016
Yolo HousingMid‐year Budget Updates FY2015‐16
Account Line Description Jul‐15 Aug‐15 Sep‐15 Oct‐15 Nov‐15 Dec‐15 YTD thru Dec‐15
Approved Budget
Budget Revisions
Revised Budget
Remaining Budget
% Remaining
ADMH (Helen Thomson Homes)320.3690.00.000.000 Other government revenues ‐ ‐ ‐ ‐ ‐ ‐ ‐ 30,750 30,750 30,750 100.0%
Total Operating Revenue ‐ ‐ ‐ ‐ ‐ ‐ ‐ 30,750 ‐ 30,750 30,750 100.0%
320.4190.02.000.000 Printing & Copier Usage Charges 0 3 0 ‐ ‐ ‐ 3 36 36 33 91.6%320.4190.14.010.000 Background Check ‐ Meadowlark 139 ‐ ‐ ‐ ‐ ‐ 139 250 250 111 44.3%320.4190.14.020.000 Background Check ‐ Trinity ‐ ‐ 60 20 ‐ ‐ 80 250 250 170 68.2%320.4190.18.010.000 Property Taxes, Assessments and Fees ‐ Mead 1,119 ‐ ‐ ‐ ‐ ‐ 1,119 1,300 1,300 181 13.9%320.4190.18.020.000 Property Taxes, Assessments and Fees ‐ Trinit ‐ ‐ ‐ ‐ ‐ ‐ ‐ ‐ ‐ ‐ 0.0%320.4310.01.010.000 Water ‐ Meadowlark 38 38 38 38 38 38 225 500 500 275 55.0%320.4310.01.020.000 Water ‐ Trinity 57 53 53 59 59 60 340 1,000 1,000 660 66.0%320.4320.00.010.000 Electric Service ‐ Meadowlark 313 295 212 118 113 102 1,153 2,500 2,500 1,347 53.9%320.4320.00.020.000 Electric Expense ‐ Trinity 437 470 381 245 130 92 1,754 2,600 2,600 846 32.5%320.4330.00.010.000 Gas ‐ Meadowlark 17 20 24 28 79 191 359 900 900 541 60.1%320.4330.00.020.000 Gas ‐ Trinity 8 10 17 15 54 115 220 650 650 430 66.2%320.4390.00.010.000 Sewer ‐ Meadowlark 42 42 42 42 42 42 250 400 100 500 250 50.1%320.4390.00.020.000 Sewer ‐ Trinity 48 48 48 48 48 48 288 500 100 600 312 52.0%320.4400.01.010.000 Management Fee Expense ‐ Medowlark 338 338 338 338 338 338 2,025 4,050 4,050 2,025 50.0%320.4400.01.020.000 Management Fee Expense ‐ Trinity 338 338 338 338 338 338 2,025 4,050 4,050 2,025 50.0%320.4420.00.010.000 Materials ‐ Meadowlark ‐ ‐ ‐ ‐ ‐ ‐ ‐ 795 795 795 100.0%320.4420.00.020.000 Materials ‐ Trinity ‐ ‐ ‐ 10 ‐ ‐ 10 25 25 15 59.7%320.4421.00.010.000 Maintenance Repairs ‐ Meadowlark ‐ ‐ ‐ ‐ ‐ ‐ ‐ 300 300 300 100.0%320.4421.00.020.000 Maintenance Repairs ‐ Trinity ‐ ‐ ‐ ‐ ‐ ‐ ‐ 775 (200) 575 575 100.0%320.4430.00.010.000 Grounds Maintenance ‐ Meadowlark ‐ ‐ ‐ ‐ ‐ ‐ ‐ 300 300 300 100.0%320.4430.00.020.000 Grounds Maintenance ‐ Trinity 122 122 122 122 122 122 732 1,500 1,500 768 51.2%320.4430.04.010.000 Garbage and Trash Removal ‐ Meadowlark 21 21 21 21 21 21 125 250 250 125 50.0%320.4430.04.020.000 Garbage and Trash Removal ‐ Trinity 59 ‐ 59 ‐ 58 ‐ 176 400 400 224 56.1%320.4430.05.010.000 Chemical Treatment ‐ Meadowlark ‐ ‐ ‐ ‐ ‐ ‐ ‐ 100 100 100 100.0%320.4430.05.020.000 Chemical Treatment ‐ Trinity ‐ ‐ ‐ ‐ ‐ ‐ ‐ 100 100 100 100.0%320.4436.00.010.000 Maintenance Charges from Others ‐ Meadow ‐ ‐ ‐ 98 ‐ ‐ 98 700 700 603 86.1%320.4436.00.020.000 Maintenance Charges from Others ‐ Trinity 65 ‐ ‐ 130 ‐ 280 475 989 989 514 52.0%320.4510.01.010.000 General Liability Insurance ‐ Trinity ‐ ‐ ‐ ‐ ‐ ‐ ‐ ‐ ‐ ‐ 0.0%320.4510.01.020.000 General Liabliity Insurance ‐ Meadowlark ‐ ‐ ‐ ‐ ‐ ‐ ‐ ‐ ‐ ‐ 0.0%320.4510.03.010.000 Property Insurance ‐ Meadowlark 248 ‐ ‐ ‐ ‐ ‐ 248 315 315 67 21.1%320.4510.03.020.000 Property Insurance ‐ Trinity 167 ‐ ‐ ‐ ‐ ‐ 167 315 315 148 47.0%320.4610.00.010.000 Extraordinary Maint‐Meadowlark (Cap Impr n ‐ ‐ ‐ ‐ ‐ ‐ ‐ ‐ ‐ ‐ 0.0%320.4610.00.020.000 Extraordinary Maint‐Trinity (Cap Impr not Cap ‐ ‐ ‐ ‐ ‐ ‐ ‐ 900 900 900 100.0%320.4800.00.010.000 Depreciation Expense ‐ Meadowlark ‐ ‐ ‐ ‐ ‐ ‐ ‐ ‐ ‐ ‐ 0.0%320.4900.00.010.000 Replacent Reserve Set Aside Expense ‐ Meado ‐ ‐ ‐ ‐ ‐ ‐ ‐ ‐ ‐ ‐ 0.0%320.7061.00.000.000 ADMH Capital Grant ‐ ‐ ‐ ‐ ‐ ‐ ‐ ‐ ‐ ‐ 0.0%
Total Operating Expenses 3,575 1,795 1,750 1,669 1,437 1,785 12,011 26,750 ‐ 26,750 14,739 55.1%Net Increase/(Decrease) In Fund Balance (3,575) (1,795) (1,750) (1,669) (1,437) (1,785) (12,011) 4,000 ‐ 4,000 16,011
Agenda Packet Page 48

G:\Budgets\Budget 2015‐16\Mid‐year Update\[Mid‐year Budget Analysis FY2016 v4.xlsx]Mid‐year Budget Analysis FY2016
Yolo HousingMid‐year Budget Updates FY2015‐16
Account Line Description Jul‐15 Aug‐15 Sep‐15 Oct‐15 Nov‐15 Dec‐15 YTD thru Dec‐15
Approved Budget
Budget Revisions
Revised Budget
Remaining Budget
% Remaining
New Hope CDC & Cottonwood Senior Apartments400.3110.00.000.000 Dwelling Rent‐Market Rate Units 20,301 19,871 19,871 19,871 19,860 20,512 120,286 244,952 244,952 124,666 50.9%400.3110.01.000.000 Dwelling Rent‐RHCP Units 4,436 5,168 5,162 5,162 4,718 4,496 29,142 54,528 54,528 25,386 46.6%400.3111.01.000.000 Retro Rent RHCP Units ‐ ‐ ‐ ‐ ‐ ‐ ‐ ‐ ‐ ‐ 0.0%400.3369.01.000.000 RHCP ‐ State Annuity Receipts 7,447 ‐ ‐ ‐ ‐ ‐ 7,447 ‐ ‐ (7,447) 0.0%400.3410.00.411.000 Asset Mgmt Fee ‐ Cesar ‐ ‐ ‐ ‐ ‐ ‐ ‐ ‐ ‐ ‐ 0.0%400.3410.00.412.000 Asset Mgmt Fee ‐ Rochdale ‐ ‐ ‐ ‐ ‐ ‐ ‐ ‐ ‐ ‐ 0.0%400.3410.00.413.000 Asset Mgmt Fee ‐ Crosswood ‐ ‐ ‐ ‐ ‐ ‐ ‐ 9,300 9,300 9,300 100.0%400.3500.00.411.000 Development Fee ‐ Cesar ‐ ‐ ‐ ‐ ‐ ‐ ‐ ‐ ‐ ‐ 0.0%400.3500.00.412.000 Development Fee ‐ Rochdale ‐ ‐ ‐ ‐ ‐ ‐ ‐ ‐ ‐ ‐ 0.0%400.3500.00.413.000 Development Fee ‐ Crosswood ‐ ‐ ‐ ‐ ‐ ‐ ‐ ‐ ‐ ‐ 0.0%400.3610.00.000.000 Interest Income 41 43 44 44 45 45 261 200 250 450 189 42.0%400.3610.01.000.000 Interest on Replacement Reserve 26 26 25 25 26 26 154 275 275 121 43.9%400.3690.00.000.000 Other income 105 ‐ ‐ ‐ 70 ‐ 175 100 100 200 25 12.5%400.3690.01.000.000 Contribution Income ‐ ‐ ‐ ‐ ‐ ‐ ‐ 2,000 2,000 2,000 100.0%400.3690.02.000.000 RHCP ‐ Maintenance Charges to Tenants ‐ ‐ ‐ ‐ ‐ ‐ ‐ ‐ ‐ ‐ 0.0%400.3690.03.000.000 Other Income Tenant Cottonwood 18 ‐ ‐ ‐ ‐ ‐ 18 1,000 (900) 100 82 81.8%400.3690.04.000.000 RHCP ‐ Other Charges to Tenants ‐ 163 ‐ ‐ ‐ ‐ 163 100 100 200 38 18.8%400.3690.05.000.000 Vending Income 416 ‐ 504 ‐ 219 204 1,343 2,500 2,500 1,157 46.3%
Total Operating Revenue 32,791 25,270 25,606 25,102 24,937 25,283 158,989 314,955 (450) 314,505 155,515 49.4%
400.4110.00.000.000 Administration Salaries 1,218 1,422 2,194 1,826 1,566 1,767 9,993 28,943 (5,000) 23,943 13,950 58.3%400.4125.01.000.000 Admin. P/R Taxes ‐ Social Security/Medicare 84 98 152 129 109 124 695 2,214 2,214 1,519 68.6%400.4125.02.000.000 Admin. P/R Taxes ‐ SUI ‐ ‐ ‐ ‐ ‐ ‐ ‐ 343 343 343 100.0%400.4125.04.000.000 Admin. Retirement 79 92 152 106 116 104 649 2,499 2,499 1,850 74.0%400.4125.05.000.000 Admin. Workers Comp 26 ‐ 215 ‐ ‐ 166 407 611 611 204 33.4%400.4125.06.000.000 Admin. Comp. Abs. ‐ ‐ ‐ ‐ ‐ ‐ ‐ ‐ ‐ ‐ 0.0%400.4130.00.000.000 Legal Fees ‐ ‐ ‐ ‐ ‐ ‐ ‐ 750 750 750 100.0%400.4140.00.000.000 Training ‐ ‐ ‐ ‐ ‐ ‐ ‐ 500 500 500 100.0%400.4150.00.000.000 Travel ‐ ‐ ‐ ‐ ‐ ‐ ‐ 100 100 100 100.0%400.4170.05.000.000 Contract Services ‐ ‐ ‐ ‐ ‐ ‐ ‐ 500 500 500 100.0%400.4170.10.000.000 Professional Services ‐ ‐ ‐ ‐ ‐ ‐ ‐ 1,000 1,000 1,000 100.0%400.4171.00.000.000 Audit & IRS 990 Submission ‐ 67 ‐ ‐ ‐ ‐ 67 8,600 7,300 15,900 15,833 99.6%400.4171.01.000.000 Tax Return Prep ‐ NHCDC Crswd LLC ‐ ‐ ‐ ‐ ‐ ‐ ‐ ‐ ‐ ‐ 0.0%400.4190.00.000.000 Postage ‐ 1 ‐ 0 19 ‐ 21 200 (103) 97 76 78.5%400.4190.01.000.000 Office Supplies ‐ ‐ ‐ ‐ 184 26 210 1,500 1,500 1,290 86.0%400.4190.02.000.000 Printing & Copier Usage Charges 0 5 2 0 116 10 132 66 300 366 234 63.9%400.4190.03.000.000 Telephone 305 173 166 212 213 156 1,226 1,400 900 2,300 1,074 46.7%400.4190.05.000.000 Membership Dues and Subscriptions ‐ ‐ ‐ ‐ 215 ‐ 215 100 100 (115) ‐115.0%400.4190.06.000.000 Personnel Studies ‐ ‐ ‐ ‐ ‐ ‐ ‐ ‐ ‐ ‐ 0.0%400.4190.07.000.000 Computer Support & License Fees 1,619 53 53 53 53 58 1,889 2,500 (103) 2,397 508 21.2%400.4190.11.000.000 Office Equipment ‐ ‐ ‐ 22 ‐ ‐ 22 200 200 178 88.8%400.4190.12.000.000 Office Machines/Leases 60 121 ‐ 60 60 60 363 668 60 728 365 50.2%400.4190.14.000.000 Criminal Background Checks 20 ‐ ‐ ‐ ‐ 76 96 300 300 205 68.2%400.4190.18.000.000 Taxes, Assessments & Fees 16,717 2,375 ‐ ‐ 5 ‐ 19,097 17,500 1,775 19,275 178 0.9%400.4190.19.000.000 Realtor Commission ‐ ‐ ‐ ‐ ‐ ‐ ‐ ‐ ‐ ‐ 0.0%400.4190.20.000.000 Advertising ‐ ‐ ‐ ‐ ‐ ‐ ‐ 250 250 250 100.0%400.4190.22.000.000 Meeting Supplies/Expense ‐ ‐ ‐ ‐ ‐ ‐ ‐ 50 50 50 100.0%400.4190.23.000.000 Computer Equipment ‐ ‐ ‐ ‐ ‐ ‐ ‐ 1,203 1,203 1,203 100.0%400.4221.00.000.000 Tenant Liaison ‐ ‐ ‐ ‐ ‐ ‐ ‐ ‐ ‐ ‐ 0.0%400.4310.00.000.000 Water 597 609 691 657 618 666 3,838 11,081 (2,000) 9,081 5,243 57.7%400.4320.00.000.000 Electricity 594 558 520 426 423 311 2,832 5,816 5,816 2,983 51.3%400.4330.00.000.000 Gas 58 74 76 70 87 116 482 900 350 1,250 768 61.5%
Agenda Packet Page 49
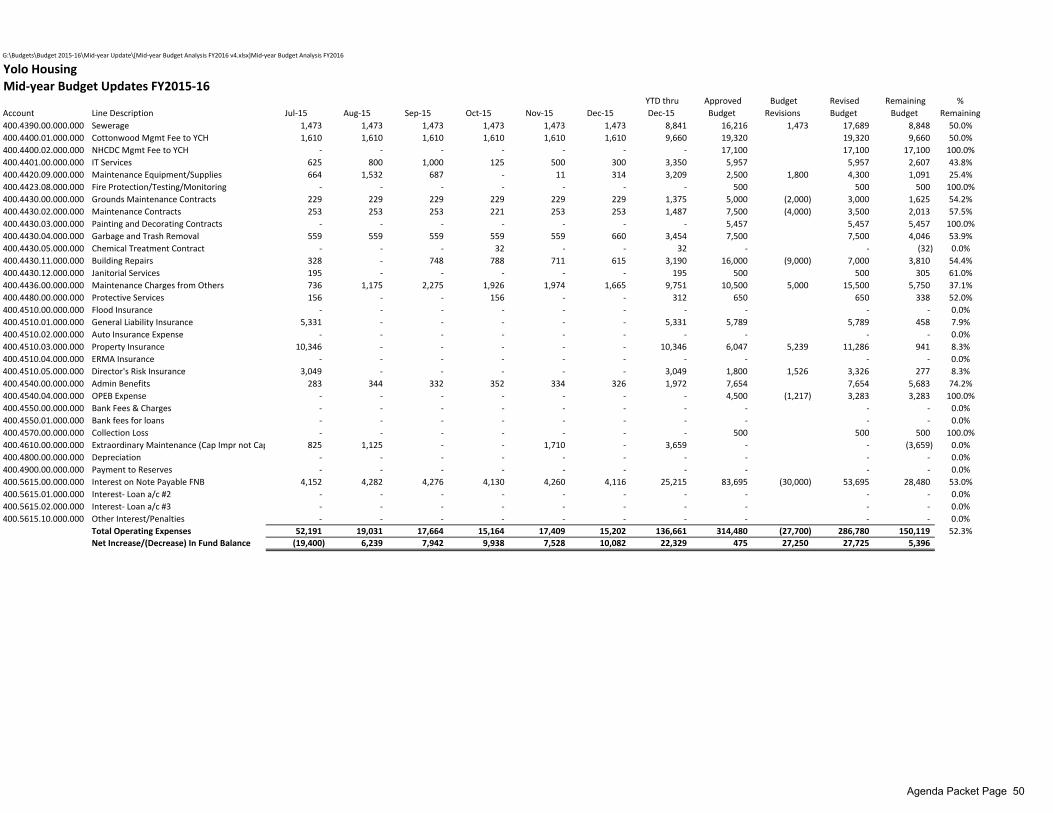
G:\Budgets\Budget 2015‐16\Mid‐year Update\[Mid‐year Budget Analysis FY2016 v4.xlsx]Mid‐year Budget Analysis FY2016
Yolo HousingMid‐year Budget Updates FY2015‐16
Account Line Description Jul‐15 Aug‐15 Sep‐15 Oct‐15 Nov‐15 Dec‐15 YTD thru Dec‐15
Approved Budget
Budget Revisions
Revised Budget
Remaining Budget
% Remaining
400.4390.00.000.000 Sewerage 1,473 1,473 1,473 1,473 1,473 1,473 8,841 16,216 1,473 17,689 8,848 50.0%400.4400.01.000.000 Cottonwood Mgmt Fee to YCH 1,610 1,610 1,610 1,610 1,610 1,610 9,660 19,320 19,320 9,660 50.0%400.4400.02.000.000 NHCDC Mgmt Fee to YCH ‐ ‐ ‐ ‐ ‐ ‐ ‐ 17,100 17,100 17,100 100.0%400.4401.00.000.000 IT Services 625 800 1,000 125 500 300 3,350 5,957 5,957 2,607 43.8%400.4420.09.000.000 Maintenance Equipment/Supplies 664 1,532 687 ‐ 11 314 3,209 2,500 1,800 4,300 1,091 25.4%400.4423.08.000.000 Fire Protection/Testing/Monitoring ‐ ‐ ‐ ‐ ‐ ‐ ‐ 500 500 500 100.0%400.4430.00.000.000 Grounds Maintenance Contracts 229 229 229 229 229 229 1,375 5,000 (2,000) 3,000 1,625 54.2%400.4430.02.000.000 Maintenance Contracts 253 253 253 221 253 253 1,487 7,500 (4,000) 3,500 2,013 57.5%400.4430.03.000.000 Painting and Decorating Contracts ‐ ‐ ‐ ‐ ‐ ‐ ‐ 5,457 5,457 5,457 100.0%400.4430.04.000.000 Garbage and Trash Removal 559 559 559 559 559 660 3,454 7,500 7,500 4,046 53.9%400.4430.05.000.000 Chemical Treatment Contract ‐ ‐ ‐ 32 ‐ ‐ 32 ‐ ‐ (32) 0.0%400.4430.11.000.000 Building Repairs 328 ‐ 748 788 711 615 3,190 16,000 (9,000) 7,000 3,810 54.4%400.4430.12.000.000 Janitorial Services 195 ‐ ‐ ‐ ‐ ‐ 195 500 500 305 61.0%400.4436.00.000.000 Maintenance Charges from Others 736 1,175 2,275 1,926 1,974 1,665 9,751 10,500 5,000 15,500 5,750 37.1%400.4480.00.000.000 Protective Services 156 ‐ ‐ 156 ‐ ‐ 312 650 650 338 52.0%400.4510.00.000.000 Flood Insurance ‐ ‐ ‐ ‐ ‐ ‐ ‐ ‐ ‐ ‐ 0.0%400.4510.01.000.000 General Liability Insurance 5,331 ‐ ‐ ‐ ‐ ‐ 5,331 5,789 5,789 458 7.9%400.4510.02.000.000 Auto Insurance Expense ‐ ‐ ‐ ‐ ‐ ‐ ‐ ‐ ‐ ‐ 0.0%400.4510.03.000.000 Property Insurance 10,346 ‐ ‐ ‐ ‐ ‐ 10,346 6,047 5,239 11,286 941 8.3%400.4510.04.000.000 ERMA Insurance ‐ ‐ ‐ ‐ ‐ ‐ ‐ ‐ ‐ ‐ 0.0%400.4510.05.000.000 Director's Risk Insurance 3,049 ‐ ‐ ‐ ‐ ‐ 3,049 1,800 1,526 3,326 277 8.3%400.4540.00.000.000 Admin Benefits 283 344 332 352 334 326 1,972 7,654 7,654 5,683 74.2%400.4540.04.000.000 OPEB Expense ‐ ‐ ‐ ‐ ‐ ‐ ‐ 4,500 (1,217) 3,283 3,283 100.0%400.4550.00.000.000 Bank Fees & Charges ‐ ‐ ‐ ‐ ‐ ‐ ‐ ‐ ‐ ‐ 0.0%400.4550.01.000.000 Bank fees for loans ‐ ‐ ‐ ‐ ‐ ‐ ‐ ‐ ‐ ‐ 0.0%400.4570.00.000.000 Collection Loss ‐ ‐ ‐ ‐ ‐ ‐ ‐ 500 500 500 100.0%400.4610.00.000.000 Extraordinary Maintenance (Cap Impr not Cap 825 1,125 ‐ ‐ 1,710 ‐ 3,659 ‐ ‐ (3,659) 0.0%400.4800.00.000.000 Depreciation ‐ ‐ ‐ ‐ ‐ ‐ ‐ ‐ ‐ ‐ 0.0%400.4900.00.000.000 Payment to Reserves ‐ ‐ ‐ ‐ ‐ ‐ ‐ ‐ ‐ ‐ 0.0%400.5615.00.000.000 Interest on Note Payable FNB 4,152 4,282 4,276 4,130 4,260 4,116 25,215 83,695 (30,000) 53,695 28,480 53.0%400.5615.01.000.000 Interest‐ Loan a/c #2 ‐ ‐ ‐ ‐ ‐ ‐ ‐ ‐ ‐ ‐ 0.0%400.5615.02.000.000 Interest‐ Loan a/c #3 ‐ ‐ ‐ ‐ ‐ ‐ ‐ ‐ ‐ ‐ 0.0%400.5615.10.000.000 Other Interest/Penalties ‐ ‐ ‐ ‐ ‐ ‐ ‐ ‐ ‐ ‐ 0.0%
Total Operating Expenses 52,191 19,031 17,664 15,164 17,409 15,202 136,661 314,480 (27,700) 286,780 150,119 52.3%Net Increase/(Decrease) In Fund Balance (19,400) 6,239 7,942 9,938 7,528 10,082 22,329 475 27,250 27,725 5,396
Agenda Packet Page 50
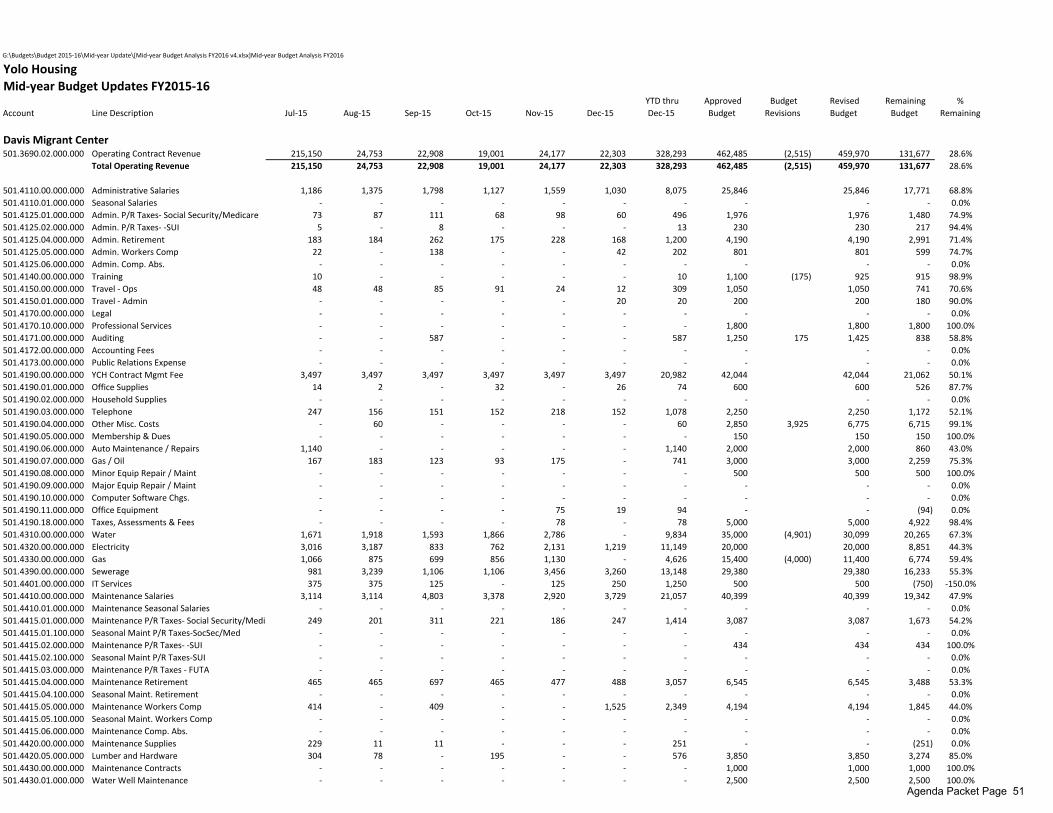
G:\Budgets\Budget 2015‐16\Mid‐year Update\[Mid‐year Budget Analysis FY2016 v4.xlsx]Mid‐year Budget Analysis FY2016
Yolo HousingMid‐year Budget Updates FY2015‐16
Account Line Description Jul‐15 Aug‐15 Sep‐15 Oct‐15 Nov‐15 Dec‐15 YTD thru Dec‐15
Approved Budget
Budget Revisions
Revised Budget
Remaining Budget
% Remaining
Davis Migrant Center501.3690.02.000.000 Operating Contract Revenue 215,150 24,753 22,908 19,001 24,177 22,303 328,293 462,485 (2,515) 459,970 131,677 28.6%
Total Operating Revenue 215,150 24,753 22,908 19,001 24,177 22,303 328,293 462,485 (2,515) 459,970 131,677 28.6%
501.4110.00.000.000 Administrative Salaries 1,186 1,375 1,798 1,127 1,559 1,030 8,075 25,846 25,846 17,771 68.8%501.4110.01.000.000 Seasonal Salaries ‐ ‐ ‐ ‐ ‐ ‐ ‐ ‐ ‐ ‐ 0.0%501.4125.01.000.000 Admin. P/R Taxes‐ Social Security/Medicare 73 87 111 68 98 60 496 1,976 1,976 1,480 74.9%501.4125.02.000.000 Admin. P/R Taxes‐ ‐SUI 5 ‐ 8 ‐ ‐ ‐ 13 230 230 217 94.4%501.4125.04.000.000 Admin. Retirement 183 184 262 175 228 168 1,200 4,190 4,190 2,991 71.4%501.4125.05.000.000 Admin. Workers Comp 22 ‐ 138 ‐ ‐ 42 202 801 801 599 74.7%501.4125.06.000.000 Admin. Comp. Abs. ‐ ‐ ‐ ‐ ‐ ‐ ‐ ‐ ‐ ‐ 0.0%501.4140.00.000.000 Training 10 ‐ ‐ ‐ ‐ ‐ 10 1,100 (175) 925 915 98.9%501.4150.00.000.000 Travel ‐ Ops 48 48 85 91 24 12 309 1,050 1,050 741 70.6%501.4150.01.000.000 Travel ‐ Admin ‐ ‐ ‐ ‐ ‐ 20 20 200 200 180 90.0%501.4170.00.000.000 Legal ‐ ‐ ‐ ‐ ‐ ‐ ‐ ‐ ‐ ‐ 0.0%501.4170.10.000.000 Professional Services ‐ ‐ ‐ ‐ ‐ ‐ ‐ 1,800 1,800 1,800 100.0%501.4171.00.000.000 Auditing ‐ ‐ 587 ‐ ‐ ‐ 587 1,250 175 1,425 838 58.8%501.4172.00.000.000 Accounting Fees ‐ ‐ ‐ ‐ ‐ ‐ ‐ ‐ ‐ ‐ 0.0%501.4173.00.000.000 Public Relations Expense ‐ ‐ ‐ ‐ ‐ ‐ ‐ ‐ ‐ ‐ 0.0%501.4190.00.000.000 YCH Contract Mgmt Fee 3,497 3,497 3,497 3,497 3,497 3,497 20,982 42,044 42,044 21,062 50.1%501.4190.01.000.000 Office Supplies 14 2 ‐ 32 ‐ 26 74 600 600 526 87.7%501.4190.02.000.000 Household Supplies ‐ ‐ ‐ ‐ ‐ ‐ ‐ ‐ ‐ ‐ 0.0%501.4190.03.000.000 Telephone 247 156 151 152 218 152 1,078 2,250 2,250 1,172 52.1%501.4190.04.000.000 Other Misc. Costs ‐ 60 ‐ ‐ ‐ ‐ 60 2,850 3,925 6,775 6,715 99.1%501.4190.05.000.000 Membership & Dues ‐ ‐ ‐ ‐ ‐ ‐ ‐ 150 150 150 100.0%501.4190.06.000.000 Auto Maintenance / Repairs 1,140 ‐ ‐ ‐ ‐ ‐ 1,140 2,000 2,000 860 43.0%501.4190.07.000.000 Gas / Oil 167 183 123 93 175 ‐ 741 3,000 3,000 2,259 75.3%501.4190.08.000.000 Minor Equip Repair / Maint ‐ ‐ ‐ ‐ ‐ ‐ ‐ 500 500 500 100.0%501.4190.09.000.000 Major Equip Repair / Maint ‐ ‐ ‐ ‐ ‐ ‐ ‐ ‐ ‐ ‐ 0.0%501.4190.10.000.000 Computer Software Chgs. ‐ ‐ ‐ ‐ ‐ ‐ ‐ ‐ ‐ ‐ 0.0%501.4190.11.000.000 Office Equipment ‐ ‐ ‐ ‐ 75 19 94 ‐ ‐ (94) 0.0%501.4190.18.000.000 Taxes, Assessments & Fees ‐ ‐ ‐ ‐ 78 ‐ 78 5,000 5,000 4,922 98.4%501.4310.00.000.000 Water 1,671 1,918 1,593 1,866 2,786 ‐ 9,834 35,000 (4,901) 30,099 20,265 67.3%501.4320.00.000.000 Electricity 3,016 3,187 833 762 2,131 1,219 11,149 20,000 20,000 8,851 44.3%501.4330.00.000.000 Gas 1,066 875 699 856 1,130 ‐ 4,626 15,400 (4,000) 11,400 6,774 59.4%501.4390.00.000.000 Sewerage 981 3,239 1,106 1,106 3,456 3,260 13,148 29,380 29,380 16,233 55.3%501.4401.00.000.000 IT Services 375 375 125 ‐ 125 250 1,250 500 500 (750) ‐150.0%501.4410.00.000.000 Maintenance Salaries 3,114 3,114 4,803 3,378 2,920 3,729 21,057 40,399 40,399 19,342 47.9%501.4410.01.000.000 Maintenance Seasonal Salaries ‐ ‐ ‐ ‐ ‐ ‐ ‐ ‐ ‐ ‐ 0.0%501.4415.01.000.000 Maintenance P/R Taxes‐ Social Security/Medi 249 201 311 221 186 247 1,414 3,087 3,087 1,673 54.2%501.4415.01.100.000 Seasonal Maint P/R Taxes‐SocSec/Med ‐ ‐ ‐ ‐ ‐ ‐ ‐ ‐ ‐ ‐ 0.0%501.4415.02.000.000 Maintenance P/R Taxes‐ ‐SUI ‐ ‐ ‐ ‐ ‐ ‐ ‐ 434 434 434 100.0%501.4415.02.100.000 Seasonal Maint P/R Taxes‐SUI ‐ ‐ ‐ ‐ ‐ ‐ ‐ ‐ ‐ ‐ 0.0%501.4415.03.000.000 Maintenance P/R Taxes ‐ FUTA ‐ ‐ ‐ ‐ ‐ ‐ ‐ ‐ ‐ ‐ 0.0%501.4415.04.000.000 Maintenance Retirement 465 465 697 465 477 488 3,057 6,545 6,545 3,488 53.3%501.4415.04.100.000 Seasonal Maint. Retirement ‐ ‐ ‐ ‐ ‐ ‐ ‐ ‐ ‐ ‐ 0.0%501.4415.05.000.000 Maintenance Workers Comp 414 ‐ 409 ‐ ‐ 1,525 2,349 4,194 4,194 1,845 44.0%501.4415.05.100.000 Seasonal Maint. Workers Comp ‐ ‐ ‐ ‐ ‐ ‐ ‐ ‐ ‐ ‐ 0.0%501.4415.06.000.000 Maintenance Comp. Abs. ‐ ‐ ‐ ‐ ‐ ‐ ‐ ‐ ‐ ‐ 0.0%501.4420.00.000.000 Maintenance Supplies 229 11 11 ‐ ‐ ‐ 251 ‐ ‐ (251) 0.0%501.4420.05.000.000 Lumber and Hardware 304 78 ‐ 195 ‐ ‐ 576 3,850 3,850 3,274 85.0%501.4430.00.000.000 Maintenance Contracts ‐ ‐ ‐ ‐ ‐ ‐ ‐ 1,000 1,000 1,000 100.0%501.4430.01.000.000 Water Well Maintenance ‐ ‐ ‐ ‐ ‐ ‐ ‐ 2,500 2,500 2,500 100.0%
Agenda Packet Page 51
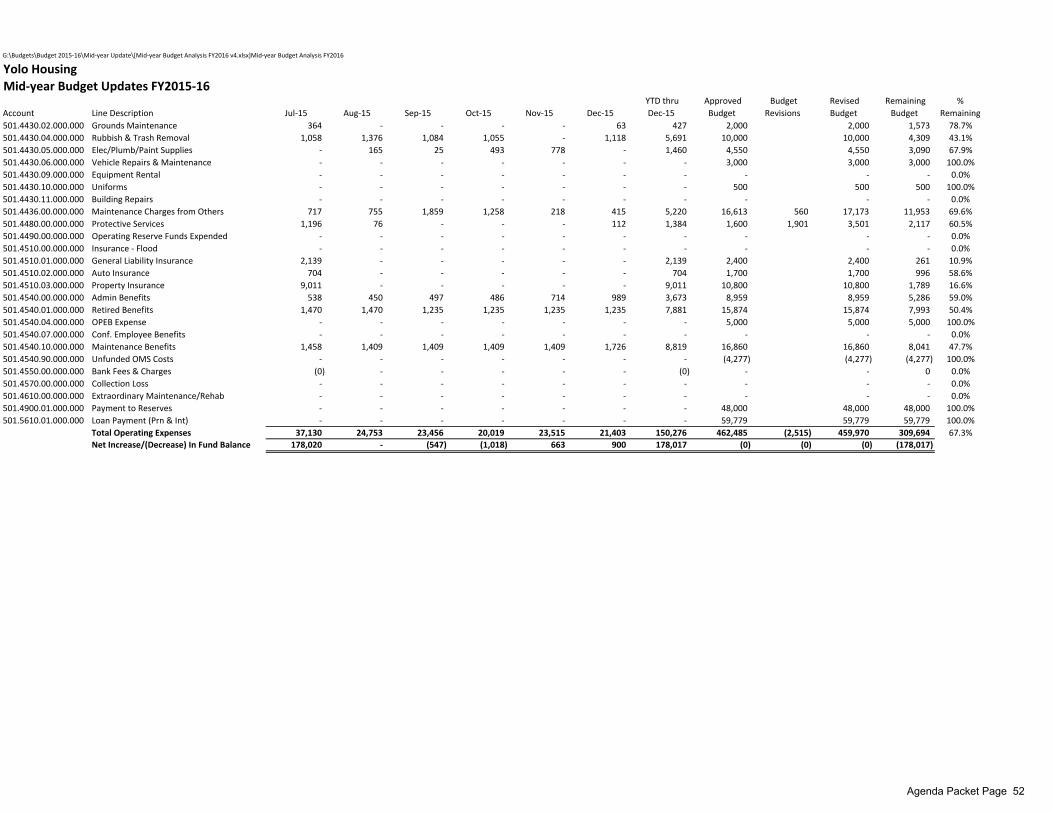
G:\Budgets\Budget 2015‐16\Mid‐year Update\[Mid‐year Budget Analysis FY2016 v4.xlsx]Mid‐year Budget Analysis FY2016
Yolo HousingMid‐year Budget Updates FY2015‐16
Account Line Description Jul‐15 Aug‐15 Sep‐15 Oct‐15 Nov‐15 Dec‐15 YTD thru Dec‐15
Approved Budget
Budget Revisions
Revised Budget
Remaining Budget
% Remaining
501.4430.02.000.000 Grounds Maintenance 364 ‐ ‐ ‐ ‐ 63 427 2,000 2,000 1,573 78.7%501.4430.04.000.000 Rubbish & Trash Removal 1,058 1,376 1,084 1,055 ‐ 1,118 5,691 10,000 10,000 4,309 43.1%501.4430.05.000.000 Elec/Plumb/Paint Supplies ‐ 165 25 493 778 ‐ 1,460 4,550 4,550 3,090 67.9%501.4430.06.000.000 Vehicle Repairs & Maintenance ‐ ‐ ‐ ‐ ‐ ‐ ‐ 3,000 3,000 3,000 100.0%501.4430.09.000.000 Equipment Rental ‐ ‐ ‐ ‐ ‐ ‐ ‐ ‐ ‐ ‐ 0.0%501.4430.10.000.000 Uniforms ‐ ‐ ‐ ‐ ‐ ‐ ‐ 500 500 500 100.0%501.4430.11.000.000 Building Repairs ‐ ‐ ‐ ‐ ‐ ‐ ‐ ‐ ‐ ‐ 0.0%501.4436.00.000.000 Maintenance Charges from Others 717 755 1,859 1,258 218 415 5,220 16,613 560 17,173 11,953 69.6%501.4480.00.000.000 Protective Services 1,196 76 ‐ ‐ ‐ 112 1,384 1,600 1,901 3,501 2,117 60.5%501.4490.00.000.000 Operating Reserve Funds Expended ‐ ‐ ‐ ‐ ‐ ‐ ‐ ‐ ‐ ‐ 0.0%501.4510.00.000.000 Insurance ‐ Flood ‐ ‐ ‐ ‐ ‐ ‐ ‐ ‐ ‐ ‐ 0.0%501.4510.01.000.000 General Liability Insurance 2,139 ‐ ‐ ‐ ‐ ‐ 2,139 2,400 2,400 261 10.9%501.4510.02.000.000 Auto Insurance 704 ‐ ‐ ‐ ‐ ‐ 704 1,700 1,700 996 58.6%501.4510.03.000.000 Property Insurance 9,011 ‐ ‐ ‐ ‐ ‐ 9,011 10,800 10,800 1,789 16.6%501.4540.00.000.000 Admin Benefits 538 450 497 486 714 989 3,673 8,959 8,959 5,286 59.0%501.4540.01.000.000 Retired Benefits 1,470 1,470 1,235 1,235 1,235 1,235 7,881 15,874 15,874 7,993 50.4%501.4540.04.000.000 OPEB Expense ‐ ‐ ‐ ‐ ‐ ‐ ‐ 5,000 5,000 5,000 100.0%501.4540.07.000.000 Conf. Employee Benefits ‐ ‐ ‐ ‐ ‐ ‐ ‐ ‐ ‐ ‐ 0.0%501.4540.10.000.000 Maintenance Benefits 1,458 1,409 1,409 1,409 1,409 1,726 8,819 16,860 16,860 8,041 47.7%501.4540.90.000.000 Unfunded OMS Costs ‐ ‐ ‐ ‐ ‐ ‐ ‐ (4,277) (4,277) (4,277) 100.0%501.4550.00.000.000 Bank Fees & Charges (0) ‐ ‐ ‐ ‐ ‐ (0) ‐ ‐ 0 0.0%501.4570.00.000.000 Collection Loss ‐ ‐ ‐ ‐ ‐ ‐ ‐ ‐ ‐ ‐ 0.0%501.4610.00.000.000 Extraordinary Maintenance/Rehab ‐ ‐ ‐ ‐ ‐ ‐ ‐ ‐ ‐ ‐ 0.0%501.4900.01.000.000 Payment to Reserves ‐ ‐ ‐ ‐ ‐ ‐ ‐ 48,000 48,000 48,000 100.0%501.5610.01.000.000 Loan Payment (Prn & Int) ‐ ‐ ‐ ‐ ‐ ‐ ‐ 59,779 59,779 59,779 100.0%
Total Operating Expenses 37,130 24,753 23,456 20,019 23,515 21,403 150,276 462,485 (2,515) 459,970 309,694 67.3%Net Increase/(Decrease) In Fund Balance 178,020 ‐ (547) (1,018) 663 900 178,017 (0) (0) (0) (178,017)
Agenda Packet Page 52
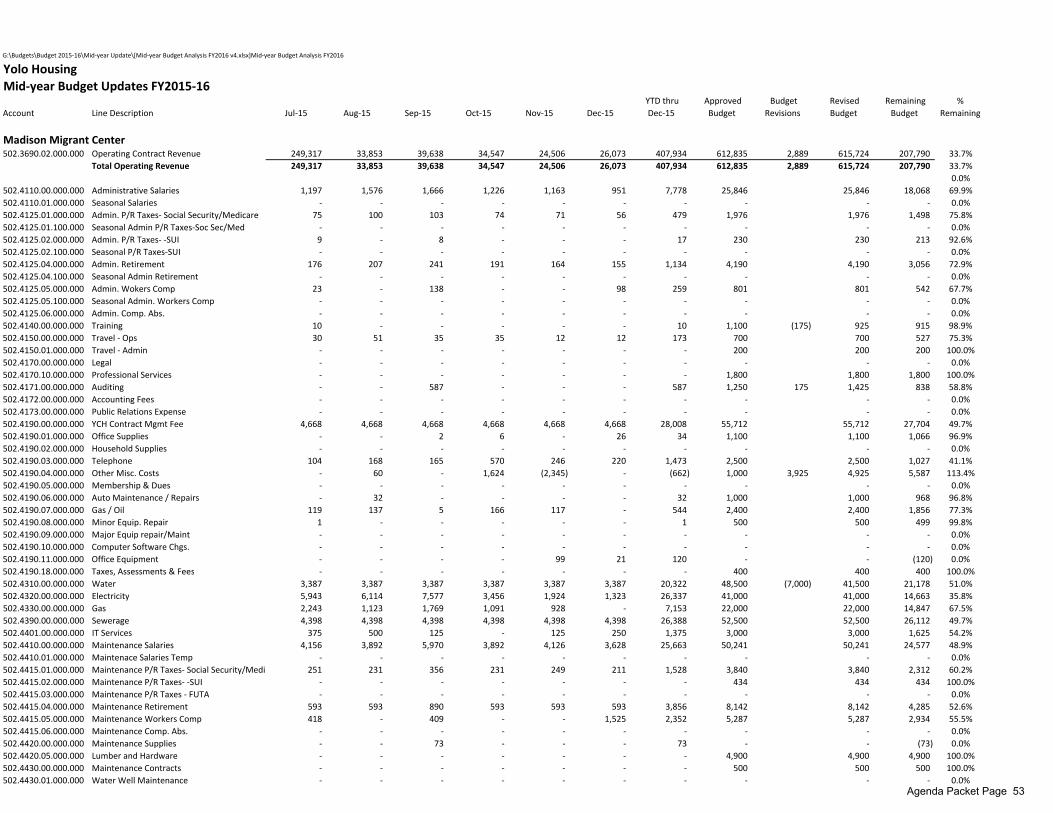
G:\Budgets\Budget 2015‐16\Mid‐year Update\[Mid‐year Budget Analysis FY2016 v4.xlsx]Mid‐year Budget Analysis FY2016
Yolo HousingMid‐year Budget Updates FY2015‐16
Account Line Description Jul‐15 Aug‐15 Sep‐15 Oct‐15 Nov‐15 Dec‐15 YTD thru Dec‐15
Approved Budget
Budget Revisions
Revised Budget
Remaining Budget
% Remaining
Madison Migrant Center502.3690.02.000.000 Operating Contract Revenue 249,317 33,853 39,638 34,547 24,506 26,073 407,934 612,835 2,889 615,724 207,790 33.7%
Total Operating Revenue 249,317 33,853 39,638 34,547 24,506 26,073 407,934 612,835 2,889 615,724 207,790 33.7%0.0%
502.4110.00.000.000 Administrative Salaries 1,197 1,576 1,666 1,226 1,163 951 7,778 25,846 25,846 18,068 69.9%502.4110.01.000.000 Seasonal Salaries ‐ ‐ ‐ ‐ ‐ ‐ ‐ ‐ ‐ ‐ 0.0%502.4125.01.000.000 Admin. P/R Taxes‐ Social Security/Medicare 75 100 103 74 71 56 479 1,976 1,976 1,498 75.8%502.4125.01.100.000 Seasonal Admin P/R Taxes‐Soc Sec/Med ‐ ‐ ‐ ‐ ‐ ‐ ‐ ‐ ‐ ‐ 0.0%502.4125.02.000.000 Admin. P/R Taxes‐ ‐SUI 9 ‐ 8 ‐ ‐ ‐ 17 230 230 213 92.6%502.4125.02.100.000 Seasonal P/R Taxes‐SUI ‐ ‐ ‐ ‐ ‐ ‐ ‐ ‐ ‐ ‐ 0.0%502.4125.04.000.000 Admin. Retirement 176 207 241 191 164 155 1,134 4,190 4,190 3,056 72.9%502.4125.04.100.000 Seasonal Admin Retirement ‐ ‐ ‐ ‐ ‐ ‐ ‐ ‐ ‐ ‐ 0.0%502.4125.05.000.000 Admin. Wokers Comp 23 ‐ 138 ‐ ‐ 98 259 801 801 542 67.7%502.4125.05.100.000 Seasonal Admin. Workers Comp ‐ ‐ ‐ ‐ ‐ ‐ ‐ ‐ ‐ ‐ 0.0%502.4125.06.000.000 Admin. Comp. Abs. ‐ ‐ ‐ ‐ ‐ ‐ ‐ ‐ ‐ ‐ 0.0%502.4140.00.000.000 Training 10 ‐ ‐ ‐ ‐ ‐ 10 1,100 (175) 925 915 98.9%502.4150.00.000.000 Travel ‐ Ops 30 51 35 35 12 12 173 700 700 527 75.3%502.4150.01.000.000 Travel ‐ Admin ‐ ‐ ‐ ‐ ‐ ‐ ‐ 200 200 200 100.0%502.4170.00.000.000 Legal ‐ ‐ ‐ ‐ ‐ ‐ ‐ ‐ ‐ ‐ 0.0%502.4170.10.000.000 Professional Services ‐ ‐ ‐ ‐ ‐ ‐ ‐ 1,800 1,800 1,800 100.0%502.4171.00.000.000 Auditing ‐ ‐ 587 ‐ ‐ ‐ 587 1,250 175 1,425 838 58.8%502.4172.00.000.000 Accounting Fees ‐ ‐ ‐ ‐ ‐ ‐ ‐ ‐ ‐ ‐ 0.0%502.4173.00.000.000 Public Relations Expense ‐ ‐ ‐ ‐ ‐ ‐ ‐ ‐ ‐ ‐ 0.0%502.4190.00.000.000 YCH Contract Mgmt Fee 4,668 4,668 4,668 4,668 4,668 4,668 28,008 55,712 55,712 27,704 49.7%502.4190.01.000.000 Office Supplies ‐ ‐ 2 6 ‐ 26 34 1,100 1,100 1,066 96.9%502.4190.02.000.000 Household Supplies ‐ ‐ ‐ ‐ ‐ ‐ ‐ ‐ ‐ ‐ 0.0%502.4190.03.000.000 Telephone 104 168 165 570 246 220 1,473 2,500 2,500 1,027 41.1%502.4190.04.000.000 Other Misc. Costs ‐ 60 ‐ 1,624 (2,345) ‐ (662) 1,000 3,925 4,925 5,587 113.4%502.4190.05.000.000 Membership & Dues ‐ ‐ ‐ ‐ ‐ ‐ ‐ ‐ ‐ ‐ 0.0%502.4190.06.000.000 Auto Maintenance / Repairs ‐ 32 ‐ ‐ ‐ ‐ 32 1,000 1,000 968 96.8%502.4190.07.000.000 Gas / Oil 119 137 5 166 117 ‐ 544 2,400 2,400 1,856 77.3%502.4190.08.000.000 Minor Equip. Repair 1 ‐ ‐ ‐ ‐ ‐ 1 500 500 499 99.8%502.4190.09.000.000 Major Equip repair/Maint ‐ ‐ ‐ ‐ ‐ ‐ ‐ ‐ ‐ ‐ 0.0%502.4190.10.000.000 Computer Software Chgs. ‐ ‐ ‐ ‐ ‐ ‐ ‐ ‐ ‐ ‐ 0.0%502.4190.11.000.000 Office Equipment ‐ ‐ ‐ ‐ 99 21 120 ‐ ‐ (120) 0.0%502.4190.18.000.000 Taxes, Assessments & Fees ‐ ‐ ‐ ‐ ‐ ‐ ‐ 400 400 400 100.0%502.4310.00.000.000 Water 3,387 3,387 3,387 3,387 3,387 3,387 20,322 48,500 (7,000) 41,500 21,178 51.0%502.4320.00.000.000 Electricity 5,943 6,114 7,577 3,456 1,924 1,323 26,337 41,000 41,000 14,663 35.8%502.4330.00.000.000 Gas 2,243 1,123 1,769 1,091 928 ‐ 7,153 22,000 22,000 14,847 67.5%502.4390.00.000.000 Sewerage 4,398 4,398 4,398 4,398 4,398 4,398 26,388 52,500 52,500 26,112 49.7%502.4401.00.000.000 IT Services 375 500 125 ‐ 125 250 1,375 3,000 3,000 1,625 54.2%502.4410.00.000.000 Maintenance Salaries 4,156 3,892 5,970 3,892 4,126 3,628 25,663 50,241 50,241 24,577 48.9%502.4410.01.000.000 Maintenace Salaries Temp ‐ ‐ ‐ ‐ ‐ ‐ ‐ ‐ ‐ ‐ 0.0%502.4415.01.000.000 Maintenance P/R Taxes‐ Social Security/Medi 251 231 356 231 249 211 1,528 3,840 3,840 2,312 60.2%502.4415.02.000.000 Maintenance P/R Taxes‐ ‐SUI ‐ ‐ ‐ ‐ ‐ ‐ ‐ 434 434 434 100.0%502.4415.03.000.000 Maintenance P/R Taxes ‐ FUTA ‐ ‐ ‐ ‐ ‐ ‐ ‐ ‐ ‐ ‐ 0.0%502.4415.04.000.000 Maintenance Retirement 593 593 890 593 593 593 3,856 8,142 8,142 4,285 52.6%502.4415.05.000.000 Maintenance Workers Comp 418 ‐ 409 ‐ ‐ 1,525 2,352 5,287 5,287 2,934 55.5%502.4415.06.000.000 Maintenance Comp. Abs. ‐ ‐ ‐ ‐ ‐ ‐ ‐ ‐ ‐ ‐ 0.0%502.4420.00.000.000 Maintenance Supplies ‐ ‐ 73 ‐ ‐ ‐ 73 ‐ ‐ (73) 0.0%502.4420.05.000.000 Lumber and Hardware ‐ ‐ ‐ ‐ ‐ ‐ ‐ 4,900 4,900 4,900 100.0%502.4430.00.000.000 Maintenance Contracts ‐ ‐ ‐ ‐ ‐ ‐ ‐ 500 500 500 100.0%502.4430.01.000.000 Water Well Maintenance ‐ ‐ ‐ ‐ ‐ ‐ ‐ ‐ ‐ ‐ 0.0%
Agenda Packet Page 53
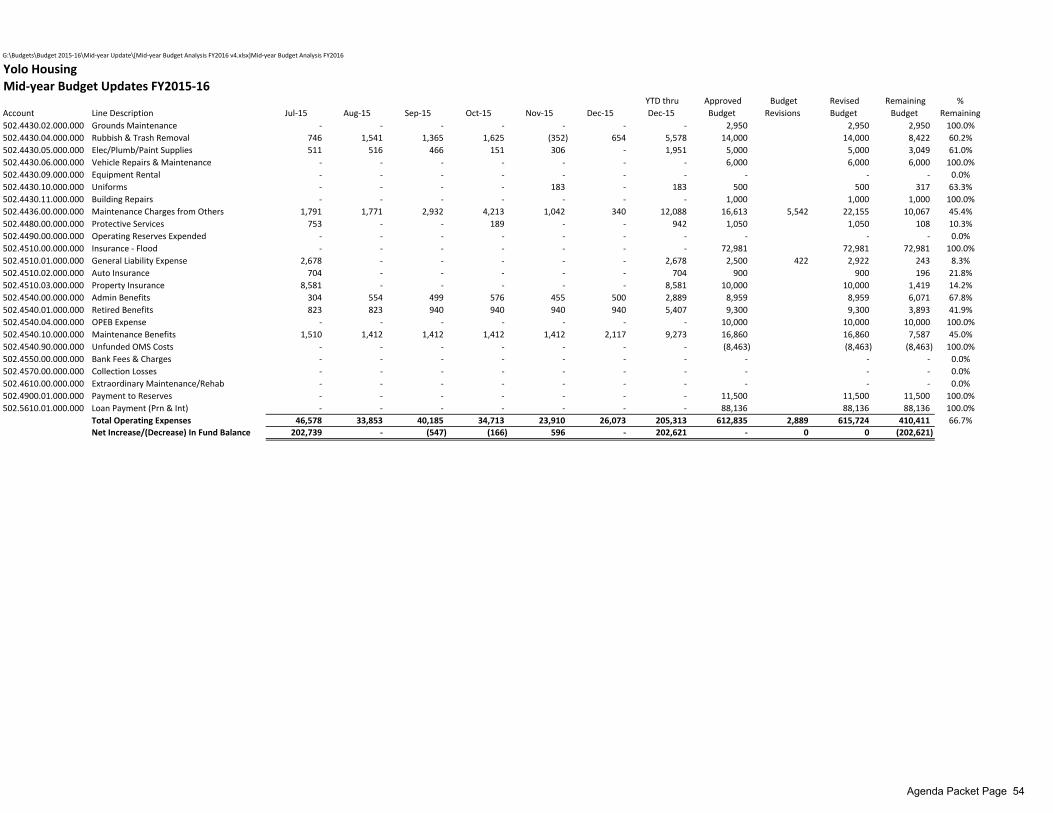
G:\Budgets\Budget 2015‐16\Mid‐year Update\[Mid‐year Budget Analysis FY2016 v4.xlsx]Mid‐year Budget Analysis FY2016
Yolo HousingMid‐year Budget Updates FY2015‐16
Account Line Description Jul‐15 Aug‐15 Sep‐15 Oct‐15 Nov‐15 Dec‐15 YTD thru Dec‐15
Approved Budget
Budget Revisions
Revised Budget
Remaining Budget
% Remaining
502.4430.02.000.000 Grounds Maintenance ‐ ‐ ‐ ‐ ‐ ‐ ‐ 2,950 2,950 2,950 100.0%502.4430.04.000.000 Rubbish & Trash Removal 746 1,541 1,365 1,625 (352) 654 5,578 14,000 14,000 8,422 60.2%502.4430.05.000.000 Elec/Plumb/Paint Supplies 511 516 466 151 306 ‐ 1,951 5,000 5,000 3,049 61.0%502.4430.06.000.000 Vehicle Repairs & Maintenance ‐ ‐ ‐ ‐ ‐ ‐ ‐ 6,000 6,000 6,000 100.0%502.4430.09.000.000 Equipment Rental ‐ ‐ ‐ ‐ ‐ ‐ ‐ ‐ ‐ ‐ 0.0%502.4430.10.000.000 Uniforms ‐ ‐ ‐ ‐ 183 ‐ 183 500 500 317 63.3%502.4430.11.000.000 Building Repairs ‐ ‐ ‐ ‐ ‐ ‐ ‐ 1,000 1,000 1,000 100.0%502.4436.00.000.000 Maintenance Charges from Others 1,791 1,771 2,932 4,213 1,042 340 12,088 16,613 5,542 22,155 10,067 45.4%502.4480.00.000.000 Protective Services 753 ‐ ‐ 189 ‐ ‐ 942 1,050 1,050 108 10.3%502.4490.00.000.000 Operating Reserves Expended ‐ ‐ ‐ ‐ ‐ ‐ ‐ ‐ ‐ ‐ 0.0%502.4510.00.000.000 Insurance ‐ Flood ‐ ‐ ‐ ‐ ‐ ‐ ‐ 72,981 72,981 72,981 100.0%502.4510.01.000.000 General Liability Expense 2,678 ‐ ‐ ‐ ‐ ‐ 2,678 2,500 422 2,922 243 8.3%502.4510.02.000.000 Auto Insurance 704 ‐ ‐ ‐ ‐ ‐ 704 900 900 196 21.8%502.4510.03.000.000 Property Insurance 8,581 ‐ ‐ ‐ ‐ ‐ 8,581 10,000 10,000 1,419 14.2%502.4540.00.000.000 Admin Benefits 304 554 499 576 455 500 2,889 8,959 8,959 6,071 67.8%502.4540.01.000.000 Retired Benefits 823 823 940 940 940 940 5,407 9,300 9,300 3,893 41.9%502.4540.04.000.000 OPEB Expense ‐ ‐ ‐ ‐ ‐ ‐ ‐ 10,000 10,000 10,000 100.0%502.4540.10.000.000 Maintenance Benefits 1,510 1,412 1,412 1,412 1,412 2,117 9,273 16,860 16,860 7,587 45.0%502.4540.90.000.000 Unfunded OMS Costs ‐ ‐ ‐ ‐ ‐ ‐ ‐ (8,463) (8,463) (8,463) 100.0%502.4550.00.000.000 Bank Fees & Charges ‐ ‐ ‐ ‐ ‐ ‐ ‐ ‐ ‐ ‐ 0.0%502.4570.00.000.000 Collection Losses ‐ ‐ ‐ ‐ ‐ ‐ ‐ ‐ ‐ ‐ 0.0%502.4610.00.000.000 Extraordinary Maintenance/Rehab ‐ ‐ ‐ ‐ ‐ ‐ ‐ ‐ ‐ ‐ 0.0%502.4900.01.000.000 Payment to Reserves ‐ ‐ ‐ ‐ ‐ ‐ ‐ 11,500 11,500 11,500 100.0%502.5610.01.000.000 Loan Payment (Prn & Int) ‐ ‐ ‐ ‐ ‐ ‐ ‐ 88,136 88,136 88,136 100.0%
Total Operating Expenses 46,578 33,853 40,185 34,713 23,910 26,073 205,313 612,835 2,889 615,724 410,411 66.7%Net Increase/(Decrease) In Fund Balance 202,739 ‐ (547) (166) 596 ‐ 202,621 ‐ 0 0 (202,621)
Agenda Packet Page 54
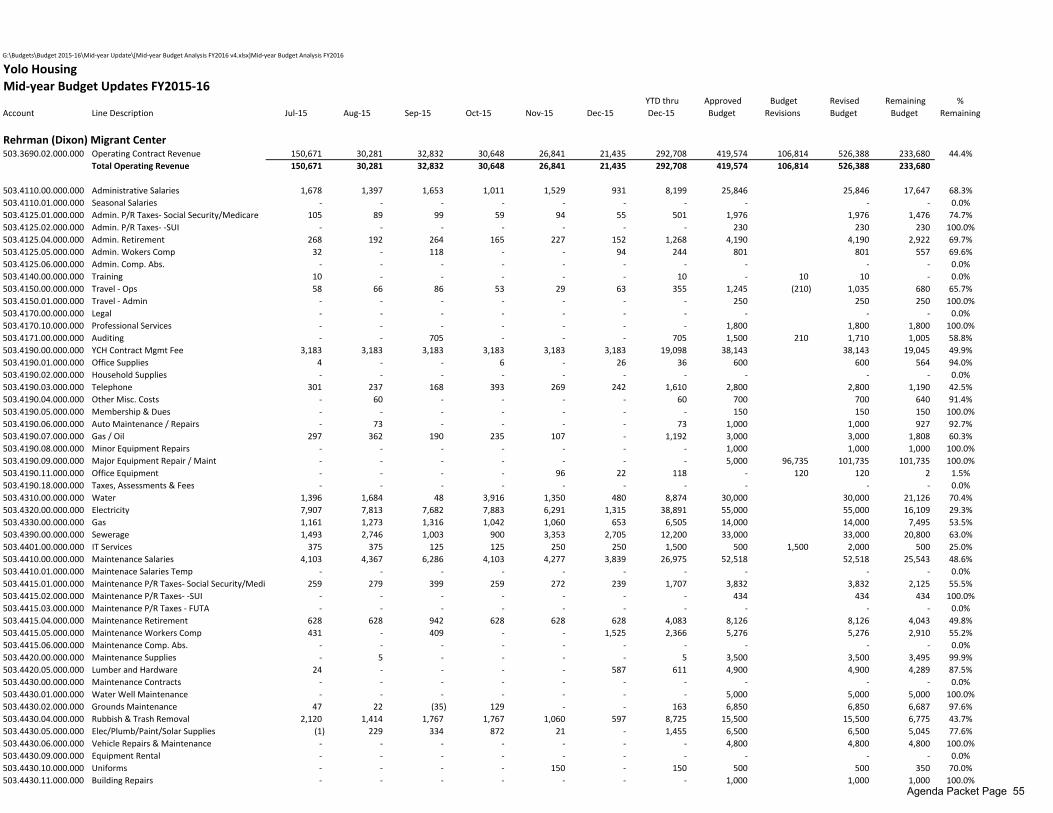
G:\Budgets\Budget 2015‐16\Mid‐year Update\[Mid‐year Budget Analysis FY2016 v4.xlsx]Mid‐year Budget Analysis FY2016
Yolo HousingMid‐year Budget Updates FY2015‐16
Account Line Description Jul‐15 Aug‐15 Sep‐15 Oct‐15 Nov‐15 Dec‐15 YTD thru Dec‐15
Approved Budget
Budget Revisions
Revised Budget
Remaining Budget
% Remaining
Rehrman (Dixon) Migrant Center503.3690.02.000.000 Operating Contract Revenue 150,671 30,281 32,832 30,648 26,841 21,435 292,708 419,574 106,814 526,388 233,680 44.4%
Total Operating Revenue 150,671 30,281 32,832 30,648 26,841 21,435 292,708 419,574 106,814 526,388 233,680
503.4110.00.000.000 Administrative Salaries 1,678 1,397 1,653 1,011 1,529 931 8,199 25,846 25,846 17,647 68.3%503.4110.01.000.000 Seasonal Salaries ‐ ‐ ‐ ‐ ‐ ‐ ‐ ‐ ‐ ‐ 0.0%503.4125.01.000.000 Admin. P/R Taxes‐ Social Security/Medicare 105 89 99 59 94 55 501 1,976 1,976 1,476 74.7%503.4125.02.000.000 Admin. P/R Taxes‐ ‐SUI ‐ ‐ ‐ ‐ ‐ ‐ ‐ 230 230 230 100.0%503.4125.04.000.000 Admin. Retirement 268 192 264 165 227 152 1,268 4,190 4,190 2,922 69.7%503.4125.05.000.000 Admin. Wokers Comp 32 ‐ 118 ‐ ‐ 94 244 801 801 557 69.6%503.4125.06.000.000 Admin. Comp. Abs. ‐ ‐ ‐ ‐ ‐ ‐ ‐ ‐ ‐ ‐ 0.0%503.4140.00.000.000 Training 10 ‐ ‐ ‐ ‐ ‐ 10 ‐ 10 10 ‐ 0.0%503.4150.00.000.000 Travel ‐ Ops 58 66 86 53 29 63 355 1,245 (210) 1,035 680 65.7%503.4150.01.000.000 Travel ‐ Admin ‐ ‐ ‐ ‐ ‐ ‐ ‐ 250 250 250 100.0%503.4170.00.000.000 Legal ‐ ‐ ‐ ‐ ‐ ‐ ‐ ‐ ‐ ‐ 0.0%503.4170.10.000.000 Professional Services ‐ ‐ ‐ ‐ ‐ ‐ ‐ 1,800 1,800 1,800 100.0%503.4171.00.000.000 Auditing ‐ ‐ 705 ‐ ‐ ‐ 705 1,500 210 1,710 1,005 58.8%503.4190.00.000.000 YCH Contract Mgmt Fee 3,183 3,183 3,183 3,183 3,183 3,183 19,098 38,143 38,143 19,045 49.9%503.4190.01.000.000 Office Supplies 4 ‐ ‐ 6 ‐ 26 36 600 600 564 94.0%503.4190.02.000.000 Household Supplies ‐ ‐ ‐ ‐ ‐ ‐ ‐ ‐ ‐ ‐ 0.0%503.4190.03.000.000 Telephone 301 237 168 393 269 242 1,610 2,800 2,800 1,190 42.5%503.4190.04.000.000 Other Misc. Costs ‐ 60 ‐ ‐ ‐ ‐ 60 700 700 640 91.4%503.4190.05.000.000 Membership & Dues ‐ ‐ ‐ ‐ ‐ ‐ ‐ 150 150 150 100.0%503.4190.06.000.000 Auto Maintenance / Repairs ‐ 73 ‐ ‐ ‐ ‐ 73 1,000 1,000 927 92.7%503.4190.07.000.000 Gas / Oil 297 362 190 235 107 ‐ 1,192 3,000 3,000 1,808 60.3%503.4190.08.000.000 Minor Equipment Repairs ‐ ‐ ‐ ‐ ‐ ‐ ‐ 1,000 1,000 1,000 100.0%503.4190.09.000.000 Major Equipment Repair / Maint ‐ ‐ ‐ ‐ ‐ ‐ ‐ 5,000 96,735 101,735 101,735 100.0%503.4190.11.000.000 Office Equipment ‐ ‐ ‐ ‐ 96 22 118 ‐ 120 120 2 1.5%503.4190.18.000.000 Taxes, Assessments & Fees ‐ ‐ ‐ ‐ ‐ ‐ ‐ ‐ ‐ ‐ 0.0%503.4310.00.000.000 Water 1,396 1,684 48 3,916 1,350 480 8,874 30,000 30,000 21,126 70.4%503.4320.00.000.000 Electricity 7,907 7,813 7,682 7,883 6,291 1,315 38,891 55,000 55,000 16,109 29.3%503.4330.00.000.000 Gas 1,161 1,273 1,316 1,042 1,060 653 6,505 14,000 14,000 7,495 53.5%503.4390.00.000.000 Sewerage 1,493 2,746 1,003 900 3,353 2,705 12,200 33,000 33,000 20,800 63.0%503.4401.00.000.000 IT Services 375 375 125 125 250 250 1,500 500 1,500 2,000 500 25.0%503.4410.00.000.000 Maintenance Salaries 4,103 4,367 6,286 4,103 4,277 3,839 26,975 52,518 52,518 25,543 48.6%503.4410.01.000.000 Maintenace Salaries Temp ‐ ‐ ‐ ‐ ‐ ‐ ‐ ‐ ‐ ‐ 0.0%503.4415.01.000.000 Maintenance P/R Taxes‐ Social Security/Medi 259 279 399 259 272 239 1,707 3,832 3,832 2,125 55.5%503.4415.02.000.000 Maintenance P/R Taxes‐ ‐SUI ‐ ‐ ‐ ‐ ‐ ‐ ‐ 434 434 434 100.0%503.4415.03.000.000 Maintenance P/R Taxes ‐ FUTA ‐ ‐ ‐ ‐ ‐ ‐ ‐ ‐ ‐ ‐ 0.0%503.4415.04.000.000 Maintenance Retirement 628 628 942 628 628 628 4,083 8,126 8,126 4,043 49.8%503.4415.05.000.000 Maintenance Workers Comp 431 ‐ 409 ‐ ‐ 1,525 2,366 5,276 5,276 2,910 55.2%503.4415.06.000.000 Maintenance Comp. Abs. ‐ ‐ ‐ ‐ ‐ ‐ ‐ ‐ ‐ ‐ 0.0%503.4420.00.000.000 Maintenance Supplies ‐ 5 ‐ ‐ ‐ ‐ 5 3,500 3,500 3,495 99.9%503.4420.05.000.000 Lumber and Hardware 24 ‐ ‐ ‐ ‐ 587 611 4,900 4,900 4,289 87.5%503.4430.00.000.000 Maintenance Contracts ‐ ‐ ‐ ‐ ‐ ‐ ‐ ‐ ‐ ‐ 0.0%503.4430.01.000.000 Water Well Maintenance ‐ ‐ ‐ ‐ ‐ ‐ ‐ 5,000 5,000 5,000 100.0%503.4430.02.000.000 Grounds Maintenance 47 22 (35) 129 ‐ ‐ 163 6,850 6,850 6,687 97.6%503.4430.04.000.000 Rubbish & Trash Removal 2,120 1,414 1,767 1,767 1,060 597 8,725 15,500 15,500 6,775 43.7%503.4430.05.000.000 Elec/Plumb/Paint/Solar Supplies (1) 229 334 872 21 ‐ 1,455 6,500 6,500 5,045 77.6%503.4430.06.000.000 Vehicle Repairs & Maintenance ‐ ‐ ‐ ‐ ‐ ‐ ‐ 4,800 4,800 4,800 100.0%503.4430.09.000.000 Equipment Rental ‐ ‐ ‐ ‐ ‐ ‐ ‐ ‐ ‐ ‐ 0.0%503.4430.10.000.000 Uniforms ‐ ‐ ‐ ‐ 150 ‐ 150 500 500 350 70.0%503.4430.11.000.000 Building Repairs ‐ ‐ ‐ ‐ ‐ ‐ ‐ 1,000 1,000 1,000 100.0%
Agenda Packet Page 55
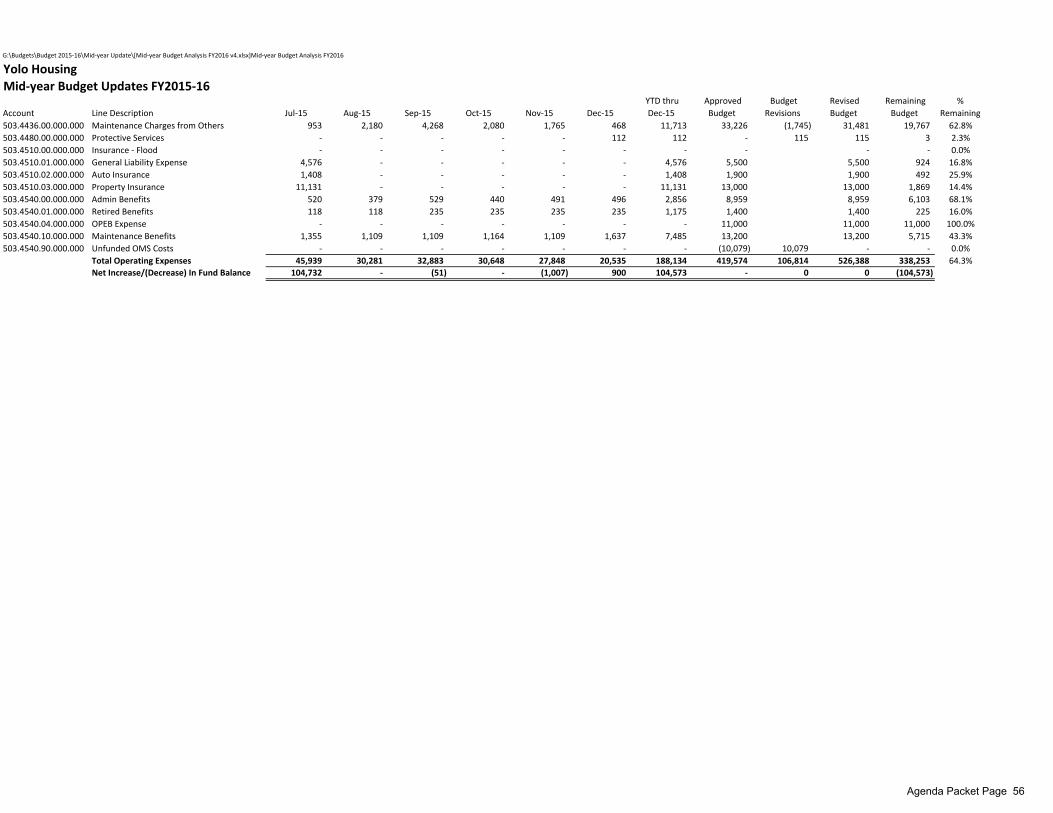
G:\Budgets\Budget 2015‐16\Mid‐year Update\[Mid‐year Budget Analysis FY2016 v4.xlsx]Mid‐year Budget Analysis FY2016
Yolo HousingMid‐year Budget Updates FY2015‐16
Account Line Description Jul‐15 Aug‐15 Sep‐15 Oct‐15 Nov‐15 Dec‐15 YTD thru Dec‐15
Approved Budget
Budget Revisions
Revised Budget
Remaining Budget
% Remaining
503.4436.00.000.000 Maintenance Charges from Others 953 2,180 4,268 2,080 1,765 468 11,713 33,226 (1,745) 31,481 19,767 62.8%503.4480.00.000.000 Protective Services ‐ ‐ ‐ ‐ ‐ 112 112 ‐ 115 115 3 2.3%503.4510.00.000.000 Insurance ‐ Flood ‐ ‐ ‐ ‐ ‐ ‐ ‐ ‐ ‐ ‐ 0.0%503.4510.01.000.000 General Liability Expense 4,576 ‐ ‐ ‐ ‐ ‐ 4,576 5,500 5,500 924 16.8%503.4510.02.000.000 Auto Insurance 1,408 ‐ ‐ ‐ ‐ ‐ 1,408 1,900 1,900 492 25.9%503.4510.03.000.000 Property Insurance 11,131 ‐ ‐ ‐ ‐ ‐ 11,131 13,000 13,000 1,869 14.4%503.4540.00.000.000 Admin Benefits 520 379 529 440 491 496 2,856 8,959 8,959 6,103 68.1%503.4540.01.000.000 Retired Benefits 118 118 235 235 235 235 1,175 1,400 1,400 225 16.0%503.4540.04.000.000 OPEB Expense ‐ ‐ ‐ ‐ ‐ ‐ ‐ 11,000 11,000 11,000 100.0%503.4540.10.000.000 Maintenance Benefits 1,355 1,109 1,109 1,164 1,109 1,637 7,485 13,200 13,200 5,715 43.3%503.4540.90.000.000 Unfunded OMS Costs ‐ ‐ ‐ ‐ ‐ ‐ ‐ (10,079) 10,079 ‐ ‐ 0.0%
Total Operating Expenses 45,939 30,281 32,883 30,648 27,848 20,535 188,134 419,574 106,814 526,388 338,253 64.3%Net Increase/(Decrease) In Fund Balance 104,732 ‐ (51) ‐ (1,007) 900 104,573 ‐ 0 0 (104,573)
Agenda Packet Page 56
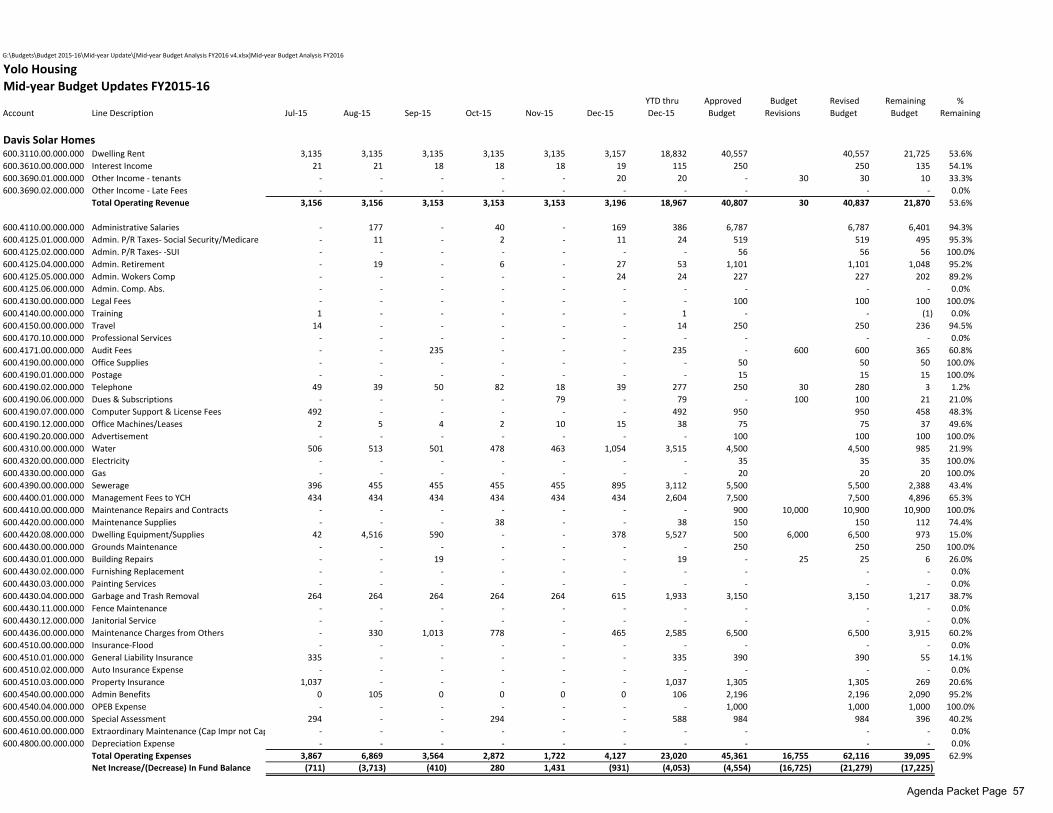
G:\Budgets\Budget 2015‐16\Mid‐year Update\[Mid‐year Budget Analysis FY2016 v4.xlsx]Mid‐year Budget Analysis FY2016
Yolo HousingMid‐year Budget Updates FY2015‐16
Account Line Description Jul‐15 Aug‐15 Sep‐15 Oct‐15 Nov‐15 Dec‐15 YTD thru Dec‐15
Approved Budget
Budget Revisions
Revised Budget
Remaining Budget
% Remaining
Davis Solar Homes600.3110.00.000.000 Dwelling Rent 3,135 3,135 3,135 3,135 3,135 3,157 18,832 40,557 40,557 21,725 53.6%600.3610.00.000.000 Interest Income 21 21 18 18 18 19 115 250 250 135 54.1%600.3690.01.000.000 Other Income ‐ tenants ‐ ‐ ‐ ‐ ‐ 20 20 ‐ 30 30 10 33.3%600.3690.02.000.000 Other Income ‐ Late Fees ‐ ‐ ‐ ‐ ‐ ‐ ‐ ‐ ‐ ‐ 0.0%
Total Operating Revenue 3,156 3,156 3,153 3,153 3,153 3,196 18,967 40,807 30 40,837 21,870 53.6%
600.4110.00.000.000 Administrative Salaries ‐ 177 ‐ 40 ‐ 169 386 6,787 6,787 6,401 94.3%600.4125.01.000.000 Admin. P/R Taxes‐ Social Security/Medicare ‐ 11 ‐ 2 ‐ 11 24 519 519 495 95.3%600.4125.02.000.000 Admin. P/R Taxes‐ ‐SUI ‐ ‐ ‐ ‐ ‐ ‐ ‐ 56 56 56 100.0%600.4125.04.000.000 Admin. Retirement ‐ 19 ‐ 6 ‐ 27 53 1,101 1,101 1,048 95.2%600.4125.05.000.000 Admin. Wokers Comp ‐ ‐ ‐ ‐ ‐ 24 24 227 227 202 89.2%600.4125.06.000.000 Admin. Comp. Abs. ‐ ‐ ‐ ‐ ‐ ‐ ‐ ‐ ‐ ‐ 0.0%600.4130.00.000.000 Legal Fees ‐ ‐ ‐ ‐ ‐ ‐ ‐ 100 100 100 100.0%600.4140.00.000.000 Training 1 ‐ ‐ ‐ ‐ ‐ 1 ‐ ‐ (1) 0.0%600.4150.00.000.000 Travel 14 ‐ ‐ ‐ ‐ ‐ 14 250 250 236 94.5%600.4170.10.000.000 Professional Services ‐ ‐ ‐ ‐ ‐ ‐ ‐ ‐ ‐ ‐ 0.0%600.4171.00.000.000 Audit Fees ‐ ‐ 235 ‐ ‐ ‐ 235 ‐ 600 600 365 60.8%600.4190.00.000.000 Office Supplies ‐ ‐ ‐ ‐ ‐ ‐ ‐ 50 50 50 100.0%600.4190.01.000.000 Postage ‐ ‐ ‐ ‐ ‐ ‐ ‐ 15 15 15 100.0%600.4190.02.000.000 Telephone 49 39 50 82 18 39 277 250 30 280 3 1.2%600.4190.06.000.000 Dues & Subscriptions ‐ ‐ ‐ ‐ 79 ‐ 79 ‐ 100 100 21 21.0%600.4190.07.000.000 Computer Support & License Fees 492 ‐ ‐ ‐ ‐ ‐ 492 950 950 458 48.3%600.4190.12.000.000 Office Machines/Leases 2 5 4 2 10 15 38 75 75 37 49.6%600.4190.20.000.000 Advertisement ‐ ‐ ‐ ‐ ‐ ‐ ‐ 100 100 100 100.0%600.4310.00.000.000 Water 506 513 501 478 463 1,054 3,515 4,500 4,500 985 21.9%600.4320.00.000.000 Electricity ‐ ‐ ‐ ‐ ‐ ‐ ‐ 35 35 35 100.0%600.4330.00.000.000 Gas ‐ ‐ ‐ ‐ ‐ ‐ ‐ 20 20 20 100.0%600.4390.00.000.000 Sewerage 396 455 455 455 455 895 3,112 5,500 5,500 2,388 43.4%600.4400.01.000.000 Management Fees to YCH 434 434 434 434 434 434 2,604 7,500 7,500 4,896 65.3%600.4410.00.000.000 Maintenance Repairs and Contracts ‐ ‐ ‐ ‐ ‐ ‐ ‐ 900 10,000 10,900 10,900 100.0%600.4420.00.000.000 Maintenance Supplies ‐ ‐ ‐ 38 ‐ ‐ 38 150 150 112 74.4%600.4420.08.000.000 Dwelling Equipment/Supplies 42 4,516 590 ‐ ‐ 378 5,527 500 6,000 6,500 973 15.0%600.4430.00.000.000 Grounds Maintenance ‐ ‐ ‐ ‐ ‐ ‐ ‐ 250 250 250 100.0%600.4430.01.000.000 Building Repairs ‐ ‐ 19 ‐ ‐ ‐ 19 ‐ 25 25 6 26.0%600.4430.02.000.000 Furnishing Replacement ‐ ‐ ‐ ‐ ‐ ‐ ‐ ‐ ‐ ‐ 0.0%600.4430.03.000.000 Painting Services ‐ ‐ ‐ ‐ ‐ ‐ ‐ ‐ ‐ ‐ 0.0%600.4430.04.000.000 Garbage and Trash Removal 264 264 264 264 264 615 1,933 3,150 3,150 1,217 38.7%600.4430.11.000.000 Fence Maintenance ‐ ‐ ‐ ‐ ‐ ‐ ‐ ‐ ‐ ‐ 0.0%600.4430.12.000.000 Janitorial Service ‐ ‐ ‐ ‐ ‐ ‐ ‐ ‐ ‐ ‐ 0.0%600.4436.00.000.000 Maintenance Charges from Others ‐ 330 1,013 778 ‐ 465 2,585 6,500 6,500 3,915 60.2%600.4510.00.000.000 Insurance‐Flood ‐ ‐ ‐ ‐ ‐ ‐ ‐ ‐ ‐ ‐ 0.0%600.4510.01.000.000 General Liability Insurance 335 ‐ ‐ ‐ ‐ ‐ 335 390 390 55 14.1%600.4510.02.000.000 Auto Insurance Expense ‐ ‐ ‐ ‐ ‐ ‐ ‐ ‐ ‐ ‐ 0.0%600.4510.03.000.000 Property Insurance 1,037 ‐ ‐ ‐ ‐ ‐ 1,037 1,305 1,305 269 20.6%600.4540.00.000.000 Admin Benefits 0 105 0 0 0 0 106 2,196 2,196 2,090 95.2%600.4540.04.000.000 OPEB Expense ‐ ‐ ‐ ‐ ‐ ‐ ‐ 1,000 1,000 1,000 100.0%600.4550.00.000.000 Special Assessment 294 ‐ ‐ 294 ‐ ‐ 588 984 984 396 40.2%600.4610.00.000.000 Extraordinary Maintenance (Cap Impr not Cap ‐ ‐ ‐ ‐ ‐ ‐ ‐ ‐ ‐ ‐ 0.0%600.4800.00.000.000 Depreciation Expense ‐ ‐ ‐ ‐ ‐ ‐ ‐ ‐ ‐ ‐ 0.0%
Total Operating Expenses 3,867 6,869 3,564 2,872 1,722 4,127 23,020 45,361 16,755 62,116 39,095 62.9%Net Increase/(Decrease) In Fund Balance (711) (3,713) (410) 280 1,431 (931) (4,053) (4,554) (16,725) (21,279) (17,225)
Agenda Packet Page 57
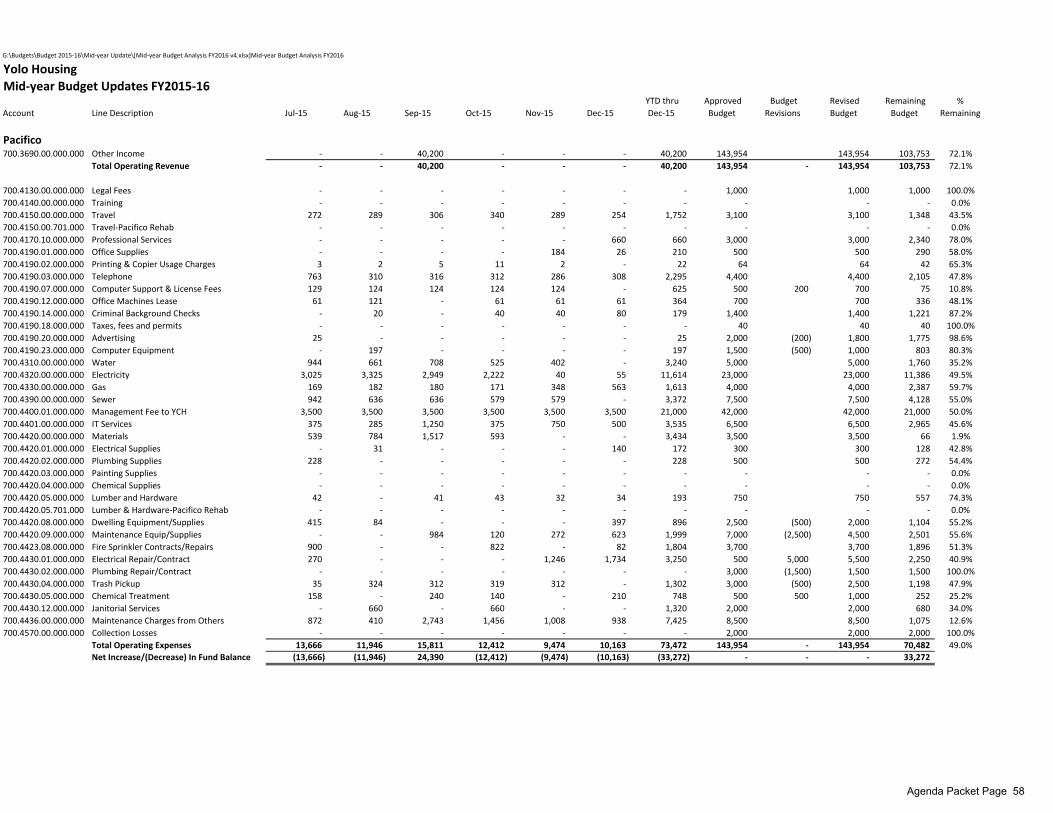
G:\Budgets\Budget 2015‐16\Mid‐year Update\[Mid‐year Budget Analysis FY2016 v4.xlsx]Mid‐year Budget Analysis FY2016
Yolo HousingMid‐year Budget Updates FY2015‐16
Account Line Description Jul‐15 Aug‐15 Sep‐15 Oct‐15 Nov‐15 Dec‐15 YTD thru Dec‐15
Approved Budget
Budget Revisions
Revised Budget
Remaining Budget
% Remaining
Pacifico 700.3690.00.000.000 Other Income ‐ ‐ 40,200 ‐ ‐ ‐ 40,200 143,954 143,954 103,753 72.1%
Total Operating Revenue ‐ ‐ 40,200 ‐ ‐ ‐ 40,200 143,954 ‐ 143,954 103,753 72.1%
700.4130.00.000.000 Legal Fees ‐ ‐ ‐ ‐ ‐ ‐ ‐ 1,000 1,000 1,000 100.0%700.4140.00.000.000 Training ‐ ‐ ‐ ‐ ‐ ‐ ‐ ‐ ‐ ‐ 0.0%700.4150.00.000.000 Travel 272 289 306 340 289 254 1,752 3,100 3,100 1,348 43.5%700.4150.00.701.000 Travel‐Pacifico Rehab ‐ ‐ ‐ ‐ ‐ ‐ ‐ ‐ ‐ ‐ 0.0%700.4170.10.000.000 Professional Services ‐ ‐ ‐ ‐ ‐ 660 660 3,000 3,000 2,340 78.0%700.4190.01.000.000 Office Supplies ‐ ‐ ‐ ‐ 184 26 210 500 500 290 58.0%700.4190.02.000.000 Printing & Copier Usage Charges 3 2 5 11 2 ‐ 22 64 64 42 65.3%700.4190.03.000.000 Telephone 763 310 316 312 286 308 2,295 4,400 4,400 2,105 47.8%700.4190.07.000.000 Computer Support & License Fees 129 124 124 124 124 ‐ 625 500 200 700 75 10.8%700.4190.12.000.000 Office Machines Lease 61 121 ‐ 61 61 61 364 700 700 336 48.1%700.4190.14.000.000 Criminal Background Checks ‐ 20 ‐ 40 40 80 179 1,400 1,400 1,221 87.2%700.4190.18.000.000 Taxes, fees and permits ‐ ‐ ‐ ‐ ‐ ‐ ‐ 40 40 40 100.0%700.4190.20.000.000 Advertising 25 ‐ ‐ ‐ ‐ ‐ 25 2,000 (200) 1,800 1,775 98.6%700.4190.23.000.000 Computer Equipment ‐ 197 ‐ ‐ ‐ ‐ 197 1,500 (500) 1,000 803 80.3%700.4310.00.000.000 Water 944 661 708 525 402 ‐ 3,240 5,000 5,000 1,760 35.2%700.4320.00.000.000 Electricity 3,025 3,325 2,949 2,222 40 55 11,614 23,000 23,000 11,386 49.5%700.4330.00.000.000 Gas 169 182 180 171 348 563 1,613 4,000 4,000 2,387 59.7%700.4390.00.000.000 Sewer 942 636 636 579 579 ‐ 3,372 7,500 7,500 4,128 55.0%700.4400.01.000.000 Management Fee to YCH 3,500 3,500 3,500 3,500 3,500 3,500 21,000 42,000 42,000 21,000 50.0%700.4401.00.000.000 IT Services 375 285 1,250 375 750 500 3,535 6,500 6,500 2,965 45.6%700.4420.00.000.000 Materials 539 784 1,517 593 ‐ ‐ 3,434 3,500 3,500 66 1.9%700.4420.01.000.000 Electrical Supplies ‐ 31 ‐ ‐ ‐ 140 172 300 300 128 42.8%700.4420.02.000.000 Plumbing Supplies 228 ‐ ‐ ‐ ‐ ‐ 228 500 500 272 54.4%700.4420.03.000.000 Painting Supplies ‐ ‐ ‐ ‐ ‐ ‐ ‐ ‐ ‐ ‐ 0.0%700.4420.04.000.000 Chemical Supplies ‐ ‐ ‐ ‐ ‐ ‐ ‐ ‐ ‐ ‐ 0.0%700.4420.05.000.000 Lumber and Hardware 42 ‐ 41 43 32 34 193 750 750 557 74.3%700.4420.05.701.000 Lumber & Hardware‐Pacifico Rehab ‐ ‐ ‐ ‐ ‐ ‐ ‐ ‐ ‐ ‐ 0.0%700.4420.08.000.000 Dwelling Equipment/Supplies 415 84 ‐ ‐ ‐ 397 896 2,500 (500) 2,000 1,104 55.2%700.4420.09.000.000 Maintenance Equip/Supplies ‐ ‐ 984 120 272 623 1,999 7,000 (2,500) 4,500 2,501 55.6%700.4423.08.000.000 Fire Sprinkler Contracts/Repairs 900 ‐ ‐ 822 ‐ 82 1,804 3,700 3,700 1,896 51.3%700.4430.01.000.000 Electrical Repair/Contract 270 ‐ ‐ ‐ 1,246 1,734 3,250 500 5,000 5,500 2,250 40.9%700.4430.02.000.000 Plumbing Repair/Contract ‐ ‐ ‐ ‐ ‐ ‐ ‐ 3,000 (1,500) 1,500 1,500 100.0%700.4430.04.000.000 Trash Pickup 35 324 312 319 312 ‐ 1,302 3,000 (500) 2,500 1,198 47.9%700.4430.05.000.000 Chemical Treatment 158 ‐ 240 140 ‐ 210 748 500 500 1,000 252 25.2%700.4430.12.000.000 Janitorial Services ‐ 660 ‐ 660 ‐ ‐ 1,320 2,000 2,000 680 34.0%700.4436.00.000.000 Maintenance Charges from Others 872 410 2,743 1,456 1,008 938 7,425 8,500 8,500 1,075 12.6%700.4570.00.000.000 Collection Losses ‐ ‐ ‐ ‐ ‐ ‐ ‐ 2,000 2,000 2,000 100.0%
Total Operating Expenses 13,666 11,946 15,811 12,412 9,474 10,163 73,472 143,954 ‐ 143,954 70,482 49.0%Net Increase/(Decrease) In Fund Balance (13,666) (11,946) 24,390 (12,412) (9,474) (10,163) (33,272) ‐ ‐ ‐ 33,272
Agenda Packet Page 58
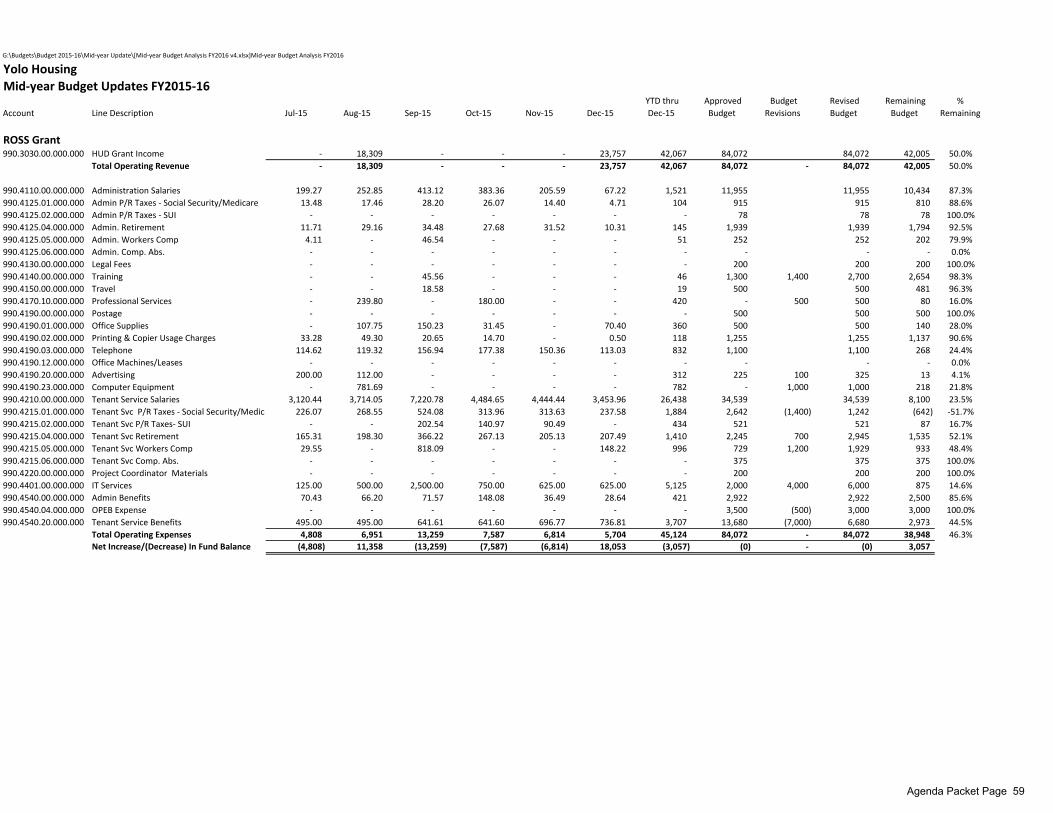
G:\Budgets\Budget 2015‐16\Mid‐year Update\[Mid‐year Budget Analysis FY2016 v4.xlsx]Mid‐year Budget Analysis FY2016
Yolo HousingMid‐year Budget Updates FY2015‐16
Account Line Description Jul‐15 Aug‐15 Sep‐15 Oct‐15 Nov‐15 Dec‐15 YTD thru Dec‐15
Approved Budget
Budget Revisions
Revised Budget
Remaining Budget
% Remaining
ROSS Grant990.3030.00.000.000 HUD Grant Income ‐ 18,309 ‐ ‐ ‐ 23,757 42,067 84,072 84,072 42,005 50.0%
Total Operating Revenue ‐ 18,309 ‐ ‐ ‐ 23,757 42,067 84,072 ‐ 84,072 42,005 50.0%
990.4110.00.000.000 Administration Salaries 199.27 252.85 413.12 383.36 205.59 67.22 1,521 11,955 11,955 10,434 87.3%990.4125.01.000.000 Admin P/R Taxes ‐ Social Security/Medicare 13.48 17.46 28.20 26.07 14.40 4.71 104 915 915 810 88.6%990.4125.02.000.000 Admin P/R Taxes ‐ SUI ‐ ‐ ‐ ‐ ‐ ‐ ‐ 78 78 78 100.0%990.4125.04.000.000 Admin. Retirement 11.71 29.16 34.48 27.68 31.52 10.31 145 1,939 1,939 1,794 92.5%990.4125.05.000.000 Admin. Workers Comp 4.11 ‐ 46.54 ‐ ‐ ‐ 51 252 252 202 79.9%990.4125.06.000.000 Admin. Comp. Abs. ‐ ‐ ‐ ‐ ‐ ‐ ‐ ‐ ‐ ‐ 0.0%990.4130.00.000.000 Legal Fees ‐ ‐ ‐ ‐ ‐ ‐ ‐ 200 200 200 100.0%990.4140.00.000.000 Training ‐ ‐ 45.56 ‐ ‐ ‐ 46 1,300 1,400 2,700 2,654 98.3%990.4150.00.000.000 Travel ‐ ‐ 18.58 ‐ ‐ ‐ 19 500 500 481 96.3%990.4170.10.000.000 Professional Services ‐ 239.80 ‐ 180.00 ‐ ‐ 420 ‐ 500 500 80 16.0%990.4190.00.000.000 Postage ‐ ‐ ‐ ‐ ‐ ‐ ‐ 500 500 500 100.0%990.4190.01.000.000 Office Supplies ‐ 107.75 150.23 31.45 ‐ 70.40 360 500 500 140 28.0%990.4190.02.000.000 Printing & Copier Usage Charges 33.28 49.30 20.65 14.70 ‐ 0.50 118 1,255 1,255 1,137 90.6%990.4190.03.000.000 Telephone 114.62 119.32 156.94 177.38 150.36 113.03 832 1,100 1,100 268 24.4%990.4190.12.000.000 Office Machines/Leases ‐ ‐ ‐ ‐ ‐ ‐ ‐ ‐ ‐ ‐ 0.0%990.4190.20.000.000 Advertising 200.00 112.00 ‐ ‐ ‐ ‐ 312 225 100 325 13 4.1%990.4190.23.000.000 Computer Equipment ‐ 781.69 ‐ ‐ ‐ ‐ 782 ‐ 1,000 1,000 218 21.8%990.4210.00.000.000 Tenant Service Salaries 3,120.44 3,714.05 7,220.78 4,484.65 4,444.44 3,453.96 26,438 34,539 34,539 8,100 23.5%990.4215.01.000.000 Tenant Svc P/R Taxes ‐ Social Security/Medica 226.07 268.55 524.08 313.96 313.63 237.58 1,884 2,642 (1,400) 1,242 (642) ‐51.7%990.4215.02.000.000 Tenant Svc P/R Taxes‐ SUI ‐ ‐ 202.54 140.97 90.49 ‐ 434 521 521 87 16.7%990.4215.04.000.000 Tenant Svc Retirement 165.31 198.30 366.22 267.13 205.13 207.49 1,410 2,245 700 2,945 1,535 52.1%990.4215.05.000.000 Tenant Svc Workers Comp 29.55 ‐ 818.09 ‐ ‐ 148.22 996 729 1,200 1,929 933 48.4%990.4215.06.000.000 Tenant Svc Comp. Abs. ‐ ‐ ‐ ‐ ‐ ‐ ‐ 375 375 375 100.0%990.4220.00.000.000 Project Coordinator Materials ‐ ‐ ‐ ‐ ‐ ‐ ‐ 200 200 200 100.0%990.4401.00.000.000 IT Services 125.00 500.00 2,500.00 750.00 625.00 625.00 5,125 2,000 4,000 6,000 875 14.6%990.4540.00.000.000 Admin Benefits 70.43 66.20 71.57 148.08 36.49 28.64 421 2,922 2,922 2,500 85.6%990.4540.04.000.000 OPEB Expense ‐ ‐ ‐ ‐ ‐ ‐ ‐ 3,500 (500) 3,000 3,000 100.0%990.4540.20.000.000 Tenant Service Benefits 495.00 495.00 641.61 641.60 696.77 736.81 3,707 13,680 (7,000) 6,680 2,973 44.5%
Total Operating Expenses 4,808 6,951 13,259 7,587 6,814 5,704 45,124 84,072 ‐ 84,072 38,948 46.3%Net Increase/(Decrease) In Fund Balance (4,808) 11,358 (13,259) (7,587) (6,814) 18,053 (3,057) (0) ‐ (0) 3,057
Agenda Packet Page 59
Regular 11.
Yolo County HousingMeeting Date: 05/11/2016
InformationSUBJECTSelect Meeting Date in June 2016 (Baker)
AttachmentsStaff Report
Form ReviewForm Started By: Julie Dachtler Started On: 05/06/2016 03:36 PMFinal Approval Date: 05/06/2016
Agenda Packet Page 60
Yolo County Housing
Lisa A. Baker, Chief Executive Officer
147 W. Main Street Woodland: (530) 6625428
WOODLAND, CA 95695 Sacramento: (916) 4448982
TTY: (800) 5451833, ext. 626
DATE: May 3, 2016 TO: YCH Housing Commission FROM: Lisa A. Baker, Chief Executive Officer SUBJECT: Set Meeting Date In June 2016 RECOMMENDED ACTIONS: That the Housing Commissioners: 1. Approve a meeting date for the Housing Commission for June 2016 BACKGROUND/DISCUSSION As the Agency continues to work towards creation of the new Joint Powers Agency (JPA) entity, YCH will need a June meeting in order to meet its federal obligations to adopt a budget prior to July 1, 2016. Potential dates that could be available are the following:
June 9 anytime from 2 p.m. on June 15 same as above June 16 same as above June 22 same June 23 same June 29 same June 30 same
Agenda Packet Page 61
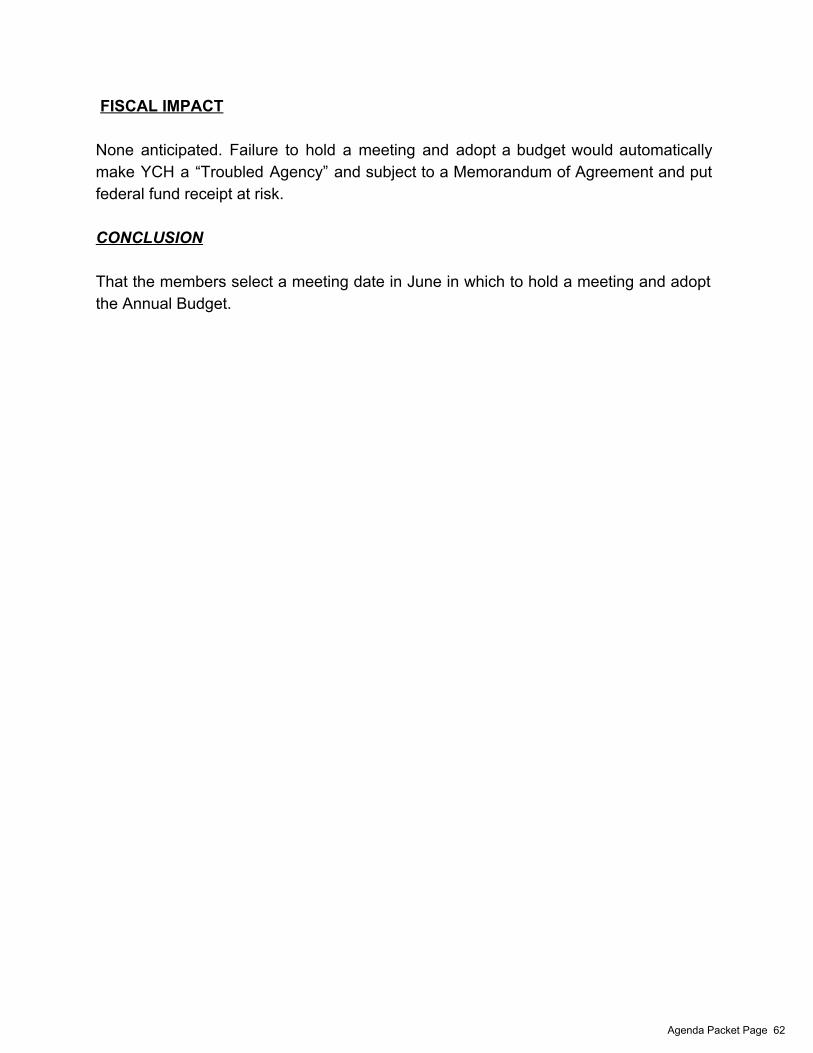
FISCAL IMPACT None anticipated. Failure to hold a meeting and adopt a budget would automatically make YCH a “Troubled Agency” and subject to a Memorandum of Agreement and put federal fund receipt at risk. CONCLUSION That the members select a meeting date in June in which to hold a meeting and adopt the Annual Budget.
Agenda Packet Page 62