yomo - the arduino-based smart metering board
TRANSCRIPT

YoMo - The Arduino-based Smart Metering
Board
Christoph Klemenjak, Dominik Egarter, and Wilfried ElmenreichInstitute of Networked and Embedded SystemsAlpen-Adria-Universitat Klagenfurt, Austria
{name.surname}@aau.at
Abstract
Smart meters are an enabling technology for many smart grid applica-tions. This paper introduces a design for a low-cost smart meter systemas well as the fundamentals of smart metering. The smart meter platform,provided as open hardware, is designed with a connector interface compati-ble to the Arduino platform, thus opening the possibilities for smart meterswith flexible hardware and computation features, starting from low-cost8 bit micro controllers up to powerful single board computers that canrun Linux. The metering platform features a current transformer whichallows a non-intrusive installation of the current measurement unit. Thesuggested design can switch loads, offers a variable sampling frequency,and provides measurement data such as active power, reactive and appar-ent power. Results indicate that measurement accuracy and resolutionof the proposed metering platform are sufficient for a range of differentapplications and loads from a few watts up to five kilowatts.
1 Introduction
A smart meter is an electronic device that records consumption of energy inregular intervals and makes that information available to its stakeholders by anetwork interface. A smart meter enables the possibility to provide immediatefeedback on one’s energy consumption, greatly reduces the effort of reading themeter value, increases the grid state awareness, supports the introduction of time-based energy tariffs, and possibly supports a quick access for switching on/offthe energy flow. Besides as a device used for energy billing by utility companies,smart meters can also become a central component in future, autonomous energysystems, e.g., a smart microgrid [1] with local energy production that needs tobe monitored and coordinated.
In order to support these applications, there is a need for a metering unitthat is able to monitor measurement quantities such as voltage, current, activeand reactive power. The power consumption of the metering device itself shouldbe low in order to save energy consumption, provide reasonable run-time with
1
arX
iv:1
409.
3404
v1 [
cs.O
H]
11
Sep
2014

batteries and to restrict measurement interference the device is powered by thesame grid that is measured. The device should provide an adjustable samplingfrequency in order to support long-time measurements (with a low samplefrequency in order to reduce the number of measurements to be stored) as wellas high sample frequencies for device detection mechanisms based on signalprocessing algorithms [2]. Many applications such as remote or timed control ofdevices or load shedding require also the possibility of switching the connectedload on or off. Such a smart meter will be equipped with a local processing unitfor processing and storing measured data and a communication unit allowingremote access to the measurement data and an access to configuration andmaintenance interfaces [3]. While commercial smart meters are typically closedsystems with a well-defined but limited range of applications, we aim at designingan open and low-cost metering device which is adaptable for different purposes.The device firmware and application software will be published as open source(GNU-license - GPLv3), while the hardware design will be made available undera free documentation license (Common Creative license CC-BY-4.01).
In this paper, we present the design of a smart meter which fulfils therequirements stated above. Our smart meter2, You Only Measure Once (YoMo),is provided as a shield, i.e., an extension, for an Arduino microcontroller board.The metering shield contains a measurement unit, circuitry for galvanic isolationfrom the measured circuit, signal conditioning and measurement hardware.The designed PCB3 can be attached and used together with different Arduinofootprint-compatible boards. The provided smart meter designed should not be areplacement for existing smart meters installed in homes. It should be a possibledevelopment platform for industry and academics to introduce, to develop andto test future smart metering applications with the possibility to measure severalhousehold’s power demand parameters on different power levels starting onappliance level demand going up to the household demand. In a comparison ofexisting open-source metering solutions we show that our proposed design has aunique set of useful features. After introducing the rationale behind the YoModesign, we present its application in a low-cost energy monitoring system featuringdistributed measurement architecture featuring a YoMo/Arduino componenttogether with a more performant Raspberry Pi embedded computer which isused to store and to present the measurement in a graphical user interfaceprovided by a small webserver. An evaluation of the measurement accuracy andexperiences with the YoMo board in the energy monitoring application haveshown promising results for the applicability of our low-cost smart meter.
2 Related Work
As smart metering is one of the key points for the future smart grid and the wayto improve energy awareness of homes, several commercial products monitoring
1http://creativecommons.org/licenses/by/4.0/2http://yomo.sourceforge.net3PCB - printed circuit board
2

the homes energy consumption exist. Examples are Wattson4, CurrentCost5 orTED6 power meters. These solutions provide measurements of the householdpower demand whereas Plugwise7 or KillAWatt8 are monitoring on applianceor socket level. These commercial products are typically very limited in itsapplicability, lacking in sense of variability of the measurement frequency,adaptability and programmability.
Additionally, there exist a few, non-commercial open-source metering so-lutions such as the open-energy-monitor9. This monitoring solution offers anopen-source metering solution, where the monitoring shield is operated eitherwith an Arduino board or individually. The metering unit communicates itsmeasurement to a central station which can be for example a Raspberry Pi. Onthe central station a visualization tool can be installed to show the measurementin real-time. Unfortunately, the OEM only provides active and apparent power,uses non-common smart home communication technology and cannot switchdevices on or off. Recent research concentrates on building an open-source smartmeter and power monitoring unit. Popular examples therefore are ACMe [4]from Berkeley and Plug from the MIT [5]. More recent metering solutions are thecheap smart meter (CSM) [6], the SmartMETER.Kom [7] and the AMMeter[8]stressing several aspects similar to YoMo. In Table 1 a review on open-sourceand research smart meters are presented and compared to the proposed YoMometering approach. Distinctive features are the used communication methods,the measured quantities, the number of measurable devices/connections, theswitch-ability, the sampling frequency of the measurements, the way the powercalculations are performed, the open-source and open-hardware availability, ifthe board is Arduino-based and the approximated costs of the metering unit.
4http://wattson.ch/5http://www.currentcost.com/6http://www.theenergydetective.com/7http://www.plugwise.com/8http://www.p3international.com/products/p4400.html9http://openenergymonitor.org/emon/
3

CSM
OEM
AMMeter
ACme-A
ACme-a
SmartMeter.K
om
YoMo
Com
munication
Ethernet
SUB
1GHz
xZigBee
ZigBee
ZigBee
Wi-Fi
Measurement
P,Q
,S,I,V
,EP/S
IP/Q/S
SI,V
P,Q
,S,I,V
,ENumber
ofCon
nection
s1
312
11
11
Intrusiveness
-√
√x
x-
xSwitchab
lex
xx
√√
√√
Sam
plingFrequency
-variable
1Hz
1Hz
variable
-variable
Pow
ercalculation
hardware
software
software
hardware
software
-hardware
Open-sou
rce
x√
√√
√x
√
Arduino-based
√√
√x
xx
√
Approxim
ated
costs
e100
e55
xx
xx
e65
Tab
le1:
Com
parisonofexistingopen-sourceandresearchmeteringsolutions
4

3 Smart Metering Concepts at a Glance
A smart meter consists of different units such as the used metering approach,how safety of the meter is achieved, how attached connections can be switchedand how data between the smart meter and user can be communicated. Thesemain components with its variations and possibilities are presented and discussedin the following section.
3.1 Voltage and Current Sensing
To calculate reactive and active power for a connected load, three physicalquantities are required: the voltage, u, the current, i, and the phase shiftbetween them, ϕui. The voltage can be easily determined using a voltagetransformer or a voltage divider feed into a ADC10 input or energy monitoringIC. Numerous current measurement methods exist but with most of them acompromise has to be made between resolution and accuracy. These can bedivided into two kinds where the current either is transformed into a useful scaleor another physical quantity. A current along a wire invokes a voltage drop and amagnetic field around/inside the wire. A possible sensing technique is the currentshunt resistor. The voltage drop across the shunt is used as a proportionalmeasure of the current flow. Resistors incur a power loss proportional to thesquare of the current [9]. The best proved and most applied methods build onthe magnetic field principle [10]. An advantage of this method is the galvanicisolation between input and output of the current transformer, allowing thecircuit connected to the output to be made touch safe: One possibility areMagnetoresistant (MR) materials changing their electrical resistance when amagnetic field is applied to them. This effect is not linear and is temperaturedependent, which makes it complicated to use for a wide current range. Anadditional error source is remanent magnetization, which limits the dynamic DCrange. Using a bridge configuration consisting of multiple sensors, it is possibleto compensate for this unwanted behaviour. This method is used to measurecurrents up to 50A. Typical measurement errors with this method are 0.3% [11].A further possibility is the Hall effect describing the production of a voltagesignal across an electrical conductor. The current signal is applied to a magneticcore. The resulting core flux is sensed by the Hall element, which is placedin the magnetic core. This setup is very similar to the current transformer,with the difference being that the flux sensing is done by a transformer windinginstead of the Hall element. Remanent magnetization in the sensor is a sourceof error here. The final possibility is the Current transformer method exploitingFaraday‘s law of induction. The current signal is converted to a useful scaleby a transformer with an appropriate gear ratio. Further processing is done byICs or logic. The phase shift, φui, is defined as φui = φu − φi and can also beexpressed as the time shift between voltage and current. Sensing circuits suchas phase-locked loops [12] or numerical methods such as the cross-correlation
10ADC - analog digital converter
5

are used to estimate this quantity.
3.2 Power Calculation
A typical feature of a smart metering system is to determine the power at a loadand monitor the energy consumption over time. In Section 3.1 we discussedin detail how to obtain information about current, voltage, and the time shiftbetween them. From these parameters we can derive the following physicalquantities:
• Active power: PW = URMS · IRMS · cos(φui)
• Reactive power: PB = URMS · IRMS · sin(φui)
• Apparent power, PS = URMS · IRMS
These definitions show that the root mean square (RMS) values for currentand voltage as well as the phase shift between them have to be determined.The simplest way to implement RMS sensing is done by multiplying the peakamplitude with the crest factor, defined by iRMS =
√2 · i for a sinusoidal signal.
This method is imprecise when the signal deviates from a steady-state sinusoidalsignal.Monitoring energy consumption over a given interval T = [t0, t1] with step sizeTs = 1
fscan be implemented by approximating the integration of power over
time.
E =
∫ t1
t0
P (t)dt ∼t1∑
i=t0
P (i) · Ts
The resolution is highly dependent on the sampling frequency, fs, which has tobe well-chosen because every load’s time behaviour differs. Therefore, the sensinglogic should dynamically adapt the sampling frequency due to a connected load.For a near-constant load, the sampling frequency could be set very low, butnot less than 100Hz due to the Nyquist-Shannon sampling theorem. A smallersampling frequency results in a smart meter with a smaller energy consumptionbecause in this inoperational state, a further step would include setting the wholesensing logic to sleep mode in order to save energy.
3.3 Galvanic Isolation
An important aspect in grid metering is isolation between the grids groundpotential and the ground potential of the metering circuit. The occurrence ofhigh voltage peaks or ground loops may destroy the whole setup. Integratingtransformers or transducers into the measurement circuit is a popular and well-proven way to achieve this isolation. The optical coupler is used for galvanicisolation between integrated circuits. Consisting of a light-emitting diode at theinput and a phototransistor at the output, it uses light to transmit electricalsignals and has a very small form factor.
6

In terms of current measurement some setups such as the current transformer,Hall effect sensors, or MR sensors already provide galvanic isolation. In contrast,the shunt method does have the grid’s ground electrically connected to themeasurement unit, which makes the approach less safe. Voltage sensing setupsare usually implemented using a voltage divider. A transducer between voltagedivider and grid potential seems to be the best way to achieve galvanic isolation.
3.4 Load Switching
The ability to switch a connected load on and off has become an importantrequirement for smart meters. Loads can be switched remotely by the smartmeter, which allows scheduling jobs at times when the energy price is lower. Theruntime of high-power appliances is moved to periods with the lowest energyprice to help consumers reduce their electricity bill. Load switching is achievedby inserting solid state relays or conventional relays into the current path ofthe load. These electrical parts have special inputs that can be driven by amicrocontroller or any other smart device.
A conventional CEE 7/4 Schuko plug socket does not have a well-definedline and neutral layout. Therefore, a potential load switching implementationmust switch both circuits: line and neutral wire.
3.5 Communication Unit
An important aspect of a state-of-the-art smart meter is its capability to commu-nicate. To ensure this need, modern smart meters offer a wired (e.g., power linecommunication, fieldbuses) or wireless (ZigBee, WLAN, cellular communication)communication possibilities. Possible technologies mainly differ on its data rates,transmission range, frequency bands and number of plugged nodes.In the contextof homes, ZigBee or WLAN are preferable technologies because of their low costand simplicity for integration.
4 YoMo Smart Meter
According to Section 3 presenting the main parts of a smart meter, we presentin the following our design choices for the proposed metering approach.
• Relay: An essential requirement for a smart metering system has becomethe ability to switch the load’s state on and off. The upcoming questionhere is either to assemble a solid state relay or a mechanical one. Indeedheating up is an influential factor for this decision. The current flow inthe device leads to dissipation power. In a solid state relay this poweris about 2.5W , which leads to the device heating up and hence requiresa heat sink. This heat sink, of course, needs also to be mounted on theshield and requires additional space. The forward current of a conventionalsolid state relay is about 20mA11 and therefore about five times smaller
11Sharp S216S02 Series
7

than the forward current of a mechanical relay. The big advantage ofa mechanical relay is the ability to switch currents up to 20A, whichcovers all single-phase household devices. For this reason we integrated amechanical relay in our design. This relay is driven by one of the Arduinosanalog outputs. Unfortunately the forward current is about 100mA, so therelay consumes a half Watt. The resulting advantage is that we are ableto switch phase and neutral conductor at the same time. Both, mechanicaland solid state relay, can be controlled by the Arduino’s analog output.This output integrated in the firmware enables the user to control theconnected load via the Raspberry Pi’s homepage.
• Sensors: For estimating the energy consumption two electrical quantitieshave to be determined: voltage and current. Voltage measurement iseasily implemented by a voltage divider. The big problem here is that thepotential forwarded to the energy monitor is not galvanically isolated fromthe grids potential. An efficient solution provides the isolation amplifier.Connected to the smaller dividers resistor he outputs a galvanically iso-lated signal that is in phase with the input. The differential output of theisolation amplifier is connected to the energy monitors input channel.Numerous sensors for estimating the current flow exist. To meet the chal-lenge metering currents from mA range up to 20A only a few technologiesare utilisable. Our metering shield is equipped with a current transformer.A current transformer outputs a galvanically isolated signal and thereforesuits our concept. This signal is scaled down and forwarded to the energymonitor.
• Energy monitor: An energy monitor is an integrated circuit responsiblefor calculating physical quantities such as active power, reactive power andapparent power from given input signals. Our metering shield contains theADE7753 chip. This chip is connected to the isolation amplifier, currenttransformer, and the Arduino UNO board. This IC calculates all necessaryelectrical quantities such as the consumed energy of the connected loadfrom the signals provided by the connected sensors. As necessary electricalquantities we defined: VRMS , IRMS , reactive power, active power, andapparent power. These quantities are sampled due to the given samplingfrequency that is provided to the system by the user. The estimated valuesare written to registers inside the ADE7753. These registers are read outby the Arduino board via serial communication such as SPI.
• Arduino UNO board: The used Arduino board is not part of ourmetering shield, but enumerating it here helps to understand the interactionof the systems components. The metering component is indeed the meteringshield, which is connected to the Arduino via serial communication andother control signals. Our design concept does not depend on a certainArduino board. Since the Arduino UNO has the smallest form factor andthe lowest price this choice is reasonable. The Arduino’s first task is toread out register values of the energy monitor to a given sample interval
8

and forward the estimated data to the coordination device. The secondtask is to parse incoming commands from the coordination device and torun them. The implemented command set includes commands to switchthe connected load, set the energy monitor to sleep and wake it, and toadjust the sampling frequency.
The YoMo board described as a system overview, unsoldered PCB board andequipped PCB Board are presented in Figure 2.
5 YoMo enabled Smart Meter System
Beside the introduction of the YoMo metering shield, we aimed at a systemthat combines low-cost hardware that fulfills requirements such as real-timemetering, providing data about active, reactive, apparent power, voltage andcurrent, switching connected circuits on and off, adjusting of the used samplingfrequency and the ability to display measured data to the user. Therefore we
A
R
D
U
I
N
O
Wi-FiShield
MeteringShield
R
A
S
P
B
E
R
R
Y
Webserver
JavaDaemon
Commands
Data
Figure 1: System overview: Arduino board and Raspberry Pi form the sys-tem. Arduino measures and forwards energy data. Raspberry Pi and receivescommands from Raspberry Pi.
chose the Arduino UNO as metering device and the Raspberry Pi as device tosupervise the metering process and display the estimated measurement data.Figure 1 summarizes our concept. This concept can be split up into 2 parts:
• Metering device (Arduino12): The first device described is the smartmeter itself, in our case the Arduino UNO board with its extension shields(Wi-Fi and Metering named YoMo). Electrical quantities such as the RMSvalues of current and voltage as well as the power quantities are estimatedto a given sampling frequency. Since the Arduino is equipped with anWi-Fi shield, we use the NTP13 service to timestamp our data. This data
12http://arduino.cc/13NTP - network time protocol
9
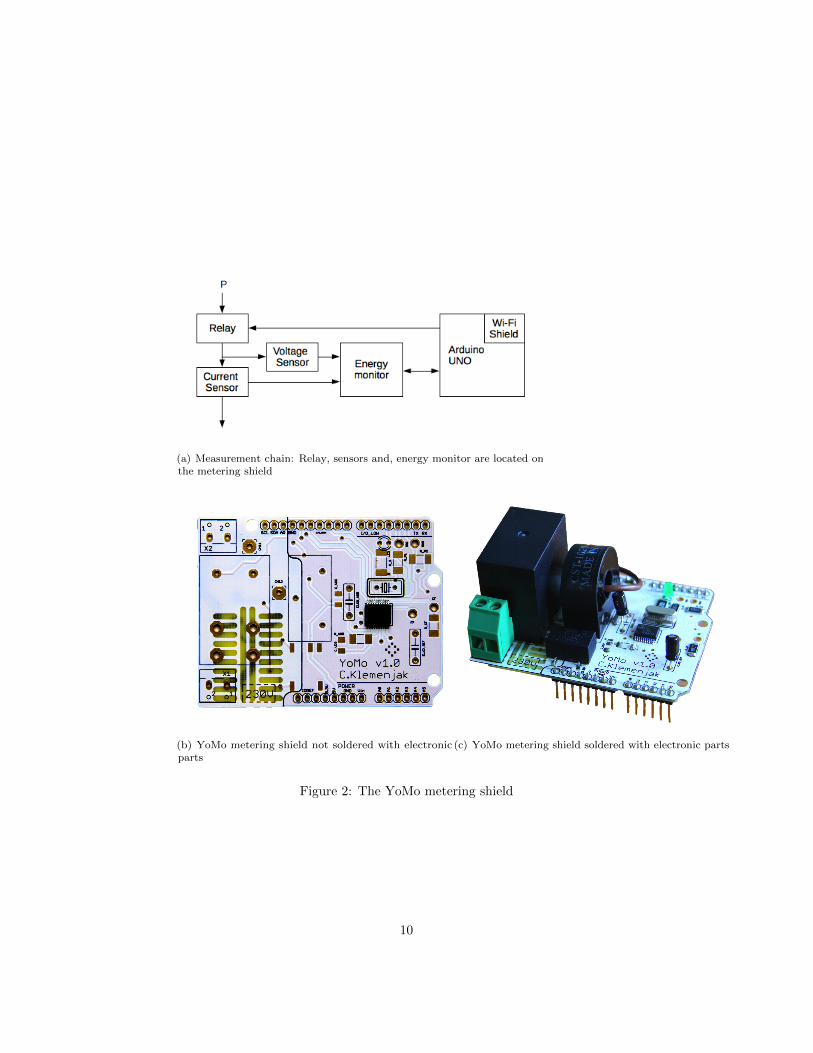
(a) Measurement chain: Relay, sensors and, energy monitor are located onthe metering shield
(b) YoMo metering shield not soldered with electronicparts
(c) YoMo metering shield soldered with electronic parts
Figure 2: The YoMo metering shield
10

is stored local on a SD card first and second being transmitted via Wi-Fi tothe coordination device. The program schedule contains a well-defined timewindow where the metering device checks if commands where transmittedfrom the coordination device. Depending on the command the meteringdevice switches the connected load on or off, enables/disables the energymonitor on the metering shield or adjusts the sampling frequency.
• Coordination device (Raspberry Pi14): The second device describedis the coordination device, in our case the Raspberry Pi. We developed aJava daemon that listens on a UDP15 port for incoming measurement datatransmitted by the metering device. These data is read, checked and savedwith a unique identifier. The coordination device runs a web server, onwhich the measurement data is accessible for every host, meaning personalcomputers, smartphones and tablets via a simple graphical user interface.The index page contains JavaScript elements which plot data about energyconsumption over time. Also embedded are control elements and an inputfield for the sampling frequency. These commands are caught by the Javadaemon and sent to the metering device. This way it is possible to controlthe metering system as well as the attached load(s) via a conventionalweb browser. The metering system supports multiple metering devices,so that a complete smart metering system may be formed with a centralcoordinator that gathers all data about energy consumption.
The centrepiece of a smart meter is the sensing unit that measures thedesired physical quantities. The implementation of this special unit varies frommeter to meter. The design is highly depending on the set requirements. Ourrequirements were to achieve galvanic isolation, the ability to meter currents upto 20A, to be switchable, to adjust the sampling frequency as well as to build anenergy monitor that estimates all energy quantities. With these design goals inmind we designed a Arduino-compatible metering shield, which is summarizedin Figure 2. This shield is independent on the used Arduino board and providesaccess to all estimated physical quantities via the SPI16 bus as well as access tothe built-in relay.
6 Case Studies
6.1 Measurement Accuracy
To evaluate the accuracy of the YoMo metering board, we measured the active,the reactive17 and the apparent power of different typical household appliancesand compared the results with measurements by the power measurement unit ofan isolating transformer (Block brs2200) which has an measurement accuracy
14http://www.raspberrypi.org/15UDP - user datagram protocol16SPI - serial peripheral interface17Only presented for appliances having a reactive power quantity
11

Household appliance Measured value Real value Errorrefrigerator 50 52 3.8 %ventilator 83 81 2.47 %convection oven 729 752 3.05 %water kettle 1910 1930 1.03 %radiant heater 1989 1980 0.51 %
Table 2: Active power measurement in [W]
Household appliance Measured value Real value Errorrefrigerator 95 99 4.04 %ventilator 85 88 3.4 %convection oven 734 753 2.5 %water kettle 1936 1940 0.2 %radiant heater 2049 2000 2.45 %
Table 3: Apparent power measurement in [VA]
of +/−3%. Table 2, 3 and 4 present the measured values by YoMo against thereference measurement unit and provides the measurement error for each device.According to the results, we claim that YoMo is providing sufficient accuracy tomonitor household appliances of a nominal power from a few watts up to somekilowatts.
6.2 Energy Monitoring System based on YoMo and Rasp-berry Pi
The general system overview of the Arduino board extended with YoMo andwith the Raspberry Pi acting as visualization and controlling unit is shown inFigure 3. It can be seen that on the Raspberry Pi a webserver is running whichis able to visualize current and historical measurement data. Via the websiteit is also possible to communicate with YoMo to either control the connecteddevice or to adjust the used sampling frequency. The sketched power draw isfrom a water kettle with a stated power demand of 2000W.
7 Future Work
One major topic is to tune the accuracy of the metering board by evaluating itsperformance with more accurate reference measurement units and controllableloads. To improve the proposed open-source smart metering approach one majortopic is it how to establish the connection to the quantity to be measured.It is possible to measure either an appliance or a group of appliances by asmart plug connection or to measure the whole household grid or circuits of
12

Household appliance Measured value Real value Errorventilator 39 36 8.3 %refrigerator 85 84 1.2 %
Table 4: Reactive power measurement in [var]
Figure 3: System overview of a simple home energy management system withthe Arduino board, the YoMo metering shield and Raspberry Pi
the grid by current terminals. Respectively, another aim for improving themeter is extending the board from a single-phase metering approach to a three-phase metering approach. For example, Austria, uses a three-phase systemin which the major appliance are driven with one phase, but appliances suchas a stove can be operated by three phases [13]. Finally, by adjusting thedesign in a way that YoMo can operate via standard interfaces such as SPI withother development boards such as the Raspberry Pi or BeagleBoard18 wouldimprove the applicability of board. YoMo could then be used as an extensionboard for application more computational demanding such as applications forNon-Intrusive Load Monitoring [2] and demand response issues.
18http://beagleboard.org/
13
8 Conclusion
In this paper a novel open source and open hardware metering approach hasbeen presented and discussed. We present how the proposed metering approachdiffers from other existing open-source and research metering approaches bydistinctive features such as the measured quantities, the number of measurableconnections/devices, the ability to switch loads, the used sampling frequency,etc. The introduced metering board, named as YoMo, is designed as an ArduinoShield which is able to measure electric quantities such as active power, reactivepower, apparent power, current and voltage and can switch appliances up to20A. We demonstrate a metering system including a Raspberry Pi acting as acoordination unit and web server to visualize the measured quantities and toprovide the possibility to switch the connected circuit and to adjust the usedsampling frequency. The YoMo metering approach was designed as open-sourceand open-hardware with the aim to design a low-cost smart meter which is botheasy to use and easy to extend and modify according to the current application.
9 Acknowledgments
This work was supported by Lakeside Labs GmbH, Klagenfurt, Austria andfunding from the European Regional Development Fund and the CarinthianEconomic Promotion Fund (KWF) under grant KWF-20214 | 22935 | 24445.
References
[1] A. Sobe and W. Elmenreich, ‘‘Smart microgrids: Overview and outlook,’’in Proceedings of the ITG INFORMATIK Workshop on Smart Grids,Braunschweig, Germany, Sep. 2012.
[2] D. Egarter, V. P. Bhuvana, and W. Elmenreich, ‘‘PALDi: Online loaddisaggregation via particle filtering,’’ IEEE Transactions on Instrumentationand Measurement (to appear), 2014.
[3] P. Peti, R. Obermaisser, W. Elmenreich, and T. Losert, ‘‘Anarchitecture supporting monitoring and configuration in real-time smarttransducer networks,’’ in Proceedings of the First IEEE InternationalConference on Sensors, 2, 2002, pp. 1479--1484. [Online]. Available:papers/2002/rr-19-2002.pdf
[4] X. Jiang, S. Dawson-Haggerty, P. Dutta, and D. Culler, ‘‘Designand implementation of a high-fidelity ac metering network,’’ inProceedings of the 2009 International Conference on InformationProcessing in Sensor Networks, ser. IPSN ’09. Washington, DC,USA: IEEE Computer Society, 2009, pp. 253--264. [Online]. Available:http://dl.acm.org/citation.cfm?id=1602165.1602189
14

[5] J. Lifton, M. Feldmeier, Y. Ono, C. Lewis, and J. Paradiso, ‘‘A platform forubiquitous sensor deployment in occupational and domestic environments,’’in Information Processing in Sensor Networks, 2007. IPSN 2007. 6thInternational Symposium on, April 2007, pp. 119--127.
[6] A.Ellerbrock, A. Abdel-Majeed, and S.Tenbohlen, ‘‘Design and building ofa cheap smart meter,’’ Institute of Power Transmission and High VoltageTechnology, University of Stuttgart, Tech. Rep., 2012.
[7] A. Reinhardt, D. Burkhardt, P. Mogre, M. Zaheer, and R. Steinmetz,‘‘Smartmeter.kom: A low-cost wireless sensor for distributed power meter-ing,’’ in Local Computer Networks (LCN), 2011 IEEE 36th Conference on,Oct 2011, pp. 1032--1039.
[8] S. Makonin, W. Sung, R. D. Cruz, B. Yarrow, B. Gill, F. Popowich, andI. V. Bajic, ‘‘Inspiring energy conservation through open source meteringhardware and embedded real-time load disaggregation,’’ in IEEE PES Asia-Pacific Power and Energy Engineering Conference (IEEE PES APPEEC2013), 2013.
[9] S. Ziegler, R. Woodward, H. Iu, and L. Borle, ‘‘Current sensing techniques:A review,’’ IEEE Sensors Journal, pp. 354--375, April 2009.
[10] H. Kirkham, ‘‘Current measurement methods for the smart grid,’’ in IEEEPower & Energy Society General Meeting (PES’09), Calgary, AB, Canada,Jul. 2009.
[11] P. Ripka, P. Kejic, P. Kaspar, and K. Draxler, ‘‘Precise DC current sensors,’’in IEEE Instr. and Meas. Tech. Conf., Brussels, Belgium, June 1996.
[12] R. Abhishek, R. Akshatha, N. Arjun, and N. Ashrith, ‘‘Measurement ofphase angle using PLL,’’ Visvesvaraya Technological University, Tech. Rep.,2012.
[13] A. Monacchi, W. Elmenreich, S. D’Alessandro, and A. Tonello, ‘‘Strategiesfor domestic energy conservation in carinthia and friuli-venezia giulia,’’ inIndustrial Electronics Society, IECON 2013 - 39th Annual Conference ofthe IEEE, Nov 2013, pp. 4791--4796.
15