yonkers public schools: final report - p-12 : nysed · yonkers is a suburban school district...
TRANSCRIPT
Yonkers Public Schools: Final Report
July 2006
1120 East Diehl Road, Suite 200 Naperville, IL 60563-1486 800-356-2735 630-649-6500www.learningpt.org
Copyright © 2006 Learning Point Associates. All rights reserved. This work was originally produced in whole or in part by Learning Point Associates with funds from the New York State Education Department (NYSED). The content does not necessarily reflect the position or policy of NYSED, nor does mention or visual representation of trade names, commercial products, or organizations imply endorsement. Learning Point Associates is a trademark of Learning Point Associates. 1181_06/06
Contents Page
Introduction......................................................................................................................................1
District Background.........................................................................................................................2
Overview....................................................................................................................................2
Student Academic Performance.................................................................................................2
District Strategies and Practices.................................................................................................3
District Resources ......................................................................................................................4
Theory of Action..............................................................................................................................7
Guiding Questions for the Audit......................................................................................................8
Audit Process Overview ..................................................................................................................9
Phase 1: Covisioning .................................................................................................................9
Phase 2: Data Collection and Analysis ......................................................................................9
Phase 3: Cointerpretation of Findings......................................................................................12
Phase 4: Action Planning.........................................................................................................13
Problem Statements .......................................................................................................................15
Problem Statement 1 ................................................................................................................15
Problem Statement 2 ................................................................................................................15
Problem Statement 3 ................................................................................................................16
Problem Statement 4 ................................................................................................................17
Problem Statement 5 ................................................................................................................17
Problem Statement 6 ................................................................................................................17
Recommendations for Action Planning .........................................................................................19
Recommendation 1 ..................................................................................................................19
Recommendation 2 ..................................................................................................................22
Recommendation 3 ..................................................................................................................26
Appendix. Data Maps ....................................................................................................................28
Introduction This interim report is the result of an audit of the written, taught, and tested mathematics curricula of the Yonkers Public Schools by Learning Point Associates. In mid-2005, eight school districts and the New York State Education Department (NYSED) commissioned this audit to fulfill an accountability requirement of the No Child Left Behind (NCLB) Act for local education agencies (LEAs) identified as districts in corrective action. These LEAs agreed, with the consent of NYSED, to collaborate on the implementation of this audit, which was intended to identify areas of concern and make recommendations to assist districts in their improvement efforts. The focus of the audit was on math curriculum for all students, including students with disabilities. The audit examined curriculum, instruction, assessment, professional development, management, and compliance through multiple lenses of data collection and analysis. These findings acted as a starting point to facilitate conversations in the district to identify areas for improvement, probable causes, and ways to generate plans for improvement. This report contains an outline of the process, data, and methods used as well as the key findings from the data collection and the associated problem statements generated through the cointerpretation process for Yonkers Public Schools. Finally, a section containing Recommendations for Action Planning provides advice for the district in planning actions for each critical problem area. Learning Point Associates provides recommendations as well as more specific advice to consider in the action-planning process. While the recommendations may be considered binding, the specific advice under each area should not be considered binding. Through the remaining cointerpretation and action-planning steps, the specific steps for action will be outlined with the district and upon completion and approval by State Education will be considered a binding plan.
Learning Point Associates Yonkers Public Schools: Final Report—1

District Background Overview Yonkers is a suburban school district located in Westchester County, New York. The current population is approximately 196,086 with a year 2000 median household income of $44,663. It currently serves approximately 25,022 students in 40 schools: 21 pre kindergarten-fifth grade elementary schools, three pre kindergarten-sixth grade elementary schools, five pre kindergarten-eighth grade schools, five middle schools, five high schools, and one alternative middle/high school. The district student body is largely minority ( 28.2 percent black and 47.8 percent Hispanic) with 70.969 percent of students qualifying for free and reduced-price lunch. One elementary school (School Twenty-Nine) was honored by the U.S. Department of Education as a Blue Ribbon School in 2005. However, Emerson Middle School has been designated Restructuring, Year Two, Gorton High School has been designated In Corrective Action, Lincoln High School has been designated Restructuring, Year One, Roosevelt High School has been designated Planning For Restructuring and School Under Registration Review, Museum Middle School has been designated In Corrective Action, Commerce Middle School has been designated In Corrective Action, and Yonkers Middle School has been designated In Need of Improvement, Year One.1 Student Academic Performance Yonkers Public Schools has been identified as a District In Need of Improvement, Year Three because of low performance in mathematics for the students with disabilities subgroup as articulated in the 2004-2005 Accountability Status Report for the district across the elementary, middle, and high school levels. Overall, Yonkers Grade 4 population saw a significant increase in the percentage of students testing at a level of proficient or above on the mathematics assessment from 2003 to 2005; however, students with disabilities did not make AYP. Similar to the Grade 4 population, the Grade 8 population saw an increase in the percentage of students testing at the level of proficient in mathematics; however, again students with disabilities did not make AYP. At the high school level, all students did not make AYP, including the following subgroups: students with disabilities, American Indian/Alaskan Native, Black, Hispanic, limited English proficient (LEP), and economically disadvantaged student subgroups.2
1 This data from this section came from the document, “Request for Proposals Application to Implement the New York State Education Department Sanctioned Audit of the Written, Taught, and Tested Curriculum as Required by No Child Left Behind Regulations” provided to Learning Point Associates, from NYSED EMSC, retrieved June 9, 2006, from http://www.emsc.nysed.gov/irts/school-accountability/2005/school-accountability-masterlist5-1-06_beds.pdf and from City-Data.Com, retrieved June 9, 2006, from http://www.city-data.com/city/Yonkers-New-York.html. 2 This data from this section came from the New York State Department of Education 2005 District Accountability Status report, retrieved March 6, 2006, from http://www.emsc.nysed.gov/irts/school-accountability/2005/district-accountability-masterlist10-14-05_alpha.pdf, from the Accountability Status Report: English Language Arts, Mathematics, Science and Graduation Rate for Yonkers City SC, retrieved June 9, 2006, from http://www.emsc.nysed.gov/repcrd2004/school-accountability/662300010000.pdf, and from the document, “Request for Proposals Application to Implement the New York State Education Department Sanctioned Audit of
Learning Point Associates Yonkers Public Schools: Final Report—2
Between 2002 and 2004, the percentage of fourth-grade students who either met or exceeded standards for Math (59 percent, 75 percent, and 77 percent, respectively) increased. The percentage of eighth-grade students who either met or exceeded standards between 2002 and 2004 remained significantly low but did increase for Math (21 percent, 29 percent, and 39 percent). Cohort data from 1998–2000 indicated a decreasing percentage of students (56 percent, 48 percent, and 44 percent) who achieved a 65 percent “passing score” or higher in the Regents examination area of mathematics3. For 2001–02 high school graduates, 24 percent earned their Regents diplomas; for 2002–03, the rate was 22 percent; and for 2003–04, the rate was 20 percent. Between 2001 and 2004, the rate of high school non-completion remained stable around 8.5%, while the suspension rate remained about 10 percent.4
District Strategies and Practices The following information was taken from the document, “Request for Proposals Application to Implement the New York State Education Department Sanctioned Audit of the Written, Taught, and Tested Curriculum as Required by No Child Left Behind Regulations” provided to Learning Point Associates. Smaller Learning Communities (Breaking Ranks) Research has identified a number of conditions that promote high levels of academic achievement. In general, the key to successfully high performing schools is for districts and schools to work collaboratively (Fullan 1997) to systematically and consistently create and sustain an environment in which all students have the motivation and opportunity to learn. Beginning July 1, 2002, Emerson Middle School and Mark Twain Middle School, both SURR and Title I Schools In Need of Improvement, began working with Brown University in implementing Turning Points, Breaking Ranks’ middle school counterpart. Based upon the performance of the Brown University Lab in facilitating the Breaking Ranks planning process for the high schools, the Lab is believed to have the capacity to effectively facilitate their ‘Framework for School Change’ to meet the goals of each school’s Multi-Year Improvement Plan and the Yonkers Five-Year Plan. That initiative in concert with an ensemble of effective
the Written, Taught, and Tested Curriculum as Required by No Child Left Behind Regulations” provided to Learning Point Associates. 3 The data from this section was taken from the February, 2005 report, Overview of District Performance in Math, Mathematics, and Science and Analysis of Student Subgroup Performance for Yonkers City School District prepared by the University of the State of New York, the State Education Department. Retrieved June 9, 2006, from http://www.emsc.nysed.gov/repcrd2004/overview-analysis/662300010000.pdf 4 The data from this section came from New York State District Report Card Comprehensive Information Report prepared by the University of the State of New York, the State Education Department. Retrieved June 9, 2006, from http://www.emsc.nysed.gov/repcrd2004/cir/662300010000.pdf. Data also came from the document, “Request for Proposals Application to Implement the New York State Education Department Sanctioned Audit of the Written, Taught, and Tested Curriculum as Required by No Child Left Behind Regulations” provided to Learning Point Associates.
Learning Point Associates Yonkers Public Schools: Final Report—3
strategies has resulted in Breaking Ranks assisting in the facilitation of Emerson and Mark Twain being removed from the SURR list. The Yonkers Public Schools’ 2002-2005 Smaller Learning Communities Implementation Grant has been specifically designed by four targeted high schools to build a learning environment that ensures the physical, emotional, and intellectual safety and well being of each and every student. Improvement teams from Gorton High School, Lincoln High School, Roosevelt High School and Saunders High School consisting of staff, parents, students, colleges, businesses, and community agencies worked with the LAB at Brown University through a 2000-2001 Smaller Learning Communities Planning Grant to carry out the five key elements of the planning process used in Breaking Ranks: 1) establish an Improvement Team; 2) engage the entire school through self-assessment; 3) map school improvement initiatives; 4) acquire baseline and ongoing student performance data; 5) develop a Breaking Ranks Implementation Plan that addresses curriculum, instruction, diversity, technology, school environment, organization and time, assessment and accountability, resources, web of support, professional development, governance, ties to higher education, relationships, and leadership. The success of the planning process has been demonstrated in the ninth grade academies. These academies were field tested and, have realized some improvement in climate, communication, and staff and student engagement. Through the ninth grade academies, the size of the learning environments has been broken down into smaller learning communities. Studies indicate that the size of the learning environment has an indirect effect on student learning (Klonsky, 1998). Essentially, size creates conditions for success, especially when high expectations and standards exist. Further, when the size of the learning environment is reduced, the benefits become apparent very quickly, within a year or two. As part of the DINI Improvement Plan, it is expected that Smaller Learning Communities will experience as a result:
Students experience a greater sense of belonging and are more satisfied with their schools (Cotton, 1996).
Fewer discipline problems occur (Raywid, 2000). Crime, violence and gang participation decrease (Cushman, 1997). Incidences of alcohol and tobacco abuse decrease (Klonsky, 1998). Dropout rates decrease and graduation rates and postsecondary enrollment
rates increase (Funk and Bailey, 1999). Student attendance increases (Klonsky, 1998).
The goal of the Relevant High Schools of Yonkers is to achieve high standards for every student through the implementation of Smaller Learning Communities organized around each school’s career magnet. Fifteen project objectives based on the four components of the Yonkers Five-Year Plan have been developed. Secondary building teams attended an Advisories Institute with Brown University for three days , to review such topics as: Key Elements of Smaller Learning Communities, Importance of Personalization, Understanding/Designing/Applying Key Dimensions (1-4), Making Connections, Exploring Common Dilemmas, and Creating Buy-In and Overcoming Resistance. They also attended conferences throughout the school year.
Learning Point Associates Yonkers Public Schools: Final Report—4

The District has adopted policies and practices concerning each school’s core academic subjects that have the greatest likelihood of ensuring that all groups of students specified in section 1111 (b) (C) will meet the State’s proficient level of academic achievement standards which include: Quarterly Reports, Quarterly Data Analysis and Review, the continuation and expansion of SINI/SURR Technical Assistance, and curriculum integration for AIS Targeted Instruction. In addition, Schools in Need of Improvement receive additional technical assistance with regard to data analysis and writing/developing the Multi-Year Comprehensive Education Plan. The District will utilize a Data Warehouse for the main purpose of monitoring progress of each subgroup as per NCLB accountability requirements. The Data Warehouse will enable the District to look at the progress of individual students, cohort groups, programs, grade level indicators, and many other possibilities. Additionally, the District requests all departments to increase technical assistance to the identified schools. Building walk-throughs by Central Office Staff assess progress and continue to focus on needs. The Department of Funded Programs continues to meet regularly with reading/mathematics specialists and ELL staff in identified schools to ensure the integrity of implementation. In addition, the Department of Funded Programs provides technical assistance for the AIS/Targeted Instruction Program for the identified schools. Technical assistance focuses on curriculum, resources, attendance, instructional best practices, and assessments. The No Child Left Behind District Committee meets regularly to assess and identify additional student, staff, and parent supports in each identified school.
Other resources and supports include: • Central Office Advocates to SINI/SURR Schools • Staff Inter/Intra School Visitations • District Curriculum Guides, Curriculum Maps, Mid-Term and Final
Examinations • Leadership Programs for building administrators • Principals’ Institutes on Data Analysis • Mathematics Consultants for Elementary Schools • Secondary School Mathematic Initiative with NYTAC (Mathematics
Coaches in Classrooms) • District wide Department Chairperson Meetings to establish consistency
and continuity of instructional practices • Elementary Summer Targeted Instruction Program • Smaller Learning Communities Site Based Teams for Secondary Schools
in Need of Improvement • Secondary Summer Transition Program • Twenty First Century funding to expand after school/summer programs • Technical Assistance from the Hudson Valley Regional Student Support
Center • Implementation of a District Mathematics Program, PreK-5 • Early Intervention Screening with the addition of Children’s Progress
Tests, PreK-2 • Extensive AIS afterschool programs and Saturday Academies
Learning Point Associates Yonkers Public Schools: Final Report—5

• Monthly Mathematics Committee Meetings • ELA Committee Meetings • Expanded programs for English Language Learners (SIFE, Saturday
Academies, Summer Secondary Intensive English Program, Bilingual Component to the Elementary Summer Targeted Instruction Program)
The District requires each school to develop a Multi-Year Comprehensive Education Plan with measurable goals and objectives based on data analysis. In addition, the District’s Department of Research Testing and Evaluation provides extensive reports to schools and conducts trainings with regard to the analysis and dissemination of data district wide. Results are disaggregated in order to study achievement results of all students. The Department of Research Testing and Evaluation gives each school a performance index from which they determine if they will attain their AMO (formerly known as AYP-Annual Yearly Progress) targets. It provides ongoing technical assistance with regard to the use of data and identifies areas of subskill information from which can be identified targeted instruction or needed professional development. The comprehensive analysis of each of the buildings identified indicates that the District must increase its focus on mathematics To address the fundamental needs in the schools and ensure equity of access, the Yonkers Public Schools hires highly qualified teachers with the overall goals of:
strengthening the K-12 program; strengthening the English Language Arts and Mathematics Program, thus ensuring
positive learning outcomes for all students; developing teachers expectations for students through increased competency in pedagogy
and content areas; establishing expanded collaborations with teachers, K-12.
It is the expectation that implementing these goals will address the prior failures and bring about increased student academic achievement. District Resources For 2003–04, Yonkers had 334 administrative and professional staff, 1857 teachers and 0 paraprofessionals. The majority of teachers were teaching within in their field, with only 32 teachers “teaching out of certification.” In 2002–03, the district received $359,700,000 in funding; and in 2003–04, the funding was $370,432,136.5
5 Data from this section came from the document, “Request for Proposals Application to Implement the New York State Education Department Sanctioned Audit of the Written, Taught, and Tested Curriculum as Required by No Child Left Behind Regulations” provided to Learning Point Associates and from New York State District Report Card Comprehensive Information Report prepared by the University of the State of New York, the State Education Department. Retrieved June 9, 2006, from http://www.emsc.nysed.gov/repcrd2004/cir/662300010000.pdf.
Learning Point Associates Yonkers Public Schools: Final Report—6
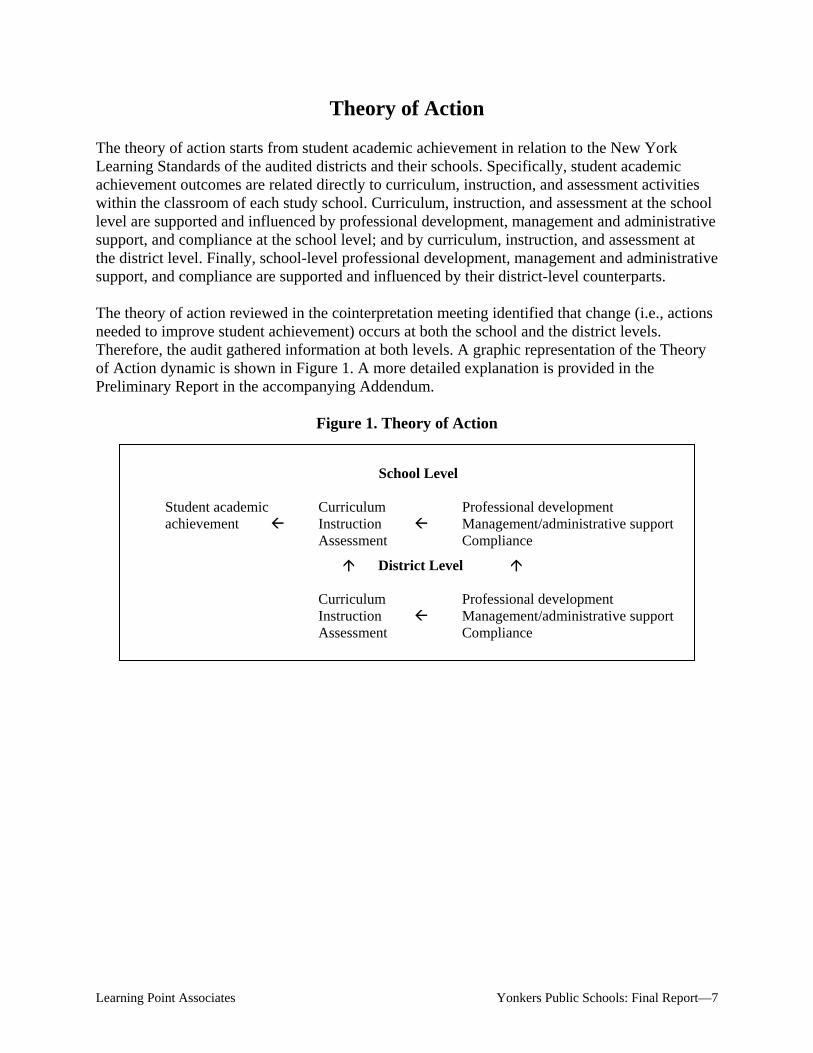
Theory of Action The theory of action starts from student academic achievement in relation to the New York Learning Standards of the audited districts and their schools. Specifically, student academic achievement outcomes are related directly to curriculum, instruction, and assessment activities within the classroom of each study school. Curriculum, instruction, and assessment at the school level are supported and influenced by professional development, management and administrative support, and compliance at the school level; and by curriculum, instruction, and assessment at the district level. Finally, school-level professional development, management and administrative support, and compliance are supported and influenced by their district-level counterparts. The theory of action reviewed in the cointerpretation meeting identified that change (i.e., actions needed to improve student achievement) occurs at both the school and the district levels. Therefore, the audit gathered information at both levels. A graphic representation of the Theory of Action dynamic is shown in Figure 1. A more detailed explanation is provided in the Preliminary Report in the accompanying Addendum.
Figure 1. Theory of Action
School Level
Student academic Curriculum Professional development achievement Instruction Management/administrative support Assessment Compliance
District Level
Curriculum Professional development Instruction Management/administrative support Assessment Compliance
Learning Point Associates Yonkers Public Schools: Final Report—7
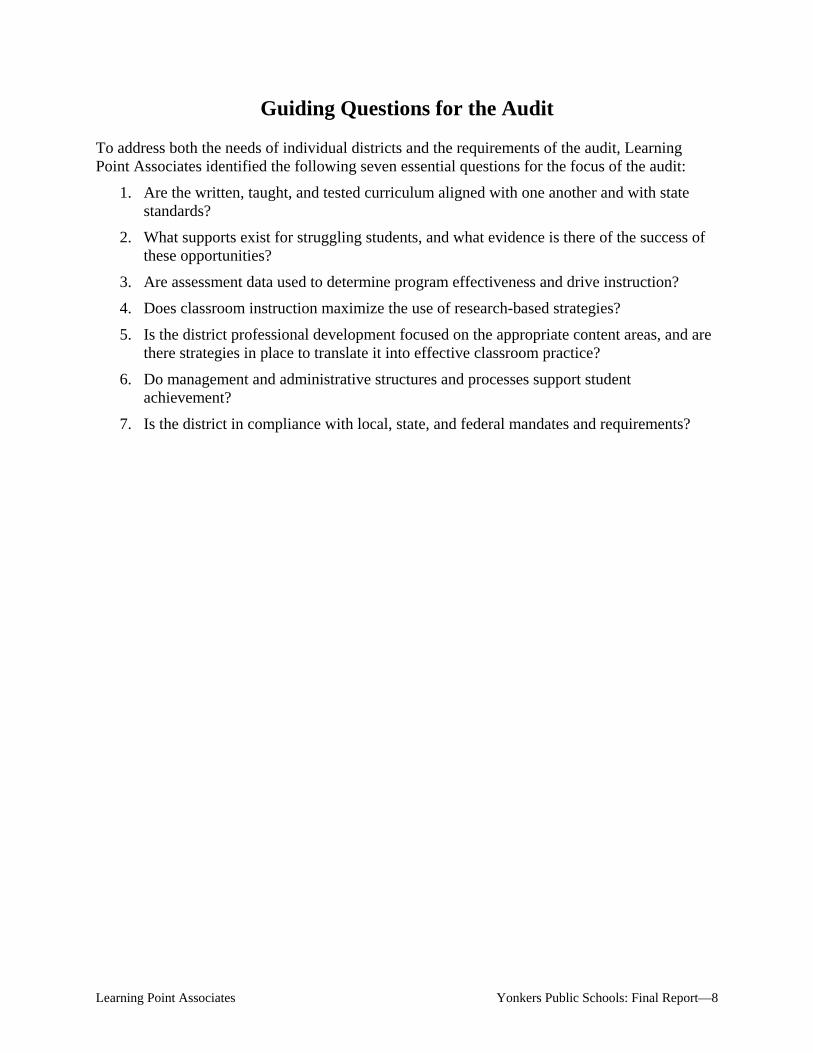
Guiding Questions for the Audit To address both the needs of individual districts and the requirements of the audit, Learning Point Associates identified the following seven essential questions for the focus of the audit:
1. Are the written, taught, and tested curriculum aligned with one another and with state standards?
2. What supports exist for struggling students, and what evidence is there of the success of these opportunities?
3. Are assessment data used to determine program effectiveness and drive instruction?
4. Does classroom instruction maximize the use of research-based strategies?
5. Is the district professional development focused on the appropriate content areas, and are there strategies in place to translate it into effective classroom practice?
6. Do management and administrative structures and processes support student achievement?
7. Is the district in compliance with local, state, and federal mandates and requirements?
Learning Point Associates Yonkers Public Schools: Final Report—8
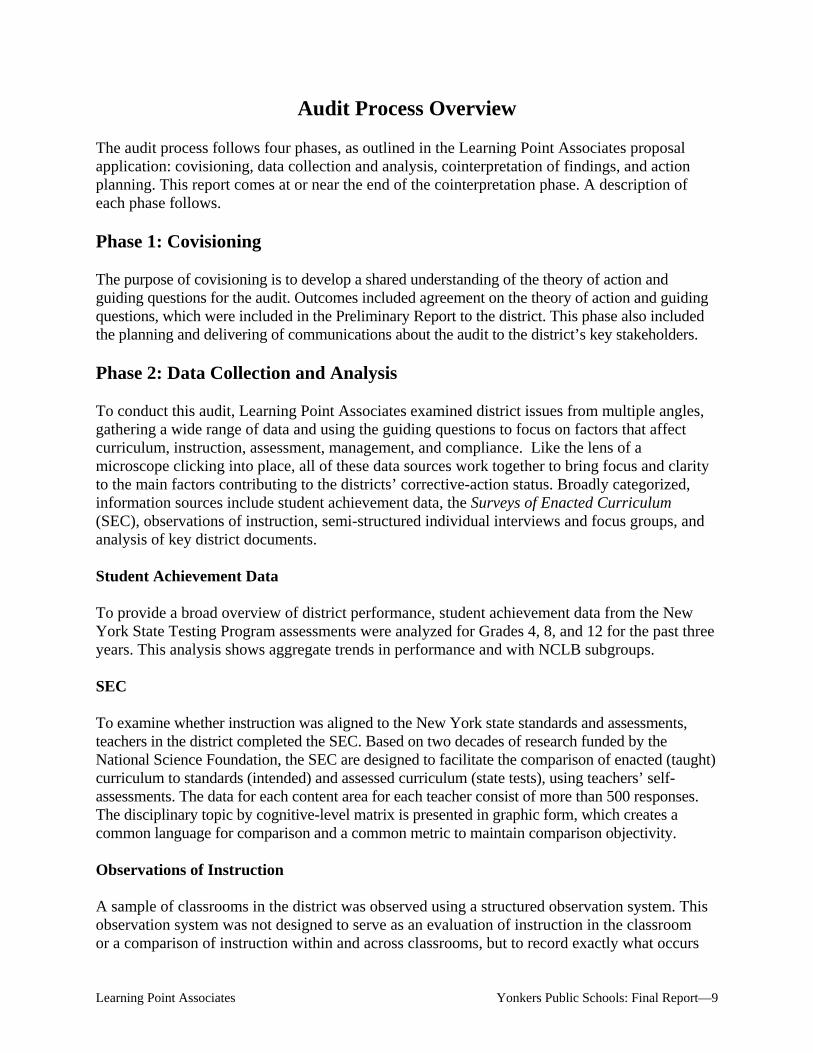
Audit Process Overview The audit process follows four phases, as outlined in the Learning Point Associates proposal application: covisioning, data collection and analysis, cointerpretation of findings, and action planning. This report comes at or near the end of the cointerpretation phase. A description of each phase follows. Phase 1: Covisioning The purpose of covisioning is to develop a shared understanding of the theory of action and guiding questions for the audit. Outcomes included agreement on the theory of action and guiding questions, which were included in the Preliminary Report to the district. This phase also included the planning and delivering of communications about the audit to the district’s key stakeholders. Phase 2: Data Collection and Analysis To conduct this audit, Learning Point Associates examined district issues from multiple angles, gathering a wide range of data and using the guiding questions to focus on factors that affect curriculum, instruction, assessment, management, and compliance. Like the lens of a microscope clicking into place, all of these data sources work together to bring focus and clarity to the main factors contributing to the districts’ corrective-action status. Broadly categorized, information sources include student achievement data, the Surveys of Enacted Curriculum (SEC), observations of instruction, semi-structured individual interviews and focus groups, and analysis of key district documents. Student Achievement Data To provide a broad overview of district performance, student achievement data from the New York State Testing Program assessments were analyzed for Grades 4, 8, and 12 for the past three years. This analysis shows aggregate trends in performance and with NCLB subgroups. SEC To examine whether instruction was aligned to the New York state standards and assessments, teachers in the district completed the SEC. Based on two decades of research funded by the National Science Foundation, the SEC are designed to facilitate the comparison of enacted (taught) curriculum to standards (intended) and assessed curriculum (state tests), using teachers’ self-assessments. The data for each content area for each teacher consist of more than 500 responses. The disciplinary topic by cognitive-level matrix is presented in graphic form, which creates a common language for comparison and a common metric to maintain comparison objectivity. Observations of Instruction A sample of classrooms in the district was observed using a structured observation system. This observation system was not designed to serve as an evaluation of instruction in the classroom or a comparison of instruction within and across classrooms, but to record exactly what occurs
Learning Point Associates Yonkers Public Schools: Final Report—9

in the classroom. Observations lasted approximately 45–60 minutes in each classroom. Observations focused on both student and teacher behaviors as well as particular instructional components. The data then were analyzed using descriptive statistics in several areas, including classroom demographics, environment, instructional materials, lesson content, purpose, and activities conducted. Semi-structured Individual Interviews and Focus Groups People who are involved integrally in a district (e.g., students, teachers, district staff) have unique insights into a school system, including its strengths and operational challenges. While data of this type are necessarily subjective—representing the views of the speakers—they are nonetheless highly informative. Rigorously analyzed, these data provide various viewpoints. When this information aligns with more objective information, it can provide rich insights into issues and possible solutions. When this information does not align with more objective information, it can lead to fruitful discussions to identify the cause of the discrepancy. To tap into stakeholders’ perceptions of issues concerning curriculum, instruction, assessment, professional development, management, and compliance, the views of teachers, students, principals, district administrators, service providers, and community leaders were gathered through semi-structured interviews and focus groups. In the data interpretation and reporting process (interview and focus-group data sets in the accompanying Addendum), the emphasis is on common themes and divergent cases to exemplify commonly reported characteristics and challenges occurring in the sampled schools. This process encourages sensitivity to emergent patterns, along with irregularities within and across school sites (Delamont, 1992). This process also supports a report that included descriptions rich in context and interpretations, which connected with and extended the district’s contextual knowledge about what they perceive as working and not working across their schools. Analysis of Key District Documents A district’s formal documents (e.g., district improvement plan, professional development plan) demonstrate its official goals and priorities. To identify the priorities and strategies to which the district has committed, a structured analysis of key district documents was completed. A document review scoring rubric was developed and used to synthesize document information within each of the six strands of the audit (i.e., curriculum, instruction, assessment, professional development, management, and compliance). The rubric was designed to measure whether each district document contained sufficient information across each strand. The degree to which each respective document addressed the strand was evaluated by two to three content experts to ensure multiple perspectives during the process. Components of each strand were given a 0–3 rating based on its level of coverage within the document. Once ratings were completed, a consensus meeting was held and a report was generated by all reviewers.
Learning Point Associates Yonkers Public Schools: Final Report—10
Table 1 lists the key data sources and how they were used by the Yonkers Public Schools to review the district during the cointerpretation process.
Table 1. Alignment of Data Sources With Guiding Questions
Guiding Questions
Student Achievement
Data
Surveys of Enacted
CurriculumObservations of Instruction
Semi-structured Individual
Interviews and Focus Groups
Analysis of Key District Documents
1. Are the written, taught, and tested curriculum aligned with one another and with state standards?
X X X X X
2. What supports exist for struggling students, and what evidence is there of the success of these opportunities?
X X X X
3. Are assessment data used to determine program effectiveness and drive instruction?
X X X X
4. Does classroom instruction maximize the use of research-based strategies?
X X X X
5. Is the district professional development focused on the appropriate content areas, and are there strategies in place to translate it into effective classroom practice?
X X X X X
6. Do management and administrative structures and processes support student achievement?
X X X
7. Is the district in compliance with local, state, and federal mandates and requirements?
X X X
Learning Point Associates Yonkers Public Schools: Final Report—11
Phase 3: Cointerpretation of Findings This phase was only partially completed by the teams. The purpose of cointerpretation is to interpret the data collected, which were grouped into three priority areas: professional development; curriculum, instruction, and assessment; and management and compliance. This guided the action-planning process for the system. The initial cointerpretation had several steps, starting with the interpretation of the data, followed by the development of problem statements, and concluding with the identification and prioritization of hypotheses specific to each problem statement (this final step did not take place at Yonkers Public Schools). These steps occurred in a two-day meeting with key school and district staff. (The following two steps did not take place at Yonkers Public Schools.) After the meeting, district staff edited and agreed on the problem statements and hypotheses. The synthesized information will be developed into a presentation for a broader school and community audience. Because this process was critical in identifying the priority areas for district improvement, the detailed approach is outlined here. Interpret Data The cointerpretation process began with the study of the individual audit reports (i.e., school analysis report, documentation report, achievement report, district interview data, SEC data, compliance and management report [interview, focus groups, and document], classroom observation report)(due to time restraints not all documents were reviewed) to do the following:
1. Identify data and information related to the assigned team priority area (i.e., professional development; curriculum, instruction, assessment; management and compliance).
2. Select key data points or messages.
3. Categorize or cluster and agree upon the critical data points or messages.
4. Identify patterns and trends across reports.
5. Present and defend critical data points or messages.
6. Respond to clarifying questions.
7. Refine and reach consensus on key findings. In the cointerpretation meeting in Yonkers, as the three investigative groups (i.e., professional development; curriculum, instruction, and assessment ; management and compliance) presented their findings to the whole group, some natural combining and winnowing of results occurred. District Administration requested that we note that not all teams completed the investigation as outlined in the process. Specifically, the curriculum, instruction, and assessment team did not have sufficient time to review all of their documents as a whole team, and the management and compliance team drew their conclusions from general knowledge. From various data sources, the participants utilized the method of triangulation to provide support for combining and subsuming some of the findings. The following set of three criteria enabled the participants to examine the prioritized list of findings:
• Does the list respond to the essential questions?
Learning Point Associates Yonkers Public Schools: Final Report—12
• Does the list respond to the subgroup and content areas identified as not meeting AYP?
• Does the list capture the most important findings? From this process, which required considerable thought and discussion, key findings emerged. Develop Problem Statements The cointerpretation process continued with the development of problem statements. Teams reviewed the key findings to accomplish the following:
• Generate problem statements by taking the critical data points or messages and identifying problems supported by evidence.
• Prioritize problems using specific criteria, such as those that have the greatest likelihood of increasing student achievement if resolved.
• Reach consensus on the top problems facing the district. The following sections, Identify and Prioritize Hypotheses, and Align and Synthesize Cointerpretation Results, did not occur in Yonkers. Identify and Prioritize Hypotheses Identification and prioritization of hypotheses occurred next. In this stage, participants performed the following steps:
• Identify a set of hypotheses supported by evidence in the three priority areas for each identified problem.
• Prioritize hypotheses using specific criteria—such as those over which the district has control—and determine which hypotheses, if addressed, can leverage the most change.
• Reach consensus on a set of hypotheses for each problem statement. A subset of participants met again after the initial cointerpretation meeting to further define these statements and hypotheses. Align and Synthesize Cointerpretation Results The final steps of cointerpretation included refining the problem statements and hypotheses and developing a synthesis of the cointerpretation information (i.e., a district profile that will be presented to a broader group of school and community representatives during action planning). Phase 4: Action Planning The last step in the audit process is action planning. This process will result in an action plan focused on the areas identified in the audit. The key actions in the plan will be considered binding as they will be the enactment of the recommendations.
Learning Point Associates Yonkers Public Schools: Final Report—13
The process entails initial goal and strategy setting by a core district team, followed by engaging with a carefully selected stakeholder group that includes district staff, parents, and community leaders. This group will provide input into the success indicators and potential barriers to success and will serve as champions for the district. Finally, action planning requires detailed planning meetings with groups or departments in the district to determine action steps and associated financial implications and timelines for implementation. Once this process is complete, the audit action plan should be aligned with other district plans. Reference Delamont, S. (1992). Fieldwork in educational settings: Methods, pitfalls, and perspectives.
London: Falmer Press.
Learning Point Associates Yonkers Public Schools: Final Report—14
Problem Statements As described in the Phase 3 process description, each problem statement was generated through the cointerpretation process. In a facilitated process, groups of district administrators and staff were instructed to identify key findings across multiple data sets to develop the district problem statementsEach problem statement, includes supporting findings . These can be mapped back to the original data sets using the data map in Appendix A. However, not all data sets were reviewed in the co-interpretation process, so in some cases, we have added findings from other data sets that further support the problem statement. We have included the reference letter and number for locating the finding in the supplemental materials. In addition, the statements developed in the co-interpretation were in the form of a solution, rather than a problem. They have been reworded to reflect the identified problem. The original statements have been kept and can be found in Appendix A with the data map. Problem Statement 1 The district curriculum guides, maps, and instructional materials are not aligned to the new NY state math standards. In response to the essential question “Are the written, taught, and tested curriculum aligned with one another and the state standards?” participants found information in the Key District Documents (D-2) that the district’s written, taught, and tested K–12 Math curriculum had not yet been aligned with the new state standards. Participants in co-interpretation noted that Yonkers’ math curriculum and instructional materials were continuing to be refined in the wake of New York State Education Department’s new math standards. District administrator interviews (D-4) further supported the need for alignment with the new standards. Furthermore, teacher and principal interviews for both general and special education (F-3, 4; H-2) suggest that the maps and instructional materials may be too rigid, in some cases, to meet the needs of all students. Finally, district administrators expressed particular concern about alignment of curriculum across schools, classrooms, and grade levels, especially at the high school level (D-4). Problem Statement 2 In some schools students with disabilities receive (a) insufficient inclusion opportunities and (b) inadequate classrooms, textbooks, and instructional materials. In the co-interpretation meeting, participants read a summary of the “Special Education Programs and Services Report” conducted by Learning Innovations, February 2006. The summary provided evidence of varying levels of service for students with disabilities across the district. The number of students in inclusion classrooms, according to the director of special education has increased substantially in the past few years (G-4, 5). Nonetheless, as compared to the state average (G-4), the district still needs to increase the number of students in inclusion.
Learning Point Associates Yonkers Public Schools: Final Report—15
Teacher interviews and classroom observations reveal differences in the physical learning environment. In two classrooms observed, teachers reported poor classroom conditions, while others reported excellent conditions (G-7). Teachers reported a lack of adequate space more frequently at the elementary level (G-7, H-2). Observations of special education classrooms revealed that in 86% of the lessons, environments had materials arranged for easy access, seating arrangements to support active engagements, and had room arrangements that allowed for whole-group, small-group, or independent work (M-5). Lack of adequate materials was a theme that resonated throughout the data sets. In the observations of special education teachers, 79% of the lessons employed teacher-selected materials (M-6). District administrators supported this by indicating that these teachers often have to supplement the curriculum to meet the needs of their students, and that this is done at the building level (D-6). Special education teachers also reported generally a need for more materials (H-2), as did general education teachers (F-4). Parents also expressed concern about inadequate materials for all students (J-3). Upon review of this document, District administrators felt it important to note that funding for additional special education materials/supplies is determined by IDEA. Problem Statement 3 Some administrators lack critical information and skills regarding the development and implementation of math curriculum and appropriate instructional practices in order to be an effective instructional leader. In response to the essential question “Is the district professional development focused on the appropriate content areas, and are there strategies in place to translate it into effective classroom practice?” participants found data sources showing a need to improve knowledge around math for both administrators and teachers. Participants focused their discussion most intently on the administrators. They concluded that there was a distinct lack of administrator knowledge not only of the math curriculum, but also instruction, based on a combination of the data sources and their own experiences. From the data, district administrator interviews suggested that there is little opportunity for professional development for principals beyond monthly meetings and the leadership academy (D-9). This same source indicated that there is inconsistency in the strength of building leaders (D-9). In addition, some teachers reported a need for more instructional support from administrators (O-5). Participants also identified some findings related to the need to improve professional development opportunities for teachers. For example, SEC data (SEC-36) indicates that teachers do not have time to observe each others instruction. In addition, both teachers and principals reported a need for teacher professional development to be job-embedded and sustained (D-8, F-6). Teachers also noted that targeted professional development opportunities in mathematics are limited (F-6, H-3). SEC data further supported this with nearly half of the teachers reporting that follow-up activities rarely build on what teachers learn in a professional development session (SEC-65). Finally, the key district document review indicated that the district did not submit a specific plan that illustrates a focus of professional development in the highest priority areas (C-9). That said, district administrators did report that there are many opportunities provided for
Learning Point Associates Yonkers Public Schools: Final Report—16
teachers, and that their biggest concerns were around scheduling, collaboration, and sustainability (D-8, 9, F-6). Problem Statement 4 Teachers and administrators lack the knowledge and skills to effectively instruct students with disabilities. In response to the essential question “Is the district professional development focused on the appropriate content areas, and are there strategies in place to translate it into effective classroom practice?” participants found numerous data sources showing a need to improve knowledge concerning students with disabilities. Elementary teachers in particular reported a lack of mathematics professional development centered on students with special needs (H-3). Special education teachers generally reported a need for more professional development targeted at teaching special needs students (F-6). Finally, in the SEC survey, the majority of teachers (13 of 23 respondents) reported slight or no coverage of meeting the needs of special populations in their professional development activities over the last 12 months (SEC-68). Problem Statement 5 Extended support for students with disabilities is insufficient in terms of pre-referral strategies, early intervention, and support services. In response to the essential question, “What supports exist for struggling students?” The co-interpretation team found that support services in general are not aligned to state standards (D-7, C-7), and that there are problems with the current pre-referral and early intervention system (G-5). Specifically, staff shortages and lack of teacher participation are cited as problems (G-5). District administrators, in review of this document, cite budget cuts as the cause of this. Regarding the alignment of support services, administrators noted that this is especially challenging because each program has a different funding stream with different requirements (D-7). Teachers also noted a loss of key personnel as a barrier to providing sufficient support (F-4). Problem Statement 6 There is a lack of district organizational structure and clarity of roles and responsibilities as related to the math curriculum and instructional practices, which in turn, leads to ineffective and inconsistent communication. Participants in the co-interpretation felt strongly about this statement. Data points most directly to communication needs, workload balancing, and role clarity in teacher hiring. Teacher interviews cite lack of communication between building administrators and teachers as a concern (O-3). Special education teachers also reported that there is a lack of leadership from the district in this area, due to an overabundance of duties assigned to administrative leaders (H-3). The management and compliance document review indicated that the district has not established written lines of accountability (M-6), but this issue only seemed to re-emerge elsewhere in the area of staffing and hiring. District administrators reported a variety of staffing and hiring processes, without clear clarity in roles for the district, building, and teachers.
Learning Point Associates Yonkers Public Schools: Final Report—17

Learning Point Associates Yonkers Public Schools: Final Report—18
Recommendations for Action Planning In this section, we use the problem statements and key findings, along with research on mathematics best practice and district improvement, to suggest implications for the district’s efforts during the next three years. A general recommendation is provided to address each problem statement, followed with a set of specific actions for the district to consider during the action-planning process. The diversity and complexity of each problem statement places limits on the extent to which we can discern their relative impact on the district’s improvement process. For this reason, recommendations are firm, but the associated actions for implementation should be considered points of reference for further discussion. Recommendation One: Complete a vertical and horizontal alignment of the written mathematics curriculum to 2005 state standards. In this alignment, we recommend that materials focusing on suggested flexibility in lesson pacing as well as design for reteaching and differentiation be included. Yonkers has already begun this work. District administrators, principals, and teachers interviewed all reported alignment to state standards as a key aspect of the district curriculum (D-4, F-3). However, as noted in Problem Statement One, the written curriculum needs to be realigned to the new standards. Furthermore, this recommendation emphasizes the need for flexibility design of the written curriculum. This is due to indications from multiple data sources stating that current maps and guides are viewed as rigid Research and leading experts concur that a written, align and adaptive curriculum has positive impact on student achievement. Curriculum needs both depth and coverage, but teachers need to decide on priorities or critical standards in order to make the curriculum viable for learning (Marzano, 2003.) Curriculum also must be clearly aligned to state standards, state assessments, local assessments, instructional strategies, and professional development (Burger, 2003). Districts should have both vertical and horizontal alignment. Standards-based curricular reform offers teachers a guide for their instructional practices by pointing to what knowledge or skills students must demonstrate (Darling-Hammond, 1997). This focus is believed to lead to improved and equalized student achievement. Using a standards-based curriculum aligns, integrates, and connects assessments, curriculum, and instruction (Burger, 2003). Standards alignment uses local content standards to foster the use of multiple assessment sources, describes how classroom instruction and assessment relate to each other, and aligns assessment with learner outcomes (Burger, 2003). Once each of the grade levels has aligned its math curriculum, vertical alignment can begin. In a vertical alignment, multiple grade levels collaborate to plan and implement curriculum. In this model, the benchmark used to align the curriculum is one that anchors student outcomes. Skills and content are identified so that students can successfully meet the higher expectations. For example, a small group of kindergarten through third-grade teachers would look at the third-grade benchmark and then backwards map earlier grade-level benchmarks to this outcome. This
Learning Point Associates Yonkers Public Schools: Final Report—19
allows learners to build on previously taught skills. Clustering small groups of teachers will allow a district to develop vertical alignment from kindergarten through high school over time. Having a usable and clearly articulated curriculum allows grade-level teachers to make decisions about differentiation based on student needs. Because students vary in readiness, interests, and learning style, appropriately differentiated instruction allows teachers to vary instructional approaches by varying the content, the process, or the product (Tomlinson & Strickland, 2005). Choosing to vary the process as a method of differentiation allows schools to choose a variety of instructional strategies while holding the same content standards for all students. It is important to note that programs should be considered as supportive materials for the actual curriculum; programs are vehicles that help students reach mastery of the intended (written) curriculum. Programs need to be aligned to a written curriculum that includes specific benchmarks. Alignment to benchmarks ensures that all programs are complementary and comprehensive so that all students have access to the full written curriculum (Webb, 1997).
The conclusion of Marzano’s (2003) research synthesis is explicit—“guaranteed and viable curriculum” is the most important factor impacting student achievement. For the Yonkers Public Schools’ curriculum alignment, the engagement of teachers in the development of tools such as curriculum maps, written scopes and sequences including suggested pacing guides (weekly or monthly), and documented district guides for instructional strategies will aid full implementation of the curriculum. This recommendation takes into account data that show:
• The district’s curriculum has not yet been aligned with the new standards. (D-2) • District administrators had concern about the alignment of the math curriculum across
schools, classrooms, and grade levels, especially in light of a transient population. (D-4)
• District administrators indicated that the curriculum in the middle and high school is less consistent, and that contributes to problems with alignment. (D-4)
• Contradictory reports of verbal confirmation of use of written curriculum during teacher interviews (100% district wide), as opposed to observed materials used in lessons (59% district wide and 56% middle and high school). (K-7, K-33)
• Teachers reported needing more flexibility with pacing to allow time to reteach and remedy identified deficits. (F-7)
• Similarly, teachers and principals indicated that the curriculum maps were overly prescriptive and did not meet all student needs, and that the pacing was too fast. (F-2, 3, H-2)
References Burger, D. (2003) Using standards-led policy to align assessment and accountability systems.
PREL Briefing Paper. Honolulu, HI: Regional Educational Laboratory at Pacific Resources for Education and Learning.
Darling-Hammond, L. (1997). The right to learn: A blueprint for creating schools that work. San
Francisco: Jossey-Bass.
Learning Point Associates Yonkers Public Schools: Final Report—20
Marzano, R. (2003). What works in schools: Translating research into action. Alexandria, VA:
Association for Supervision and Curriculum Development. Tomlinson, C.A., & Strickland, C.A. (2005). Differentiation in practice: A resource guide for
differentiating curriculum, grades 9–12. Alexandria, VA: Association for Supervision and Curriculum Development.
Webb, N. L. (1997). Research monograph no. 6: Criteria for alignment of expectations and
assessments in mathematics and science education. Washington, D.C.: Council of Chief State School Officers.
Learning Point Associates Yonkers Public Schools: Final Report—21
Recommendation Two: Create a system of instructional support which includes accountability for results at the classroom, administrative and district level. The system should ensure use of aligned materials as well as allow for feedback to be used for curriculum adjustment. In addition, a systemic professional development plan for teachers and administrators should be further developed and enhanced to support the content knowledge and skills of special education teachers and the knowledge and skills of general education teachers for students with disabilities. Teachers, principals and administrators reported sustained use of district written curriculum and materials as the primary mechanism guiding instruction. Classroom observers noted that less than 60% of lessons observed used district materials. This number was lower (56%) at the high school level. This suggests a need for instructional support and education on the district materials and written curriculum. Recommendation one centers on the completion of a newly aligned, more flexible curriculum. This in conjunction with monitoring and professional development provides the Yonkers Public Schools with a comprehensive framework for curriculum and instruction. Interviews, Surveys of the Enacted Curriculum, and observations, as well as the key document review, all point to the need for sustained, collaborative and targeted professional development opportunities in mathematics. Multiple interview reports and the SEC report also suggest that all teachers reported a need for targeted professional development focused on mathematics instruction for special needs students (H-3, F-6, SEC-68). Currently, three times a year a series of course workshops regarding special education are presented through SETRC and this is in addition to numerous courses that are offered in the area of students with disabilities. Integrating these activities into a comprehensive planning, and following through on them to ensure teacher access and sustainability will be important. The key document review (C-8) reveals that district walk-throughs are in place in some areas of the school district. Administrator interviews (D-9) suggest that several approaches for monitoring, such as teacher observations, walk-throughs, and learning walks are all models that have been touched upon in the Yonkers Public Schools. However, a comprehensive system of monitoring curriculum implementation and instruction will allow Yonkers to ensure that the newly aligned curriculum truly provides opportunities for all students to learn. Research indicates that professional development efforts are effective at changing instructional practice and impacting student achievement when the professional development is tied intricately to the system’s instructional goals and areas of greatest need (Desimone, Porter, Garet, Yoon, & Birman, 2002; Guskey, 2000). In prioritizing school system’s instructional goals and areas of greatest need, content should focus on (a) subject matter knowledge, and (b) teaching strategies/learning theories. Strong professional development ensures that participants are actively engaged in learning (Garet, Porter, DeSimone, Birman, & Yoon, 2001; Lieberman, 1996). Typical in-service sessions have shown to produce little to no gain in instructional change (Parsad, Lewis, & Farris, 2001). However, alternative formats of professional development typically embedded within teachers’ regular work and meeting schedules have shown to produce a stronger effect (Peery, 2004;
Learning Point Associates Yonkers Public Schools: Final Report—22
Desimone et al., 2002; Corcoran, 1995). Teachers and administrators in Yonkers have expressed the desire for this type of professional development. Possibilities of alternative formats include coaching, study groups, mentoring, peer observations, examinations of student work, critical friends groups, and lesson study. Professional development also needs to be sustained over time (Steiner, 2004). In many ways, monitoring practices and accountability measures assist in providing duration to learning as the topics of professional development are held alive by conversations and work that utilizes the new knowledge. Monitoring of professional development is a significant part of a new plan’s success. Fuhrman, Clune, & Elmore (1988) recommend benchmarks for the implementation and delivery of professional development. Accountability of professional development includes assessing the effectiveness of the actual activities (Guskey, 2000), as well as keeping the conversations of the training alive through feedback, observation, and other accountability measures (Desimone et al., 2002). Principals are key in this process. The district notes (D-9) that principals may not have the time or content knowledge to effectively monitor the instructional effects of professional development. Teachers have also expressed the need for more instructional support from building leaders (O-5). Although the principal does not need to be the only figure in the monitoring of professional development and its instructional effects, the principal needs to set the standard of continued progress toward higher student achievement and improved instructional practices. While teachers are learning and trying different strategies, they need support from building and district-level leaders. The National Association of Elementary School Principals (2001) identifies six core tasks of instructional leaders: (1) focusing on student and adult learning, (2) holding high performance expectations, (3) helping teachers understand the value of standards, (4) fostering professional collegiality and culture, (5) using data to guide decisions, and (6) tapping into community resources to improve school functioning. While instructional leadership typically is principal centered—or principal motivated—tasks associated with instructional leadership should be dispersed among school-site staff (Elmore, 2000). This does not mean that specific people have specific unrelated instructional tasks to complete in isolation; rather, strong instructional leadership depends upon interrelated activities such as involving teachers in mentoring or professional development presentations (Spillane, Halverson, & Diamond, 2000). In other words, instructional monitoring involves the principal working in conjunction with site instructional staff. Many models exist to promote district emphasis on instructional leadership—including structured classroom walk-throughs, principal support groups, and principal peer observations. What is most important, though, is that the district models to site leaders (and site leaders model to teachers) the importance of good instruction (Blase & Blase, 2000). This recommendation takes into account data that show:
Learning Point Associates Yonkers Public Schools: Final Report—23
• Contradictory reports of verbal confirmation of use of written curriculum during teacher interviews (100% district wide), as opposed to observed materials used in lessons (59% district wide and 56% middle and high school). (K-7, K-33)
• In 25 out of 30 observations students listened to a presentation by a teacher as the main instructional activity. In 11 observations, students answered textbook or worksheet questions. Very few higher level thinking skills and activities were observed. (K-11)
• In 15 out of 25 observed lessons, the lesson was categorized as beginning stages of effective instruction or lower. (K-41)
• Teachers do not have time to observe others’ instruction. (SEC-36) • Teachers and administrators want professional development to be job embedded and
sustained. (D-8, F-6) • Administrators have few professional development opportunities outside of
administrators’ academies. (D-9) • There is inconsistency in the strength of building leaders. (D-9) • Teachers reported a need for more instructional support from building leaders. (O-5) • SEC data showed nearly half of the teachers reporting that follow-up activities rarely
build on what teachers learn in a professional development session (SEC-65). • Key district document review indicated that the district did not submit a specific plan
that illustrates a focus of professional development in the highest priority areas (C-9). • District administrators did report that there are many opportunities provided for
teachers, and that their biggest concerns were around scheduling, collaboration, and sustainability (D-8, 9, F-6).
• Elementary teachers reported a lack of mathematics professional development for students with special needs (H-3).
• Special education teachers reported a need for more professional development targeted at teaching special needs students (F-6).
• The majority of teachers (13 of 23 respondents) reported having only slight or no information on meeting the needs of special populations in their professional development activities over the last 12 months (SEC-68).
References Blase, J., & Blase, J. (2000). Effective instructional leadership: Teachers’ perspectives on
how principals promote teaching and learning in schools. Journal of Educational Administration, 38(2), 130–141.
Corcoran, T. B. (1995). Transforming professional development for teachers: A guide for state policymakers. Washington, DC: National Governors Association. Desimone, L. M., Porter, A. C., Garet, M. S., Yoon, K. S., & Birman, B. F. (2002). Effects of
professional development on teachers’ instruction: Results from a three-year longitudinal study. Educational Evaluation and Policy Analysis, 24(2), 81–112.
Learning Point Associates Yonkers Public Schools: Final Report—24
Elmore, R. F. (2000). Building a new structure for school leadership. Washington, DC: Albert Shanker Institute. Retrieved March 6, 2006, from http://www.shankerinstitute.org/ Downloads/building.pdf
Fuhrman, S., Clune, W., & Elmore, R. (1988). Research on educational reform: Lessons on the
implementation of policy. Teachers College Record, 90(2), 237–257. Garet, M. S., Porter, A. C., Desimone, L., Birman, B., & Yoon, K. (2001). What makes
professional development effective? American Education Research Journal, 38(4), 915–945.
Grant, S. G., Peterson, P. L., & Shojgreen-Downer, A. (1996). Learning to teach mathematics in
the context of systemic reform. American Educational Research Journal, 33(2), 502–541. Guskey, T. (2000). Evaluating professional development. Thousand Oaks, CA: Corwin Press. Joyce, B. R., & Showers, B. (2002). Student achievement through staff development (3rd ed.).
Alexandria, VA: Association for Supervision and Curriculum Development. Lieberman, A. (1996). Practices that support teacher development: Transforming conceptions of
professional learning. In M. McLaughlin & I. Oberman (Eds.), Teacher Learning: New policies, new practices (pp. 185–201). New York: Teachers College Press.
National Association of Elementary School Principals. (2001). Leading learning communities:
NAESP standards for what principals should know and be able to do. Alexandria, VA: Author.
Parsad, B., Lewis, L., & Farris, E. (2001). Teacher preparation and professional development:
2000 (NCES Publication No. 2001-088). Washington, DC: National Center for Education Statistics.
Peery, A. B. (2004). Deep change: Professional development from the inside out. Lanham, MD:
Scarecrow Education. Spillane, J. P., Halverson, R., & Diamond, J. B. (2000). Distributed leadership: Toward a theory
of leadership practice. Evanston, IL: Institute for Policy Research, Northwestern University.
Learning Point Associates Yonkers Public Schools: Final Report—25
Recommendation Three: Design and implement a systemic plan that addresses the needs of special education and at risk students through 1) Aligning support services to the standards, 2) Investigating current practices and where necessary making changes to ensure the district is providing a comprehensive support system (pre- referral, early intervention and support services) for students, and 3) Providing needed materials to teachers of special education and conduct further investigation on physical classroom conditions. Problem statements 2, 4, and 5 and their associated findings all center on issues related to students with disabilities including insufficient opportunities for inclusion, materials for student use, professional development for teachers and administrators, and extended support. In addition general support services have been identified as an area in need of alignment to the district curriculum. Supplemental educational services are clearly present in the district. Students, teachers and administrators all identified these programs. However, administrators indicated that the various programs/ funding sources all have different requirements and expectations. It is critical that these supportive programs are aligned to the district curriculum and are using data to target areas of instruction. While a comprehensive plan for identification of students exists (C-7), the district needs to ensure that:
• Students are continuously placed in the least restrictive environment as appropriate – whether or not it is full inclusion.
• ISPT teams include qualified teachers ; • Pre referral strategies are provided to classroom teachers and indicated in school
improvement plans (McCarney et al, 2006). • Early Intervention programs are in accordance with the requirements of IDEA • After-school, Saturday, and summer school programs are designed to meet the needs
of all students. A concerted effort should be made to provide ample materials for special education students in both general education and special education classes. This was a predominate theme throughout all data sources. We suggest material selection and provision for special needs students be done in conjunction with recommendation one. Specifically, as curriculum maps and pacing guides are created, suggested core and supplemental materials should be included to address the needs of special education students. A part of the district monitoring plan for this action should include district level checks on the availability of materials at the school level. Teacher interviews and observations revealed some extremely poor conditions for special education students. It is imperative that the district investigate and remedy the situation to ensure equitable and safe learning opportunities for all students. This recommendation takes into account data that show:
Learning Point Associates Yonkers Public Schools: Final Report—26
Learning Point Associates Yonkers Public Schools: Final Report—27
• The number of students in inclusion classrooms, according to the director of special education has increased substantially in the past few years (G-4, 5). Nonetheless, as compared to the state average (G-4), the district still needs to increase the number of students in inclusion.
• Teacher interviews and classroom observations reveal differences in the physical learning environment. While some teachers reported poor classroom conditions, others reported excellent conditions (G-7). Teachers reported a lack of adequate space more frequently at the elementary level (G-7, H-2). Observations of special education classrooms revealed that in 86% of the lessons, environments had materials arranged for easy access, seating arrangements to support active engagements, and had room arrangements that allowed for whole-group, small-group, or independent work (M-5).
• Lack of adequate materials was a theme that resonated throughout the data sets. In the observations of special education teachers, 79% of the lessons employed teacher-selected materials (M-6). District administrators supported this by indicating that these teachers often have to supplement the curriculum to meet the needs of their students, at that this is done on in building level (D-6). Special education teachers also reported generally a need for more materials (H-2), as did general education teachers (F-4). Parents also expressed concern about inadequate materials for all students (J-3).
• Support services in general are not aligned to state standards (D-7, C-7), and that there are problems with the current pre-referral and early intervention system (G-5).
• Staff shortages and lack of teacher participation are cited as problems (G-5). • Regarding the alignment of support services, administrators noted that this is especially
challenging because each program has a different funding stream with different requirements (D-7).
• Teachers also noted a loss of key personnel as a barrier to providing sufficient support (F-4).
References McCarney, S.B., Wunderlich, K.C., & House, S.N. (Eds.). (2006). Pre-referral intervention
manual (PRIM)-Third Edition. Columbia, MO: Hawthorne Educational Services.
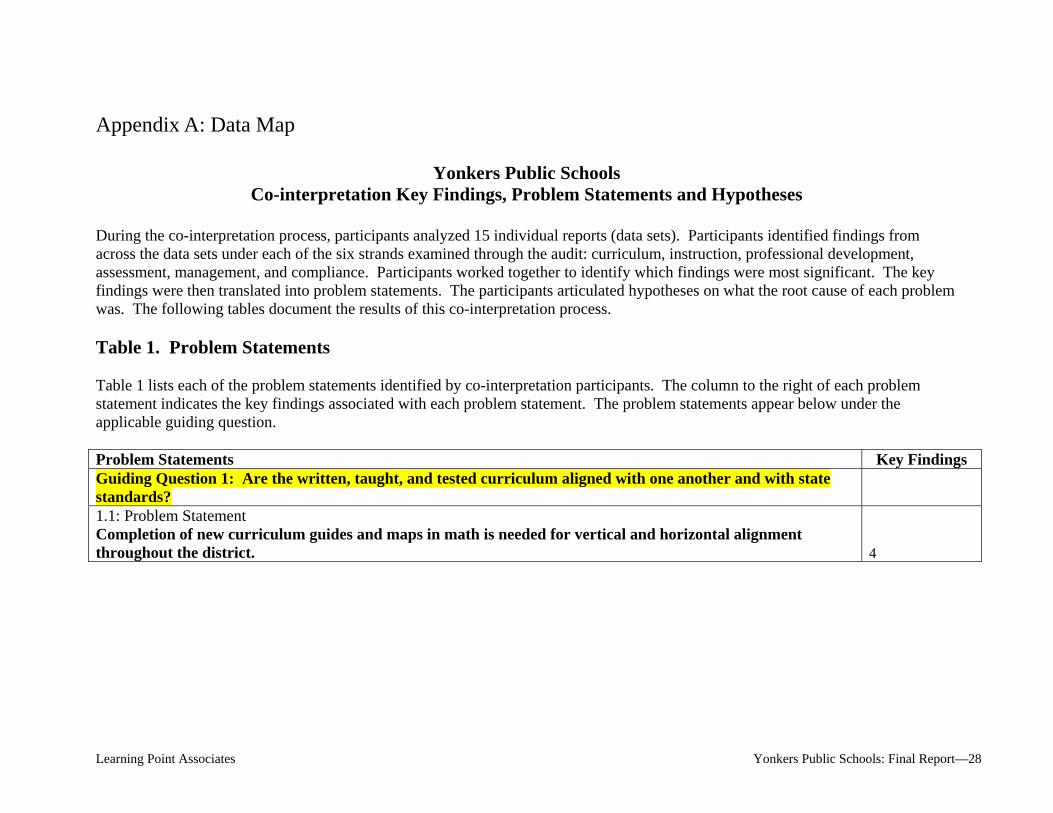
Appendix A: Data Map
Yonkers Public Schools Co-interpretation Key Findings, Problem Statements and Hypotheses
During the co-interpretation process, participants analyzed 15 individual reports (data sets). Participants identified findings from across the data sets under each of the six strands examined through the audit: curriculum, instruction, professional development, assessment, management, and compliance. Participants worked together to identify which findings were most significant. The key findings were then translated into problem statements. The participants articulated hypotheses on what the root cause of each problem was. The following tables document the results of this co-interpretation process. Table 1. Problem Statements Table 1 lists each of the problem statements identified by co-interpretation participants. The column to the right of each problem statement indicates the key findings associated with each problem statement. The problem statements appear below under the applicable guiding question. Problem Statements Key Findings Guiding Question 1: Are the written, taught, and tested curriculum aligned with one another and with state standards?
1.1: Problem Statement Completion of new curriculum guides and maps in math is needed for vertical and horizontal alignment throughout the district. 4
Learning Point Associates Yonkers Public Schools: Final Report—28
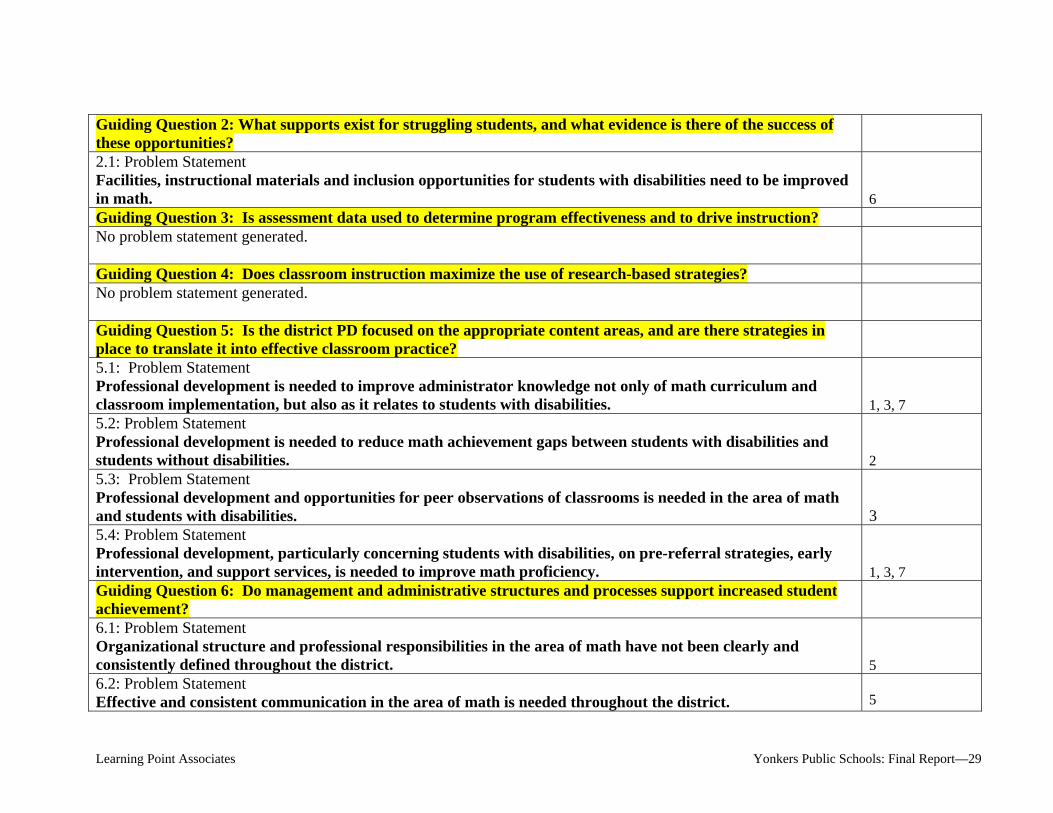
Guiding Question 2: What supports exist for struggling students, and what evidence is there of the success of these opportunities?
2.1: Problem Statement Facilities, instructional materials and inclusion opportunities for students with disabilities need to be improved in math. 6 Guiding Question 3: Is assessment data used to determine program effectiveness and to drive instruction? No problem statement generated. Guiding Question 4: Does classroom instruction maximize the use of research-based strategies? No problem statement generated. Guiding Question 5: Is the district PD focused on the appropriate content areas, and are there strategies in place to translate it into effective classroom practice?
5.1: Problem Statement Professional development is needed to improve administrator knowledge not only of math curriculum and classroom implementation, but also as it relates to students with disabilities. 1, 3, 7 5.2: Problem Statement Professional development is needed to reduce math achievement gaps between students with disabilities and students without disabilities. 2 5.3: Problem Statement Professional development and opportunities for peer observations of classrooms is needed in the area of math and students with disabilities.
3
5.4: Problem Statement Professional development, particularly concerning students with disabilities, on pre-referral strategies, early intervention, and support services, is needed to improve math proficiency. 1, 3, 7 Guiding Question 6: Do management and administrative structures and processes support increased student achievement?
6.1: Problem Statement Organizational structure and professional responsibilities in the area of math have not been clearly and consistently defined throughout the district. 5 6.2: Problem Statement Effective and consistent communication in the area of math is needed throughout the district.
5
Learning Point Associates Yonkers Public Schools: Final Report—29
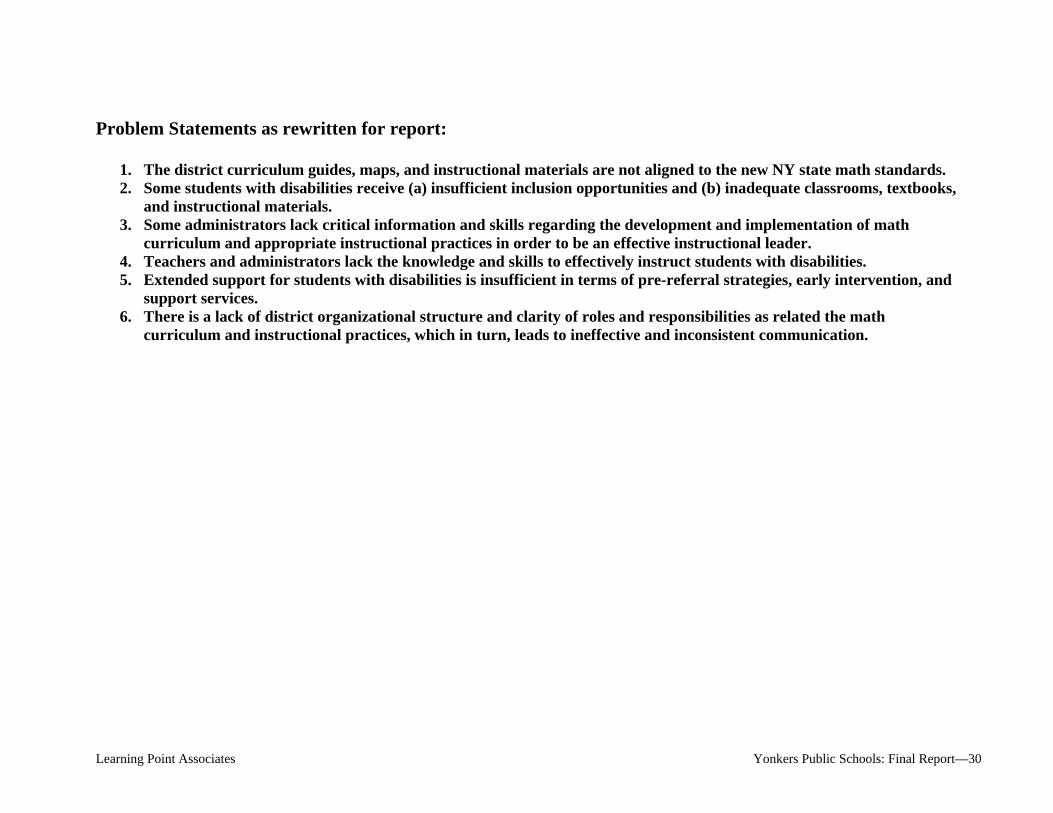
Problem Statements as rewritten for report:
1. The district curriculum guides, maps, and instructional materials are not aligned to the new NY state math standards. 2. Some students with disabilities receive (a) insufficient inclusion opportunities and (b) inadequate classrooms, textbooks,
and instructional materials. 3. Some administrators lack critical information and skills regarding the development and implementation of math
curriculum and appropriate instructional practices in order to be an effective instructional leader. 4. Teachers and administrators lack the knowledge and skills to effectively instruct students with disabilities. 5. Extended support for students with disabilities is insufficient in terms of pre-referral strategies, early intervention, and
support services. 6. There is a lack of district organizational structure and clarity of roles and responsibilities as related the math
curriculum and instructional practices, which in turn, leads to ineffective and inconsistent communication.
Learning Point Associates Yonkers Public Schools: Final Report—30
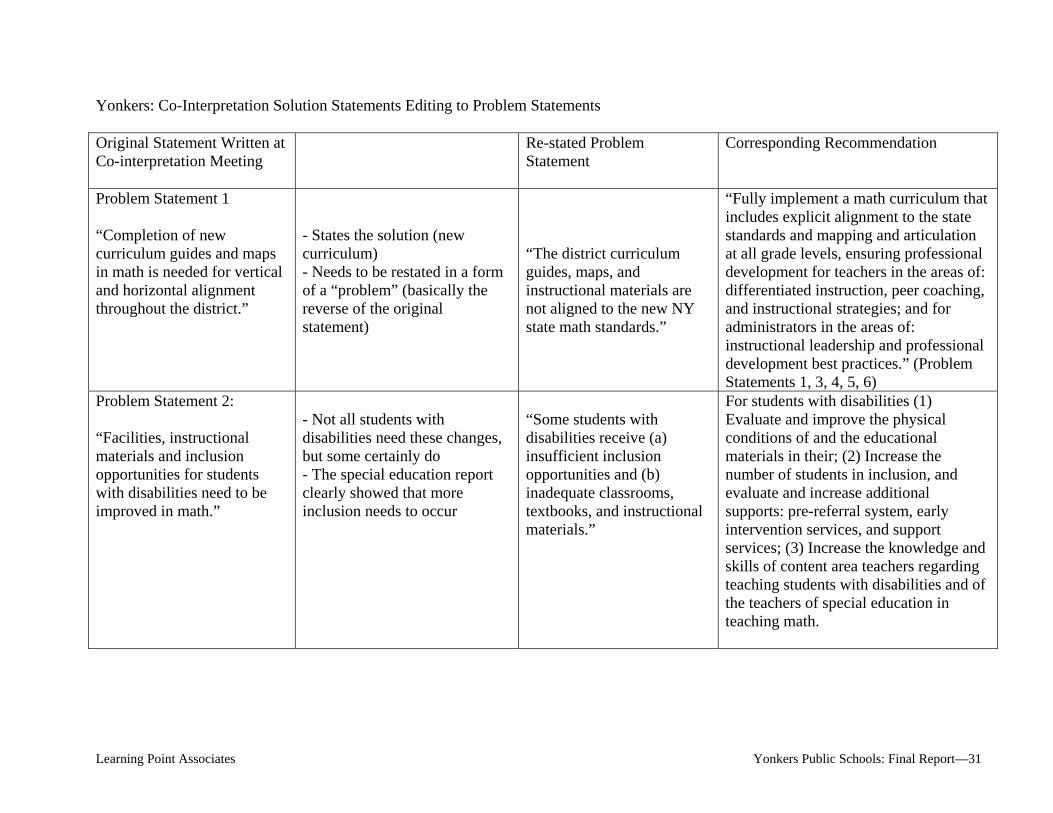
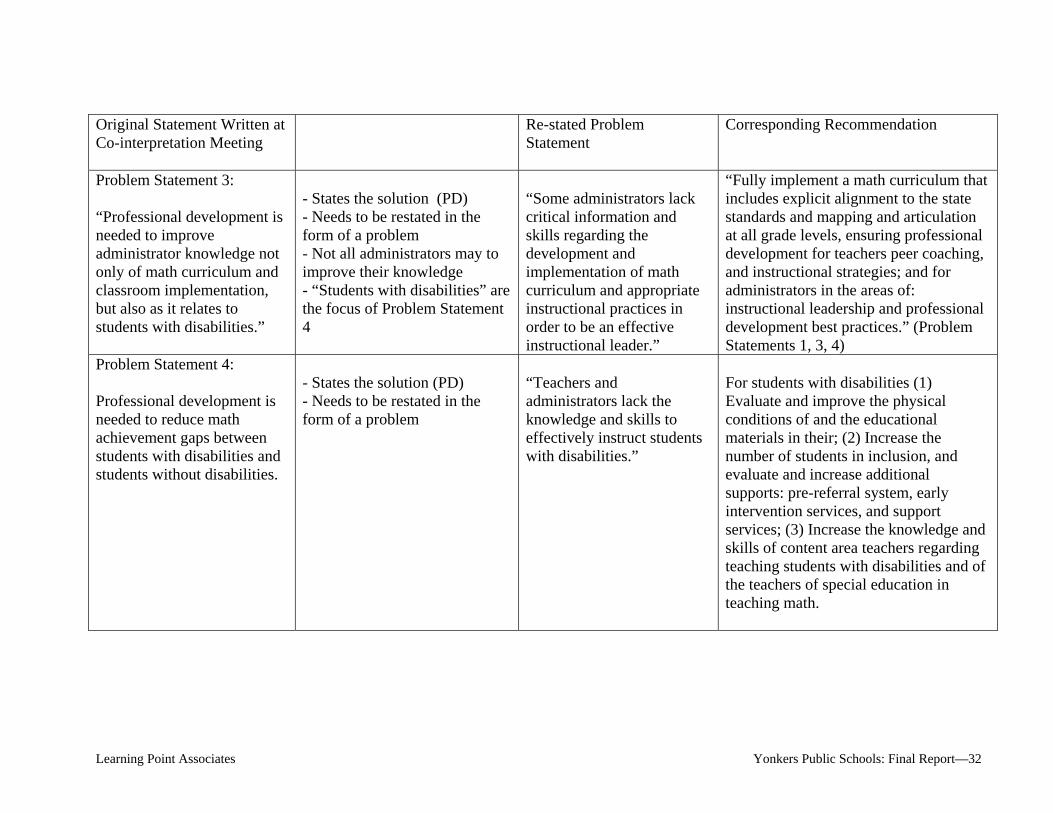
Yonkers: Co-Interpretation Solution Statements Editing to Problem Statements Original Statement Written at Co-interpretation Meeting
Re-stated Problem Statement
Corresponding Recommendation
Problem Statement 1 “Completion of new curriculum guides and maps in math is needed for vertical and horizontal alignment throughout the district.”
- States the solution (new curriculum) - Needs to be restated in a form of a “problem” (basically the reverse of the original statement)
“The district curriculum guides, maps, and instructional materials are not aligned to the new NY state math standards.”
“Fully implement a math curriculum that includes explicit alignment to the state standards and mapping and articulation at all grade levels, ensuring professional development for teachers in the areas of: differentiated instruction, peer coaching, and instructional strategies; and for administrators in the areas of: instructional leadership and professional development best practices.” (Problem Statements 1, 3, 4, 5, 6)
Problem Statement 2: “Facilities, instructional materials and inclusion opportunities for students with disabilities need to be improved in math.”
- Not all students with disabilities need these changes, but some certainly do - The special education report clearly showed that more inclusion needs to occur
“Some students with disabilities receive (a) insufficient inclusion opportunities and (b) inadequate classrooms, textbooks, and instructional materials.”
For students with disabilities (1) Evaluate and improve the physical conditions of and the educational materials in their; (2) Increase the number of students in inclusion, and evaluate and increase additional supports: pre-referral system, early intervention services, and support services; (3) Increase the knowledge and skills of content area teachers regarding teaching students with disabilities and of the teachers of special education in teaching math.
Learning Point Associates Yonkers Public Schools: Final Report—31
Original Statement Written at Co-interpretation Meeting
Re-stated Problem Statement
Corresponding Recommendation
Problem Statement 3: “Professional development is needed to improve administrator knowledge not only of math curriculum and classroom implementation, but also as it relates to students with disabilities.”
- States the solution (PD) - Needs to be restated in the form of a problem - Not all administrators may to improve their knowledge - “Students with disabilities” are the focus of Problem Statement 4
“Some administrators lack critical information and skills regarding the development and implementation of math curriculum and appropriate instructional practices in order to be an effective instructional leader.”
“Fully implement a math curriculum that includes explicit alignment to the state standards and mapping and articulation at all grade levels, ensuring professional development for teachers peer coaching, and instructional strategies; and for administrators in the areas of: instructional leadership and professional development best practices.” (Problem Statements 1, 3, 4)
Problem Statement 4: Professional development is needed to reduce math achievement gaps between students with disabilities and students without disabilities.
- States the solution (PD) - Needs to be restated in the form of a problem
“Teachers and administrators lack the knowledge and skills to effectively instruct students with disabilities.”
For students with disabilities (1) Evaluate and improve the physical conditions of and the educational materials in their; (2) Increase the number of students in inclusion, and evaluate and increase additional supports: pre-referral system, early intervention services, and support services; (3) Increase the knowledge and skills of content area teachers regarding teaching students with disabilities and of the teachers of special education in teaching math.
Learning Point Associates Yonkers Public Schools: Final Report—32
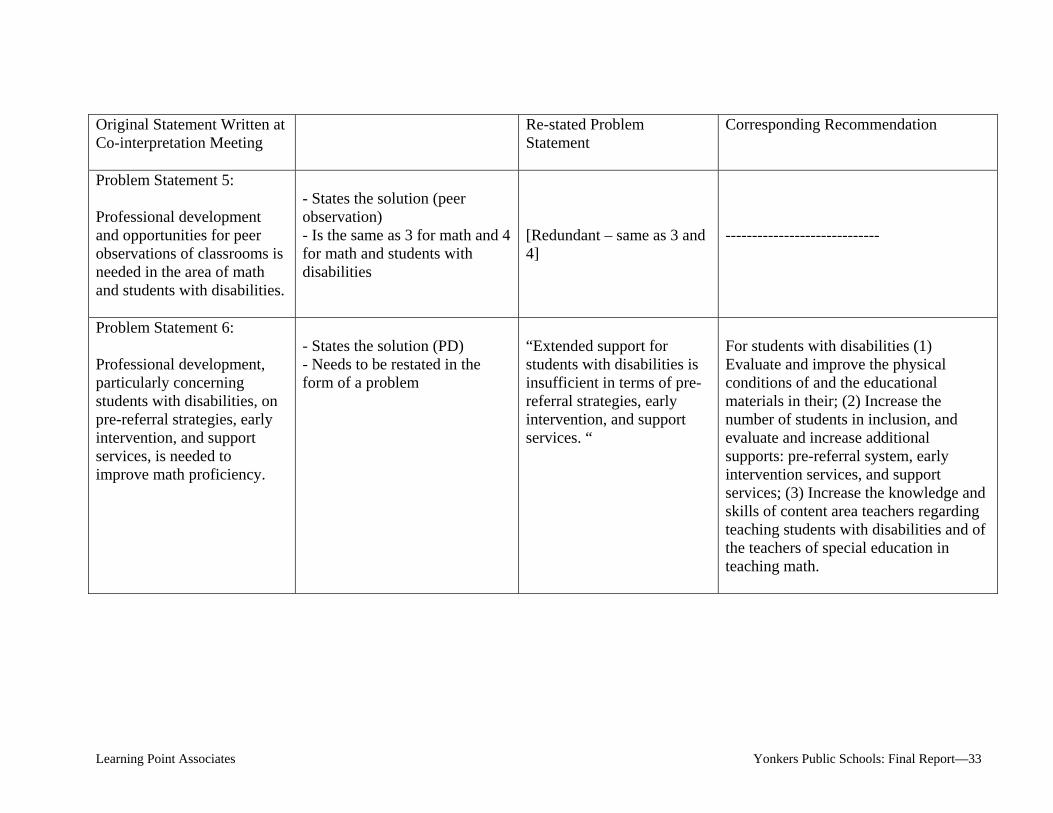
Original Statement Written at Co-interpretation Meeting
Re-stated Problem Statement
Corresponding Recommendation
Problem Statement 5: Professional development and opportunities for peer observations of classrooms is needed in the area of math and students with disabilities.
- States the solution (peer observation) - Is the same as 3 for math and 4 for math and students with disabilities
[Redundant – same as 3 and 4]
-----------------------------
Problem Statement 6: Professional development, particularly concerning students with disabilities, on pre-referral strategies, early intervention, and support services, is needed to improve math proficiency.
- States the solution (PD) - Needs to be restated in the form of a problem
“Extended support for students with disabilities is insufficient in terms of pre-referral strategies, early intervention, and support services. “
For students with disabilities (1) Evaluate and improve the physical conditions of and the educational materials in their; (2) Increase the number of students in inclusion, and evaluate and increase additional supports: pre-referral system, early intervention services, and support services; (3) Increase the knowledge and skills of content area teachers regarding teaching students with disabilities and of the teachers of special education in teaching math.
Learning Point Associates Yonkers Public Schools: Final Report—33
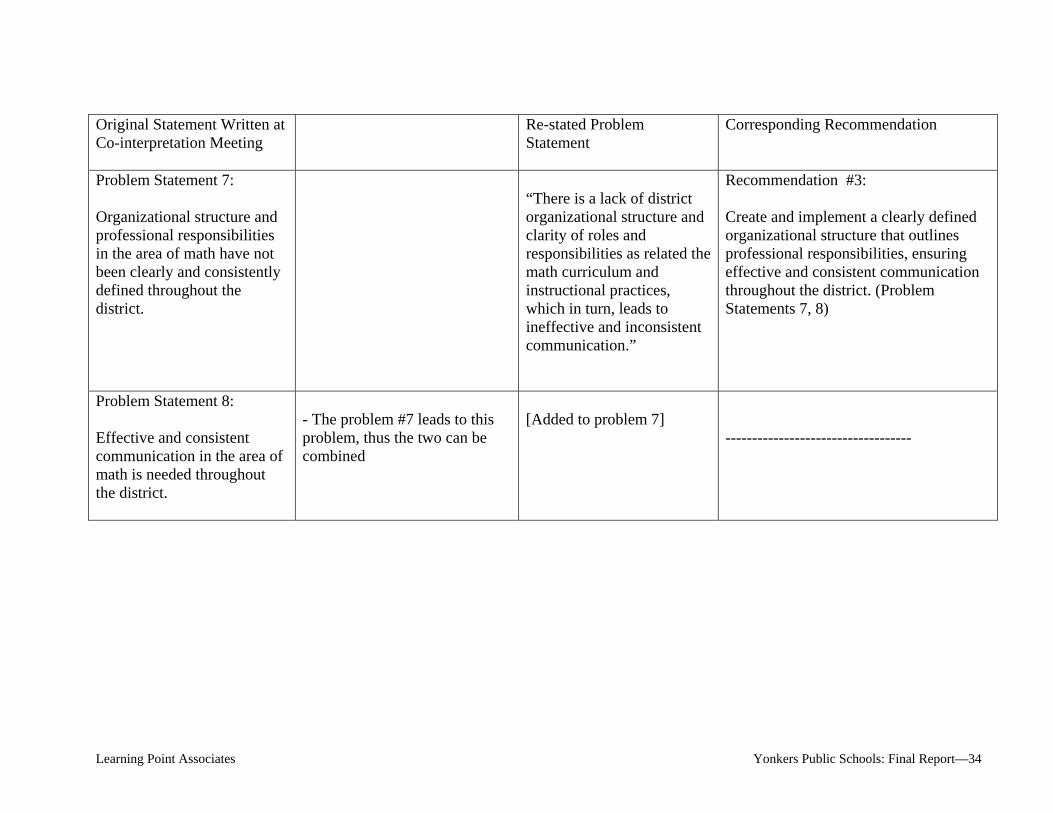
Original Statement Written at Co-interpretation Meeting
Re-stated Problem Statement
Corresponding Recommendation
Problem Statement 7: Organizational structure and professional responsibilities in the area of math have not been clearly and consistently defined throughout the district.
“There is a lack of district organizational structure and clarity of roles and responsibilities as related the math curriculum and instructional practices, which in turn, leads to ineffective and inconsistent communication.”
Recommendation #3: Create and implement a clearly defined organizational structure that outlines professional responsibilities, ensuring effective and consistent communication throughout the district. (Problem Statements 7, 8)
Problem Statement 8: Effective and consistent communication in the area of math is needed throughout the district.
- The problem #7 leads to this problem, thus the two can be combined
[Added to problem 7]
-----------------------------------
Learning Point Associates Yonkers Public Schools: Final Report—34
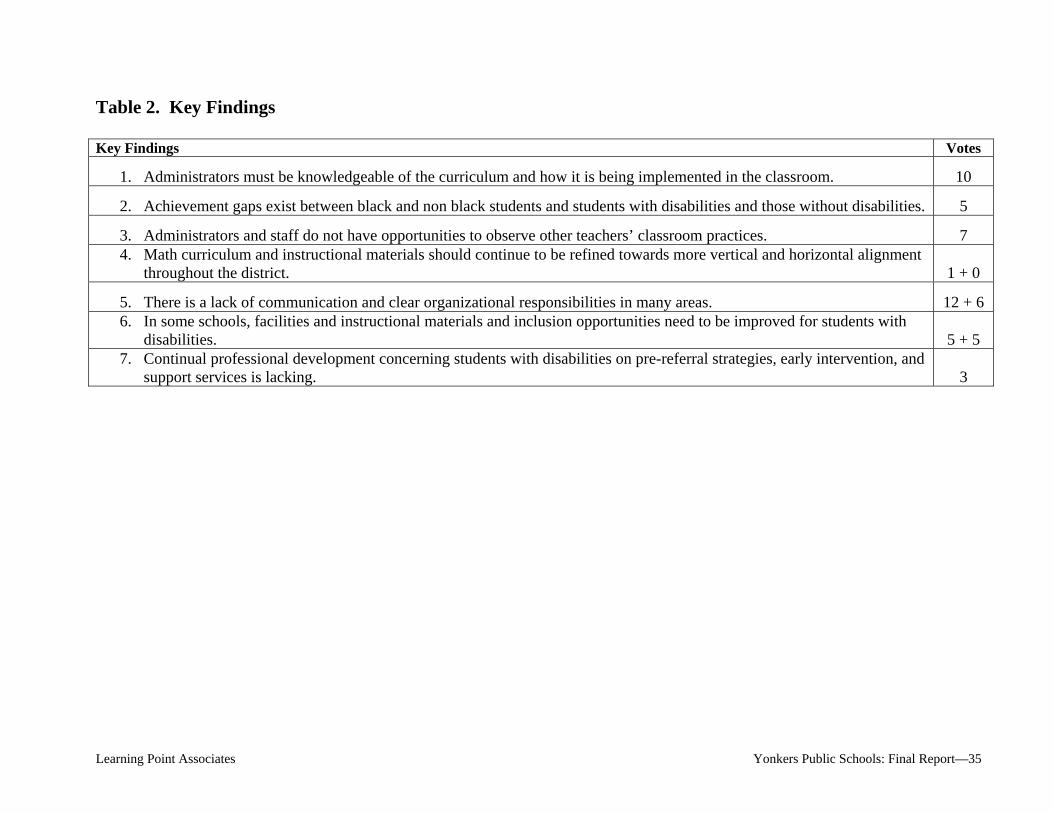
Table 2. Key Findings Key Findings Votes
1. Administrators must be knowledgeable of the curriculum and how it is being implemented in the classroom. 10
2. Achievement gaps exist between black and non black students and students with disabilities and those without disabilities. 5
3. Administrators and staff do not have opportunities to observe other teachers’ classroom practices. 7 4. Math curriculum and instructional materials should continue to be refined towards more vertical and horizontal alignment
throughout the district. 1 + 0
5. There is a lack of communication and clear organizational responsibilities in many areas. 12 + 6 6. In some schools, facilities and instructional materials and inclusion opportunities need to be improved for students with
disabilities. 5 + 5 7. Continual professional development concerning students with disabilities on pre-referral strategies, early intervention, and
support services is lacking. 3
Learning Point Associates Yonkers Public Schools: Final Report—35
Table 3. All Identified Findings Table 3 lists all of the findings identified by co-interpretation participants. Findings were pulled from various data sets which are available in the supportive documentation section of this report. The data sets include: PR – Preliminary Report (Supportive Document A) SA – Student Assessment Report (Supportive Document B) KDD – Key District Document Review Summary (Supportive Document C) SWD – Students With Disabilities (Supportive Document L) SLE – Students Learning English (Supportive Document N/A) DS – Key Findings from District Interviews (Supportive Document D) TP – Teacher and Principal Report (Supportive Document F) PC – Findings from Parent Focus Group, Student Focus Group, and Community Leaders Focus Group (Supportive Documents J, I, E) CO – Classroom Observation Data Report (Supportive Document K) M&C 1 – Management and Compliance Document Review Summary (Supportive Document M) M&C 2 – Management and Compliance Findings from Administrator and Board Interviews (Supportive Document N) M&C 3 – Management and Compliance Findings from Principal and Teacher Interviews (Supportive Document O) PSAT/NMSQT Data Report—Mathematics (Supportive Document P) Special Education Report (Supportive Document G) Findings From Special Education Teacher Interviews (Supportive Document H) SEC – Surveys of Enacted Curriculum Reports for Schools and Districts (Supportive Document SEC) The letters indicate which section of the supportive documentation the data set can be found in. An indication of where support for each finding is supported can be seen in the table. The numbers indicate the page number in the original draft where the co-interpretation participants found support for this finding. While multiple drafts mean that these page numbers do not necessarily align with the page numbers on the documents as they exist. They still serve to let the reader know approximately where in the document participants found support for a given finding. The final column in the chart indicates the number of participants who felt that each finding should be included in the key findings.
Learning Point Associates Yonkers Public Schools: Final Report—36

PR SA KDD SWD SLE DS TP PC SEC CO MC1 MC2 MC3 Vote
Curriculum and Instruction Group
Curriculum guides/maps are not based upon March 2005 math state standards. X
2 Minimal evidence that written curriculum is vertically and horizontally aligned to instruction throughout the district.
X C-3
1 Lack of evidence of testing policy that tests are aligned to instruction, inform instruction, or impact achievement.
X C-3
Results of walk-throughs lacking as a means to provide evidence for implementation of written curriculum.
X C-3
Policies regarding equal access and opportunities are not in place for all students except ELL.
X C-5
School building and facilities do not have plans to support instruction of written curriculum.
X C-5
2 Lack of evidence of instructional framework to show instructional models that are implemented in schools.
X C-6
3 Lack of evidence that shows emphasis on culture, safety, equity in relationship to learning environments.
X C-6
Lack of evidence that extended-day support/AIS is driven by the regular instruction program.
X C-7
Learning Point Associates Yonkers Public Schools: Final Report—37
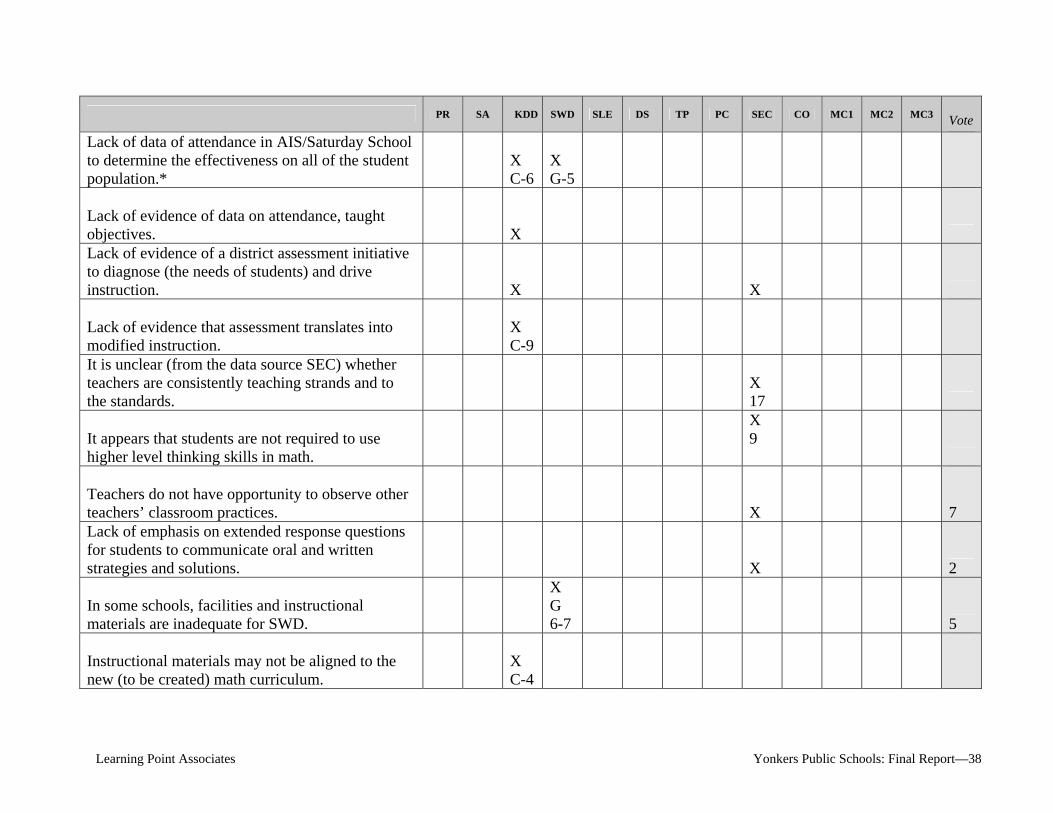
PR SA KDD SWD SLE DS TP PC SEC CO MC1 MC2 MC3 Vote
Lack of data of attendance in AIS/Saturday School to determine the effectiveness on all of the student population.*
X C-6
X G-5
Lack of evidence of data on attendance, taught objectives. X
Lack of evidence of a district assessment initiative to diagnose (the needs of students) and drive instruction. X
X
Lack of evidence that assessment translates into modified instruction.
X C-9
It is unclear (from the data source SEC) whether teachers are consistently teaching strands and to the standards.
X 17
It appears that students are not required to use higher level thinking skills in math.
X 9
Teachers do not have opportunity to observe other teachers’ classroom practices. X 7 Lack of emphasis on extended response questions for students to communicate oral and written strategies and solutions. X 2
In some schools, facilities and instructional materials are inadequate for SWD.
X G 6- 7 5
Instructional materials may not be aligned to the new (to be created) math curriculum.
X C- 4
Learning Point Associates Yonkers Public Schools: Final Report—38
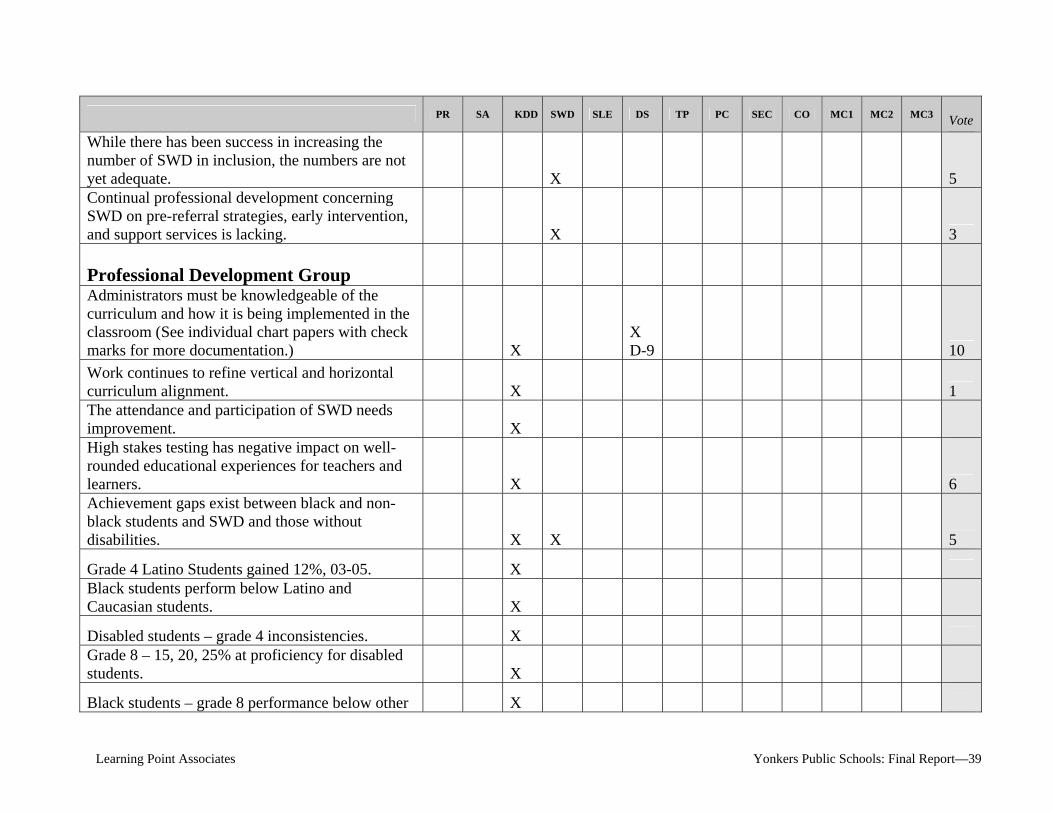
PR SA KDD SWD SLE DS TP PC SEC CO MC1 MC2 MC3 Vote
While there has been success in increasing the number of SWD in inclusion, the numbers are not yet adequate. X 5 Continual professional development concerning SWD on pre-referral strategies, early intervention, and support services is lacking. X 3
Professional Development Group
Administrators must be knowledgeable of the curriculum and how it is being implemented in the classroom (See individual chart papers with check marks for more documentation.) X -
X D 9 10
Work continues to refine vertical and horizontal curriculum alignment. X 1 The attendance and participation of SWD needs improvement. X
High stakes testing has negative impact on well-rounded educational experiences for teachers and learners. X
6 Achievement gaps exist between black and non-black students and SWD and those without disabilities. X X 5
Grade 4 Latino Students gained 12%, 03-05. X Black students perform below Latino and Caucasian students. X
Disabled students – grade 4 inconsistencies. X Grade 8 – 15, 20, 25% at proficiency for disabled students. X
Black students – grade 8 performance below other X
Learning Point Associates Yonkers Public Schools: Final Report—39

PR SA KDD SWD SLE DS TP PC SEC CO MC1 MC2 MC3 Vote
students.
No chance in grade 8 math proficiency levels. X
PSAT scores similar across schools (score-wise). X More females taking the test, but higher male performance. X
87% PSAT results below national results. X Minority males demonstrate lower participation rates in “opportunities” of higher level. (e.g. PSAT). X Non-resident students perform higher then resident students (citizens). X
Top skills need improvement. X
Some findings are inaccurate and inconsistent. X Principals express a need for more professional development. X Not all district staff are aware of program requirements in various areas. X Concern continues regarding vertical and horizontal alignment and implementation of curriculum at the secondary level. X No policy to ensure assessment of student work drives instruction. X Assessment results do not necessarily translate into modified instruction. X No evidence that PD learning is monitored by administrators. X
Little evidence to support staff development X
Learning Point Associates Yonkers Public Schools: Final Report—40
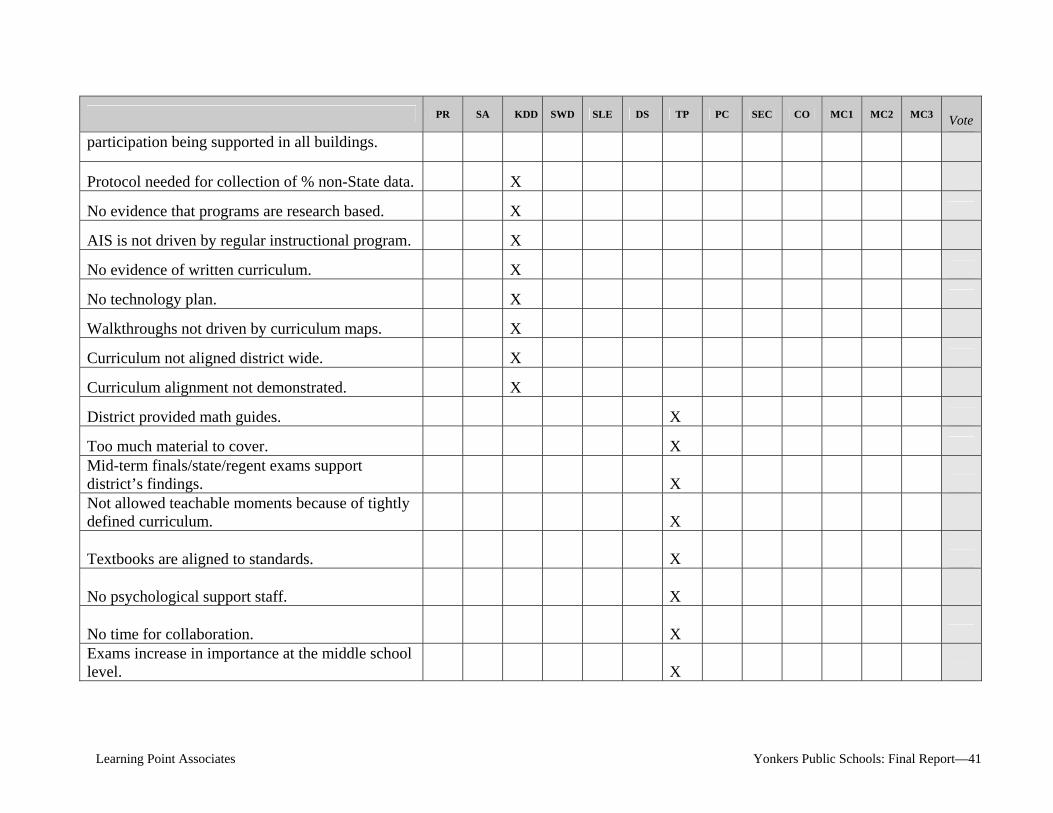
PR SA KDD SWD SLE DS TP PC SEC CO MC1 MC2 MC3 Vote
participation being supported in all buildings.
Protocol needed for collection of % non-State data. X
No evidence that programs are research based. X
AIS is not driven by regular instructional program. X
No evidence of written curriculum. X
No technology plan. X
Walkthroughs not driven by curriculum maps. X
Curriculum not aligned district wide. X
Curriculum alignment not demonstrated. X
District provided math guide s. X
Too much material to cove r. X Mid-term finals/state/regent exams support district’s findings. X Not allowed teachable moments because of tightly defined curriculum. X
Textbooks are aligned to standards. X
No psychological support staff. X
No time for collaboratio n. X Exams increase in importance at the middle school level. X
Learning Point Associates Yonkers Public Schools: Final Report—41
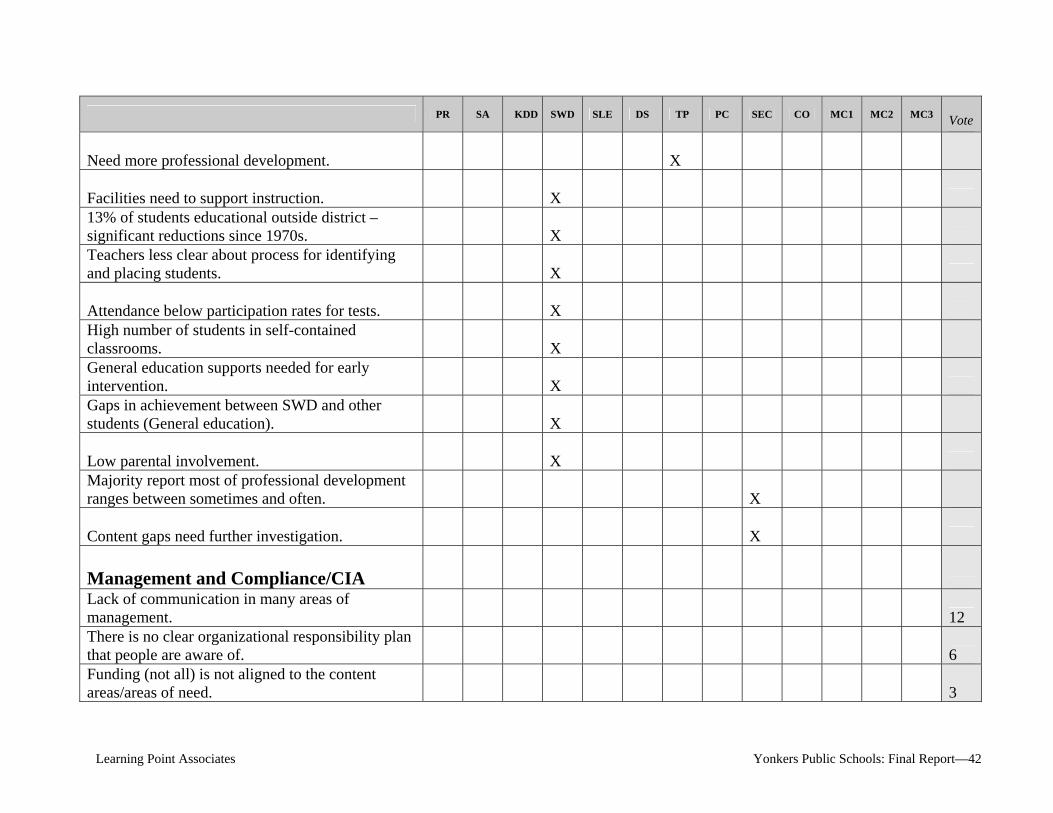
PR SA KDD SWD SLE DS TP PC SEC CO MC1 MC2 MC3 Vote
Need more professional development. X
Facilities need to support instruction. X 13% of students educational outside district – significant reductions since 1970s. X Teachers less clear about process for identifying and placing students. X
Attendance below participation rates for tests. X High number of students in self-contained classrooms. X General education supports needed for early intervention. X Gaps in achievement between SWD and other students (General education). X
Low parental involvement. X Majority report most of professional development ranges between sometimes and often. X
Content gaps need further investigation. X Management and Compliance/CIA
Lack of communication in many areas of management.
12
There is no clear organizational responsibility plan that people are aware of.
6
Funding (not all) is not aligned to the content areas/areas of need.
3
Learning Point Associates Yonkers Public Schools: Final Report—42
Comments: “In some areas data is contradictory” “Too small of sample to get an accurate reading on actual classroom practices” * Including “Targeted Instruction, Title I”
Learning Point Associates Yonkers Public Schools: Final Report—43