you need to be in sevierville
TRANSCRIPT

Seviervillethe Smoky Mountains
Retail GatewayHere are the reasons you want to have a location
in Sevierville, TN and the Smoky Mountains!

A growing population
1950 1960 1970 1980 1990 2000 2010 2012 2013 (est) -
2,000
4,000
6,000
8,000
10,000
12,000
14,000
16,000
18,000
Sevierville Population
Sevierville

In a growing county
1950 1960 1970 1980 1990 2000 2010 2012 2013 (est)
23,375 24,251 28,241
41,418
51,043
71,170
89,889 92,416 93,570
Sevier County Population from 1950 - 2013

And an ever increasing number of visitors
1950 1960 1970 1980 1990 2000 2010 2012 20140
2,000,000
4,000,000
6,000,000
8,000,000
10,000,000
12,000,000
14,000,000
16,000,000
18,000,000
20,000,000
Sevierville GSMNP

With over 18,000,000 tourists per year
The Great Smoky Mountain National ParkDollywood
Ripley’s AquariumA wide variety of entertainment
But most of all, they come
TO SHOP!
What attracts visitors to the Smokies?

Regionally, 7,000,000 people can reach us in under 2 hours

The Five Hour Drive time from Sevierville and Sevier County
reaches a population of over 40,000,000 people
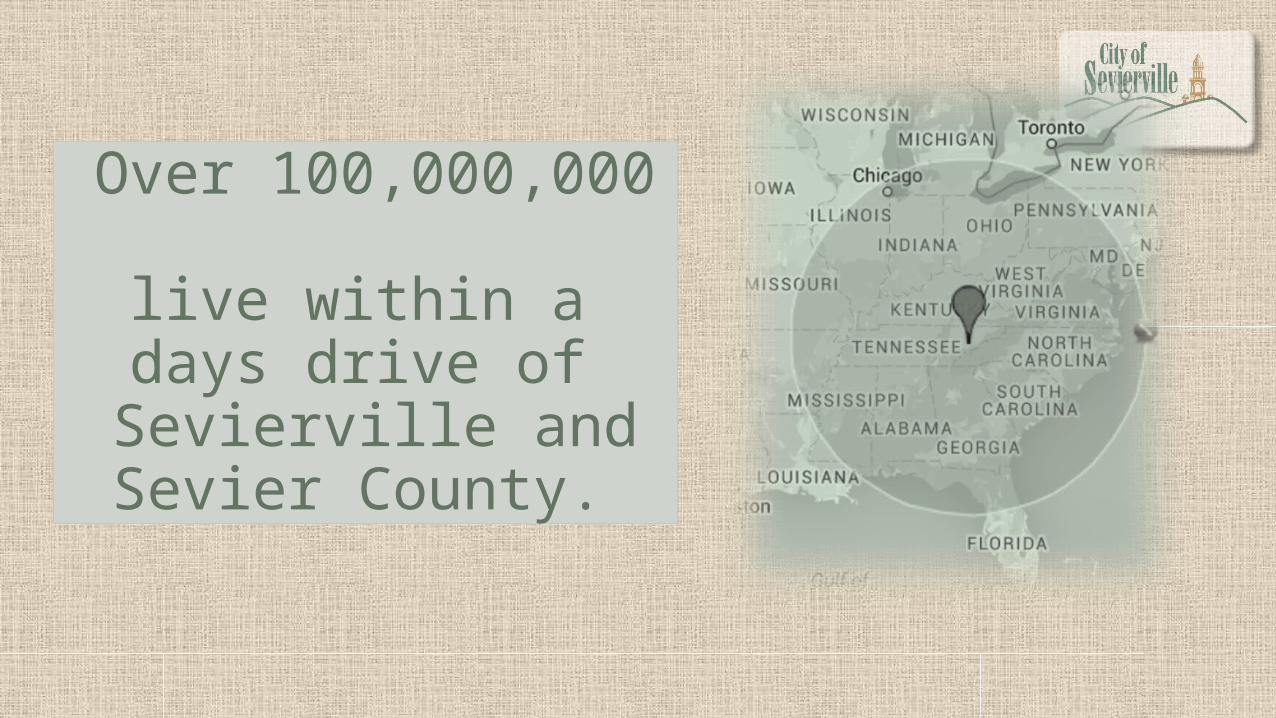
Over 100,000,000 live within a days
drive of Sevierville and Sevier County.

Traffic CountsIn October, 2014More than 40,000 cars per day Travelled Route 66 from I-40 to Sevierville

2004 2005 2006 2007 2008 2009 2010 2011 2012 20130
500,000,000
1,000,000,000
1,500,000,000
2,000,000,000
2,500,000,000
Bldg Mat Gen Merch Groceries Autos, Boats Service Stations Apparel Furniture Restaurants Other
Total Sales for Sevier County

1993 1994 1995 1996 1997 1998 1999 2000 2001 2002 2003 2004 2005 2006 2007 2008 2009 2010 2011 2012 2013 2014 -
200,000,000
400,000,000
600,000,000
800,000,000
1,000,000,000
1,200,000,000
1,400,000,000
Sevierville Total Sales

Sevierville’s Share of the Sevier County Pie
1993 1994 1995 1996 1997 1998 1999 2000 2001 2002 2003 2004 2005 2006 2007 2008 2009 2010 2011 2012 2013 2014 -
200,000,000
400,000,000
600,000,000
800,000,000
1,000,000,000
1,200,000,000
1,400,000,000
Sum of Sevierville SalesSum of Gatlinburg SalesSum of Pigeon Forge SalesSum of Pittman Center SalesSum of Sevier County Sales

Sevier County by the numbers:
• Population: 93,570 (Rank 15)• Per Capita Income: 22,091 (Rank 23)• Per Capita Sales: 22,900 (Rank 2)• Sales Related to travel: 1.7 Billion (Rank 3)• Per capita spending on Apparel and Accessories: $2,830 (Rank 1)*• Per Capita spending on Eating and Drinking: $5034 (Rank 1)*
*Second Ranked, Davidson County has less than half of the per capita Spending in these categories.
Ranking of Tennessee Counties

Per Capita Income
Per Capita Sales
$0 $10,000 $20,000 $30,000 $40,000 $50,000 $60,000 $70,000 $80,000 $90,000
$22,047
$77,643
2013 Per Capita Values
Per Capita Sales is more than3.5 times Per Capita Income
City of Sevierville

Distance our shoppers travel:9%
12%
9%
57%
Sevierville
Within 1 Hour's Drive
Within 2 Hour's Drive
Further away

Spend MapPrepared by BuxtonFrom the Collection of Visa data3/1/13 – 2/28/14
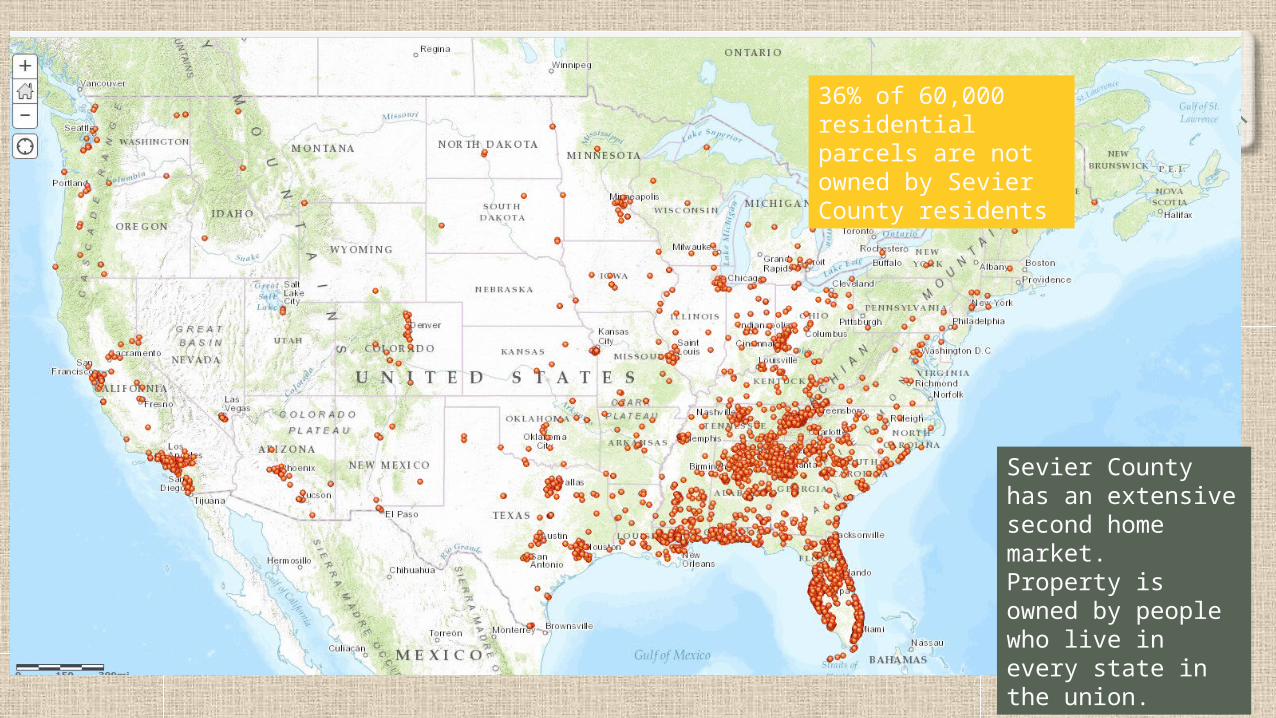
Sevier County has an extensive second home market. Property is owned by people who live in every state in the union.
36% of 60,000 residential parcels are not owned by Sevier County residents
A B C D E F G H I J K L M N O P Q R S0.00%
1.00%
2.00%
3.00%
4.00%
5.00%
6.00%
7.00%
8.00%
9.00%
10.00%
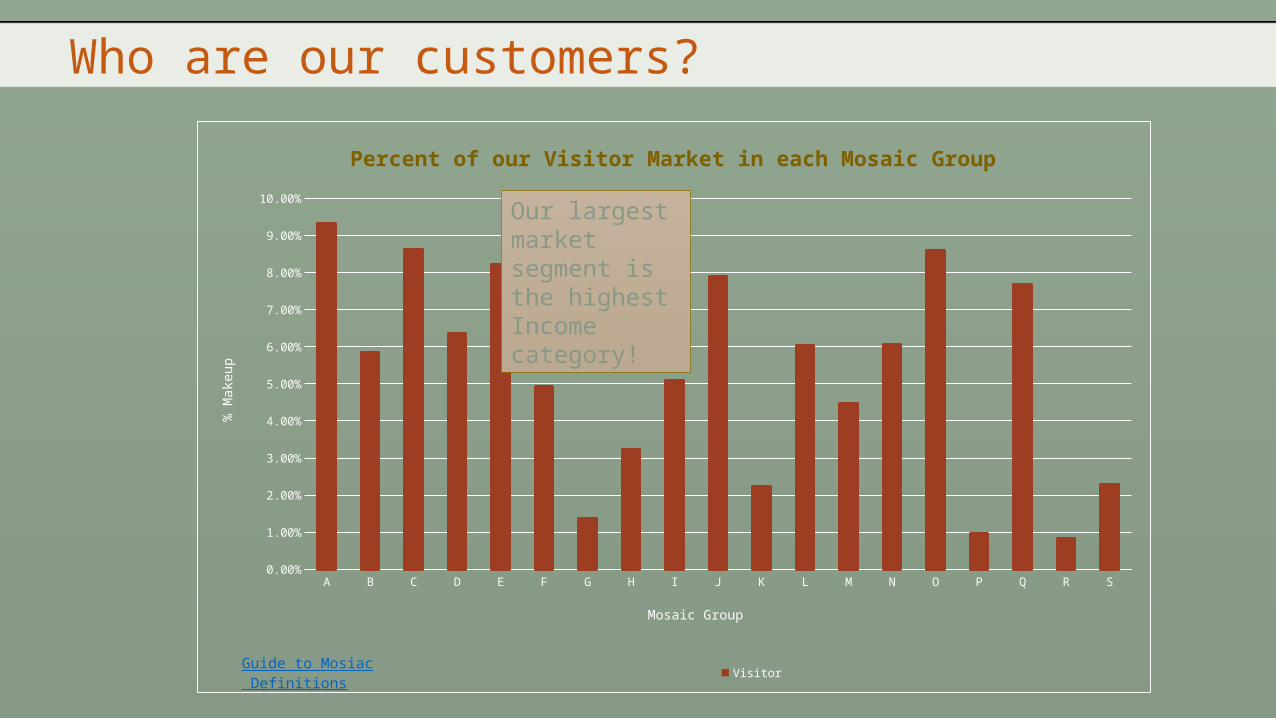
Percent of our Visitor Market in each Mosaic Group
Visitor
Mosaic Group
% M
akeu
p
Guide to Mosiac Definitions
Our largest market segment is the highest Income category!
Who are our customers?

Incomes Greater than $150,000# of US households: 6.13%
# of Sevierville Consumers: 9.32%152% Greater Concentration
Incomes Greater than $100,000# of US households: 4.42%
# of Sevierville Consumers: 5.85%132% Greater Concentration
Incomes Greater than $75,000# of US households: 5.35%
# of Sevierville Consumers: 8.63%161% Greater Concentration
Incomes Greater than $75,000 but less than $150,00
# of US households: 5.02%# of Sevierville Consumers: 6.35%
126% Greater Concentration
Incomes Greater than $50,000 but less than $175,000
# of US households: 5.13%# of Sevierville Consumers: 8.23%
160% Greater Concentration
That equals significant more buying power while they are here
19781979
19801981
19821983
19841985
19861987
19881989
19901991
19921993
19941995
19961997
19981999
20002001
20022003
20042005
20062007
20082009
20102011
20122013
20140
5
10
15
20
25
30
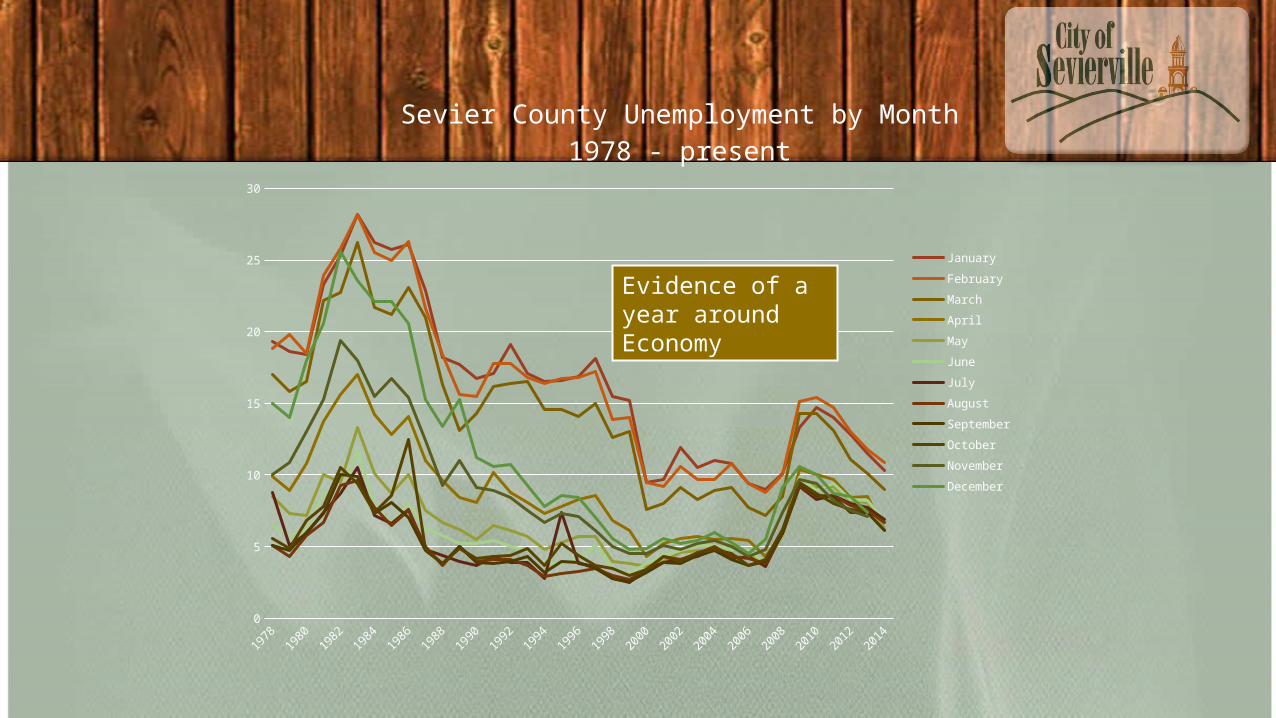
Sevier County Unemployment by Month1978 - present
JanuaryFebruaryMarchAprilMayJuneJulyAugustSeptemberOctoberNovemberDecember
Evidence of a year around Economy

SEVIERVILLE HAS:
• A STRONG VISITOR BASE – OVER 18,000,000 TOURISTS A YEAR• A SOLID REGIONAL ECONOMY• A $3 BILLION ECONOMY AND IT CONTINUES TO GROW• VISITORS WHO COME FROM ALL OVER THE US AND NORTH AMERICA• CONTINUAL REPEAT VISITORS WHO BECOME COMFORTABLE HERE• VISITORS WITH HIGH SOCIO ECONOMIC DEMOGRAPHICS• A VISITOR WHO COMES ON VACATION WITH MONEY TO SPEND

Who is Here?
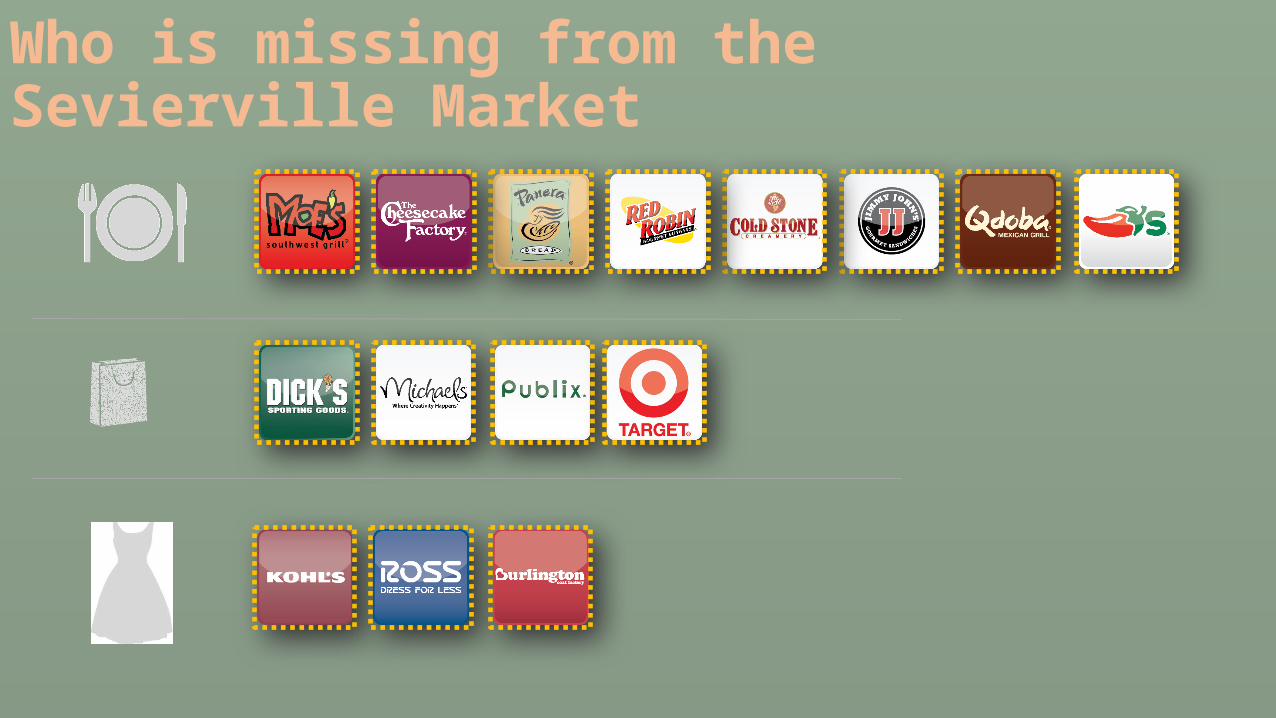
Who is missing from the Sevierville Market

YOU?