yougov capital markets day · media mentions: yougov vs competitors (uk) 733 12,870 8,191 6,853...
TRANSCRIPT

YouGov Capital Markets Day
Building a global leader
Wednesday 6th February 2019

2
Agenda2.00pm | Introduction to YouGov
o Stephan ShakespeareChief Executive Officer, YouGov
o Alex McIntoshChief Financial Officer, YouGov
o Sundip ChahalChief Operating Officer, YouGov
2.30pm | Our Products & Services
o Bianca BruhnRegional CEO Mainland Europe, YouGov
o Amelia BrophyHead of Data Products UK, YouGov
o Q&A
3.00pm | Clients
o Julian NewbyGlobal Profiling Director, MediaCom Worldwide
o Claire SpencerManaging Director for Insight & Analytics, IPG Mediabrands UK
o Tini SevakVice President Audiences & Data, CNN International Commercial
3.30pm | New innovations and the next growth plan
o Stephan ShakespeareChief Executive Officer, YouGov
4.00pm | Q&A
4.30pm | Product demos and drinks

3
Introduction to YouGov

4
Stephan Shakespeare
Chief Executive Officer, YouGov

5
Introduction
The purpose of today is to explain:
How YouGov works
Our next 5-year ambition
Our strategy
Our new ideas

6
How YouGov works
Our success is based on 4 fundamental efficiencies:
1. People proactively fill in surveys by themselves, at their
convenience, on any device
2. We enable unlimited self-input and give public & personal
value in return
3. We build an engaged panel that is always available and
connects all our data
4. We are driven by one data-set (the Cube) and one analytics
system (Crunch)

7
So we have a system, based on:
large engaged panels
massive data design
automated data generation
productising the data
the best analytic tools
expert client service

8
Our offer to clients is systematic data that is...
very wide-ranging
deep in detail
fully connected
highly crunchable
global
cost-efficient
accurate
relevant and applicable
“The best data,
the best tools”

9
Our ambition for growth is undiminished
Our ambition is to be:
the world’s #1 provider of single-source systematic marketing data
used by every public-facing company and organisation
used by hundreds of millions of people as a daily public resource
the world’s largest and most engaged research panel

10
Presentations coming up next
1
Alex will take
you through
the historic
numbers
2
Sunny will
show you how
we engineer
our future
4
Amelia will
introduce you
to our
syndicated
data tools
3
Bianca will
introduce you
to the YouGov
data platform
6
We will share
updates on our
latest
innovations
and the next
five-year
strategy
5
We will hear
from clients
about how it
works for
them

11
Alex McIntosh
Chief Financial Officer, YouGov

12
Our current and next five year growth plans
FY to
31 July
2015
FY to
31 July
2016
FY to
31 July
2017
FY to
31 July
2018
FY to
31 July
2019
FY to
31 July
2020
FY to
31 July
2021
FY to
31 July
2022
FY to
31 July
2023
First five year growth plan
Next five year growth plan

13
In FY14, our five year growth plan focused on improving profitability
7.48.6
10.9
14.5
19.711% 11%12%
14%
17%
0%
2%
4%
6%
8%
10%
12%
14%
16%
18%
0
5
10
15
20
25
FY14 FY15 FY16 FY17 FY18
Adjusted Operating Profit Adjusted Operating Profit Margin£m
Key five year plan growth target: 25% YOY EPS growth FY14-19

14
0.0
20.0
40.0
60.0
80.0
100.0
120.0
140.0
FY14 FY15 FY16 FY17 FY18
Custom Reseach Data Services Data Products
The growth plan focused on Data Products and Services which have operational leverage
Revenue Growth
£m

15
Interim Results to 31 January 2018
Our focus on technology and products has created a platform for scalable profit generation
Adjusted Operating Profit Margin by Divisions
11%13% 13%
15%
24%
33% 32%29%
24%
28%
19% 19%
27%29%
38%
0%
5%
10%
15%
20%
25%
30%
35%
40%
FY14 FY15 FY16 FY17 FY18
Custom Research Data Services Data Products

16
The market YouGov focuses on is worth $46b annually
45%North America$20,574m
35%Europe
$15,937m
15%Asia Pacific
$6,756m
3%Latin America
$1,612m
1%Africa$536m
1%Middle East$414m
Global Market Research
Turnover 2017$45,829 million
YouGov Group revenue in FY18 was £117m

17
The US and UK are the largest research markets in the world, and for YouGov (Operating Profit in £m)
Year to 31 July 2018 Operating Profit
UK12.0
USA16.6
Mainland Europe
2.3
Middle East3.6
Asia Pacific
0.8
Year to 31 July 2014 Operating Profit
UK5.0
USA3.0
Mainland Europe
1.3
Middle East2.2
47%26%
Net Profit
£7.4mNet Profit
£19.7m

18
Media Mentions: YouGov vs Competitors (UK)44,733
12,870
8,191
6,853
5,206
4,991
4,549
4,475
4,158
3,980
3,784
3,599
3,068
2,919
2,725
2,564
2,133
943
775
763
710
498
462
447
367
355
337
190
160
102
60
Source: Meltwater media mentions data for the twelve months to 31 July 2018

19
196,720
194,658
162,060
158,101
120,315
110,639
98,255
77,689
69,673
62,403
43,458
38,603
38,045
35,123
33,204
28,761
25,126
24,080
17,880
17,753
15,102
14,372
12,161
11,138
7,798
7,518
7,347
7,165
6,853
5,822
5,822
5,297
4,856
3,718
2,210
1,569
221
178
21
Media Mentions: YouGov vs Competitors (USA)
Source: Meltwater media mentions data for the twelve months to 31 July 2018
8,835
43,458
2014 2018

20
Our customer base is diverse – mainly focused on marketing activities
Media Owners Media Agencies Brands
2,000+ clients

21
Sundip Chahal
Chief Operating Officer, YouGov

22
2013 2019
4.95%
1.8% - 2.0%
Data Operations overheads
as a % of global revenue
Centres of Excellence – a new model for scale
Current
Technology (Warsaw)
Panel & Data Operations (Bucharest & Mumbai)
Significant contribution to margin improvement
Driven standardisation of operating mode
Led to 24x7 operations and bred true expertise

23
Centres of Excellence – next stage
Future
Finance
Data Design
Research
Customer Service
Current
Technology (Warsaw)
Panel & Data Operations (Bucharest & Mumbai)
Significant contribution to margin improvement
Driven standardisation of operating mode
Led to 24x7 operations and bred true expertise

24
Finance - improved functional management
Make better use of hard financial metrics to drive forward our teams
Quicker turnaround & dissemination of financial information to the teams that need it most
Can be built cost effectively not tied to local offices

25
Data Design – extending our lead
Central team responsible for designing consistent data collection across the world
The YouGov Codebook is housed within the YouGov Cube (our connected longitudinal syndicated data library with over 200,000 variables)
Data collected using a variety of methods
A single-source connected & highly permissioned dataset

26
Research Platform – to deliver the YouGov Screen
Crunch – easy to use analytics platform Allows clients to import 3rd party datasets
Collaborate – self-serve survey system Currently live in UK, US and Germany
Brought together for the YouGov Screen Integrated platform for all YouGov products
and services

27
Client-centricity – maximising opportunities
Build ‘Global Key Account Management’ programme Invest in global team to grow key accounts
Give clients one touchpoint
Customer Service team with Centre of Excellence Gives us the ability to be on 24/7 (like Data
Operations)
Cost effective coverage
Standard process

28
Our Products & Services

29
Bianca Bruhn
Head of Northern Europe, YouGov

30
Syndicated Subscription
Bespoke Connected
The YouGov Platform – a Single System With the Cube in the centre and a variety of engagement
possibilities for the users

31
Syndicated Subscription
Bespoke Connected
Fast Turnaround Research
Bespoke Trackers
Dynamic Segmentation
Seed Audiences for Activation
Digital Campaign Measurement
Etc.
Profiles
BrandIndex
Superior Value Derived from the YouGov Platform

32
Syndicated Subscription
Bespoke Connected
Fast Turnaround Research
Bespoke Trackers
Dynamic Segmentation
Seed Audiences for Activation
Digital Campaign Measurement
Etc.
Superior Value Derived from the YouGov Platform

33
Statement: Next time I
buy/lease a car it will be a
hybrid/electric car?
Agree/Disagree/Neutral
Demonstrating YouGov’s Fast
Turnaround Research Services
and the YouGov Platform

34
Statement: Next time I
buy/lease a car it will be a
hybrid/electric car?
Agree/Disagree/Neutral
REAL-TIME DATA

35
“Electric cars
are the future
of the motor
industry”
“The internet
is my main
source of
information”
“Companies and their brands should
be able to express how they feel on a
topic”
Favorite Activities
Listen to music
Read
Exercise
Online Engagement
Online for: 50 hours per
week
Streaming services: Spotify
Watches TV for: 10 hours
per week
Female40-49 years
old
Income gross
household: more
than £50,000
Greater
London
Marketing Director
...24h later (or less) you have your answer enriched with hundreds of additional, relevant data-points...

36
“Electric cars
are the future
of the motor
industry”
“The internet
is my main
source of
information”
“Companies and their brands should
be able to express how they feel on a
topic”
Favorite Activities
Listen to music
Read
Exercise
Online Engagement
Online for: 50 hours per
week
Streaming services: Spotify
Watches TV for: 10 hours
per week
...You can also move the opposite way in the Platform ... and start by identifying your target segment in the Cube ...
Female40-49 years
old
Income gross
household: more
than £50,000
Greater
London
Marketing Director

37
Statement: Next time I
buy/lease a car it will be a
hybrid/electric car?
Agree/Disagree/Neutral
A re-contact survey –leveraging the cube to target a specific segment with a bespoke question

38
Syndicated Subscription
Bespoke Connected
Fast Turnaround Research
Bespoke Trackers
Dynamic Segmentation
Seed Audiences for Activation
Digital Campaign Measurement
Etc.

39
The Platform is Uniquely Suited for Bespoke Trackers
... allowing clients the opportunity to both play with data themselves and/or continuously
monitor the results via dashboards

40
Bespoke Connected
\\\
Dynamic Segmentation
Example: The Sharing Economy / Collaborative Consumption
Bespoke Tracker combined with Dynamic Segmentation

41
Q2 Q4
0
5
10
15
20
25
30
Jan-18 Feb-18 Mar-18 Apr-18 May-18 Jun-18 Jul-18 Aug-18 Sep-18 Oct-18 Nov-18 Dec-18 Jan-19
Segment 1 Segment 2 Segment 3
Trendline by segment ... and how individual segments develop over time

42
Favorite brands
TV-Shows
Social media
Q2 Q4
Favorite brands
TV-show
Social media
20% 35%

43
Select your seed audience and activate ...

44
How did brand perceptions change for audiences exposed to the ad?
Which campaign content helped drive the call to action?
Did the target audience carry out the call to action?
Measure the effectiveness of your digital campaigns via a YouGov Pixel
Etc.

45
Syndicated Subscription
Bespoke Connected
The YouGov Platform – a Single System With the Cube in the centre and a variety of engagement
possibilities for the users

46
Amelia Brophy
Head of Data Products UK, YouGov

47
Syndicated Subscription
Bespoke Connected
The YouGov Platform – a Single System Powering our syndicated data products

48
Plan & Track: Global Footprint
Daily consumer feedback in 38 countries
(and growing)!
BrandIndex ‘Track’
(38)
• Mexico
• Brazil
• Canada
• Argentina
• Chile
• Peru
• Ireland
• Netherlands
• Russia
• Belgium
• Japan
• South Korea
• Saudi Arabia
• UAE
• Egypt
• Columbia
• Pakistan
• Italy
• Spain
BrandIndex
Plan & Track
Profiles ‘Plan’
(19)
• USA
• Sweden
• Denmark
• Norway
• Finland
• UK
• Germany
• France
• China
• Indonesia
• Malaysia
• Singapore
• Thailand
• Australia
• Hong Kong
• India
• Taiwan
• Philippines
• Vietnam

49
PlanIdentify and understand
your audiences in
unrivalled depth
ActivateBuy that audience in the
digital space
TrackTrack the metrics that
matter & evaluate
campaign success
Single Audience View
With YouGov’s connected data set, a single audience view can be used throughout the marketing workflow
YouGov Profiles YouGov Audience Data YouGov BrandIndex
With our connected data you can…

50
Profiles enables unrivalled audience understanding
PlanIdentify and understand
your audiences in
unrivalled depth
YouGov Profiles
Identify Specific Audiences &
Target Groups
Understand Who They Are,
What They See, Hear, Think,
And Buy
Build And Enhance
Segmentation, Increasing
Actionability
Plan Media, And Streamline
Buying Through Data
Integrations

51
We use our tried and tested
survey platform in order to
obtain key datapoints from
our panellists.
Demographics
Attitudes
Personality traits
BrandIndex metrics
YouGov Online
A select sample of our panel
opt in to be passively tracked.
This means we can see the
actual websites and social
media pages they interact
with.
Websites visited
Facebook pages ‘liked’
Twitter handles followed
YouTube channels
subscribed
The YouGov website allows
panellists to sign in and
answer daily topical questions
and rate various entities.
Topical questions
YouGov Likes
Music, films, books, TV
Celebrities & pubic
figures
Brands
Online Surveys Passive Tracking
Constant conversation with panellists through varied data collection methods

52
Demographics Collected via Online Surveys
More than 450 variables reflecting
general demographic makeup,
household finances, family and
household details, locations,
parliamentary constituency,
occupation and employment status,
education levels and more
AttitudesCollected via Online Surveys supplemented
with YouGov Online
300 attitudinal statements with
which panellists agree or disagree.
Collected across more than 15
categories, ranging from advertising
to outlook to travel to politics
Brand Use & PerceptionCollected via Online Surveys completed by
4,000 panellists each day
Understand your audience’s usage
and perception of ~1,400 brands
Look at brands your audiences are
current customers of, have a
positive impression of, would
consider buying, etc. Collected
daily, tracked over time through
BrandIndex survey
Consumer & Lifestyle Collected via Online Surveys
More than 7,400 variables
measuring panellists’ consumer
habits, purchasing patterns and
category specific usage and
behaviours
Issues & InterestsCollected via YouGov Online
Unique perspective questions (with
over 700 variables) that capture
social behaviour, outlook and
behavioural habits
PersonalityCollected via Online Surveys supplemented with
YouGov Online
Panellists share their views on 50
political and social issues, and rate
the intensity of their interests
Panellists rate interests in more
than 2,300 subjects using a 4 point
scale (top interest, very interested,
not really interested, no interest)
Building a robust, data set with over 200,000 variables and unrivalled breadth and depth

53
Media
Consumption
Consumption of above-the-line.
Includes TV viewership at channel,
genre and program level, radio
listenership (40+ key commercial
stations) and print readership
(national / local)
Online and Mobile
Behaviour
How do your audience behave and
consume media online?
Identify actual (passively tracked)
online and application usage
From a bank of 60,000+ websites
and 20,000+ mobile applications
Social Media EngagementCollected via Passive Metered Digital Data
Review social media engagement,
including platforms used, regularity
of use
Passively-tracked data on Facebook
pages liked and Twitter accounts
followed
PoliticsCollected via Online Surveys supplemented
with YouGov Online
UK Political views, including
opinions regarding political parties
and institutions, voting intention
and levels of political interest
RatingsCollected via YouGov Online
Interesting opinion questions posed
to panellists each day, reflecting
the news from around the globe;
recent topics range from university
fees to labour strikes to the Rugby
World Cup
TopicalCollected via YouGov Online
Panellists share likes and dislikes
across 27,000+ topics in 60
categories, using a five point scale
(love, like, feel neutral, dislike or
really dislike).
Topics include brands, celebrities,
movies, activities, cars, music artists,
political parties, sports and more.
Enabling granular audience understanding that evolves over time

54
Have you created
a really great
Target Group
filter or made a
great analysis
deck?
Easily share these
with your
colleagues so
everyone can use
them
In-Tool Functionality Work with our Data Services Team
Run a really
useful analysis
that you know
you’ll be
referencing again
and again?
Save it as a
Favourite and it
will be updated
every week with
the new data set
Find a client has
a specific
question not yet
available in
Profiles?
Work with our
Omni team to ask
this to our panel
and then
incorporate it in
Profiles to act as
a new variable
Want to a specific
group more about
their answer to a
specific question?
Work with our
Omni team to
contact this group
with your chosen
questions and
then in Profiles
cross answers
with our variables
Want to
understand and
profile specific
audience groups
in depth?
Create a bespoke
or plug in an
existing
segmentation into
Profiles and cross
these groups with
all our variables
Customisation of data & tools to deliver additional value
Team
SharingFavourites
Variable
AdditionsRe-Contact Segmentation

55
PlanIdentify and understand
your audiences in
unrivalled depth
ActivateBuy that audience in the
digital space
TrackTrack the metrics that
matter & evaluate
campaign success
Single Audience View
With YouGov’s connected data set, a single audience view can be used throughout the marketing workflow
YouGov Profiles YouGov Audience Data YouGov BrandIndex
With our connected data you can…

56
TrackTrack the metrics that
matter & evaluate
campaign success
YouGov BrandIndex
BrandIndex is a continuous daily conversation with consumers about brands
Evaluate campaign
performance including (lower
funnel metrics)
Monitor brand health at a
nat. rep and target group
level
Benchmark against
competitors within and
across the category
Measure the impact of
unforeseen events

57
Consideration:
When you are in the market next to make a
purchase, which brands would you consider?
Purchase Intent:
Of the brands considered, which are you most
likely to purchase?
Former Customer:
Are you a former customer? Would you
consider purchasing?
Current Customer:
Are you a current customer? Would you
consider purchasing?
Aided Brand Awareness:
Are you aware of the brand?
Advertising Awareness:
Have you seen recent advertising?
Word of Mouth (WOM) Exposure
Have you recently spoken about the brand?
Buzz:
Have you heard anything positive or negative
about the brand in the last two weeks?
Attention: Derived Metric
Positive plus negative buzz
General Impression:
Do you have a positive or negative view of the brand?
Recommend:
Would you recommend this brand to a friend or tell them
to avoid it?
Quality:
Is the brand of good or poor quality?
Value:
Does the brand offer good or poor value for money?
Corporate Reputation:
Would you be proud or embarrassed to work for this brand?
Satisfaction:
Are you a recently satisfied/dissatisfied customer of the
brand?
Index: Derived Metric
Average of brand health measures
Brand Health Metrics Lower Funnel MetricsMedia Metrics
With 16 key metrics to measure and understand brand health

58
Sent out every day to a nationally representatives panel, achieving 80-100 completes per day per brandcovering over 13,000 brands globally
Aided Brand Awareness Screen out those not aware
Buzz Positive and Negative
Ad Awareness Seen ad in last 2 weeks
Word of Mouth
Exposure Talked about in last 2 weeks
Former Customer Recently purchased/ever
owned
Impression Positive and Negative
Quality Positive and Negative
Value Positive and Negative
Corporate ReputationWould you be proud to work
for
Satisfied Positive and Negative of those
who are customers
RecommendRecommend or Avoid
ConsiderationBrands would consider
Current Customer Recently purchased/currently
own
Purchase IntentIntent of those who consider
Attention Positive plus negative Buzz
IndexAverage of the brand health
metrics
= Media Metrics = Brand Health Metrics = Lower Funnel Metrics
A structured and consistent survey experience delivers robust results across sectors and geographies

59
…Net Score Metrics
Net Score Metrics: Score Calculation:
Positive % - Negative % = Net Score
Example:
60 Positive Responses 20 Negative Responses 20 Neutral Responses
% Positive
60/100 = 60%
% Negative
20/100 = 20%
Net Score = 60% - 20% = 40
Impression
Recommend
Quality
Value
Reputation
Satisfaction
Buzz
= Media Metrics = Brand Health Metrics
Index Index is the average Net Score of the six Brand Health Metrics
Analysis of key metrics is tailored to drive insight

60
…Percentage Score Metrics
Percentage Score Metrics:
Score Calculation
(Positive Responses / Total Sample) x 100 = Metric Score
Awareness
Ad Awareness
WOM Exposure
Consideration
Purchase Intent
Customer Status (Former/Current)
Attention Attention is the sum of positive and negative Buzz
= Media Metrics = Lower Funnel Metrics
Ensuring that changes in metrics are clearly evident and easily understood

61
Create bespoke filters
for BrandIndex to track
specific audiences
relevant to your brand
Can use customer
filters to pull in
variables from the
Profiles tool
Ask an additional
question off the back
of an existing
BrandIndex question
Can be used to further
understand the reasons
behind brand
perceptions
Add a new brand to
track onto the
BrandIndex survey
Start tracking their
performance the very
next day
Create a new category
within the BrandIndex
survey
Start tracking their
performance the very
next day
Customisation of BrandIndex is simple, scalable and enables bespoke brand measurement
Custom Filters Trigger Questions Brand Additions Category Additions

62
Use Case

63
Ubiquitous Case Study: High-net-worth Londoners and how to reach them
About Ubiquitous
Ubiquitous is the UK’s leading taxi
advertising contractor, bringing
innovation, knowledge, credibility
and creativity to taxi advertising,
across 23 UK locations.
Through proprietary research and
industry media insight, such as
Route and YouGov, Ubiquitous leads
the way in providing accountability
to brands - vital in today’s media
landscape.
Objective
Ubiquitous wanted to find out more about “hard to know” investors in
London in order to understand how they can be effectively reached
through taxi advertising. The brand wanted to:
Understand the key differences (including in investment portfolios)
between those with an independent financial advisor and those without
Understand what concerns investors have about the next 12 months
Ask about media preferences including visibility of and attitude towards
taxi advertising
Help its clients better understand the value of taxi advertising when
targeting this audience

64
Ubiquitous Case Study: High-net-worth Londoners and how to reach them
Solution
Ubiquitous used YouGov Recontacts to target 1,700 respondents who live or work in London and earn over £35,000
per annum – split by investors and non-investors.
YouGov Recontacts
YouGov Omnibus can conduct bespoke surveys to help clients reach unique
target groups. The results are then imported into audience segmentation tool
YouGov Profiles, building a rich in-depth picture of the audiences they want
to know more about.
65
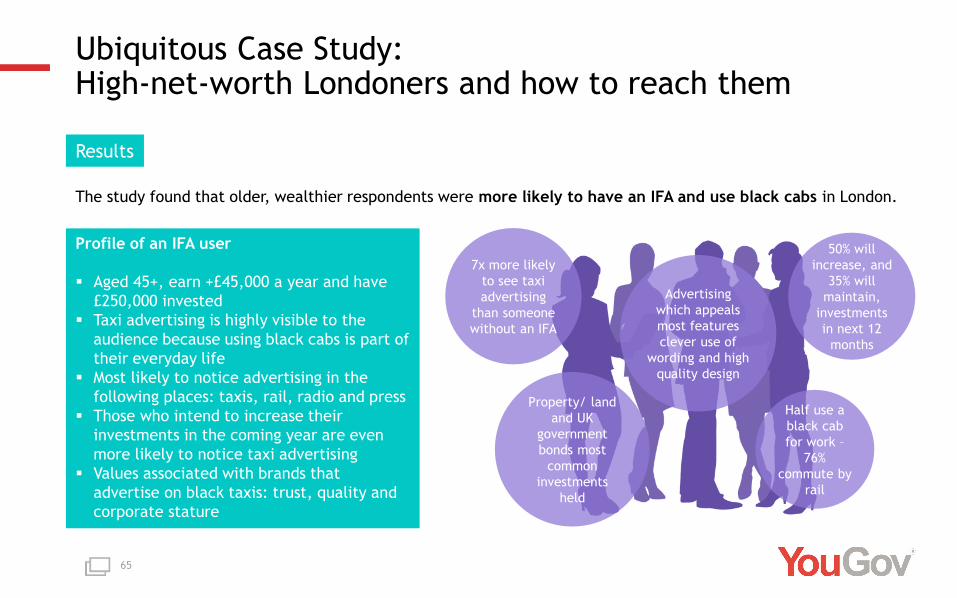
Ubiquitous Case Study: High-net-worth Londoners and how to reach them
Results
The study found that older, wealthier respondents were more likely to have an IFA and use black cabs in London.
Profile of an IFA user
Aged 45+, earn +£45,000 a year and have
£250,000 invested
Taxi advertising is highly visible to the
audience because using black cabs is part of
their everyday life
Most likely to notice advertising in the
following places: taxis, rail, radio and press
Those who intend to increase their
investments in the coming year are even
more likely to notice taxi advertising
Values associated with brands that
advertise on black taxis: trust, quality and
corporate stature
Half use a
black cab
for work –
76%
commute by
rail
7x more likely
to see taxi
advertising
than someone
without an IFA
Property/ land
and UK
government
bonds most
common
investments
held
50% will
increase, and
35% will
maintain,
investments
in next 12
months
Advertising
which appeals
most features
clever use of
wording and high
quality design

66
Q & A

67
Julian Newby
Global Profiling Director, MediaCom Worldwide

6
868 * According to RECMA’s New Biz Balance report
A bit about me
My name is Julian Newby
I’m a global data and analytics leader at MediaCom
MediaCom is a media communications agency
Part of Groupm (which is a WPP company)
Last year, MediaCom won $2.76bn worth of new business. Double that of second place Spark Foundry*
MediaCom was listed as the No. 1 global agency by the GunnMedia100 report and the Global RECMA Vitality Report 2018.
And also currently holds 5 global agency networks of the year awards

6
969
MediaCom’s relationship with YouGov
Heavy focus on YouGov Profiles
Used across all our core disciplines -planning, activation and measurement
On all the key accounts
Across all the available markets
Now starting to use the data in our product development

7
0
YouGov’s data works across our core disciplines
Planning
• Ability to build audiences- both interest and behavioral based
• To size audiences and understand growth opportunities
• To understand the media consumption of the audiences e.g. TV, Digital, OOH etc.
Activation• Ability to activate these audiences in our own platform or the main
market platforms
Measurement• Measure the campaign using brand lifts studies against the specific
audiences we planned against• Importantly it moves us away from proxies which had been the industry
norm

7
1
This gives create an end-to-end single source system!
Planning Activation Measurement

7
2
THANK YOU FOR YOUR TIME TODAY

73
Claire Spencer
Managing Director for Insight & Analytics, IPG Mediabrands UK

74
YOUGOV CAPITAL MARKETS DAY
Claire Spencer, MD Insight & Analytics
February 2019

75

76

77
My IPG career began
back in 2006…

78
39 billion marketing $
9,000 specialists
130 countries
3 brands

79
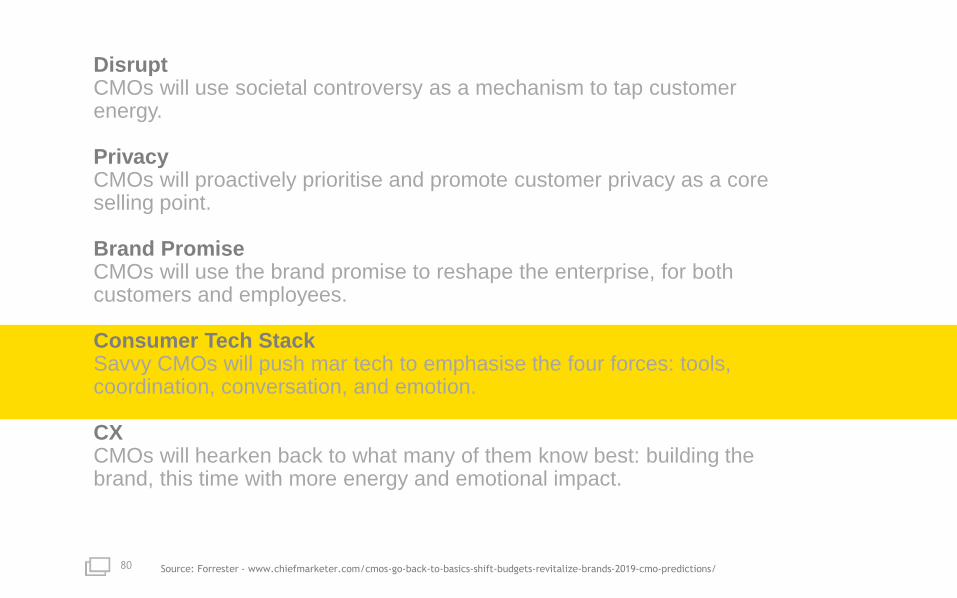
80 Source: Forrester - www.chiefmarketer.com/cmos-go-back-to-basics-shift-budgets-revitalize-brands-2019-cmo-predictions/
DisruptCMOs will use societal controversy as a mechanism to tap customer energy.
PrivacyCMOs will proactively prioritise and promote customer privacy as a core selling point.
Brand PromiseCMOs will use the brand promise to reshape the enterprise, for both customers and employees.
Consumer Tech StackSavvy CMOs will push mar tech to emphasise the four forces: tools, coordination, conversation, and emotion.
CXCMOs will hearken back to what many of them know best: building the brand, this time with more energy and emotional impact.

81
AUDIENCE
INSIGHT
CHANNEL
PLANNING
INVESTMENT
OPTIMISATION
CAMPAIGN
ACTIVATION
Connected systems
& data-driven decisions.

82
PANEL
CENSUS
CURRENCIES
BEHAVIOUR
COOKIES

83

84

85

86

87

88

89
Thank You

90
Tini Sevak
Vice President Audiences & Data, CNN International Commercial

9
1
TINI SEVAKVice President, Audiences & Data
CNN International Commercial
Twitter: @TINI_SEVAK
APPLICATION OF YOUGOV AT CNN

WHO WE ARE


2 OUT OF 5ADULTS GLOBALLY ENGAGE WITH CNN EVERY MONTH

640 MILLIONADULTS GLOBALLY

WINNING TODAY REQUIRES:
DELIVERING EXPERIENCES
CREATING BRAND
INTIMACY
BUILDING TRUST

FINDING NEW WAYS AND
APPROACHES TO
UNDERSTAND OUR VIEWERS

&

8 BESPOKE PROJECTSCONDUCTED IN THE LAST YEAR ACROSS AD SALES,
DIGITAL AND MULTIPLATFORM

USE CASE 1 EXAMINING TRUST IN ADVERTISING WITHIN NEWS &
CNN

MAJORITY OF ADULTS
SAY ACCURATE NEWS
HAS NEVER BEEN MORE
IMPORTANT
ACCURATE NEWS IS MORE
IMPORTANT THAN EVER
SOURCE: CNN /YouGov Research October 2018

ADVERTISING ON NEWS
DRIVES POSTIVE BRAND
SOURCE: CNN /YouGov Research October 2018
Favorability Credibility Trustworthiness
Endemic News Platforms Social Media
A MAJORITY OF
CONSUMERS FIND
BRANDS THAT
ADVERTISE ON NEWS
FAVORABLE, CREDIBLE,
AND TRUSTWORTHY

CNN PROVIDES UNMATCHED
BRAND CREDIBILITY
SOURCE: CNN /YouGov Research October 2018
CONSUMERS TRUST
BRANDS THAT
ADVERTISE ON CNN
MORE THAN:
Broadcast News Average
USE CASE 2ANALYSIS OF GBS AUDIENCE SEGMENT
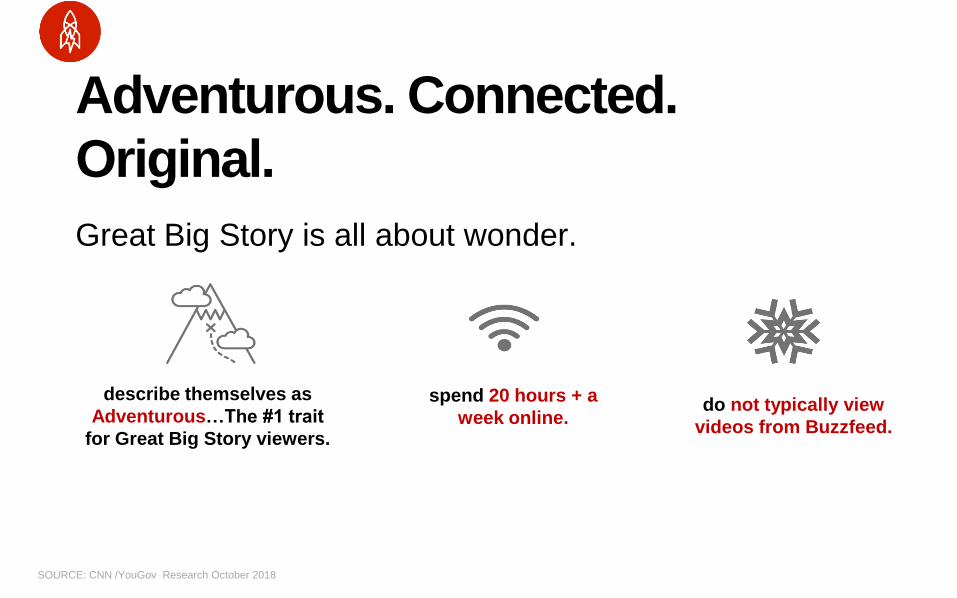
Adventurous. Connected.
Original.
SOURCE: CNN /YouGov Research October 2018
Great Big Story is all about wonder.
do not typically view
videos from Buzzfeed.
describe themselves as
Adventurous…The #1 trait
for Great Big Story viewers.
spend 20 hours + a
week online.

GBS Viewers Watch
Sponsored Content
SOURCE: CNN /YouGov Research October 2018
Majority of Great Big Story
viewers watch sponsored
content, which is 17% more
likely than viewers of
competitors.

Great Big Story Viewers Take
Action
SOURCE: CNN /YouGov Research October 2018
Majority of Great Big Story
viewers take action after
watching sponsored
content which is 30% more
than of viewers of
competitors content.
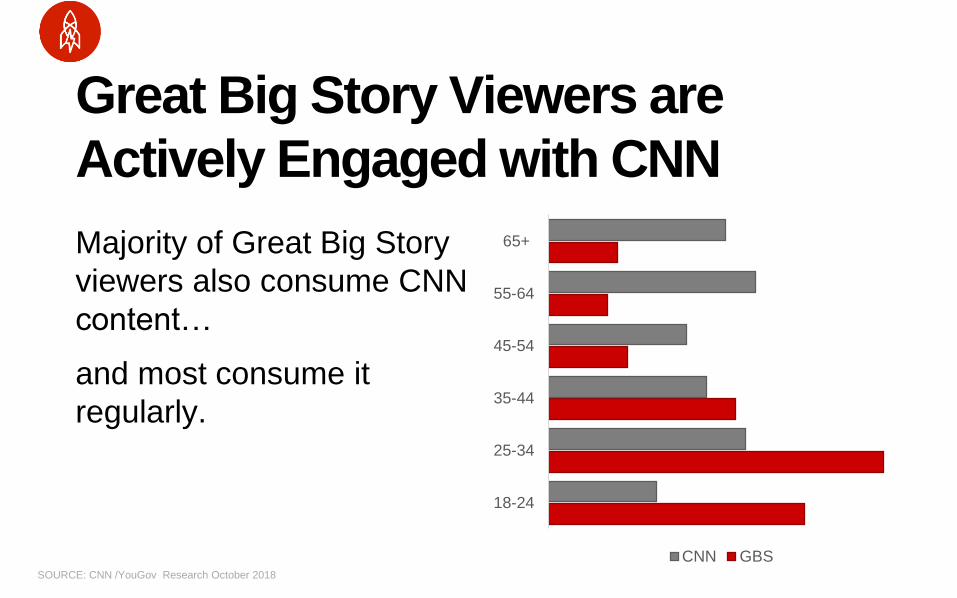
Great Big Story Viewers are
Actively Engaged with CNN
SOURCE: CNN /YouGov Research October 2018
Majority of Great Big Story
viewers also consume CNN
content…
and most consume it
regularly.
18-24
25-34
35-44
45-54
55-64
65+
CNN GBS

USE CASE 3PROFILE OF CNN BUSINESS AUDIENCE FOR PRODUCT
DEVELOPMENT

PROVIDING BUSINESS
LEADERS WHAT THEY WANT
DEEPER, BOLDER COVERAGE
OF GLOBAL COMPANIES &
BRANDS
THE WHAT & THE WHY THIS
MATTERS
ADVICE, TOOLS &
STRATEGIES TO SUCCEED
Business News Tech News
Company Profiles Financial Tools
SOURCE: CNN Business/ YouGov Custom Study, Q3’18.

CNN BUSINESS INSPIRES
LEADERS TO TAKE ACTION
SOURCE: CNN Business/ YouGov Custom Study, Q3’18.
AFTER CONSUMING CNN MONEY CONTENT, USERS ARE MORE LIKELY TO HAVE:
sought more
advice on
financial matters
provided
business/career
advice to family
and friends
made a
career change

LEADERS TAKE ACTION
WITH BRANDS TOO
SOURCE: CNN Business/ YouGov Custom Study, Q3’18.
FIND OUT MORE ABOUT BRANDS AFTER SEEING ADS ON CNN
MONEY
TRUST BRANDS THAT ADVERTISE ON CNN MONEY
C O M P A R E D T O O T H E R B U S I N E S S N E W S S I T E S
CNN Money consumers are more likely to take action after viewing/reading content:
I buy the product off-line
I buy the product online
I talk to family/friends about
advertised product
INDEX 184
INDEX 179
INDEX 140

2019 – THE YEAR AHEADEXPANDING OUR PARTNERSHIP GLOBALLY

1
1
6
TINI SEVAKVice President, Audiences & Data
CNN International Commercial
Twitter: @TINI_SEVAK
APPLICATION OF YOUGOV AT CNN

117
New innovations and the next growth plan

118
Stephan Shakespeare
Chief Executive Officer, YouGov

119
Our strategy
Our strategy for the next five years is defined by this 6-word mantra:
“the best data, the best tools”

120
Strategy: the best data, the best tools
We become a universal platform by focusing on:
Activation:
Enabling activation through our technology (YouGov Screen, YouGov
Direct, self-service, automation, AI...)
Integration:
Fully integrating custom research (with heavy emphasis on
tracking) and client service with our data and tools
Public Data:
Expanding YouGov Public Data as a public service, for brand
reputation, panel engagement and showcasing our data

121
Two developments we want to share now
1. YouGov Direct
2. YouGov Public Data

122
YouGov Direct
1 Dashboard for MembersMembers manage their data
for sharing (through surveys
and dashboard editing)
2 Dashboard for ClientsClients define required target
groups from aggregated
characteristics on offer
4 Member gets
message / taskMember decides whether to
accept (if yes, transaction is
logged, verified, paid)
3 Client sends
message / taskClient activates campaign
by sending message / task
to the selected members
The basic structure:

123
YouGov Direct
One month trial with 1,000 panelists was very successful
4x the average click-through rate
High conversions (e.g. 8% subscribing to Netflix)
Second trial in Feb with 6 major advertisers participating
Expected full launch within current financial year
Progress:

124
YouGov Public Data
a destination site as the Wikipedia of opinion
all of our Cube data made useful for the public
ditto our analytical tools
starting point: YouGov Ratings

125
YouGov Ratings

126
Strategic summary
One system for data & activation
Advanced technology platform
Increased public engagement
Realistic ambition to be #1
The best data, the best tools

127
Q & A

128