yougov / slimming world fieldwork - 2042 gb...
TRANSCRIPT

1 © 2014 YouGov plc. All Rights Reserved yougov.com
YouGov / Slimming WorldFieldwork - 2042 GB AdultsGB Sample : 24th - 30th December 2013
Total
Base Male Female 18-24 25-34 35-44 45-54 55+
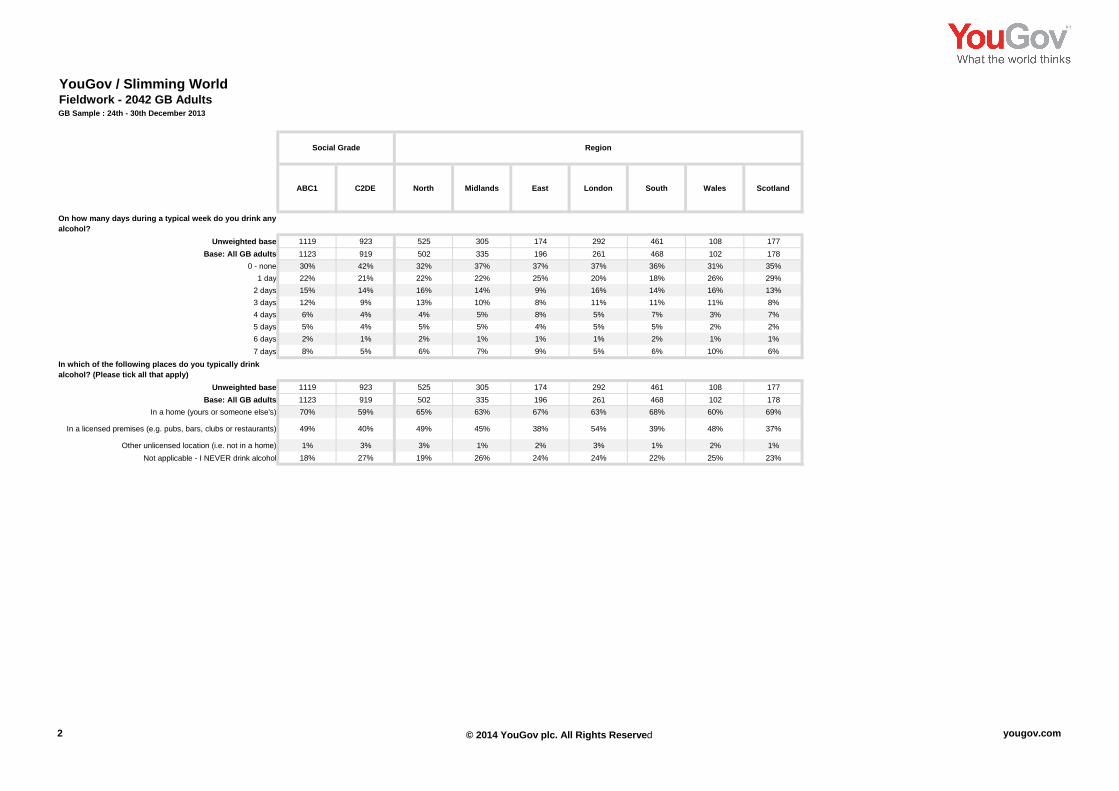
On how many days during a typical week do you drink any alcohol?
Unweighted base 2042 995 1047 247 280 317 476 722Base: All GB adults 2042 980 1062 245 343 345 394 715
0 - none 35% 28% 42% 38% 38% 34% 33% 35%1 day 22% 22% 22% 28% 25% 23% 22% 18%
2 days 14% 17% 12% 18% 15% 17% 15% 11%3 days 11% 12% 10% 8% 12% 9% 11% 11%4 days 5% 7% 4% 3% 6% 6% 6% 6%5 days 4% 5% 4% 3% 2% 2% 5% 7%6 days 1% 2% 1% 0% 1% 1% 1% 3%7 days 7% 8% 5% 1% 2% 8% 7% 10%
In which of the following places do you typically drink alcohol? (Please tick all that apply)
Unweighted base 2042 995 1047 247 280 317 476 722Base: All GB adults 2042 980 1062 245 343 345 394 715
In a home (yours or someone else's) 65% 68% 63% 63% 62% 69% 66% 65%
In a licensed premises (e.g. pubs, bars, clubs or restaurants) 45% 52% 37% 64% 56% 45% 40% 35%
Other unlicensed location (i.e. not in a home) 2% 2% 2% 5% 4% 1% 1% 1%Not applicable - I NEVER drink alcohol 22% 17% 27% 20% 21% 20% 23% 24%
Gender Age
2 © 2014 YouGov plc. All Rights Reserved yougov.com
YouGov / Slimming WorldFieldwork - 2042 GB AdultsGB Sample : 24th - 30th December 2013
On how many days during a typical week do you drink any alcohol?
Unweighted baseBase: All GB adults
0 - none1 day
2 days3 days4 days5 days6 days7 days
In which of the following places do you typically drink alcohol? (Please tick all that apply)
Unweighted baseBase: All GB adults
In a home (yours or someone else's)
In a licensed premises (e.g. pubs, bars, clubs or restaurants)
Other unlicensed location (i.e. not in a home)Not applicable - I NEVER drink alcohol
ABC1 C2DE North Midlands East London South Wales Scotland
1119 923 525 305 174 292 461 108 1771123 919 502 335 196 261 468 102 17830% 42% 32% 37% 37% 37% 36% 31% 35%22% 21% 22% 22% 25% 20% 18% 26% 29%15% 14% 16% 14% 9% 16% 14% 16% 13%12% 9% 13% 10% 8% 11% 11% 11% 8%6% 4% 4% 5% 8% 5% 7% 3% 7%5% 4% 5% 5% 4% 5% 5% 2% 2%2% 1% 2% 1% 1% 1% 2% 1% 1%8% 5% 6% 7% 9% 5% 6% 10% 6%
1119 923 525 305 174 292 461 108 1771123 919 502 335 196 261 468 102 17870% 59% 65% 63% 67% 63% 68% 60% 69%
49% 40% 49% 45% 38% 54% 39% 48% 37%
1% 3% 3% 1% 2% 3% 1% 2% 1%18% 27% 19% 26% 24% 24% 22% 25% 23%
RegionSocial Grade

3 © 2014 YouGov plc. All Rights Reserved yougov.com
YouGov / Slimming WorldFieldwork - 2042 GB AdultsGB Sample : 24th - 30th December 2013
Total
Base Male Female 18-24 25-34 35-44 45-54 55+
Gender Age
Which, if any, of the following alcoholic drinks do you consume in a typical week (i.e. Monday to Sunday)? (Please tick all that apply)
Unweighted base 1568 819 749 187 221 256 367 537Base: All GB adults who drink alcohol 1584 811 772 195 270 274 302 542
Wine (including sparkling wine/ champagne etc.) 56% 44% 68% 42% 52% 52% 60% 62%Beer/ lager 45% 68% 20% 46% 46% 49% 48% 40%
Cider 15% 19% 11% 25% 24% 14% 15% 7%Spirits (e.g. vodka, rum, gin etc.) 32% 33% 30% 57% 38% 28% 24% 25%
Alcopops (e.g. Bacardi Breezer, Smirnoff Ice etc.) 6% 5% 7% 23% 8% 8% 2% 1%Liqueur (e.g. Baileys, Jägermeister) 9% 8% 10% 16% 10% 10% 7% 7%
None of these 6% 5% 7% 9% 4% 7% 4% 7%
Please think about times when you consume more alcohol than on an average day (e.g. during a night out etc.)...Which ONE of the following would you say you drink the MOST of?
Unweighted base 1568 819 749 187 221 256 367 537Base: All GB adults who drink 1584 811 772 195 270 274 302 542
Wine (including sparkling wine/ champagne etc.) 39% 22% 56% 19% 31% 36% 43% 48%Beer/ lager 32% 52% 10% 28% 36% 34% 35% 28%
Cider 3% 4% 2% 4% 7% 2% 5% 2%Spirits (e.g. vodka, rum, gin etc.) 15% 13% 17% 31% 17% 15% 10% 11%
Alcopops (e.g. Bacardi Breezer, Smirnoff Ice etc.) 2% 1% 3% 6% 3% 3% 2% 0%Liqueur (e.g. Baileys, Jägermeister) 3% 1% 4% 3% 1% 4% 1% 4%
None of these 6% 5% 7% 9% 4% 7% 4% 7%

4 © 2014 YouGov plc. All Rights Reserved yougov.com
YouGov / Slimming WorldFieldwork - 2042 GB AdultsGB Sample : 24th - 30th December 2013
Which, if any, of the following alcoholic drinks do you consume in a typical week (i.e. Monday to Sunday)? (Please tick all that apply)
Unweighted baseBase: All GB adults who drink alcohol
Wine (including sparkling wine/ champagne etc.)Beer/ lager
CiderSpirits (e.g. vodka, rum, gin etc.)
Alcopops (e.g. Bacardi Breezer, Smirnoff Ice etc.)Liqueur (e.g. Baileys, Jägermeister)
None of these
Please think about times when you consume more alcohol than on an average day (e.g. during a night out etc.)...Which ONE of the following would you say you drink the MOST of?
Unweighted baseBase: All GB adults who drink
Wine (including sparkling wine/ champagne etc.)Beer/ lager
CiderSpirits (e.g. vodka, rum, gin etc.)
Alcopops (e.g. Bacardi Breezer, Smirnoff Ice etc.)Liqueur (e.g. Baileys, Jägermeister)
None of these
ABC1 C2DE North Midlands East London South Wales Scotland
RegionSocial Grade
909 659 416 231 128 223 351 79 140917 667 408 249 148 200 365 77 13762% 47% 55% 50% 53% 62% 61% 40% 58%43% 47% 45% 48% 42% 49% 39% 51% 46%15% 15% 14% 13% 13% 16% 16% 23% 16%31% 32% 34% 33% 30% 35% 23% 40% 39%4% 9% 8% 7% 6% 7% 6% 5% 1%8% 10% 9% 12% 7% 16% 5% 14% 3%5% 8% 5% 7% 10% 4% 8% 6% 4%
909 659 416 231 128 223 351 79 140917 667 408 249 148 200 365 77 13744% 31% 39% 33% 40% 40% 46% 24% 36%29% 35% 34% 34% 32% 32% 25% 42% 35%4% 3% 3% 3% 2% 2% 6% 4% 4%
14% 17% 15% 17% 13% 15% 11% 21% 21%1% 4% 3% 2% 3% 2% 4% - -2% 3% 3% 4% 1% 5% 1% 4% 1%5% 8% 5% 7% 10% 4% 8% 6% 4%

5 © 2014 YouGov plc. All Rights Reserved yougov.com
YouGov / Slimming WorldFieldwork - 2042 GB AdultsGB Sample : 24th - 30th December 2013
Total
Base Male Female 18-24 25-34 35-44 45-54 55+
Gender Age
Please imagine you had drunk a small amount of alcohol (i.e. a glass of wine, beer or cider or a measure of spirits)...How likely or unlikely are you to do any of the following due to drinking a small amount of alcohol? (Please tick one option on each row) - Make unhealthy food choices that day/ night
Unweighted base 1568 819 749 187 221 256 367 537Base: All GB adults who drink 1584 811 772 195 270 274 302 542
Likely to do this 27% 25% 29% 40% 34% 40% 26% 12%Unlikely to do this 65% 67% 63% 45% 56% 52% 67% 82%
Don't know 8% 8% 8% 15% 10% 7% 7% 6%
Please imagine you had drunk a small amount of alcohol (i.e. a glass of wine, beer or cider or a measure of spirits)...How likely or unlikely are you to do any of the following due to drinking a small amount of alcohol? (Please tick one option on each row) - Continue to drink more alcohol that day/ night
Unweighted base 1568 819 749 187 221 256 367 537Base: All GB adults who drink 1584 811 772 195 270 274 302 542
Likely to do this 26% 31% 21% 33% 38% 34% 22% 16%Unlikely to do this 64% 59% 70% 49% 50% 58% 68% 78%
Don't know 10% 10% 9% 18% 13% 9% 10% 5%
Please imagine you had drunk a small amount of alcohol (i.e. a glass of wine, beer or cider or a measure of spirits)...How likely or unlikely are you to do any of the following due to drinking a small amount of alcohol? (Please tick one option on each row) - Eat unhealthy food the next day
Unweighted base 1568 819 749 187 221 256 367 537Base: All GB adults who drink 1584 811 772 195 270 274 302 542
Likely to do this 17% 15% 19% 35% 19% 32% 12% 6%Unlikely to do this 74% 74% 73% 48% 69% 62% 80% 88%
Don't know 9% 10% 8% 17% 12% 7% 9% 6%

6 © 2014 YouGov plc. All Rights Reserved yougov.com
YouGov / Slimming WorldFieldwork - 2042 GB AdultsGB Sample : 24th - 30th December 2013
Please imagine you had drunk a small amount of alcohol (i.e. a glass of wine, beer or cider or a measure of spirits)...How likely or unlikely are you to do any of the following due to drinking a small amount of alcohol? (Please tick one option on each row) - Make unhealthy food choices that day/ night
Unweighted baseBase: All GB adults who drink
Likely to do thisUnlikely to do this
Don't know
Please imagine you had drunk a small amount of alcohol (i.e. a glass of wine, beer or cider or a measure of spirits)...How likely or unlikely are you to do any of the following due to drinking a small amount of alcohol? (Please tick one option on each row) - Continue to drink more alcohol that day/ night
Unweighted baseBase: All GB adults who drink
Likely to do thisUnlikely to do this
Don't know
Please imagine you had drunk a small amount of alcohol (i.e. a glass of wine, beer or cider or a measure of spirits)...How likely or unlikely are you to do any of the following due to drinking a small amount of alcohol? (Please tick one option on each row) - Eat unhealthy food the next day
Unweighted baseBase: All GB adults who drink
Likely to do thisUnlikely to do this
Don't know
ABC1 C2DE North Midlands East London South Wales Scotland
RegionSocial Grade
909 659 416 231 128 223 351 79 140917 667 408 249 148 200 365 77 13727% 27% 28% 28% 24% 32% 21% 27% 31%66% 64% 64% 66% 62% 56% 73% 63% 64%7% 9% 9% 5% 13% 11% 6% 10% 5%
909 659 416 231 128 223 351 79 140917 667 408 249 148 200 365 77 13727% 25% 24% 29% 21% 36% 24% 25% 24%63% 66% 68% 63% 65% 54% 66% 61% 66%10% 10% 7% 8% 14% 10% 10% 13% 10%
909 659 416 231 128 223 351 79 140917 667 408 249 148 200 365 77 13716% 18% 20% 18% 11% 19% 12% 20% 23%76% 70% 71% 76% 75% 67% 81% 70% 72%7% 12% 10% 7% 14% 14% 7% 10% 4%

7 © 2014 YouGov plc. All Rights Reserved yougov.com
YouGov / Slimming WorldFieldwork - 2042 GB AdultsGB Sample : 24th - 30th December 2013
Total
Base Male Female 18-24 25-34 35-44 45-54 55+
Gender Age
Please imagine you had drunk a small amount of alcohol (i.e. a glass of wine, beer or cider or a measure of spirits)...How likely or unlikely are you to do any of the following due to drinking a small amount of alcohol? (Please tick one option on each row) - Have a bad night’s sleep
Unweighted base 1568 819 749 187 221 256 367 537Base: All GB adults who drink 1584 811 772 195 270 274 302 542
Likely to do this 18% 17% 20% 28% 19% 25% 15% 12%Unlikely to do this 74% 74% 74% 56% 73% 68% 77% 82%
Don't know 8% 9% 7% 16% 7% 7% 8% 6%
MSA_q18_5. Please imagine you had drunk a small amount of alcohol (i.e. a glass of wine, beer or cider or a measure of spirits)...How likely or unlikely are you to do any of the following due to drinking a small amount of alcohol? (Please tick one option on each row) - Cancel plans that I’ve made to exercise the next day
Unweighted base 1568 819 749 187 221 256 367 537Base: All GB adults who drink 1584 811 772 195 270 274 302 542
Likely to do this 9% 9% 10% 24% 14% 13% 5% 3%Unlikely to do this 80% 80% 80% 57% 74% 77% 86% 91%
Don't know 10% 10% 10% 19% 12% 10% 10% 6%
Now please imagine you had drunk a large amount of alcohol (i.e. several glasses of wine, several beers or ciders or a measures of spirits)...How likely or unlikely are you to do any of the following due to drinking a large amount of alcohol? - Make unhealthy food choices that day/ night
Unweighted base 1568 819 749 187 221 256 367 537Base: All GB adults who drink 1584 811 772 195 270 274 302 542
Likely to do this 40% 38% 41% 54% 58% 56% 36% 19%Unlikely to do this 50% 52% 47% 30% 30% 35% 55% 72%
Don't know 11% 10% 12% 16% 12% 9% 9% 10%

8 © 2014 YouGov plc. All Rights Reserved yougov.com
YouGov / Slimming WorldFieldwork - 2042 GB AdultsGB Sample : 24th - 30th December 2013
Please imagine you had drunk a small amount of alcohol (i.e. a glass of wine, beer or cider or a measure of spirits)...How likely or unlikely are you to do any of the following due to drinking a small amount of alcohol? (Please tick one option on each row) - Have a bad night’s sleep
Unweighted baseBase: All GB adults who drink
Likely to do thisUnlikely to do this
Don't know
MSA_q18_5. Please imagine you had drunk a small amount of alcohol (i.e. a glass of wine, beer or cider or a measure of spirits)...How likely or unlikely are you to do any of the following due to drinking a small amount of alcohol? (Please tick one option on each row) - Cancel plans that I’ve made to exercise the next day
Unweighted baseBase: All GB adults who drink
Likely to do thisUnlikely to do this
Don't know
Now please imagine you had drunk a large amount of alcohol (i.e. several glasses of wine, several beers or ciders or a measures of spirits)...How likely or unlikely are you to do any of the following due to drinking a large amount of alcohol? - Make unhealthy food choices that day/ night
Unweighted baseBase: All GB adults who drink
Likely to do thisUnlikely to do this
Don't know
ABC1 C2DE North Midlands East London South Wales Scotland
RegionSocial Grade
909 659 416 231 128 223 351 79 140917 667 408 249 148 200 365 77 13719% 18% 17% 23% 14% 24% 16% 12% 18%74% 73% 74% 72% 73% 66% 78% 78% 76%7% 9% 9% 5% 13% 10% 6% 10% 6%
909 659 416 231 128 223 351 79 140917 667 408 249 148 200 365 77 1379% 10% 10% 10% 7% 12% 8% 4% 10%
83% 77% 78% 83% 78% 76% 84% 85% 82%8% 13% 12% 7% 15% 12% 8% 11% 9%
909 659 416 231 128 223 351 79 140917 667 408 249 148 200 365 77 13743% 36% 39% 38% 33% 50% 39% 31% 41%48% 52% 51% 52% 50% 40% 51% 56% 51%9% 12% 9% 10% 17% 10% 11% 13% 8%

9 © 2014 YouGov plc. All Rights Reserved yougov.com
YouGov / Slimming WorldFieldwork - 2042 GB AdultsGB Sample : 24th - 30th December 2013
Total
Base Male Female 18-24 25-34 35-44 45-54 55+
Gender Age
Now please imagine you had drunk a large amount of alcohol (i.e. several glasses of wine, several beers or ciders or a measures of spirits)...How likely or unlikely are you to do any of the following due to drinking a large amount of alcohol? - Continue to drink more alcohol that day/ night
Unweighted base 1568 819 749 187 221 256 367 537Base: All GB adults who drink 1584 811 772 195 270 274 302 542
Likely to do this 21% 24% 18% 39% 30% 33% 15% 7%Unlikely to do this 68% 65% 71% 45% 54% 57% 75% 84%
Don't know 11% 11% 11% 16% 15% 10% 10% 8%
Now please imagine you had drunk a large amount of alcohol (i.e. several glasses of wine, several beers or ciders or a measures of spirits)...How likely or unlikely are you to do any of the following due to drinking a large amount of alcohol? - Eat unhealthy food the next day
Unweighted base 1568 819 749 187 221 256 367 537Base: All GB adults who drink 1584 811 772 195 270 274 302 542
Likely to do this 29% 25% 33% 45% 46% 48% 21% 9%Unlikely to do this 60% 64% 55% 40% 41% 43% 66% 82%
Don't know 11% 10% 12% 15% 13% 9% 12% 9%
Now please imagine you had drunk a large amount of alcohol (i.e. several glasses of wine, several beers or ciders or a measures of spirits)...How likely or unlikely are you to do any of the following due to drinking a large amount of alcohol? - Have a bad night’s sleep
Unweighted base 1568 819 749 187 221 256 367 537Base: All GB adults who drink 1584 811 772 195 270 274 302 542
Likely to do this 35% 30% 40% 41% 37% 46% 31% 28%Unlikely to do this 55% 59% 50% 43% 51% 46% 57% 64%
Don't know 11% 11% 10% 17% 12% 9% 12% 8%

10 © 2014 YouGov plc. All Rights Reserved yougov.com
YouGov / Slimming WorldFieldwork - 2042 GB AdultsGB Sample : 24th - 30th December 2013
Now please imagine you had drunk a large amount of alcohol (i.e. several glasses of wine, several beers or ciders or a measures of spirits)...How likely or unlikely are you to do any of the following due to drinking a large amount of alcohol? - Continue to drink more alcohol that day/ night
Unweighted baseBase: All GB adults who drink
Likely to do thisUnlikely to do this
Don't know
Now please imagine you had drunk a large amount of alcohol (i.e. several glasses of wine, several beers or ciders or a measures of spirits)...How likely or unlikely are you to do any of the following due to drinking a large amount of alcohol? - Eat unhealthy food the next day
Unweighted baseBase: All GB adults who drink
Likely to do thisUnlikely to do this
Don't know
Now please imagine you had drunk a large amount of alcohol (i.e. several glasses of wine, several beers or ciders or a measures of spirits)...How likely or unlikely are you to do any of the following due to drinking a large amount of alcohol? - Have a bad night’s sleep
Unweighted baseBase: All GB adults who drink
Likely to do thisUnlikely to do this
Don't know
ABC1 C2DE North Midlands East London South Wales Scotland
RegionSocial Grade
909 659 416 231 128 223 351 79 140917 667 408 249 148 200 365 77 13722% 20% 19% 23% 17% 28% 20% 21% 24%67% 69% 71% 66% 71% 61% 69% 64% 66%11% 11% 10% 11% 13% 11% 11% 16% 10%
909 659 416 231 128 223 351 79 140917 667 408 249 148 200 365 77 13729% 28% 27% 29% 22% 41% 25% 22% 38%61% 59% 63% 59% 59% 51% 65% 64% 53%10% 13% 9% 12% 19% 9% 10% 14% 9%
909 659 416 231 128 223 351 79 140917 667 408 249 148 200 365 77 13739% 29% 35% 34% 30% 41% 34% 26% 40%51% 59% 55% 54% 55% 48% 57% 63% 52%10% 12% 11% 11% 15% 12% 9% 10% 8%
11 © 2014 YouGov plc. All Rights Reserved yougov.com
YouGov / Slimming WorldFieldwork - 2042 GB AdultsGB Sample : 24th - 30th December 2013
Total
Base Male Female 18-24 25-34 35-44 45-54 55+
Gender Age
Now please imagine you had drunk a large amount of alcohol (i.e. several glasses of wine, several beers or ciders or a measures of spirits)...How likely or unlikely are you to do any of the following due to drinking a large amount of alcohol? - Cancel plans that I’ve made to exercise the next day
Unweighted base 1568 819 749 187 221 256 367 537Base: All GB adults who drink 1584 811 772 195 270 274 302 542
Likely to do this 31% 29% 33% 41% 47% 45% 24% 16%Unlikely to do this 57% 61% 52% 40% 40% 44% 65% 72%
Don't know 12% 10% 15% 18% 13% 11% 12% 11%
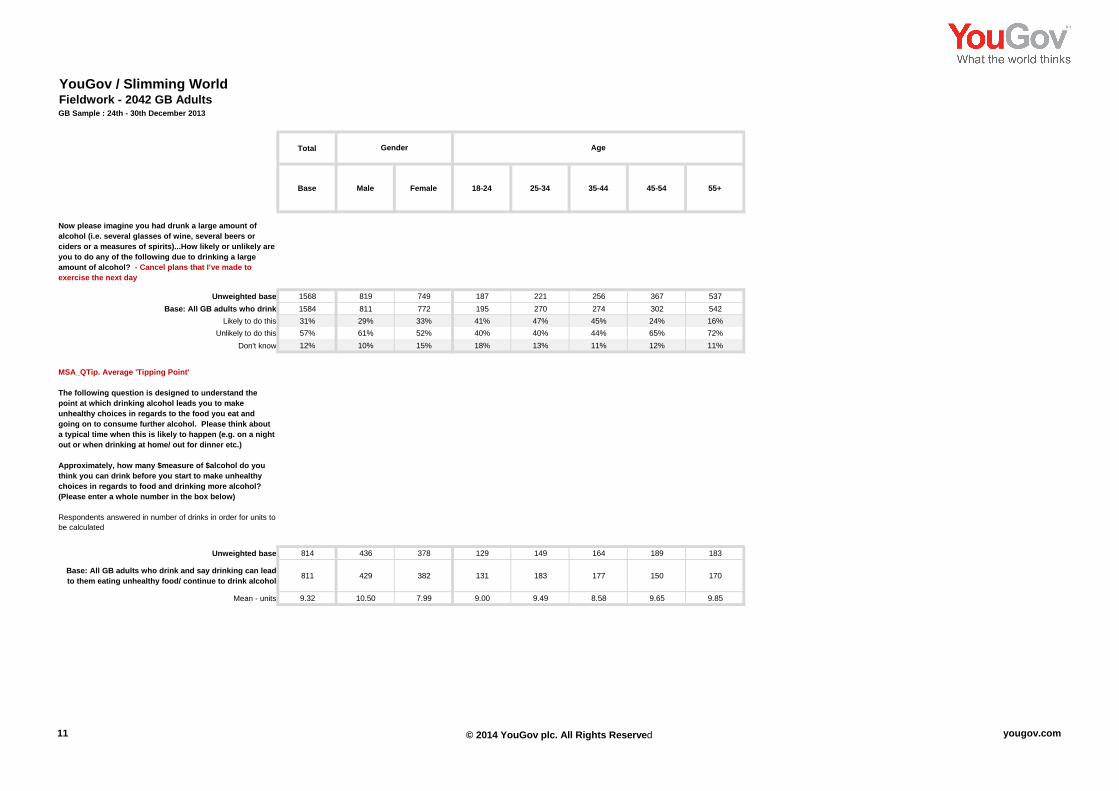
MSA_QTip. Average 'Tipping Point'
The following question is designed to understand the point at which drinking alcohol leads you to make unhealthy choices in regards to the food you eat and going on to consume further alcohol. Please think about a typical time when this is likely to happen (e.g. on a night out or when drinking at home/ out for dinner etc.) Approximately, how many $measure of $alcohol do you think you can drink before you start to make unhealthy choices in regards to food and drinking more alcohol? (Please enter a whole number in the box below)
Respondents answered in number of drinks in order for units to be calculated
Unweighted base 814 436 378 129 149 164 189 183
Base: All GB adults who drink and say drinking can lead to them eating unhealthy food/ continue to drink alcohol 811 429 382 131 183 177 150 170
Mean - units 9.32 10.50 7.99 9.00 9.49 8.58 9.65 9.85

12 © 2014 YouGov plc. All Rights Reserved yougov.com
YouGov / Slimming WorldFieldwork - 2042 GB AdultsGB Sample : 24th - 30th December 2013
Now please imagine you had drunk a large amount of alcohol (i.e. several glasses of wine, several beers or ciders or a measures of spirits)...How likely or unlikely are you to do any of the following due to drinking a large amount of alcohol? - Cancel plans that I’ve made to exercise the next day
Unweighted baseBase: All GB adults who drink
Likely to do thisUnlikely to do this
Don't know
MSA_QTip. Average 'Tipping Point'
The following question is designed to understand the point at which drinking alcohol leads you to make unhealthy choices in regards to the food you eat and going on to consume further alcohol. Please think about a typical time when this is likely to happen (e.g. on a night out or when drinking at home/ out for dinner etc.) Approximately, how many $measure of $alcohol do you think you can drink before you start to make unhealthy choices in regards to food and drinking more alcohol? (Please enter a whole number in the box below)
Respondents answered in number of drinks in order for units to be calculated
Unweighted base
Base: All GB adults who drink and say drinking can lead to them eating unhealthy food/ continue to drink alcohol
Mean - units
ABC1 C2DE North Midlands East London South Wales Scotland
RegionSocial Grade
909 659 416 231 128 223 351 79 140917 667 408 249 148 200 365 77 13732% 29% 31% 34% 25% 37% 28% 25% 33%57% 56% 59% 54% 57% 49% 59% 60% 56%11% 15% 10% 12% 17% 14% 13% 15% 11%
479 335 206 116 58 143 176 36 79
485 326 198 130 67 133 175 34 75
9.17 9.53 10.04 9.25 8.85 9.28 8.69 9.39 9.42

13 © 2014 YouGov plc. All Rights Reserved yougov.com
YouGov / Slimming WorldFieldwork - 2042 GB AdultsGB Sample : 24th - 30th December 2013
Total
Base Male Female 18-24 25-34 35-44 45-54 55+
Gender Age
For the remainder of the survey when we refer to your “tipping point” we mean the amount of alcohol that you can drink up to the point where you first begin to make unhealthy food choices/ drink more alcohol than planned.
MSA_q22. How many days during the typical week - Monday to Thursday - would you say you drink enough alcohol to reach your ‘tipping point’, where you start to make unhealthy choices in regards to food and drinking more alcohol
Unweighted base 814 436 378 129 149 164 189 183
Base: All GB adults who drink and say drinking can lead to them eating unhealthy food/ continue to drink alcohol 811 429 382 131 183 177 150 170
0 - none 59% 53% 66% 46% 61% 54% 61% 73%1 18% 19% 16% 26% 21% 15% 19% 8%2 11% 12% 11% 13% 5% 21% 8% 11%3 4% 5% 3% 7% 2% 5% 5% 2%4 3% 4% 1% 1% 4% 3% 2% 2%
Don't know/ prefer not to say 5% 7% 3% 7% 7% 2% 6% 4%

14 © 2014 YouGov plc. All Rights Reserved yougov.com
YouGov / Slimming WorldFieldwork - 2042 GB AdultsGB Sample : 24th - 30th December 2013
For the remainder of the survey when we refer to your “tipping point” we mean the amount of alcohol that you can drink up to the point where you first begin to make unhealthy food choices/ drink more alcohol than planned.
MSA_q22. How many days during the typical week - Monday to Thursday - would you say you drink enough alcohol to reach your ‘tipping point’, where you start to make unhealthy choices in regards to food and drinking more alcohol
Unweighted base
Base: All GB adults who drink and say drinking can lead to them eating unhealthy food/ continue to drink alcohol
0 - none1234
Don't know/ prefer not to say
ABC1 C2DE North Midlands East London South Wales Scotland
RegionSocial Grade
479 335 206 116 58 143 176 36 79
485 326 198 130 67 133 175 34 75
61% 57% 54% 60% 50% 47% 67% 59% 81%15% 22% 20% 21% 24% 22% 14% 8% 8%12% 11% 17% 9% 18% 11% 7% 3% 6%5% 3% 1% 3% 1% 6% 5% 17% 2%3% 2% 3% 0% - 7% 2% 10% 0%4% 7% 5% 7% 6% 6% 5% 2% 3%

15 © 2014 YouGov plc. All Rights Reserved yougov.com
YouGov / Slimming WorldFieldwork - 2042 GB AdultsGB Sample : 24th - 30th December 2013
Total
Base Male Female 18-24 25-34 35-44 45-54 55+
Gender Age
How many days during the typical weekend – Friday, Saturday and Sunday - would you say you drink enough alcohol to reach your ‘tipping point’, where you start to make unhealthy choices in regards to food and drinking more alcohol?
Unweighted base 814 436 378 129 149 164 189 183
Base: All GB adults who drink and say drinking can lead to them eating unhealthy food/ continue to drink alcohol 811 429 382 131 183 177 150 170
0 - none 36% 33% 39% 29% 30% 29% 42% 48%1 39% 40% 38% 40% 47% 49% 26% 31%2 13% 13% 12% 15% 10% 14% 14% 11%3 6% 7% 5% 3% 6% 6% 11% 6%
Don't know/ Prefer not to say 6% 7% 5% 13% 7% 3% 7% 3%
Thinking about a typical occasion when you have gone over your “tipping point” (i.e. the amount of alcohol that you can drink up to the point where you begin to make unhealthy food/ alcohol choices)...
Approximately, how much of each of the following types of alcohol do you think you would go on to drink in the same day/ night once you've reached this point? We’ve included all measurements in the list below so that you can answer in the way that you would prefer – please don’t double count any drinks or include those you’d have to reach your tipping point.
Respondents answered in number of drinks in order for number of calories to be calculated
Unweighted base 814 436 378 129 149 164 189 183
Base: All GB adults who drink and say drinking can lead to them eating unhealthy food/ continue to drink alcohol 811 429 382 131 183 177 150 170
Mean - calories 1476 1794 1119 1692 1482 1751 1339 1135

16 © 2014 YouGov plc. All Rights Reserved yougov.com
YouGov / Slimming WorldFieldwork - 2042 GB AdultsGB Sample : 24th - 30th December 2013
How many days during the typical weekend – Friday, Saturday and Sunday - would you say you drink enough alcohol to reach your ‘tipping point’, where you start to make unhealthy choices in regards to food and drinking more alcohol?
Unweighted base
Base: All GB adults who drink and say drinking can lead to them eating unhealthy food/ continue to drink alcohol
0 - none123
Don't know/ Prefer not to say
Thinking about a typical occasion when you have gone over your “tipping point” (i.e. the amount of alcohol that you can drink up to the point where you begin to make unhealthy food/ alcohol choices)...
Approximately, how much of each of the following types of alcohol do you think you would go on to drink in the same day/ night once you've reached this point? We’ve included all measurements in the list below so that you can answer in the way that you would prefer – please don’t double count any drinks or include those you’d have to reach your tipping point.
Respondents answered in number of drinks in order for number of calories to be calculated
Unweighted base
Base: All GB adults who drink and say drinking can lead to them eating unhealthy food/ continue to drink alcohol
Mean - calories
ABC1 C2DE North Midlands East London South Wales Scotland
RegionSocial Grade
479 335 206 116 58 143 176 36 79
485 326 198 130 67 133 175 34 75
37% 34% 28% 38% 32% 32% 45% 29% 43%40% 37% 43% 38% 40% 38% 32% 50% 43%11% 15% 15% 10% 14% 15% 12% 7% 9%7% 6% 7% 8% 2% 8% 6% 8% 5%5% 8% 7% 7% 12% 7% 5% 6% -
479 335 206 116 58 143 176 36 79
485 326 198 130 67 133 175 34 75
1369 1634 1268 1517 1357 1582 1614 1902 1354

17 © 2014 YouGov plc. All Rights Reserved yougov.com
YouGov / Slimming WorldFieldwork - 2042 GB AdultsGB Sample : 24th - 30th December 2013
Total
Base Male Female 18-24 25-34 35-44 45-54 55+
Gender Age
For the following question, please think about a typical occasion when you go over your "tipping point" (i.e. drinking enough alcohol for you to make unhealthy food choices/ go on to drink more alcohol) and also consider any additional alcohol and food you might go on to consume as a result of exceeding this point...Which, if any, of the following foods are you likely to eat the same evening as a result of reaching your "tipping point"? (Please tick all that apply and only include any food that you’d eat during the course of the same night that reached your tipping point. For foods that are split out into different amounts, please tick the option that BEST applies)
Unweighted base 663 335 328 109 132 148 149 125Base: All GB adults who drink and say that alcohol makes
them likely to eat unhealthy food 674 334 340 112 162 164 119 116
A kebab 25% 33% 17% 24% 32% 30% 23% 10%A portion of chips 50% 48% 51% 62% 62% 44% 41% 38%
A hamburger 31% 34% 28% 47% 32% 32% 22% 20%A battered fish 11% 12% 10% 8% 7% 6% 16% 23%
A pie 8% 10% 5% 6% 2% 8% 16% 9%A battered sausage 6% 9% 3% 8% 8% 4% 7% 5%
A Chinese takeaway 23% 27% 19% 18% 19% 27% 27% 24%An Indian takeaway 25% 32% 18% 17% 23% 27% 34% 22%A sandwich/ toastie 18% 19% 16% 25% 18% 10% 18% 20%
A full English/ Scottish breakfast 10% 15% 6% 11% 13% 14% 5% 7%Pasta with a creamy sauce 3% 2% 5% 3% 4% 3% 1% 6%
A cake/ pastry 7% 7% 7% 6% 7% 8% 9% 6%An individual size packet of crisps 37% 33% 40% 25% 31% 43% 38% 46%
A family size packet of crisps 25% 24% 25% 17% 32% 29% 24% 16%An individual size packet of salted nuts 12% 15% 10% 4% 7% 15% 14% 24%
A sharing size packet of salted nuts 10% 11% 9% 1% 6% 11% 13% 19%An individual size bar/ bag of chocolate 17% 11% 23% 16% 14% 21% 16% 19%
A sharing bar/ bag of chocolate 14% 12% 15% 15% 10% 15% 20% 11%A slice of an individual 7" pizza 14% 16% 12% 22% 15% 13% 8% 11%
Half an individual 7" pizza 17% 16% 18% 28% 17% 21% 11% 6%A whole individual 7" pizza 22% 25% 19% 32% 31% 23% 18% 5%
1 to 3 biscuits 9% 8% 10% 6% 6% 7% 8% 18%Half a pack of biscuits (12) 8% 8% 9% 7% 7% 10% 13% 5%
A whole pack of biscuits (12) 5% 6% 4% 4% 5% 6% 3% 7%None of these 3% 2% 3% 2% 2% 4% 3% 2%

18 © 2014 YouGov plc. All Rights Reserved yougov.com
YouGov / Slimming WorldFieldwork - 2042 GB AdultsGB Sample : 24th - 30th December 2013
For the following question, please think about a typical occasion when you go over your "tipping point" (i.e. drinking enough alcohol for you to make unhealthy food choices/ go on to drink more alcohol) and also consider any additional alcohol and food you might go on to consume as a result of exceeding this point...Which, if any, of the following foods are you likely to eat the same evening as a result of reaching your "tipping point"? (Please tick all that apply and only include any food that you’d eat during the course of the same night that reached your tipping point. For foods that are split out into different amounts, please tick the option that BEST applies)
Unweighted baseBase: All GB adults who drink and say that alcohol makes
them likely to eat unhealthy foodA kebab
A portion of chipsA hamburger
A battered fishA pie
A battered sausageA Chinese takeawayAn Indian takeawayA sandwich/ toastie
A full English/ Scottish breakfastPasta with a creamy sauce
A cake/ pastryAn individual size packet of crisps
A family size packet of crispsAn individual size packet of salted nuts
A sharing size packet of salted nutsAn individual size bar/ bag of chocolate
A sharing bar/ bag of chocolateA slice of an individual 7" pizza
Half an individual 7" pizzaA whole individual 7" pizza
1 to 3 biscuitsHalf a pack of biscuits (12)
A whole pack of biscuits (12)None of these
ABC1 C2DE North Midlands East London South Wales Scotland
RegionSocial Grade
400 263 176 90 46 114 145 26 66
415 259 175 101 55 106 147 25 64
24% 26% 25% 28% 25% 27% 20% 40% 20%47% 54% 53% 50% 52% 45% 46% 71% 43%27% 36% 35% 24% 46% 36% 28% 13% 20%11% 12% 13% 12% 9% 7% 10% 9% 17%8% 8% 9% 7% 5% 6% 12% 6% 3%6% 7% 3% 3% 10% 9% 6% 12% 10%
20% 28% 28% 18% 23% 25% 19% 35% 17%25% 24% 27% 28% 25% 23% 20% 42% 20%14% 23% 14% 19% 18% 20% 18% 18% 21%9% 13% 12% 7% 5% 19% 6% 11% 12%4% 3% 7% 1% 1% 5% 2% - 1%7% 9% 6% 3% 9% 8% 11% 4% 9%
36% 38% 35% 34% 40% 29% 42% 48% 40%27% 22% 32% 20% 27% 24% 19% 32% 24%14% 9% 13% 13% 13% 15% 13% 10% 6%10% 10% 8% 10% 9% 7% 10% 29% 13%17% 17% 17% 16% 18% 18% 18% 7% 17%13% 15% 11% 9% 19% 14% 17% 32% 10%12% 18% 17% 10% 11% 16% 12% 25% 11%15% 18% 23% 16% 14% 17% 14% 11% 10%21% 24% 27% 16% 12% 28% 15% 35% 29%7% 12% 10% 17% 8% 7% 6% 4% 5%7% 10% 10% 7% 5% 7% 9% 4% 9%4% 6% 8% 3% 6% 3% 5% - 4%3% 2% 3% 3% 4% 2% 2% 5% 2%

19 © 2014 YouGov plc. All Rights Reserved yougov.com
YouGov / Slimming WorldFieldwork - 2042 GB AdultsGB Sample : 24th - 30th December 2013
Total
Base Male Female 18-24 25-34 35-44 45-54 55+
Gender Age
And which, if any, of the following foods are you MOST likely to eat the same evening as a result of drinking this amount of alcohol? (Please tick all that apply and only include any food that you’d eat during the course of the same night that you exceeding your tipping point. For foods that are split out into different amounts, please tick the option that BEST applies)
Unweighted base 663 335 328 109 132 148 149 125Base: All GB adults who drink and say that alcohol makes
them likely to eat unhealthy food 674 334 340 112 162 164 119 116
A kebab 10% 14% 5% 7% 10% 16% 10% 3%A portion of chips 22% 19% 25% 31% 34% 14% 17% 15%
A hamburger 10% 12% 9% 21% 10% 8% 5% 7%A battered fish 1% 2% 0% 2% - - - 6%
A pie 0% 1% - - - 1% - 1%A battered sausage 0% 0% - - 0% 0% - -
A Chinese takeaway 7% 7% 6% 6% 5% 4% 9% 10%An Indian takeaway 7% 11% 4% 0% 3% 11% 14% 6%A sandwich/ toastie 7% 8% 6% 8% 7% 4% 8% 10%
A full English/ Scottish breakfast 1% 2% 0% 2% - 2% 0% 1%Pasta with a creamy sauce 2% 0% 3% 1% 2% 1% - 4%
A cake/pastry 1% 1% 1% - 2% 2% 2% 0%An individual size packet of crisps 2% 1% 3% - 1% 2% 3% 5%
A family size packet of crisps 1% 1% 1% - 1% 1% 1% 2%An individual size packet of salted nuts 0% 1% - - - 1% - -
A sharing size packet of salted nuts - - - - - - - -An individual size bar/ bag of chocolate 0% - 0% - 1% - - -
A sharing bar/ bag of chocolate 0% - 0% - - - - 1%A slice of an individual 7" pizza 4% 2% 6% 5% 4% 6% 3% 4%
Half an individual 7" pizza 4% 1% 6% 5% 6% 4% 3% -A whole individual 7" pizza 2% 2% 2% - 3% 2% 1% 1%
1 to 3 biscuits 1% 1% 2% 2% 0% - 4% 2% Half a pack of biscuits (6) 3% 3% 4% 2% 2% 2% 4% 6%
A whole pack of biscuits (12) 3% 3% 2% - 1% 5% 3% 3%None of these 11% 8% 13% 9% 7% 12% 13% 14%

20 © 2014 YouGov plc. All Rights Reserved yougov.com
YouGov / Slimming WorldFieldwork - 2042 GB AdultsGB Sample : 24th - 30th December 2013
And which, if any, of the following foods are you MOST likely to eat the same evening as a result of drinking this amount of alcohol? (Please tick all that apply and only include any food that you’d eat during the course of the same night that you exceeding your tipping point. For foods that are split out into different amounts, please tick the option that BEST applies)
Unweighted baseBase: All GB adults who drink and say that alcohol makes
them likely to eat unhealthy foodA kebab
A portion of chipsA hamburger
A battered fishA pie
A battered sausageA Chinese takeawayAn Indian takeawayA sandwich/ toastie
A full English/ Scottish breakfastPasta with a creamy sauce
A cake/pastryAn individual size packet of crisps
A family size packet of crispsAn individual size packet of salted nuts
A sharing size packet of salted nutsAn individual size bar/ bag of chocolate
A sharing bar/ bag of chocolateA slice of an individual 7" pizza
Half an individual 7" pizzaA whole individual 7" pizza
1 to 3 biscuits Half a pack of biscuits (6)
A whole pack of biscuits (12)None of these
ABC1 C2DE North Midlands East London South Wales Scotland
RegionSocial Grade
400 263 176 90 46 114 145 26 66
415 259 175 101 55 106 147 25 64
11% 8% 13% 9% 8% 7% 9% 26% 5%22% 22% 16% 25% 15% 21% 26% 28% 34%9% 12% 9% 10% 13% 14% 11% 10% 2%1% 2% 1% - - 1% 0% 3% 7%0% 0% 0% - 1% - 0% - 1%0% 0% - - - 1% - - 1%6% 8% 10% 4% 4% 8% 7% 1% 2%8% 6% 5% 11% 11% 5% 7% 5% 10%7% 7% 5% 5% 9% 10% 9% 5% 7%0% 2% 2% - - 4% - - -1% 2% 3% 1% - 1% 2% - 1%1% 1% - - 2% 4% 2% - -2% 2% 3% 1% 4% 1% 1% - 3%1% 1% 0% 3% 1% 1% 1% - 2%0% - - - - - 1% - -- - - - - - - - -
0% - - - 3% - - - -0% - - - - - 1% - -4% 4% 5% 4% 2% 1% 7% 4% 4%4% 3% 4% 4% 2% 4% 3% - 9%2% 1% 3% 0% - 3% 1% 3% 1%2% 1% 1% 0% - 2% 4% - -2% 5% 3% 6% 1% 5% 1% 4% 4%3% 2% 5% 1% 3% 2% 2% - -
12% 8% 13% 16% 20% 6% 6% 11% 7%

21 © 2014 YouGov plc. All Rights Reserved yougov.com
YouGov / Slimming WorldFieldwork - 2042 GB AdultsGB Sample : 24th - 30th December 2013
Total
Base Male Female 18-24 25-34 35-44 45-54 55+
Gender Age
After you've drunk enough alcohol to reach you “tipping point”...Are you more or less likely to do each of the following, compared to a time when you haven’t drunk any alcohol? (Please tick one option on each row) - Order a takeaway
Unweighted base 663 335 328 109 132 148 149 125Base: All GB adults who drink and say that alcohol makes
them likely to eat unhealthy food 674 334 340 112 162 164 119 116
More likely 58% 61% 54% 64% 67% 65% 48% 39%Less likely 17% 17% 16% 12% 13% 15% 21% 23%
No difference 26% 21% 30% 24% 19% 20% 32% 38%
After you've drunk enough alcohol to reach you “tipping point”...Are you more or less likely to do each of the following, compared to a time when you haven’t drunk any alcohol? (Please tick one option on each row) - Snack on a family sized packet of crisps or nuts
Unweighted base 663 335 328 109 132 148 149 125Base: All GB adults who drink and say that alcohol makes
them likely to eat unhealthy food 674 334 340 112 162 164 119 116
More likely 57% 55% 59% 45% 56% 70% 58% 52%Less likely 16% 17% 15% 18% 21% 10% 13% 18%
No difference 27% 28% 25% 36% 23% 20% 28% 30%

22 © 2014 YouGov plc. All Rights Reserved yougov.com
YouGov / Slimming WorldFieldwork - 2042 GB AdultsGB Sample : 24th - 30th December 2013
After you've drunk enough alcohol to reach you “tipping point”...Are you more or less likely to do each of the following, compared to a time when you haven’t drunk any alcohol? (Please tick one option on each row) - Order a takeaway
Unweighted baseBase: All GB adults who drink and say that alcohol makes
them likely to eat unhealthy foodMore likelyLess likely
No difference
After you've drunk enough alcohol to reach you “tipping point”...Are you more or less likely to do each of the following, compared to a time when you haven’t drunk any alcohol? (Please tick one option on each row) - Snack on a family sized packet of crisps or nuts
Unweighted baseBase: All GB adults who drink and say that alcohol makes
them likely to eat unhealthy foodMore likelyLess likely
No difference
ABC1 C2DE North Midlands East London South Wales Scotland
RegionSocial Grade
400 263 176 90 46 114 145 26 66
415 259 175 101 55 106 147 25 64
59% 56% 62% 62% 57% 55% 54% 58% 55%14% 21% 17% 18% 15% 21% 12% 18% 18%27% 23% 21% 20% 28% 25% 34% 24% 27%
400 263 176 90 46 114 145 26 66
415 259 175 101 55 106 147 25 64
60% 53% 58% 56% 52% 54% 58% 70% 60%16% 16% 17% 20% 22% 14% 13% 7% 15%24% 30% 25% 24% 26% 31% 29% 23% 24%
23 © 2014 YouGov plc. All Rights Reserved yougov.com
YouGov / Slimming WorldFieldwork - 2042 GB AdultsGB Sample : 24th - 30th December 2013
Total
Base Male Female 18-24 25-34 35-44 45-54 55+
Gender Age
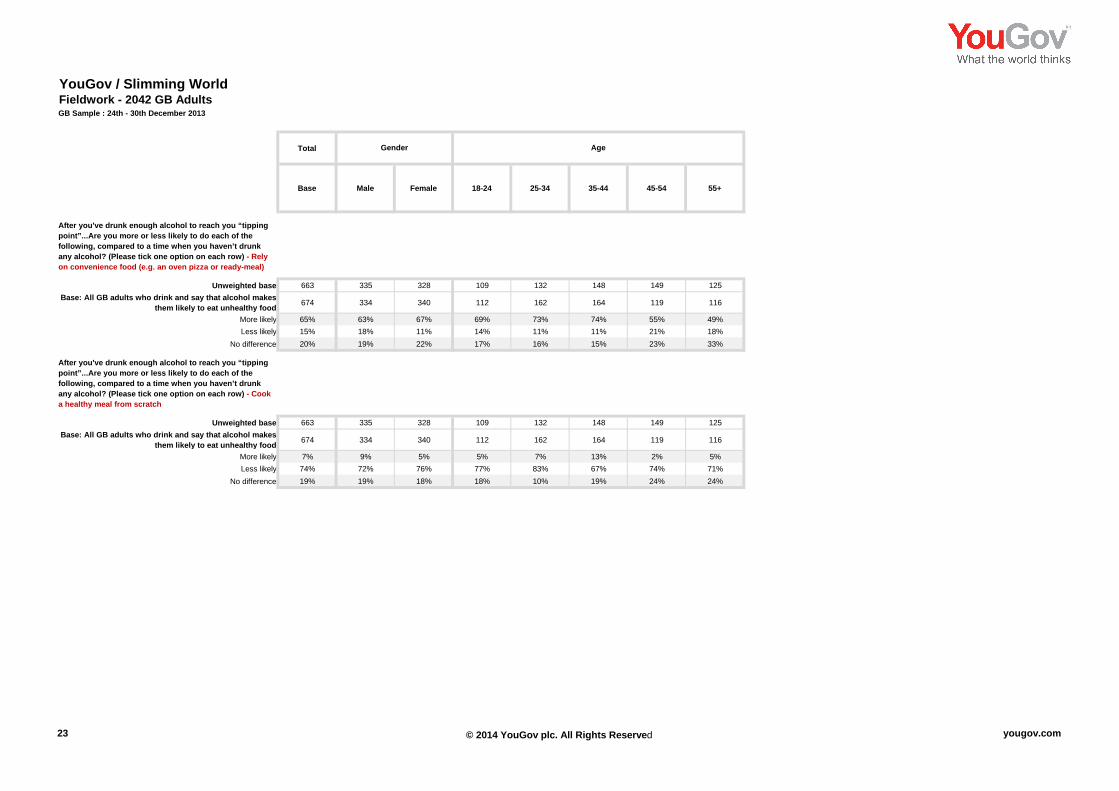
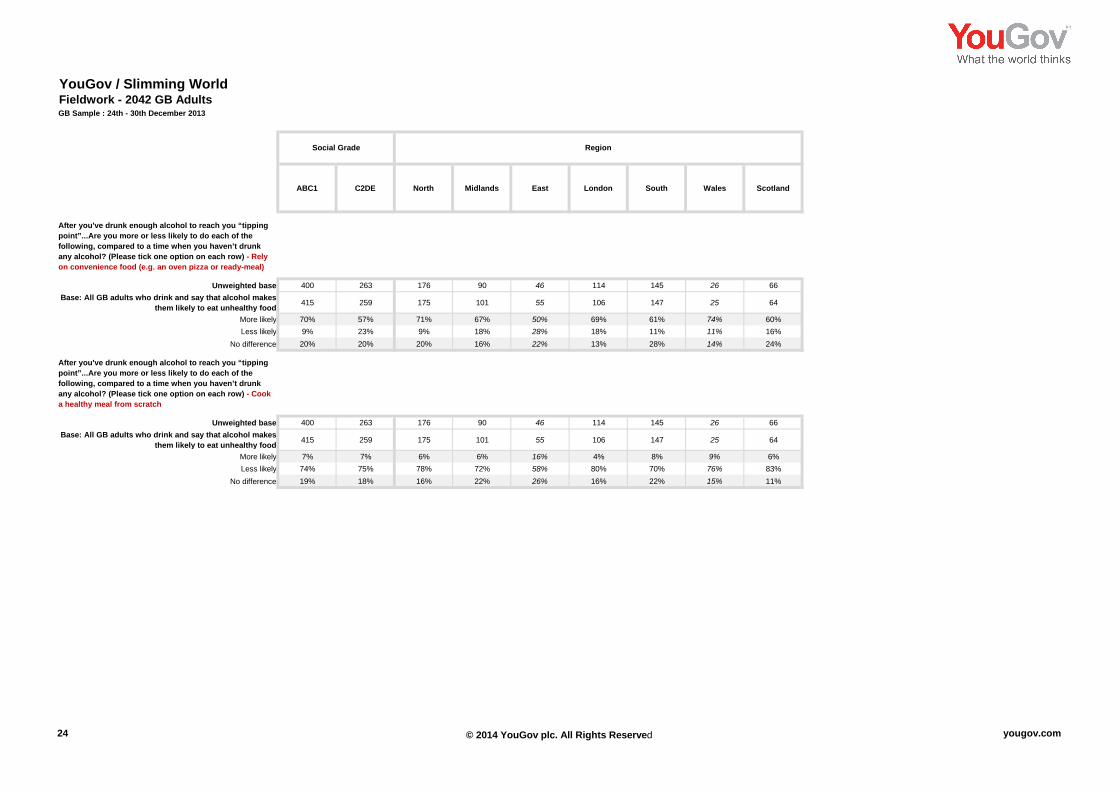
After you've drunk enough alcohol to reach you “tipping point”...Are you more or less likely to do each of the following, compared to a time when you haven’t drunk any alcohol? (Please tick one option on each row) - Rely on convenience food (e.g. an oven pizza or ready-meal)
Unweighted base 663 335 328 109 132 148 149 125Base: All GB adults who drink and say that alcohol makes
them likely to eat unhealthy food 674 334 340 112 162 164 119 116
More likely 65% 63% 67% 69% 73% 74% 55% 49%Less likely 15% 18% 11% 14% 11% 11% 21% 18%
No difference 20% 19% 22% 17% 16% 15% 23% 33%
After you've drunk enough alcohol to reach you “tipping point”...Are you more or less likely to do each of the following, compared to a time when you haven’t drunk any alcohol? (Please tick one option on each row) - Cook a healthy meal from scratch
Unweighted base 663 335 328 109 132 148 149 125Base: All GB adults who drink and say that alcohol makes
them likely to eat unhealthy food 674 334 340 112 162 164 119 116
More likely 7% 9% 5% 5% 7% 13% 2% 5%Less likely 74% 72% 76% 77% 83% 67% 74% 71%
No difference 19% 19% 18% 18% 10% 19% 24% 24%
24 © 2014 YouGov plc. All Rights Reserved yougov.com
YouGov / Slimming WorldFieldwork - 2042 GB AdultsGB Sample : 24th - 30th December 2013
After you've drunk enough alcohol to reach you “tipping point”...Are you more or less likely to do each of the following, compared to a time when you haven’t drunk any alcohol? (Please tick one option on each row) - Rely on convenience food (e.g. an oven pizza or ready-meal)
Unweighted baseBase: All GB adults who drink and say that alcohol makes
them likely to eat unhealthy foodMore likelyLess likely
No difference
After you've drunk enough alcohol to reach you “tipping point”...Are you more or less likely to do each of the following, compared to a time when you haven’t drunk any alcohol? (Please tick one option on each row) - Cook a healthy meal from scratch
Unweighted baseBase: All GB adults who drink and say that alcohol makes
them likely to eat unhealthy foodMore likelyLess likely
No difference
ABC1 C2DE North Midlands East London South Wales Scotland
RegionSocial Grade
400 263 176 90 46 114 145 26 66
415 259 175 101 55 106 147 25 64
70% 57% 71% 67% 50% 69% 61% 74% 60%9% 23% 9% 18% 28% 18% 11% 11% 16%
20% 20% 20% 16% 22% 13% 28% 14% 24%
400 263 176 90 46 114 145 26 66
415 259 175 101 55 106 147 25 64
7% 7% 6% 6% 16% 4% 8% 9% 6%74% 75% 78% 72% 58% 80% 70% 76% 83%19% 18% 16% 22% 26% 16% 22% 15% 11%

25 © 2014 YouGov plc. All Rights Reserved yougov.com
YouGov / Slimming WorldFieldwork - 2042 GB AdultsGB Sample : 24th - 30th December 2013
Total
Base Male Female 18-24 25-34 35-44 45-54 55+
Gender Age
After you've drunk enough alcohol to reach you “tipping point”...Are you more or less likely to do each of the following, compared to a time when you haven’t drunk any alcohol? (Please tick one option on each row) - Snack on fruit
Unweighted base 663 335 328 109 132 148 149 125Base: All GB adults who drink and say that alcohol makes
them likely to eat unhealthy food 674 334 340 112 162 164 119 116
More likely 10% 15% 6% 14% 7% 16% 3% 13%Less likely 65% 62% 69% 63% 76% 61% 69% 55%
No difference 24% 24% 24% 23% 17% 23% 28% 33%
After you've drunk enough alcohol to reach you “tipping point”...Are you more or less likely to do each of the following, compared to a time when you haven’t drunk any alcohol? (Please tick one option on each row) - Snack on sweet food (e.g. chocolate, biscuit, cake)
Unweighted base 663 335 328 109 132 148 149 125Base: All GB adults who drink and say that alcohol makes
them likely to eat unhealthy food 674 334 340 112 162 164 119 116
More likely 45% 43% 48% 40% 50% 52% 39% 39%Less likely 27% 33% 22% 26% 31% 21% 28% 32%
No difference 27% 24% 30% 34% 18% 27% 33% 29%

26 © 2014 YouGov plc. All Rights Reserved yougov.com
YouGov / Slimming WorldFieldwork - 2042 GB AdultsGB Sample : 24th - 30th December 2013
After you've drunk enough alcohol to reach you “tipping point”...Are you more or less likely to do each of the following, compared to a time when you haven’t drunk any alcohol? (Please tick one option on each row) - Snack on fruit
Unweighted baseBase: All GB adults who drink and say that alcohol makes
them likely to eat unhealthy foodMore likelyLess likely
No difference
After you've drunk enough alcohol to reach you “tipping point”...Are you more or less likely to do each of the following, compared to a time when you haven’t drunk any alcohol? (Please tick one option on each row) - Snack on sweet food (e.g. chocolate, biscuit, cake)
Unweighted baseBase: All GB adults who drink and say that alcohol makes
them likely to eat unhealthy foodMore likelyLess likely
No difference
ABC1 C2DE North Midlands East London South Wales Scotland
RegionSocial Grade
400 263 176 90 46 114 145 26 66
415 259 175 101 55 106 147 25 64
10% 12% 10% 7% 13% 14% 11% 6% 10%64% 68% 69% 71% 50% 66% 60% 87% 62%27% 20% 21% 22% 37% 21% 29% 7% 28%
400 263 176 90 46 114 145 26 66
415 259 175 101 55 106 147 25 64
52% 35% 46% 49% 33% 39% 49% 57% 46%23% 35% 30% 27% 34% 29% 22% 26% 27%25% 30% 23% 24% 33% 33% 30% 17% 28%

27 © 2014 YouGov plc. All Rights Reserved yougov.com
YouGov / Slimming WorldFieldwork - 2042 GB AdultsGB Sample : 24th - 30th December 2013
Total
Base Male Female 18-24 25-34 35-44 45-54 55+
Gender Age
After you've drunk enough alcohol to reach you “tipping point”...Are you more or less likely to do each of the following, compared to a time when you haven’t drunk any alcohol? (Please tick one option on each row) - Go out for an unplanned meal
Unweighted base 663 335 328 109 132 148 149 125Base: All GB adults who drink and say that alcohol makes
them likely to eat unhealthy food 674 334 340 112 162 164 119 116
More likely 34% 40% 28% 38% 47% 37% 19% 24%Less likely 33% 33% 34% 30% 28% 32% 41% 37%
No difference 33% 27% 38% 32% 26% 31% 40% 39%
After you've drunk enough alcohol to reach you “tipping point”...Are you more or less likely to do each of the following, compared to a time when you haven’t drunk any alcohol? (Please tick one option on each row) - Eat a larger amount of food
Unweighted base 663 335 328 109 132 148 149 125Base: All GB adults who drink and say that alcohol makes
them likely to eat unhealthy food 674 334 340 112 162 164 119 116
More likely 63% 64% 63% 55% 70% 75% 57% 51%Less likely 16% 15% 16% 19% 15% 7% 20% 22%
No difference 21% 21% 21% 26% 15% 19% 23% 27%

28 © 2014 YouGov plc. All Rights Reserved yougov.com
YouGov / Slimming WorldFieldwork - 2042 GB AdultsGB Sample : 24th - 30th December 2013
After you've drunk enough alcohol to reach you “tipping point”...Are you more or less likely to do each of the following, compared to a time when you haven’t drunk any alcohol? (Please tick one option on each row) - Go out for an unplanned meal
Unweighted baseBase: All GB adults who drink and say that alcohol makes
them likely to eat unhealthy foodMore likelyLess likely
No difference
After you've drunk enough alcohol to reach you “tipping point”...Are you more or less likely to do each of the following, compared to a time when you haven’t drunk any alcohol? (Please tick one option on each row) - Eat a larger amount of food
Unweighted baseBase: All GB adults who drink and say that alcohol makes
them likely to eat unhealthy foodMore likelyLess likely
No difference
ABC1 C2DE North Midlands East London South Wales Scotland
RegionSocial Grade
400 263 176 90 46 114 145 26 66
415 259 175 101 55 106 147 25 64
36% 32% 30% 40% 29% 45% 36% 26% 22%30% 38% 39% 36% 29% 33% 26% 19% 38%34% 30% 31% 25% 42% 22% 38% 55% 41%
400 263 176 90 46 114 145 26 66
415 259 175 101 55 106 147 25 64
67% 57% 64% 61% 51% 63% 68% 87% 53%12% 22% 17% 20% 16% 19% 8% 10% 19%21% 21% 19% 20% 33% 17% 24% 4% 27%

29 © 2014 YouGov plc. All Rights Reserved yougov.com
YouGov / Slimming WorldFieldwork - 2042 GB AdultsGB Sample : 24th - 30th December 2013
Total
Base Male Female 18-24 25-34 35-44 45-54 55+
Gender Age
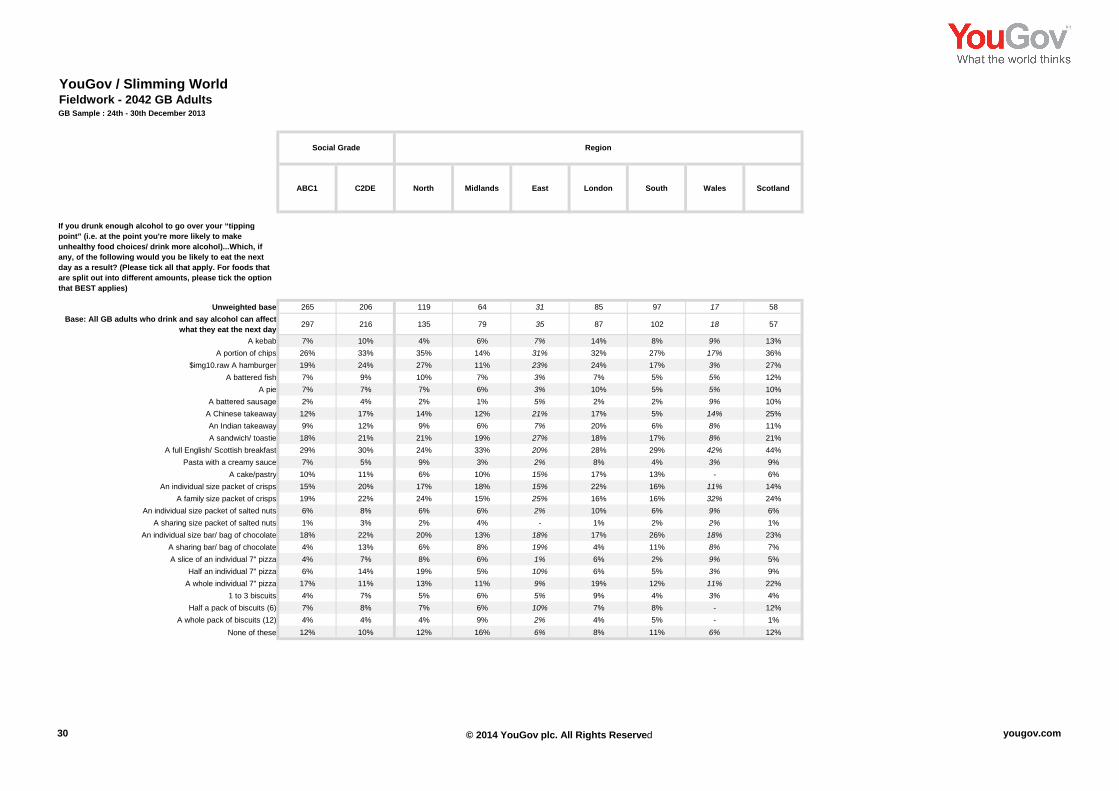
If you drunk enough alcohol to go over your “tipping point” (i.e. at the point you're more likely to make unhealthy food choices/ drink more alcohol)...Which, if any, of the following would you be likely to eat the next day as a result? (Please tick all that apply. For foods that are split out into different amounts, please tick the option that BEST applies)
Unweighted base 471 218 253 92 107 120 83 69Base: All GB adults who drink and say alcohol can affect
what they eat the next day 513 230 283 98 131 143 69 73
A kebab 8% 12% 5% 12% 8% 8% 7% 5%A portion of chips 29% 25% 32% 38% 25% 29% 28% 25%
$img10.raw A hamburger 21% 16% 25% 30% 24% 19% 16% 12%A battered fish 7% 8% 7% 4% 5% 7% 3% 21%
A pie 7% 10% 4% 6% 7% 7% 8% 8%A battered sausage 3% 4% 2% 3% 2% 4% 3% 3%
A Chinese takeaway 14% 9% 18% 16% 18% 11% 15% 9%An Indian takeaway 10% 10% 10% 9% 15% 8% 10% 6%A sandwich/ toastie 20% 17% 21% 15% 33% 10% 18% 22%
A full English/ Scottish breakfast 29% 30% 29% 28% 32% 31% 32% 21%Pasta with a creamy sauce 6% 4% 8% 5% 13% 3% 2% 4%
A cake/pastry 10% 12% 9% 10% 9% 9% 17% 9%An individual size packet of crisps 17% 18% 16% 17% 16% 19% 12% 22%
A family size packet of crisps 20% 18% 22% 24% 23% 21% 16% 12%An individual size packet of salted nuts 6% 8% 5% 4% 7% 8% 1% 12%
A sharing size packet of salted nuts 2% 3% 1% 1% - 3% 1% 7%An individual size bar/ bag of chocolate 20% 15% 24% 25% 20% 19% 17% 14%
A sharing bar/ bag of chocolate 8% 5% 11% 11% 9% 8% 9% 4%A slice of an individual 7" pizza 6% 7% 4% 13% 11% - 2% 1%
Half an individual 7" pizza 10% 10% 9% 15% 7% 10% 3% 11%A whole individual 7" pizza 14% 14% 15% 19% 25% 8% 13% 2%
1 to 3 biscuits 5% 8% 3% 5% 7% 3% 6% 6%Half a pack of biscuits (6) 8% 6% 9% 4% 7% 8% 13% 7%
A whole pack of biscuits (12) 4% 7% 2% 4% 2% 9% 1% 2%None of these 11% 13% 9% 14% 8% 8% 13% 17%
30 © 2014 YouGov plc. All Rights Reserved yougov.com
YouGov / Slimming WorldFieldwork - 2042 GB AdultsGB Sample : 24th - 30th December 2013
If you drunk enough alcohol to go over your “tipping point” (i.e. at the point you're more likely to make unhealthy food choices/ drink more alcohol)...Which, if any, of the following would you be likely to eat the next day as a result? (Please tick all that apply. For foods that are split out into different amounts, please tick the option that BEST applies)
Unweighted baseBase: All GB adults who drink and say alcohol can affect
what they eat the next dayA kebab
A portion of chips$img10.raw A hamburger
A battered fishA pie
A battered sausageA Chinese takeawayAn Indian takeawayA sandwich/ toastie
A full English/ Scottish breakfastPasta with a creamy sauce
A cake/pastryAn individual size packet of crisps
A family size packet of crispsAn individual size packet of salted nuts
A sharing size packet of salted nutsAn individual size bar/ bag of chocolate
A sharing bar/ bag of chocolateA slice of an individual 7" pizza
Half an individual 7" pizzaA whole individual 7" pizza
1 to 3 biscuitsHalf a pack of biscuits (6)
A whole pack of biscuits (12)None of these
ABC1 C2DE North Midlands East London South Wales Scotland
RegionSocial Grade
265 206 119 64 31 85 97 17 58
297 216 135 79 35 87 102 18 57
7% 10% 4% 6% 7% 14% 8% 9% 13%26% 33% 35% 14% 31% 32% 27% 17% 36%19% 24% 27% 11% 23% 24% 17% 3% 27%7% 9% 10% 7% 3% 7% 5% 5% 12%7% 7% 7% 6% 3% 10% 5% 5% 10%2% 4% 2% 1% 5% 2% 2% 9% 10%
12% 17% 14% 12% 21% 17% 5% 14% 25%9% 12% 9% 6% 7% 20% 6% 8% 11%
18% 21% 21% 19% 27% 18% 17% 8% 21%29% 30% 24% 33% 20% 28% 29% 42% 44%7% 5% 9% 3% 2% 8% 4% 3% 9%
10% 11% 6% 10% 15% 17% 13% - 6%15% 20% 17% 18% 15% 22% 16% 11% 14%19% 22% 24% 15% 25% 16% 16% 32% 24%6% 8% 6% 6% 2% 10% 6% 9% 6%1% 3% 2% 4% - 1% 2% 2% 1%
18% 22% 20% 13% 18% 17% 26% 18% 23%4% 13% 6% 8% 19% 4% 11% 8% 7%4% 7% 8% 6% 1% 6% 2% 9% 5%6% 14% 19% 5% 10% 6% 5% 3% 9%
17% 11% 13% 11% 9% 19% 12% 11% 22%4% 7% 5% 6% 5% 9% 4% 3% 4%7% 8% 7% 6% 10% 7% 8% - 12%4% 4% 4% 9% 2% 4% 5% - 1%
12% 10% 12% 16% 6% 8% 11% 6% 12%

31 © 2014 YouGov plc. All Rights Reserved yougov.com
YouGov / Slimming WorldFieldwork - 2042 GB AdultsGB Sample : 24th - 30th December 2013
Total
Base Male Female 18-24 25-34 35-44 45-54 55+
Gender Age
And which, if any, of the following foods would you be MOST likely to eat the next day as a result of drinking this amount of alcohol? (Please tick the option that BEST applies. For foods that are split out into different amounts, please tick the option that BEST applies)
Unweighted base 471 218 253 92 107 120 83 69Base: All GB adults who drink and say alcohol can affect
what they eat the next day 513 230 283 98 131 143 69 73
A kebab 4% 5% 3% 4% 4% 6% 4% -A portion of chips 7% 5% 9% 7% 4% 8% 5% 11%
$img10.raw A hamburger 7% 5% 9% 8% 7% 9% 7% 3%A battered fish 2% 3% 1% 1% 3% 1% - 5%
A pie 1% 2% 0% - - 1% 5% 1%A battered sausage - - - - - - - -
A Chinese takeaway 3% 2% 4% 1% 2% 5% 1% 4%An Indian takeaway 3% 3% 2% - 1% 4% 3% 5%A sandwich/ toastie 10% 7% 12% 7% 17% 3% 6% 16%
A full English/ Scottish breakfast 20% 22% 18% 12% 26% 22% 24% 11%Pasta with a creamy sauce 2% 2% 1% 1% 2% 3% - -
A cake/pastry 3% 3% 3% 4% 4% 0% 6% 2%An individual size packet of crisps 3% 2% 4% 4% 2% 3% 5% 6%
A family size packet of crisps 6% 7% 6% 10% 4% 8% 4% 3%An individual size packet of salted nuts 1% 1% 1% 1% - 1% 1% 1%
A sharing size packet of salted nuts 1% 1% - 1% - 1% 1% -An individual size bar/ bag of chocolate 5% 6% 4% 5% 4% 8% 3% 3%
A sharing bar/ bag of chocolate 2% 1% 3% 7% 1% 3% - -A slice of an individual 7" pizza 1% 1% 1% 3% 1% - 2% -
Half an individual 7" pizza 1% 1% 1% 4% - - 1% 1%A whole individual 7" pizza 5% 3% 6% 6% 8% 2% 6% 1%
1 to 3 biscuits 0% 1% - - - - - 2%Half a pack of biscuits (6) 2% 1% 2% - 1% 1% 4% 4%
A whole pack of biscuits (12) 1% 1% 0% 1% 0% 1% - 1%None of these 12% 14% 10% 14% 9% 9% 13% 19%

32 © 2014 YouGov plc. All Rights Reserved yougov.com
YouGov / Slimming WorldFieldwork - 2042 GB AdultsGB Sample : 24th - 30th December 2013
And which, if any, of the following foods would you be MOST likely to eat the next day as a result of drinking this amount of alcohol? (Please tick the option that BEST applies. For foods that are split out into different amounts, please tick the option that BEST applies)
Unweighted baseBase: All GB adults who drink and say alcohol can affect
what they eat the next dayA kebab
A portion of chips$img10.raw A hamburger
A battered fishA pie
A battered sausageA Chinese takeawayAn Indian takeawayA sandwich/ toastie
A full English/ Scottish breakfastPasta with a creamy sauce
A cake/pastryAn individual size packet of crisps
A family size packet of crispsAn individual size packet of salted nuts
A sharing size packet of salted nutsAn individual size bar/ bag of chocolate
A sharing bar/ bag of chocolateA slice of an individual 7" pizza
Half an individual 7" pizzaA whole individual 7" pizza
1 to 3 biscuitsHalf a pack of biscuits (6)
A whole pack of biscuits (12)None of these
ABC1 C2DE North Midlands East London South Wales Scotland
RegionSocial Grade
265 206 119 64 31 85 97 17 58
297 216 135 79 35 87 102 18 57
4% 4% 2% 3% 4% 7% 7% 6% 3%5% 11% 8% 8% 3% 5% 8% 14% 5%
10% 4% 10% 3% 4% 6% 8% - 13%2% 1% 2% 4% - 2% 1% 2% 1%0% 2% 0% 1% - - 0% - 6%- - - - - - - - -
2% 4% 4% 2% 1% 4% 0% 6% 3%2% 4% 1% - 5% 7% 2% - 4%
10% 9% 12% 10% 22% 6% 8% 8% 7%22% 17% 18% 24% 5% 18% 20% 28% 28%2% 1% 3% 3% - 2% - - 1%3% 3% 1% - 13% 7% 2% - 1%3% 4% 1% 3% 4% 4% 7% 2% 1%6% 7% 12% 3% 1% 4% 3% 15% 8%1% 0% 1% 2% 2% - 1% - -1% - - - - 1% 2% 2% -6% 4% 3% 9% - 5% 8% 3% 2%0% 5% 2% 3% 10% - 1% 6% -1% 2% 1% 1% - 1% 2% - -- 2% 3% 1% - - - 3% -
7% 2% 3% 3% 5% 9% 5% - 6%- 1% 1% - - - - - -
1% 3% 1% 1% 8% 1% 3% - -1% 0% - - - 3% 1% - -
12% 11% 12% 16% 14% 10% 11% 6% 12%

33 © 2014 YouGov plc. All Rights Reserved yougov.com
YouGov / Slimming WorldFieldwork - 2042 GB AdultsGB Sample : 24th - 30th December 2013
Total
Base Male Female 18-24 25-34 35-44 45-54 55+
Gender Age
If you had drunk enough to reach your “tipping point”...Which, if any, of the following physical activities do you think you would cancel, or give up on doing the next day? (Please tick all that apply)
Unweighted base 785 394 391 124 152 162 175 172Base: All GB adults who drink and alcohol affects the
exercise they do the next day 799 397 401 125 185 176 144 167
Going for a walk 13% 14% 13% 11% 15% 19% 13% 8%Running 25% 26% 24% 33% 31% 22% 17% 21%Cycling 17% 20% 15% 22% 16% 19% 13% 18%
Swimming 18% 19% 17% 21% 21% 14% 16% 18%Going to the gym 29% 30% 28% 41% 35% 27% 22% 21%
Playing football 14% 16% 12% 20% 13% 13% 9% 17%Going to a fitness class 22% 21% 22% 27% 24% 19% 17% 23%
Other physical activity 11% 11% 11% 16% 10% 10% 8% 11%Not applicable - I would always carry on with my physical
activity the next day 16% 19% 13% 11% 9% 15% 24% 21%
Not applicable - I don't tend to do any physical activities in general 34% 29% 39% 33% 30% 25% 37% 47%
You said that you would be likely to cancel a physical activity the next day if you had drunk enough alcohol to reach your tipping point the night before...Which, if any, of the following would you be likely to do instead of doing the physical activity you had planned to do? (Please tick all that apply)
Unweighted base 368 189 179 64 91 90 72 51
Base: All GB adults who drink and would cancel an activity because of consuming alcohol the night before 399 206 193 70 113 105 56 55
Stay in bed 51% 48% 55% 65% 54% 56% 40% 31%Watch TV 62% 57% 68% 60% 60% 67% 58% 65%
Play on a computer console 14% 19% 9% 13% 15% 11% 13% 19%Spend time on social media 25% 24% 26% 32% 26% 30% 16% 15%
Head to the pub 5% 7% 3% 9% 9% 2% 1% 1%Get a takeaway 18% 19% 17% 15% 30% 17% 11% 6%
Get an early night 46% 43% 49% 44% 50% 37% 38% 64%Anything where I can sit down 39% 42% 37% 43% 39% 32% 43% 45%
None of these 2% 3% 2% 2% 1% - 9% 3%

34 © 2014 YouGov plc. All Rights Reserved yougov.com
YouGov / Slimming WorldFieldwork - 2042 GB AdultsGB Sample : 24th - 30th December 2013
If you had drunk enough to reach your “tipping point”...Which, if any, of the following physical activities do you think you would cancel, or give up on doing the next day? (Please tick all that apply)
Unweighted baseBase: All GB adults who drink and alcohol affects the
exercise they do the next dayGoing for a walk
RunningCycling
SwimmingGoing to the gym
Playing footballGoing to a fitness class
Other physical activityNot applicable - I would always carry on with my physical
activity the next dayNot applicable - I don't tend to do any physical activities in
general
You said that you would be likely to cancel a physical activity the next day if you had drunk enough alcohol to reach your tipping point the night before...Which, if any, of the following would you be likely to do instead of doing the physical activity you had planned to do? (Please tick all that apply)
Unweighted base
Base: All GB adults who drink and would cancel an activity because of consuming alcohol the night before
Stay in bedWatch TV
Play on a computer consoleSpend time on social media
Head to the pubGet a takeaway
Get an early nightAnything where I can sit down
None of these
ABC1 C2DE North Midlands East London South Wales Scotland
RegionSocial Grade
463 322 210 105 57 132 171 32 78
473 325 209 121 65 125 174 31 74
13% 13% 16% 8% 3% 18% 11% 31% 12%28% 21% 26% 26% 17% 30% 23% 14% 28%20% 14% 19% 13% 21% 17% 20% 17% 12%21% 14% 16% 23% 23% 15% 18% 30% 14%34% 22% 35% 31% 27% 29% 28% 15% 19%16% 11% 15% 17% 10% 14% 14% 15% 14%25% 17% 27% 22% 15% 20% 22% 15% 19%13% 7% 8% 10% 11% 16% 10% 19% 11%
16% 16% 13% 12% 14% 15% 18% 27% 23%
29% 42% 32% 38% 44% 32% 33% 31% 33%
236 132 94 49 24 70 83 10 38
262 137 115 60 27 67 85 13 33
51% 52% 49% 57% 44% 54% 46% 74% 57%64% 58% 63% 66% 60% 66% 57% 70% 58%17% 7% 14% 12% 16% 19% 9% 13% 15%26% 24% 28% 17% 38% 25% 21% 20% 33%4% 7% 3% 6% - 16% 2% - -
20% 14% 15% 25% 16% 23% 9% 51% 19%46% 45% 54% 37% 53% 44% 38% 39% 53%40% 38% 36% 35% 15% 49% 45% 29% 50%2% 3% 3% 2% 3% 1% 2% - 5%