young leaders group presents: what millennials want · young leaders group presents: monday,...
TRANSCRIPT

What Millennials
Want
Young Leaders Group Presents:
Monday, November 9, 2015
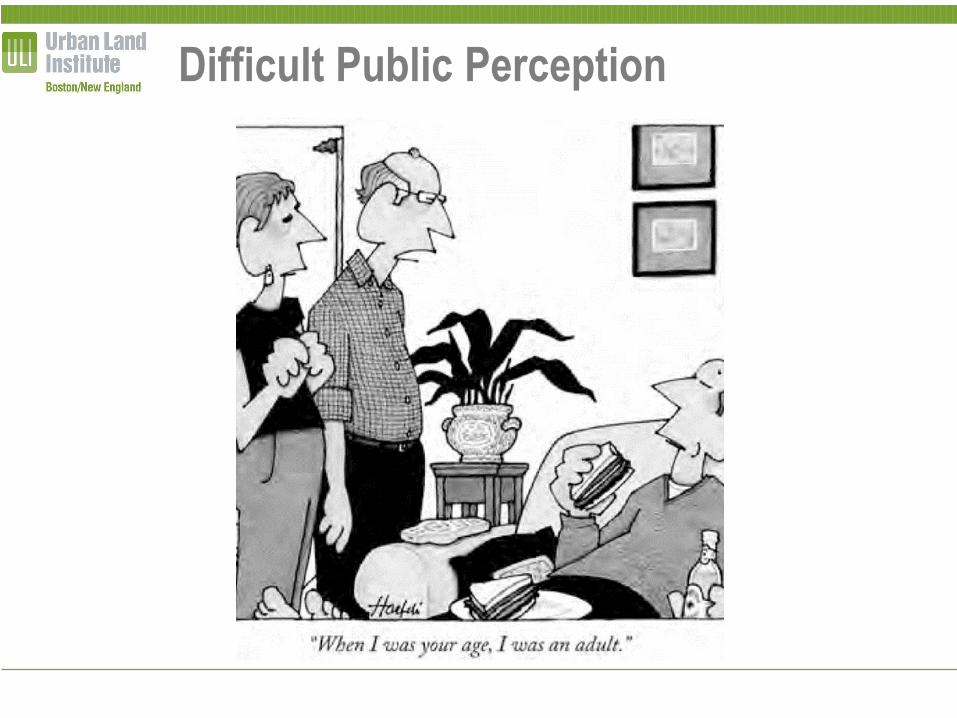
Difficult Public Perception

About the survey• Online survey of 660 young professionals (20-37, college educated) living and
working in Greater Boston area
• Survey invite distributed via civic and business groups email and social media
Where respondents live And where they work

Views on “millennials”
What respondents think of themselves
(i.e., “millennials”)
What they think their elders think of
millennials

Commute Times Vary by Location
Median commute time by home and work locations
• South Boston Waterfront workers have the longest commutes
20
30 30
40
45
40
35
30 30 30 30
DowntownBoston
BostonNeighborhoods
Cambridge /Somerville
Inside 128 Outside 128 South Boston &Waterfront
South End /Fenway /
Leather District
Financial District Beacon Hill /West End /North End
Other Boston Outside Boston
HOME REGION WORK REGION

The T is key for YP’s commutes
Transit, Walking, Biking all Important to Young Professionals CommutesQ: How do you normally get to work or school? Please check all that apply.
1%
2%
6%
6%
13%
22%
24%
26%
39%
49%
Taxi
Shuttle
Rideshare
Drive w others
Commuter Rail
Bike
Bus / Silver Line
Drive alone
Walk
Subway / Green Line

Transit also top factor in commute decisions
% who say each factor is “very important” to their commute decisions
73%
68%
65%
41%
35%
30%
26%
25%
22%
20%
Proximity of bus or train stops to home or work/school
Reliability of the bus or train
Travel time
Traffic congestion
Cost of commute (gasoline, parking, transit pass, etc)
Having or not having a safe route to bike to work/school
Availability of parking at work/school
Getting exercise walking or biking
Concern about the environment / climate change
Need car for errands before/after work/school

Ridesharing has taken off
• Uber far more popular than Lyft among YP’s
• Strong adoption of Hubway considering how few commute by bike
Nearly as many have taken an Uber as have taken a traditional taxi.Q: Which of the following have you used? Click all that apply.
2%
5%
24%
27%
39%
84%
89%
Bridj
Lyft Line
UberPool
Lyft
Hubway
Uber
Taxi

Ridesharing has taken offNearly as many have taken an Uber as have taken a traditional taxi.
Q: Which of the following have you used? Click all that apply.
Regulate Uber/Lyft more like taxis, 9%
Deregulate taxis like Uber/Lyft,
27%
Change regulations for
both, 37%
Make no changes, 18%
Don't know / refused, 9%

At work, transit, location are key
• Proximity to transit is far and away the top workplace feature.
• Location to restaurants, nightlife also key.
• 37% work in an open/collaborative space – but very few consider that important.
% saying each is “very important” to their satisfaction at work
78%
32% 32%26%
20% 19%
Near transit Near dining /nightlife
In-office amenities Bike amenities Eco-friendly /sustainable
Open workenvironment

Leave, flex time top work benefits• Slight age, gender gaps on family/medical leave
• Transit passes seen as more valuable than parking.
% saying each is “very important” to their satisfaction at work
22%
30%
40%
55%
68%
73%
Sustainability initiatives
Parking
Health/wellness
Transit pass
Flex schedule
Medical leave

What YP’s look for in a neighborhood
% saying each was “very important” when choosing neighborhood/community
• Top 3 factors relate to getting around.
• Schools, safety shoot to near top of list for YP’s with kids.
81%
80%
75%
63%
57%
48%
41%
25%
25%
21%
16%
Ease of commute
Transit access
Walk to amenities
Shopping
Crime / safety
Parks/open space
Restaurants/nightlife
On-street parking
Public schools
Bike lanes/paths
Diversity

Much more open to TOD than micro-units, co-hab
Q: How likely would you be to live in a…
29%
70%
15%
84%
74%
25%
Very / somehwat likely Not very / not at all likely
Micro-unit Co-Hab TOD
• Only the youngest, lowest income and those living with roommates show much interest in either
micro-units or co-housing
• TOD more popular inside Boston/Cambridge/Somerville than farther out

Cambridge, Somerville, JP are hot
Q: If you were looking for a new place to live, in which neighborhood or community
would you start looking first?

Price is top factor when choosing a home
% saying each was “very important” when choosing home to buy or rent
• Factors like parking, outdoor space more important to current owners and those living in single
family homes currently.
88%
51%
41%
36%
28%
18%
11%
8%
6%
Price
Layout
Outdoor space
Size
Design
Off-street parking
Bike parking
Sustainable features
Amenities

Renting versus owning
1%
45%
38%
10%
6%
No, never
Yes, next 5 yrs
Yes 5-10 years
Yes, > 10 yrs
Don't know /refused
Rent, 66%
Own, 32%
No response, 2%
Q: Do you currently rent or own your residence?
Q: Do you plan on owning a home?

Prospective buyers aren’t too picky
51%
43%
6%
Apartment/condo(> 4 units)
Apartment/condo(< 4 units)
Single family
Any of the above
12%
19%
30%
38%
Where renters live now What renters would like to buy
N/A
• Some preference for buying single family, but most just want to own something.
• 41% of current owners live in single-family homes

Urban dwellers, but for how long?
• Half (49%) see themselves in Greater Boston in 10 years; 31% don’t know.
• One-in-three (29%) don’t plan on ever moving to the suburbs.
• Even higher in Boston Neighborhoods (41%), Cambridge/Somerville (46%).
• Three-quarters (72%) are planning or open to having kids; those not planning kids
more likely to remain in city.
36%
30%
20%
8%
2%
More space Cost of living Schools Suburban lifestyle Crime/safety
% ranking each their first reason for moving to suburbs