your content their language - sdl.com · 2 our vision global information management helps our...
TRANSCRIPT
SDL plc Interim Report 2011
Your Content Their Language

1Interim Report and Accounts 2011
Contents
SDL OverviewOur Vision 2
Financial Highlights 3
Operational Highlights 4
Responsibility Statement by the Management Board 5
Executive Chairman’s Statement 6
Financial Trends 10
Statutory Information Independant Review Report to SDL plc 11
Interim Condensed Consolidated Income Statement 12
Interim Condensed Consolidated Statement of Comprehensive Income 13
Interim Condensed Consolidated Statement of Financial Position 14
Interim Condensed Consolidated Statement of Changes in Equity 15
Interim Condensed Consolidated Statement of Cash Flows 16
Notes to the Interim Condensed Consolidated Financial Statements 18
Corporate Information 27
Executive and Non-Executive Directors 28
1
2
2
Our Vision
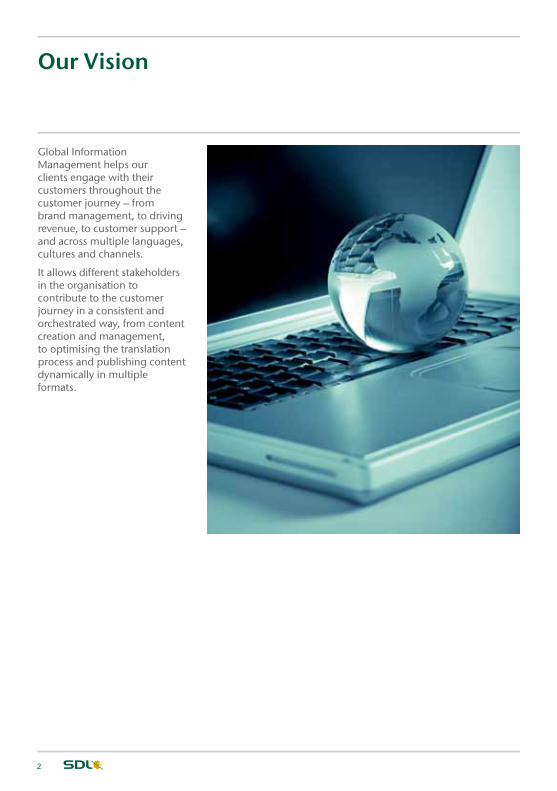
Global Information Management helps our clients engage with their customers throughout the customer journey – from brand management, to driving revenue, to customer support – and across multiple languages, cultures and channels.
It allows different stakeholders in the organisation to contribute to the customer journey in a consistent and orchestrated way, from content creation and management, to optimising the translation process and publishing content dynamically in multiple formats.
SDL O
verview1
Financial Highlights
Unaudited6 months to
30 June 2011
£’000
Unaudited6 months to
30 June 2010
£’000Change
%
Income Statement:
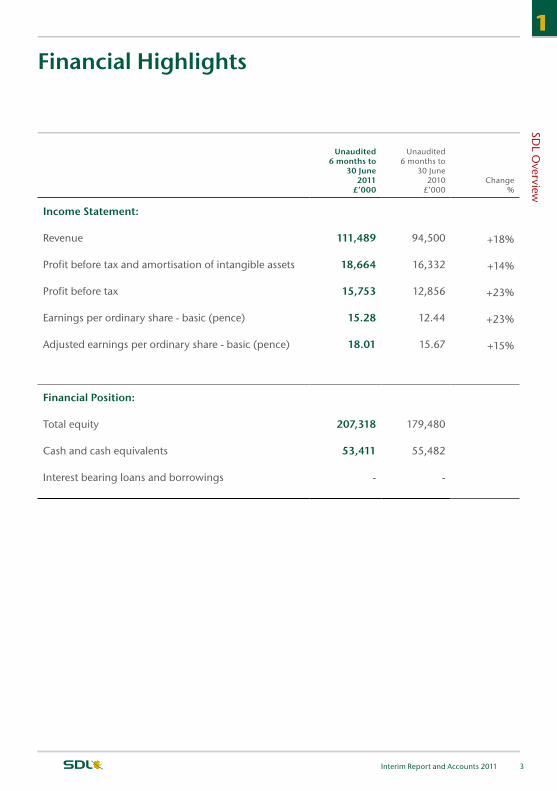
Revenue 111,489 94,500 +18%
Profit before tax and amortisation of intangible assets 18,664 16,332 +14%
Profit before tax 15,753 12,856 +23%
Earnings per ordinary share - basic (pence) 15.28 12.44 +23%
Adjusted earnings per ordinary share - basic (pence) 18.01 15.67 +15%
Financial Position:
Total equity 207,318 179,480
Cash and cash equivalents 53,411 55,482
Interest bearing loans and borrowings - -
3Interim Report and Accounts 2011

4
Operational Highlights
• Excellent first half 2011, both revenue and profit before taxation and amortisation ahead of expectations
• Headline revenue growth of 18% (17% organic at constant currency)
• Constant currency growth in all divisions:
- Content Management Technologies – headline revenue growth of 24% (27% at constant currency)
- Language Technologies – headline revenue growth of 33% (15% at constant currency excluding acquisition effects)
- Language Services – headline revenue growth of 12% (14% at constant currency)
• Cash generated from operations increased from £13.2m (2010 H1) to £18.8m (2011 H1) – up 42%
• Strong balance sheet - cash balance of £53.4m after maiden dividend of £4.3m and £1.3m acquisition payment
• Positive new business and pipeline development
• Expanding investment in growth and innovation
• Further increase in cross-selling
• Key drivers of growth continue to be: globalisation of business, exponential growth in digital content and internet penetration

5Interim Report and Accounts 2011
SDL O
verview
Responsibility Statement by the Management Board
We confirm that to the best of our knowledge:
• the condensed set of financial statements has been prepared in accordance with IAS 34 Interim Financial Reporting as adopted by the EU;
• the interim management report includes a fair review of the information required by:
a. DTR 4.2.7R of the Disclosure and Transparency Rules, being an indication of important events that have occurred during the first six months of the financial year and their impact on the condensed set of financial statements; and a description of the principal risks and uncertainties for the remaining six months of the year; and
b. DTR 4.2.8R of the Disclosure and Transparency Rules, being related party transactions that have taken place in the first six months of the current financial year and that have materially affected the financial position or performance of the entity during that period; and any changes in the related party transactions described in the last annual report that could do so.
The directors of SDL plc can be found listed on page 28.
For and on behalf of the Board
Matthew Knight Chief Financial Officer
1

Dear Shareholder,
Summary Performance I am pleased to report that SDL has delivered an excellent performance for the first half of 2011, which was significantly ahead of the prior year and ahead of consensus market expectations for both revenue and operating profit.
Revenue for the first half of 2011 was £111.5 million (2010: £94.5 million) and profit before taxation and amortisation of intangible assets (“PBTA”) for the period was £18.7 million (2010: £16.3 million) with profit before taxation of £15.8 million (2010: £12.9 million). Net cash in the business at the end of the period was £53.4 million (end December 2010: £46.6 million). A maiden dividend was paid, amounting to £4.3 million, and a
net cash outflow of £1.3million was recorded for the year due to the acquisition of Calamares in May 2011.
Headline revenue growth of 18% comprised a 4% contribution from acquisitions (Xopus and Language Weaver are not included in prior year first half comparatives); a 3% adverse impact from currency movements and 17% organic growth at constant currency. All three operating segments delivered strong revenue growth in the first half of 2011. Overall PBTA margin was marginally reduced year on year at 16.7% (2010 17.3%) due primarily to signalled increased investment in our statistical machine translation business (Language Weaver). PBTA margin, excluding the dilutive impact of Language Weaver, was 18.2%.
Executive Chairman’s Statement

The business delivered strong cash conversion in the period. Cash generated from operations amounted to £18.8 million (2010: £13.2 million) reflecting a strong receivables performance across the business and sound control of operating cash-flow.
During the period we have grown revenue in each of our businesses through expansion of established accounts and several new large client wins. Cross-leveraged sales momentum continued to positively impact our performance, as clients seek to build their brand equity and use more tightly integrated end-to-end solutions to accelerate revenue generation by taking new products to local and international markets more quickly.
8
Chairman’s Statementcontinued
The demand environment for our solutions remained sound, emphasising the defensive growth characteristics of SDL through geographic and industry sector diversity. We continued to increase our investment in innovation, reflective of our commitment to invest in statistical machine translation and content management. The demand environment was strongest in North America, with European markets more mixed. In Asia our revenue was stable and we maintained consistent and continued operations though the Japanese earthquake and tsunami, but these external factors have muted growth in the period in this region. Encouragingly, our pipeline in Asia is shaping up well.
We completed a small but strategically significant Media Asset Management acquisition in May 2011. We consider the use of live and on demand video as an important growth area and the acquisition of Calamares enables our enterprise solutions to include video and rich media management capabilities. Calamares is cloud-based, and supports a broad range of media, systems and devices including web, mobile, internet protocol television (IPTV) and various social media platforms. The technology, now branded SDL Media Manager, has been integrated into the SDL Web Content Management platform, with further integrations to take place across the product suite.
Content Management Technologies (contributing £26.0 million or 23% revenue to the Group and £4.3 million or 23% of the PBTA) (2010: contributing £20.9 million or 22% revenue to the Group and £3.4 million or 21% of the PBTA)
The division comprises Web Content Management Solutions, Structured Content Technologies and eCommerce Technologies, and was strengthened by the acquisition of Calamares in May 2011.
Content Management Technologies continued to drive forward with headline revenue growth of 24% in the first half of 2011, which was derived 1% from acquisition, a negative impact of 4% due to currency movements and with 27% organic growth at constant currency. Revenue performance was particularly strong in the key North American market. New wins in the period included Associated Press, Nationwide Insurance, Sharp Japan, Daikin Industries Japan, Hitachi Data Systems and Life Technologies Corporation. PBTA margin at 16.4% was stable despite targeted growth investment in new client acquisition, innovation and building our eCommerce business in North America. As part of our continued investment in innovation we launched SDL Tridion 2011, a new next generation release building on our established market-leading position in Web Content Management. Enhancements include additional mobile channel capabilities and device recognition, multi-
browser support, improved multi-channel campaign management and improved personalisation. We are proud that this product has been named a leader in the recent Forrester Wave report.
We continue to experience strong demand in Structured Content Management, driven by global adoption of the DITA standard for technical authoring, where SDL Trisoft is a market leader. Our value proposition enables organisations to achieve significant savings in content production by managing information in reusable formats. This is augmented by the ability to integrate with other Global Information Management components, to create seamless end-to-end solutions tailored around clients’ business needs.
Language Technologies (contributing £19.4 million or 18% revenue to the Group and £2.4 million or 13% of the PBTA) (2010: contributing £14.6 million or 15% revenue to the Group and £1.3 million or 8% of the PBTA)
Headline Language Technologies revenues grew significantly by 33% compared to the first half of 2010, derived 22% from acquisition, a negative impact of 4% from currency movements and 15% organic growth at constant currency. We have started to scale bookings in our commercial Software as a Service (SaaS) revenue stream and we expect this trend to steadily continue, particularly in statistical machine translation. PBTA margin was 12.2%, an uplift of 2.9% in the period, an excellent performance reflecting strong sales growth and operational efficiencies, partially offset by accelerated investment in statistical machine translation.
We are starting to derive tangible benefits from building a single integrated global management team for Language Technologies. Sales capacity has been increased, with notable wins including Pepperl & Fuchs, Wolf Oil, China Eastern Airlines, China Nuclear Power and Denso Japan.
The integration of Language Weaver with other SDL businesses and technologies is complete. SDL BeGlobal Enterprise clients have doubled in the period, with notable sales successes, and strategically important first sales in Japan. Language Weaver technology is now integrated into the production toolsets used by Language Services. We also targeted deployment of statistical machine translation on a content applicable basis into several Language Services clients.
Major product releases in the period include SDL Global Connect, SDL Easy Translator and new versions of SDL Translation Memory Server, SDL Teamworks and SDL WorldServer. We have a clear, unified and focussed technology innovation roadmap, including some key cloud innovations.

9Annual Report and Accounts 2011
SDL O
verview
“ At the core of Global Information Management is delivery of compelling solutions that build brand equity and accelerate speed-to-market for our clients.”
there will be increased importance placed on dynamic, collaborative sharing of after-sales user guidance and customer support. The impact of delivering effective and targeted support through online interactive user guidance will help companies provide a richer and more enjoyable user experience, providing higher customer satisfaction and closed loop revenue generation. To address this evolution we released SDL LiveContent™, designed to take user documentation and product guidance online and provide a rich user experience. We are also seeing increased interest in personalisation and targeting, as clients are engaged with the reality of potential to increase revenue capture through our eCommerce Technology.
Outlook and Current Trading
In the first half of 2011 we delivered excellent results, achieved strong constant currency growth in each of our businesses and an accelerated pace of execution of our strategy. We have also completed a small but strategically important acquisition which integrates multimedia management into our Global Information Management solution set. Our business continued to grow, with robust trading and a strong sales pipeline.
We are focussed on continuing to outperform in our chosen market segments, based on differentiation of our solutions. Our products and services are expanding and becoming more integrated through focussed innovation delivery, generating solid sales growth. In the second half of 2011 we will continue to invest revenue from sales growth into R&D and infrastructure, ensuring SDL continues to lead the field in innovation and delivery in the management of global content.
With the macro economic outlook currently mixed, we expect the Northern European economies to continue a slow recovery in the second half of 2011, as was the case in the first half of 2011, with more uncertainty prevailing in weaker Southern European countries. Continued modest growth is expected in the North American and Asian economies. Despite the variable economic outlook, based on our positioning and pipeline, we feel confident that our business will continue to deliver further profitable growth in the second half of 2011.
Mark Lancaster Executive Chairman SDL plc
1 August 2011
Language Services (contributing £66.0 million or 59% of group revenue and £12.0 million or 64% of PBTA). (2010: contributing £59.0 million or 63% of group revenue and £11.8 million or 72% of PBTA).
In the Language Services segment, headline revenue grew by 12% in the first half of 2011, with constant currency revenues 14% ahead of prior year. We have had very strong new win momentum, with overall activity levels continuing to rise, particularly in North America. Revenue growth consisted of both increases in our base business and an acceleration in momentum from new wins including Hitachi Data Systems, Marks & Spencer, Panasonic System Networks, Hotel.de and Betfair. Asian demand was flat in the period, reflective more of uncertainty following the events in Japan than any structural issue. We continued to operate effectively throughout the Japan crisis. PBTA margin was 18.2%, a margin reduction of 1.7%, due to infrastructure investments and large project start up costs, although profit for the period grew in overall terms. We have made further scale up investment in sales infrastructure in Asia. We also invested in the Nordics, Singapore and Latin America to accelerate new business development and further develop our global network. We committed to office expansion in China and India to drive sales growth and create future operational leverage.
Strategy for Global Information Management
At the core of Global Information Management is delivery of compelling solutions that build brand equity and accelerate speed-to-market for our clients. We are exposed to three primary growth drivers: globalisation of business; exponential growth in digital content; and internet penetration. Global Information Management is about enabling global businesses to provide their customers with the right information, at the right time, in the right language, through the right channel. We believe that our strategic direction and product offering is both compelling and differentiated and we continue to focus on execution, providing our clients with an end-to-end solution set to manage their information delivery and content on a global basis, which is relevant to exploiting the opportunities of the digital age.
Ahead of us we see significant opportunities to further evolve our solutions, investing in technology assets, both through acquisition and targeted R&D spend, that enhance our strategic vision. In Language Technologies we see strong potential to realise the statistical machine translation investment case, lowering barriers to translation and we are firmly orientating towards the cloud with our innovation roadmap. We see large potential to drive full BPO solutions and for further territory expansion in Language Services. We believe
1

10
Financial Trends
07
08
09
10
11
£54.5m
£76.0m
£83.3m
£94.5m
£111.5m
Revenue
07
08
09
10
11
16.0%
15.6%
17.4%
17.3%
16.7%
Operating Margins**before amortisation of intangible assets
07
08
09
10
11
£8.7m
£11.9m
£14.5m
£16.3m
£18.7m
Profit before tax**before amortisation of intangible assets
07
08
09
10
11
£4.1m
£8.4m
£12.7m
£10.8m
£14.3m
Operating Cash Flow
Financial trends are based on performance for the first six months.
11Interim Report and Accounts 2011
Statutory Information
Independant Review Report to SDL plc
We have been engaged by the company to review the condensed set of financial statements in the half-yearly financial report for the six months ended 30 June 2011 which comprises the Interim Condensed Consolidated Income Statement, Interim Condensed Consolidated Statement of Comprehensive Income, Interim Condensed Consolidated Statement of Financial Position, Interim Condensed Consolidated Statement of Changes in Equity, Interim Condensed Consolidated Statement of Cash Flows, and the related explanatory notes. We have read the other information contained in the half-yearly financial report and considered whether it contains any apparent misstatements or material inconsistencies with the information in the condensed set of financial statements.
This report is made solely to the company in accordance with the terms of our engagement to assist the company in meeting the requirements of the Disclosure and Transparency Rules (“the DTR”) of the UK’s Financial Services Authority (“the UK FSA”). Our review has been undertaken so that we might state to the company those matters we are required to state to it in this report and for no other purpose. To the fullest extent permitted by law, we do not accept or assume responsibility to anyone other than the company for our review work, for this report, or for the conclusions we have reached.
Directors’ responsibilities
The half-yearly financial report is the responsibility of, and has been approved by, the directors. The directors are responsible for preparing the half-yearly financial report in accordance with the DTR of the UK FSA.
As disclosed in note 1, the annual financial statements of the group are prepared in accordance with IFRSs as adopted by the EU. The condensed set of financial statements included in this half-yearly financial report has been prepared in accordance with IAS 34 Interim Financial Reporting as adopted by the EU.
Our responsibility
Our responsibility is to express to the company a conclusion on the condensed set of financial statements in the half-yearly financial report based on our review.
Scope of review
We conducted our review in accordance with International Standard on Review Engagements (UK and Ireland) 2410 Review of Interim Financial Information Performed by the Independent Auditor of the Entity issued by the Auditing Practices Board for use in the UK. A review of interim financial information consists of making enquiries, primarily of persons responsible for financial and accounting matters, and applying analytical and other review procedures. A review is substantially less in scope than an audit conducted in accordance with International Standards on Auditing (UK and Ireland) and consequently does not enable us to obtain assurance that we would become aware of all significant matters that might be identified in an audit. Accordingly, we do not express an audit opinion.
Conclusion
Based on our review, nothing has come to our attention that causes us to believe that the condensed set of financial statements in the half-yearly financial report for the six months ended 30 June 2011 is not prepared, in all material respects, in accordance with IAS 34 as adopted by the EU and the DTR of the UK FSA.
P Gresham for and on behalf of KPMG Audit Plc
Chartered Accountants 15 Canada Square London E14 5GL
1 August 2011
22
Financial trends are based on performance for the first six months.
12
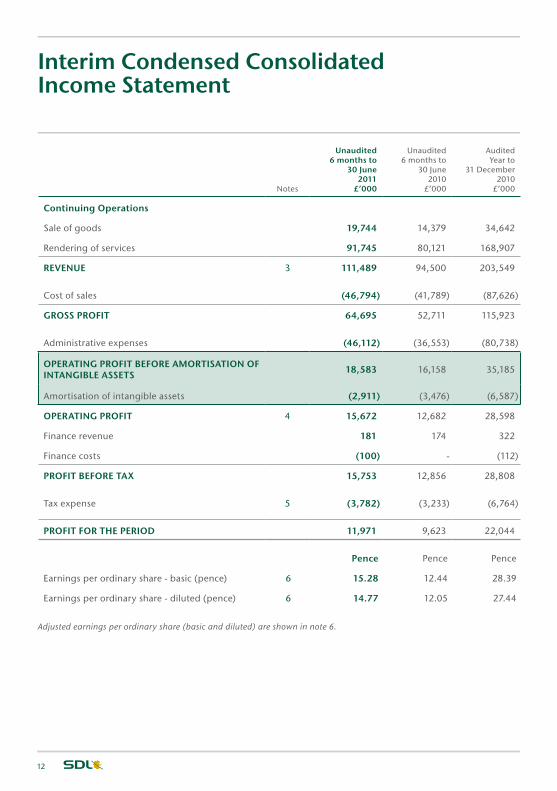
Interim Condensed Consolidated Income Statement
Notes
Unaudited6 months to
30 June 2011
£’000
Unaudited6 months to
30 June 2010
£’000
AuditedYear to
31 December 2010
£’000
Continuing Operations
Sale of goods 19,744 14,379 34,642
Rendering of services 91,745 80,121 168,907
REVENUE 3 111,489 94,500 203,549
Cost of sales (46,794) (41,789) (87,626)
GROSS PROFIT 64,695 52,711 115,923
Administrative expenses (46,112) (36,553) (80,738)
OPERATING PROFIT BEFORE AMORTISATION OF INTANGIBLE ASSETS 18,583 16,158 35,185
Amortisation of intangible assets (2,911) (3,476) (6,587)
OPERATING PROFIT 4 15,672 12,682 28,598
Finance revenue 181 174 322
Finance costs (100) - (112)
PROFIT BEFORE TAX 15,753 12,856 28,808
Tax expense 5 (3,782) (3,233) (6,764)
PROFIT FOR THE PERIOD 11,971 9,623 22,044
Pence Pence Pence
Earnings per ordinary share - basic (pence) 6 15.28 12.44 28.39
Earnings per ordinary share - diluted (pence) 6 14.77 12.05 27.44
Adjusted earnings per ordinary share (basic and diluted) are shown in note 6.

13Interim Report and Accounts 2011
Statutory Information
Unaudited6 months to
30 June 2011
£’000
Unaudited6 months to
30 June 2010
£’000
AuditedYear to
31 December 2010
£’000
Profit for the period 11,971 9,623 22,044
Currency translation differences on foreign operations 4,113 (7,154) (3,191)
Currency translation differences on foreign currency equity loans to foreign subsidiaries (2,321) 2,104 (895)
Income tax (charge)/ benefit on currency transla-tion differences on foreign currency equity loans to foreign subsidiaries
236 (449) 90
Other comprehensive income 2,028 (5,499) (3,996)
Total comprehensive income 13,999 4,124 18,048
All the total comprehensive income is attributable to equity holders of the parent company.
Interim Condensed Consolidated Statement of Comprehensive Income
2

14
Interim Condensed Consolidated Statement of Financial Position
Unaudited6 months to
30 June 2011
£’000
Unaudited6 months to
30 June 2010
£’000
AuditedYear to
31 December 2010
£’000
ASSETS
NON CURRENT ASSETS
Property, plant and equipment 6,790 4,939 6,323
Intangible assets 160,475 132,875 159,305
Deferred income tax 6,755 5,751 6,356
Rent deposits 919 851 903
174,939 144,416 172,887
CURRENT ASSETS
Trade and other receivables 47,127 40,281 51,195
Current tax asset 1,463 898 945
Cash and cash equivalents 53,411 55,482 46,628
102,001 96,661 98,768
TOTAL ASSETS 276,940 241,077 271,655
LIABILITIES
CURRENT LIABILITIES
Trade and other payables (47,917) (43,548) (54,631)
Current tax liabilities (11,199) (8,833) (10,326)
Provisions (945) (1,310) (1,224)
(60,061) (53,691) (66,181)
NON CURRENT LIABILITIES
Other payables (1,311) (33) (622)
Deferred income tax (7,640) (6,553) (8,592)
Provisions (610) (1,320) (748)
(9,561) (7,906) (9,962)
TOTAL LIABILITIES (69,622) (61,597) (76,143)
NET ASSETS 207,318 179,480 195,512
EQUITY
Share capital 788 778 780
Share premium 95,355 94,661 94,974
Retained earnings 84,436 60,833 75,047
Foreign exchange differences 26,739 23,208 24,711
TOTAL EQUITY ATTRIBUTABLE TO EQUITY HOLDERS OF THE PARENT 207,318 179,480 195,512
The Interim Financial Information presented in this Interim Report was approved by the Board of Directors on 1 August 2011.

15Interim Report and Accounts 2011
Statutory Information
Interim Condensed Consolidated Statement of Changes in Equity
Share Capital
£’000
Share Premium
£’000
Shares to be
Issued£’000
Retained Earnings
£’000
Foreign Exchange
Differences£’000
Total£’000
At 31 December 2009 (audited) 770 93,207 203 50,218 28,707 173,105
Profit for the period - - - 9,623 - 9,623
Other comprehensive income - - - - (5,499) (5,499)
Total comprehensive income - - - 9,623 (5,499) 4,124
Deferred taxation on share based payments - - - (245) - (245)
Tax credit for share options - - - 452 - 452
Arising on share issues 8 1,251 - - - 1,259
Arising on acquisition of Passolo - 203 (203) - - -
Share-based payments - - - 785 - 785
At 30 June 2010 (unaudited) 778 94,661 - 60,833 23,208 179,480
Profit for the period - - - 12,421 - 12,421
Other comprehensive income - - - - 1,503 1,503
Total comprehensive income - - - 12,421 1,503 13,924
Deferred taxation on share based payments - - - 587 - 587
Tax credit for share options - - - 105 - 105
Arising on share issues 2 313 - - - 315
Share-based payments - - - 1,101 - 1,101
At 31 December 2010 (audited) 780 94,974 - 75,047 24,711 195,512
Profit for the period - - - 11,971 - 11,971
Other comprehensive income - - - - 2,028 2,028
Total comprehensive income - - - 11,971 2,028 13,999
Deferred taxation on share based payments - - - (334) - (334)
Tax credit for share options - - - 523 - 523
Dividend paid - - - (4,328) - (4,328)
Arising on share issues 8 381 - - - 389
Share-based payments - - - 1,557 - 1,557
At 30 June 2011 (unaudited) 788 95,355 - 84,436 26,739 207,318
2

16
Interim Condensed Consolidated Statement of Cash Flows
Unaudited6 months to
30 June 2011
£’000
Unaudited6 months to
30 June 2010
£’000
AuditedYear to
31 December 2010
£’000
Profit before tax 15,753 12,856 28,808
Depreciation of property, plant and equipment 1,543 1,057 2,561
Amortisation of intangible assets 2,911 3,476 6,587
Finance costs 100 - 112
Finance revenue (181) (174) (322)
Share-based payments 1,557 785 1,886
Loss on disposal of fixed assets 2 82 89
Decrease/(increase) in trade and other receivables 4,053 (794) (9,727)
(Decrease)/increase in trade and other payables and provisions (6,798) (2,680) 3,639
Exchange differences (142) (1,406) (2,053)
CASH GENERATED FROM OPERATIONS 18,798 13,202 31,580
Income tax paid (4,529) (2,439) (4,510)
NET CASH FLOWS GENERATED FROM OPERATING ACTIVITIES 14,269 10,763 27,070
CASH FLOWS FROM INVESTING ACTIVITIES
Payments to acquire property, plant and equipment (2,689) (1,496) (2,568)
Receipts from sale of property, plant and equipment 12 24 85
Payment to acquire subsidiaries (1,325) (1,000) (27,880)
Net cash acquired with subsidiaries - 298 1,958
Interest received 180 174 363
NET CASH FLOWS USED IN INVESTING ACTIVITIES (3,822) (2,000) (28,042)

17Interim Report and Accounts 2011
Statutory Information
Unaudited6 months to
30 June 2011
£’000
Unaudited6 months to
30 June 2010
£’000
AuditedYear to
31 December 2010
£’000
FINANCING ACTIVITIES
Net proceeds from issue of ordinary share capital 389 1,259 1,574
Dividend paid on ordinary shares (4,328) - -
Repayment of capital leases (275) - (157)
Interest paid (100) - (112)
NET CASH FLOWS GENERATED FROM FINANCING ACTIVITIES (4,314) 1,259 1,305
INCREASE/ (DECREASE) IN CASH AND CASH EQUIVALENTS 6,133 10,022 333
MOVEMENT IN CASH AND CASH EQUIVALENTS
Cash and cash equivalents at start of the period 46,628 46,160 46,160
Increase/(decrease) in cash and cash equivalents 6,133 10,022 333
Effect of exchange rates on cash and cash equivalents 650 (700) 135
Net cash and cash equivalents at end of the period 53,411 55,482 46,628
2
18
Notes to the Interim Condensed Consolidated Financial Statements
1. Basis of preparation and accounting policies
Basis of preparation
The annual financial statements of the group are prepared in accordance with International Financial Reporting Standards (IFRSs) as adopted by the EU. The interim condensed consolidated financial statements for the six months ended 30 June 2011 have been prepared on a going concern basis in accordance with IAS 34 Interim Financial Reporting.
As required by the Disclosure and Transparency Rules of the Financial Services Authority, the condensed set of financial statements has been prepared applying the accounting policies and presentation that were applied in the preparation of the company’s published consolidated financial statements for the year ended 31 December 2010.
The preparation of condensed consolidated interim financial statements in conformity with IFRSs requires management to make judgements, estimates and assumptions that affect the application of accounting policies and reported amounts of assets and liabilities, income and expenses. The estimates and associated assumptions are based on historical experience and various other factors that are believed to be reasonable under the circumstances, the results for which form the basis of making the judgements about carrying values of assets and liabilities that are not readily available from other sources. Actual results may differ from these estimates.
The principal risks and uncertainties are consistent with those disclosed in preparation of the Group’s annual financial statements for the year ended 31 December 2010.

19Interim Report and Accounts 2011
Statutory Information
2. Business Combinations
Acquisition of Calamares Holding B.V.
On 3 May 2011 the Group acquired 100% of the share capital of Calamares Holding B.V., an unlisted company based in the Netherlands. The principal activity of the Calamares Holding B.V. group is the provision of media asset management solutions.
The total cost of the combination comprises €2.9 million (£2.6 million) and was funded from the Group’s existing cash resources.
The provisional fair value of the identifiable assets and liabilities of Calamares Holding B.V. group as at the date of acquisition were:
Unaudited Book value
£’000
Unaudited Provisional
fair value to Group
£’000
Intangible assets - 838
Cash and cash equivalents - -
Other payables (13) (13)
Deferred tax liabilities - (214)
Net (liabilities) / assets (13) 611
Provisional Goodwill arising on acquisition 1,968
2,579
All fair values included in the above analysis are provisional fair values which are based upon management’s best estimate at the date of preparation of the financial statements. The fair values are only provisional due to the proximity of the acquisition to the date of the reporting period.
Discharged by:
£’000
Fair value of contingent consideration 1,254
Cash paid to shareholders 1,325
Total cash payable 2,579
Cash outflow on the acquisition
Net cash and cash equivalents acquired with the subsidiary -
Total cash paid (1,325)
Net cash outflow (1,325)
2

20
Notes to the Interim Condensed Consolidated Financial Statements
The maximum contingent consideration is £1.3 million. The fair value has been calculated at £1.3 million and under IFRS 3 (revised) any re-measurement will be recognised in the income statement.
From the date of acquisition Calamares Holding B.V. group has contributed £nil of revenue and a profit of £nil to the net profit after tax of the Group. If the combination had taken place at the beginning of the year, the profit for the Group would have been £11.9 million and revenue from continuing operations would have been £111.6 million. Included in the £2.0 million of goodwill recognised above are certain intangible assets that cannot be individually separated and reliably measured from the acquiree due to their nature. These items include assembled workforce.
Provisional Fair value of Xopus B.V. and Language Weaver Inc.
There have been no changes to the provisional fair value of the identifiable assets and liabilities of Xopus B.V. during the reporting period. The 12 month period for making changes to provisional fair values elapsed in June 2011. There have been no changes to the provisional fair values of the identifiable assets and liabilities of Language Weaver Inc. during the reporting period. The 12 month period for making changes to provisional fair values remains open until July 2011.
3. Segment information
The Group operates in the Global Information Management industry. For management purposes the Group is organised into business units based on their products and services and has three reportable operating segments as follows:
• The Language Services segment is the provision of a translation service to customer’s multilingual content in multiple languages.
• The Language Technologies segment is the sale of enterprise, desktop and statistical machine translation technology developed to help automate and manage multilingual assets together with associated consultancy and other services.
• The Content Management Technologies segment is the sale of content management technologies developed to help automate and manage content to deliver a consistent, interactive and personalised customer experience, in multiple languages, across websites, documentation, multiple media and channels.

21Interim Report and Accounts 2011
Statutory Information
Within the Content Management Technologies segment three operating segments have been aggregated to form the above reportable operating segment. The new acquisition, Calamares Holding B.V., is included within one of these segments.
Management monitors the operating results of its business units separately for the purpose of making decisions about resource allocation and performance assessment prior to charges for tax and amortisation.
Six months ended 30 June 2011 (unaudited)
Language Services
£’000
Language Technologies
£’000
Content Management Technologies
£’000Adjustments*
£’000 Total £’000
External revenue 66,042 19,434 26,013 - 111,489
Internal revenue - - - - -
Total revenue 66,042 19,434 26,013 - 111,489
Depreciation 576 714 253 - 1,543
Segment profit before tax and amortisation 12,002 2,369 4,267 26 18,664
Amortisation 2,911
Profit before tax 15,753
Six months ended 30 June 2010 (unaudited)
Language Services
£’000
Language Technologies
£’000
Content Management Technologies
£’000Adjustments*
£’000Total
£’000
External revenue 58,987 14,567 20,946 - 94,500
Internal revenue - - - - -
Total revenue 58,987 14,567 20,946 - 94,500
Depreciation 572 263 222 - 1,057
Segment profit before tax and amortisation 11,756 1,349 3,429 (202) 16,332
Amortisation 3,476
Profit before tax 12,856
22

22
Notes to the Interim Condensed Consolidated Financial Statements
Twelve months ended 31 December 2010 (audited)
Language Services
£’000
Language Technologies
£’000
Content Management Technologies
£’000Adjustments*
£’000Total
£’000
External revenue 124,646 33,915 44,988 - 203,549
Internal revenue - - - - -
Total revenue 124,646 33,915 44,988 - 203,549
Depreciation 1,351 740 470 - 2,561
Segment profit before tax and amortisation 25,178 3,321 7,655 (759) 35,395
Amortisation 6,587
Profit before tax 28,808
*Deferred compensation relating to acquisitions
Segment assets:
Language Services
£’000
Language Technologies
£’000
Content Management Technologies
£’000Adjustments
£’000Total
£’000
At 30 June 2011 51,760 89,499 74,052 (1)61,629 276,940
At 30 June 2010 51,827 56,621 70,498 (2)62,131 241,077
At 31 December 2010 53,934 87,280 76,512 (3)53,929 271,655
(1)Segment assets do not include cash (£53,411,000), Corporation Tax (£1,463,000) and Deferred Tax (£6,755,000).(2)Segment assets do not include cash (£55,482,000), Corporation Tax (£898,000) and Deferred Tax (£5,751,000).(3)Segment assets do not include cash (£46,628,000), Corporation Tax (£945,000) and Deferred Tax (£6,356,000).
23Interim Report and Accounts 2011
Statutory Information
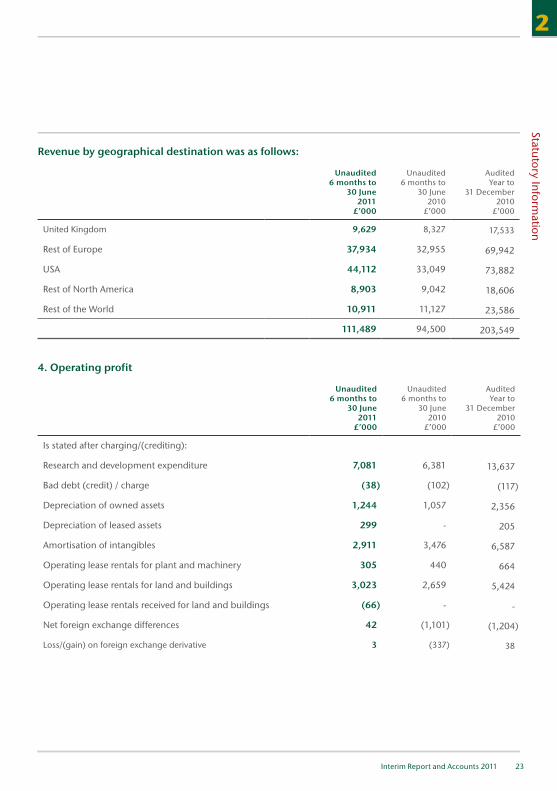
Revenue by geographical destination was as follows:
Unaudited6 months to
30 June 2011
£’000
Unaudited6 months to
30 June 2010
£’000
AuditedYear to
31 December 2010
£’000
United Kingdom 9,629 8,327 17,533
Rest of Europe 37,934 32,955 69,942
USA 44,112 33,049 73,882
Rest of North America 8,903 9,042 18,606
Rest of the World 10,911 11,127 23,586
111,489 94,500 203,549
4. Operating profit
Unaudited6 months to
30 June 2011
£’000
Unaudited6 months to
30 June 2010
£’000
AuditedYear to
31 December 2010
£’000
Is stated after charging/(crediting):
Research and development expenditure 7,081 6,381 13,637
Bad debt (credit) / charge (38) (102) (117)
Depreciation of owned assets 1,244 1,057 2,356
Depreciation of leased assets 299 - 205
Amortisation of intangibles 2,911 3,476 6,587
Operating lease rentals for plant and machinery 305 440 664
Operating lease rentals for land and buildings 3,023 2,659 5,424
Operating lease rentals received for land and buildings (66) - -
Net foreign exchange differences 42 (1,101) (1,204)
Loss/(gain) on foreign exchange derivative 3 (337) 38
22
24
Notes to the Interim Condensed Consolidated Financial Statements
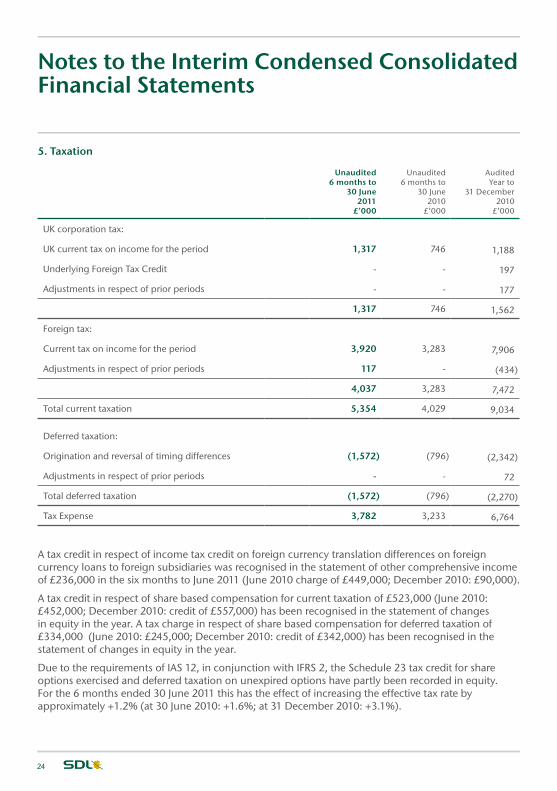
5. Taxation
Unaudited6 months to
30 June 2011
£’000
Unaudited6 months to
30 June 2010
£’000
AuditedYear to
31 December 2010
£’000
UK corporation tax:
UK current tax on income for the period 1,317 746 1,188
Underlying Foreign Tax Credit - - 197
Adjustments in respect of prior periods - - 177
1,317 746 1,562
Foreign tax:
Current tax on income for the period 3,920 3,283 7,906
Adjustments in respect of prior periods 117 - (434)
4,037 3,283 7,472
Total current taxation 5,354 4,029 9,034
Deferred taxation:
Origination and reversal of timing differences (1,572) (796) (2,342)
Adjustments in respect of prior periods - - 72
Total deferred taxation (1,572) (796) (2,270)
Tax Expense 3,782 3,233 6,764
A tax credit in respect of income tax credit on foreign currency translation differences on foreign currency loans to foreign subsidiaries was recognised in the statement of other comprehensive income of £236,000 in the six months to June 2011 (June 2010 charge of £449,000; December 2010: £90,000).
A tax credit in respect of share based compensation for current taxation of £523,000 (June 2010: £452,000; December 2010: credit of £557,000) has been recognised in the statement of changes in equity in the year. A tax charge in respect of share based compensation for deferred taxation of £334,000 (June 2010: £245,000; December 2010: credit of £342,000) has been recognised in the statement of changes in equity in the year.
Due to the requirements of IAS 12, in conjunction with IFRS 2, the Schedule 23 tax credit for share options exercised and deferred taxation on unexpired options have partly been recorded in equity. For the 6 months ended 30 June 2011 this has the effect of increasing the effective tax rate by approximately +1.2% (at 30 June 2010: +1.6%; at 31 December 2010: +3.1%).

25Interim Report and Accounts 2011
Statutory Information
6. Earnings per share
Unaudited6 months to
30 June 2011
£’000
Unaudited6 months to
30 June 2010
£’000
AuditedYear to
31 December 2010
£’000
Profit for the period attributable to equity holders of the parent 11,971 9,623 22,044
m m m
Basic weighted average number of shares (million) 78.3 77.4 77.6
Employee share options and shares to be issued (million) 2.7 2.5 2.7
Diluted weighted average number of shares (million) 81.0 79.9 80.3
Adjusted earnings per share:
Unaudited6 months to
30 June 2011
£’000
Unaudited6 months to
30 June 2010
£’000
AuditedYear to
31 December 2010
£’000
Profit for the period attributable to equity holders of the parent 11,971 9,623 22,044
Amortisation of intangible fixed assets 2,911 3,476 6,587
Less: deferred tax benefit associated with amortisation of intangible fixed assets (771) (973) (1,693)
Adjusted profit for the period attributable to equity holders of the parent 14,111 12,126 26,938
m m m
Basic weighted average number of shares (million) 78.3 77.4 77.6
Diluted weighted average number of shares (million) 81.0 79.9 80.3
Pence Pence Pence
Adjusted earnings per ordinary share – basic (pence) 18.01 15.67 34.70
Adjusted earnings per ordinary share – diluted (pence) 17.41 15.18 33.54
22
26
Notes to the Interim Condensed Consolidated Financial Statements
7. Dividend per share
Dividends paid in the six months ending 30 June 2011 were £4,328,495 (June 2010: £Nil; December 2010: £Nil). The dividend paid amounted to 5.5 pence per ordinary share.
8. Interest-bearing loans
The Group met the cost of acquisition of Calamares B.V. of £1.3 million from existing cash reserves. The undrawn committed borrowing facility is £15.0 million (December 2010: £20.0 million).
9. Share-based payments
On 18 May 2011, 605,475 Long Term Incentive Plan (LTIP) shares were awarded and 189,574 stock options were awarded to certain key senior executives and employees of the SDL Group. The exercise price of the options of 670 pence represents the mid market price on the day before grant.
10. Derivatives and other financial instruments
At 30 June 2011, 30 June 2010 and 31 December 2010 the Group had no derivative financial instruments.
11. General notes
The comparative figures for the financial year ended 31 December 2010 are not the company’s statutory accounts for that financial year. Those accounts have been reported on by the company’s auditor and delivered to the registrar of companies. The report of the auditor was (i) unqualified, (ii) did not include a reference to any matters to which the auditor drew attention by way of emphasis without qualifying their report, and (iii) did not contain a statement under section 498 (2) or (3) of the Companies Act 2006.
12. Events after the statement of financial position date
There are no known events occurring after the statement of financial position date that require disclosure.

27Interim Report and Accounts 2011
Statutory Information
Corporate Information
Company Secretary
Pamela Pickering
Registered Office
Globe HouseClivemont RoadMaidenheadBerkshireSL6 7DYRegistered in England No. 2675207
Registrars
Capita Registrars Singer Capital Markets LimitedNorthern House One Hanover StreetWoodsome Park LondonFenay Bridge W1S 1YZHuddersfieldWest YorkshireHD8 0LA
2

28
Executive Directors
None of the directors have been accused of, or been reported as acting in breach of, professional conduct by any Regulatory or Statutory Authority.
Mark Lancaster, age 49 Executive Chairman (Appointed: 31 January 1992)
Mark Lancaster founded the Group in 1992, he studied electrical engineering and computer architectures at Hatfield University. Mark was a software design engineer at Satchwell Control Systems before joining Lotus Development Corporation and later as international development director with Ashton-Tate. Having identified the need for a high-level and comprehensive service and technology provider for the globalisation of companies content and products, he founded the SDL Group in 1992. He is responsible for the strategic direction and development of the Group.
John Hunter, age 45 Chief Executive Officer(Appointed: 1 September 2008)
John Hunter is a Chartered Management Accountant and joined SDL in September 2008. Prior to this he held a number of senior financial and management positions in Europe, Asia and the US within the ICI Group. Before joining SDL he was Chief Financial Officer of ICI Paints, a leading global decorative business. Since September 2008 John has been Chief Financial Officer of SDL and was promoted effective 1 February 2011 to Chief Executive Officer.
Matthew Knight, age 40 Chief Financial Officer(Appointed: 14 April 2011)
Formerly Chief Financial Officer for Northern & Central Europe at Logica plc, Matthew has held a variety of UK and international roles and has extensive experience of the software and services industry. He holds a BEng in Mechanical Engineering from Imperial College and is a member of the Institute of Chartered Accountants of England and Wales.

29Annual Report and Accounts 2011
Directors and C
orporate G
overnance2
N0n-Executive Directors
John Matthews, age 66 (Appointed: 12 June 2001 – Re-appointed 20 April 2011)
John Matthews, FCA, joined the Board in 2001. He is Senior Independent Director of Diploma plc and Minerva plc and a Non-Executive Director of Aurelian Oil and Gas plc. He has previously been Chairman of Regus Group plc and of Crest Nicholson plc and was a Managing Director of County NatWest and Deputy Chairman/Deputy Chief Executive of Beazer plc.
Jane Thompson, age 51 (Appointed: 16 December 2009 – Re-appointed 23 April 2010)
Jane Thompson is co-founder of Hayfield Group, a market leading Executive coaching business specialising in working with senior executives primarily in FTSE 100 companies. Her coaching work is mainly in the Financial, Media, Telecom, Oil and Retail sectors. Prior to establishing Hayfield Group Ms. Thompson spent more than 15 years in the City, using her fluency in German and French to advise leading European financial institutions on investment strategy and economics
Joe Campbell, age 52 (Appointed: 1 July 2005 – Re-appointed 20 April 2011)
Joe Campbell was CEO of Trados for the year before its acquisition by SDL in July 2005 when he joined the board as a Non-Executive Director. Prior to this he was COO of IManage, a publicly traded company on the NASDAQ and is currently on the Board of Sierra Systems Group Inc, an IT and management consulting services company. He adds a considerable level of expertise in enterprise software sales and brings years of experience of the US financial markets and M&A activity.
Chris Batterham, age 56 (Appointed: 15 October 1999 – Re-appointed 20 April 2011)
Chris Batterham qualified as a Chartered Accountant with Arthur Andersen and has significant experience in the technology based business environment, including the flotation of Unipalm on the London Stock Exchange. Currently working on the boards of a number of companies including The Risk Advisory Group, Office 2 Office plc, Iomart plc and Eckoh plc as Chairman, Chris brings a wealth of experience in the strategic development of companies within the IT sector.
David Clayton, age 54 (Appointed: 16 December 2009 – Re-appointed 23 April 2010)
David Clayton is currently Group Director of Strategy and Corporate Development for SAGE plc. After a career in senior executive roles at a number of international technology companies he joined BZW in 1995 where, after its merger with CSFB in 1997, he was Managing Director and Head of European Technology Research until 2004. He joined the Sage Board in June 2004 as a Non-Executive Director before taking up his current executive role in October 2007.

Your Content Their Language
SDL is the leader in Global Information Management. Global Information Management enables companies to engage with their customers throughout the customer journey – from brand management, to driving revenue, to customer support – and across languages, cultures and channels.
SDL’s best-of-breed Web Content Management, eCommerce, Structured Content and Language Technologies, combined with its Language Services drive down the cost of content creation, management, translation and publishing. SDL solutions increase conversion ratios and customer satisfaction through targeted information across all customer touch points.
Global industry leaders who rely on SDL include ABN-Amro, Bosch, Canon, CNH, FICO, GlaxoSmithKline, Hewlett-Packard, KLM, Microsoft, NetApp, Philips, SAP and Sony. SDL has over 1500 enterprise customers, has deployed over 170,000 software licenses and provides access to on-demand portals for 10 million customers per month. It has a global infrastructure of more than 60 offices in 35 countries. For more information, visit www.sdl.com
Printed on paper comprising
55% recycled content.
Approved and certified by the Forest Stewardship
Council.
Copyright © 2011 SDL plc. All Rights Reserved. All company product or service names referenced herein are properties of their respective owners.
This report is printed on 9 Lives 55 which is made with elemental chlorine-free (ECF) fibre from well managed forests. The FSC logo identifies products which contain wood from well managed forests certified in accordance with the rules of the Forest Stewardship Council. Printed using vegetable-based inks.