your interactive report - lgcstandards-assets.s3-eu-west-1 ... · 2. complete the registration form...
TRANSCRIPT

Page 1 of 28
#
Your interactive report
User Guide Version 1
https://portal.lgcstandards.com

Page 2 of 28
Contents
1. First time users
2. The PT process
3. Logging into PORTAL
4. Your PT calendar
5. Managing users
6. Managing analytes and methodology
7. Submitting your results
8. Your interactive PT report
9. Download your report as a PDF
10. Export data to Excel
11. Monitoring trends
12. Analyst competency
13. Accessing your PT schedule
14. Contact us

Page 3 of 28
First time users
As a first time user you are required to create an account on PORTAL. To do this you will need your Lab
ID number (specific to the scheme you have purchased) plus the email address of the main laboratory
contact registered with us.
These details will be emailed to you when your samples are despatched. You will also find them located
on the list of contents sent with the samples.
To register your account:
1. Go to https://portal.lgcstandards.com and click ‘Create Account’
2. Complete the registration form
Only a single user account can be created using the main laboratory contact details. Once
logged in further accounts can be created for anyone you wish to give access to.

Page 4 of 28
All users receive ‘Administrator’
Choose any username but we recommend using your email address
The password must be a minimum of 8 characters long with 1 uppercase letter, 1 number
and 1 special character (i.e. !#@&)

Page 5 of 28
The PT process
PORTAL sits at the core of the PT process and is your gateway to improving laboratory performance, an
online hub for results submissions, report downloads, data export and trend analysis – anytime,
anywhere.

Page 6 of 28
Logging into PORTAL
With our un-paralleled breadth of PT schemes you may have multiple Lab ID numbers but logging into
PORTAL is simple.
To login to your account:
1. Enter any one of your Lab ID’s
2. Enter your username
3. Enter your password
4. Click ‘Remember Me’ if you want these details to be retained
5. Click ‘Login’

Page 7 of 28
Your PT event calendar
Your PT event calendar is displayed after logging in. It provides you with a overview of PT activity in the
current month and provides quick access to despatch details, such as tracking details for your samples
and sample preparation instructions, as well as simple access to results entry and reports.
To use the calendar:
1. Click an event
Green = Despatch Notification
Red = Result Entry Deadline
Blue = Report Notification
2. Links are now shown to actions relevant to the event.

Page 8 of 28
Managing users
PORTAL provides multi-user, permission controlled access to your PT schemes so you can provide
access to any member of your team.
To create a new user:
1. Click ‘Lab Management’ from the top menu bar
2. Click ‘Manage Users’
If you are unable to see this then your account only has analyst permission and you
should contact your main laboratory contact.
3. Click ‘+ Add User’
4. Complete the add user form
Analyst reference can be up to 4 characters and will be displayed next to this analyst
results in your individual report
The password must be a minimum of 8 characters long with 1 uppercase letter, 1 number
and 1 special character (i.e. !#@&)

Page 9 of 28
5. Click ‘Save Changes’ to add the new user
New users will automatically receive permission to all PT schemes in your lab
Permissions can be customised after the user has been created

Page 10 of 28
Managing users
For any user you can edit details, modify permissions, copy a permission set from one user to another,
or disable a user.
This all controlled from the ‘Manage Users’ tab within ‘Lab Management’

Page 11 of 28
Managing analytes and methodology
Screening and method profiles allow you easily manage the analytes and methods used by your
laboratory. Here you can add/edit/modify screening and method profiles at any time during your
participation. Please note you can also access this information directly from the result entry screen.
To update your screening profile:
1. Click ‘Lab Management’ from the top menu bar
2. Click ‘Manage Analytes’
3. Choose a scheme and sample
4. Tick the analytes you wish to return results for or click ‘Select All’ to automatically tick all analytes
To add a new method profile:
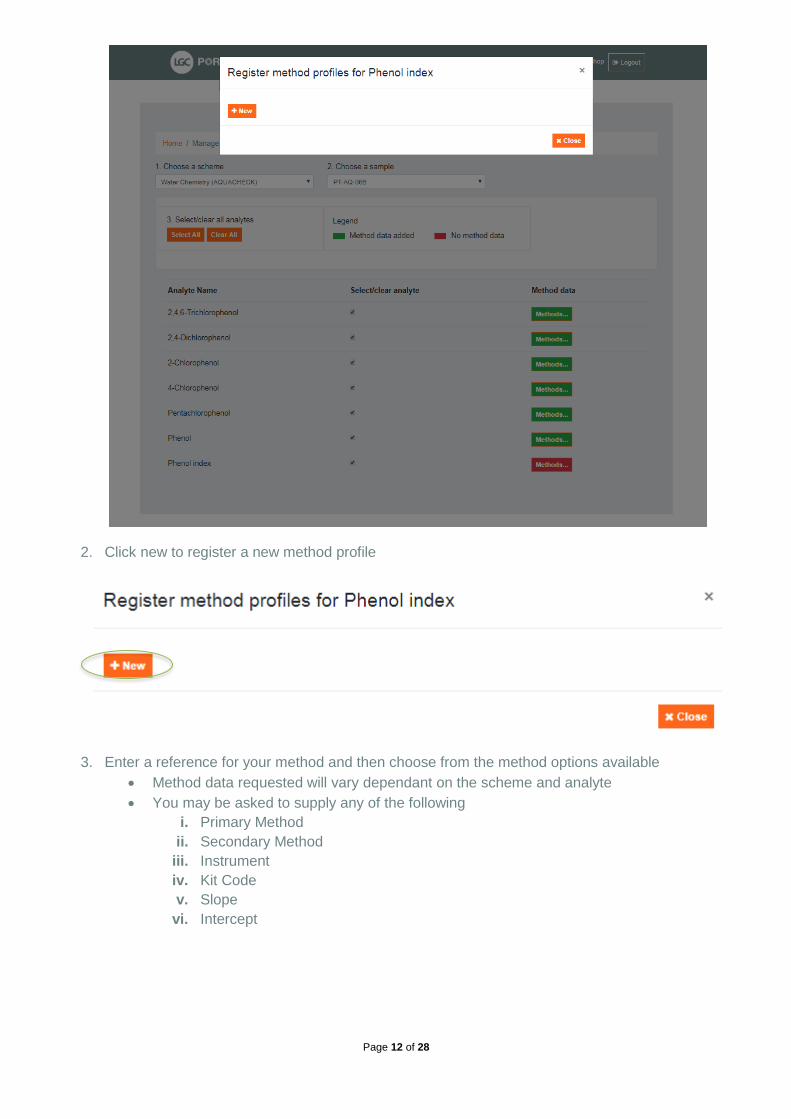
1. Any analytes without a method profile will show a red methods buttons, any with a method profile
will show a green methods button. Click the relevant methods button to add/edit/delete a method
profile
Page 12 of 28
2. Click new to register a new method profile
3. Enter a reference for your method and then choose from the method options available
Method data requested will vary dependant on the scheme and analyte
You may be asked to supply any of the following
i. Primary Method
ii. Secondary Method
iii. Instrument
iv. Kit Code
v. Slope
vi. Intercept

Page 13 of 28
4. If you want this method to be available from a certain round or only available for a certain period
of time you can set a valid from and valid to round. These values are optional and if they are not
set this method profile will always be valid.
5. Once completed click ‘Save’ then ‘Close’. This method will now be present on your result entry
screen.
To edit an existing method profile:
Please note method profiles cannot be updated if results have been submitted during an open round. A
new method profile should be created and then the method profile selected for your result should be
switched to the new method profile.
1. From the manage analytes screen, click the methods button next to the relevant analyte
2. Choose one of your existing method profiles
3. Update the method details as required
4. Click ‘Save’ and ‘Close’

Page 14 of 28
Submitting your results
All of our PT schemes allow multiple results submissions as standard, this provides you with opportunity
to compare results between methods, instruments, analysts or any combination of them.
Typically our schemes allow up to 3 nominated results (1 per method profile) and a further 10 un-
nominated results (with no restriction on method profile). The result you nominate will be used to
generate our assigned value and this should represent the result you would submit for any routine
sample processsed by your laboratory. Un-nominated results will be assessed against the assigned
value and will receive a performance score in your individual report. See the FAQ in the help section of
PORTAL for further details.
You result entry screen will be customised to display a single result field for each analyte \ method you
have created a profile for. You can then easily add additional row as required and these will be retained
for future submissions.
To submit your results:
1. Click ‘Submit Results’ from the top menu bar
2. Click the round that you wish to submit results for

Page 15 of 28
3. Your results entry screen for the entire round will now be load. This is a single page showing all
samples you have ordered, analytes you are screening and method profiles you have registered.
4. If do not see the sample you have ordered listed please contact us
Navigating the result entry screen:
Result entry key points:
Results can be entered at any time during the round
You may modify your results any time during the round
Once results are saved you will receive a result confirmation
If you cannot supply a quantiative value for a quantitative analyte please supply your limit of
quantification (detection) value as <# where # is the limit value
Only analytes with a result present will be validated and saved. If you do not wish to supply a
result you can leave the row blank or remove the analyte from the screen by clicking
‘Add/Remove Analytes’
Analyte, Methods and Unit (where applicable) are mandatory fields when a result is supplied. All
other fields are optional.
Choose a
sample to
quickly
navigate to it
Click to
add/remove
analytes
from the
screen
Enter an analysis date for the sample
and it will cascade to each analyte
Click to print or
save your results
Click to import a default qualitative
result to each analyte then modify
only those that differ
Select an
analyst or
select ‘Lab
Result’
Click to
add or
change a
method
profile
Enter or
select
your
result
Enter your
standard
measurement
uncertainty
profile
Set the
nominated
status
Supply any
comments
you like
Samples with
no analytes
have an
incomplete
screening
profile; click
‘Add/Remove’
analytes to
complete.
Expand or
collapse sample
Click to add an
additional result
for this analyte

Page 16 of 28
Your interactive report
The interactive report is the simplest way to navigate through your PT report, assess your current
performance against your peers and assess the compentency of your laboratory, methods and analysts.
The report starts with a high level summary of your performance in a chosen round, which you can drill
down through for more detailed analysis and quickly navigate to older reports using the interactive data
points on our performance trend charts.
To view your interactive report:
1. Click ‘Reports’ from the top menu bar
2. Choose the round you wish to view by clicking ‘View Report’

Page 17 of 28
3. The report summary is now presented
Click to view details associated with the report
Initial assessment summary for you lab. Hover over each tile to see specific
analytes that are included in the count
Summary of assessments by analyst
Click any tile to view a summary of your
results and associated statistics

Page 18 of 28
4. Click any of the summary tiles to drill into a summarised view of your results, assessment and
associated statistics
5. After drilling into an analyte you will now see the analyte view. Use the collapse \ expand icons to
show or hide the different sections of the report.
Click the analyte name to drill into view further
statistics, all participant results, histograms,
performance trends and methodology summaries
Expand or Collapse samples to simplify your view

Page 19 of 28
Results
submitted by
your
laboratory
Results
submitted
by all
laboratories

Page 20 of 28
All statistics related
to your assessment
of this analyte
Histogram indicating
the spread of data
from all laboratories

Page 21 of 28
Your last 12 round
performance by
round and by
assigned value Click any data point
to view the analyte
view of the report for
that round
Interact with the chart
by pinch and
zooming in to specific
areas or
hiding/showing series

Page 22 of 28
View a complete
summary of all
methodology reported
in the round
Interact with the chart by
zooming into specific areas
or hiding/showing series

Page 23 of 28
Download your report as a PDF
Our reports are available to download in four formats:
Main report
The definitive version of the PT report. This report shows the results from all samples in the
scheme and provides you with access to the entire participant dataset.
Individual report
A concise view of your laboratories results in the round.
Analyte report
A page-per-analyte report for the chosen round. You will find your nominated results, statistics,
histograms and performance trend charts across the last 12 rounds.
Performance trend report
Your last 12 rounds of results displayed graphically in a single report.
To download your reports:
1. Load your interactive report by clicking the ‘Reports’ menu and then choosing the round required.
2. Click ‘Download as PDF’

Page 24 of 28
Export your data to Excel
The data contained within your indiviudal report can be exported to CSV. This can be done for a single
round or a range of rounds.
To export your data
1. Load your interactive report by clicking the ‘Reports’ menu and then choosing the round required.
2. Click ‘Export to Excel
3. Enter a range of rounds that you want to be included in the export
’

Page 25 of 28
Monitoring trends
Use our interactive trend analysis charts to monitor long term performance over the last 6, 12, 18, 24,30
and 36 rounds.
Easily compare the results of each analyst on a single chart and quickly access reports by clicking on
any data point on the chart.
To generate a trend chart:
1. Click ‘Trend Analysis’ from the top menu bar
2. Click ‘Performance trend by time’
Enter the chart
parameters
Choose a specific analyst or all analysts Click to build the trend chart
Save the chart as an
image
Click a data point to load the
respective report
Switch x axis from
Round to Assigned
Value
Generate the chart for
the next analyte in the
sample
Click a series to hide it
from the chart

Page 26 of 28
Analyst competency
Use our interactive trend analysis charts to assess the competency of your analysts. Graphically assess
the % of satisfactory, questionable or unsatisfactory assessments achieved by each analyst over your
entire PT participation or for a specifc analyte and round.
To generate your analyst competency chart:
1. Click ‘Trend Analysis’ from the top menu bar
2. Choose ‘Competency Summary’
Enter the chart parameters
Click to build the trend chart
Click a series to hide it
from the chart

Page 27 of 28
Accessing your PT schedule
Quickly generate a schedule of your PT participation during the year with the ‘My Schedule’ area of
PORTAL.
To generate your PT schedule:
1. Click ‘My Schedule’
2. Pick a scheme and year
Generate a certificate of participation
Export the despatch and
deadline dates to Outlook
Print your schedule

Page 28 of 28
Contact us
If you require any further assistance do not hesitate to contact us:
LGC Standards Proficiency Testing
1 Chamberhall Business Park
Chamberhall Green
Bury
BL9 0AP
United Kingdom
Telephone: +44 (0)161 762 2500
Fax: +44 (0)161 762 2501
Email: [email protected]