``your money or your life!'' the influence of injury and
TRANSCRIPT

HAL Id: halshs-01229469https://halshs.archives-ouvertes.fr/halshs-01229469
Preprint submitted on 16 Nov 2015
HAL is a multi-disciplinary open accessarchive for the deposit and dissemination of sci-entific research documents, whether they are pub-lished or not. The documents may come fromteaching and research institutions in France orabroad, or from public or private research centers.
L’archive ouverte pluridisciplinaire HAL, estdestinée au dépôt et à la diffusion de documentsscientifiques de niveau recherche, publiés ou non,émanant des établissements d’enseignement et derecherche français ou étrangers, des laboratoirespublics ou privés.
“Your Money or Your Life !” The Influence of Injuryand Fine Expectations on Helmet Adoption among
Motorcyclists in DelhiCarole Treibich
To cite this version:Carole Treibich. “Your Money or Your Life !” The Influence of Injury and Fine Expectations onHelmet Adoption among Motorcyclists in Delhi. 2015. �halshs-01229469�

Working Papers / Documents de travail
WP 2015 - Nr 46
«Your Money or Your Life !» The Influence of Injury and Fine Expectations
on Helmet Adoption among Motorcyclists in Delhi
Carole Treibich

“Your money or your life !”
The influence of injury and fine expectations on helmet adoption
among motorcyclists in Delhi
Carole Treibich
Aix-Marseille University (Aix-Marseille School of Economics), CNRS & EHESS
November 16, 2015
Abstract
Road mortality is a growing burden in many developing countries, although many of
these crashes are preventable. Behaviors adopted by road users while traveling is one key
dimension on which governments usually play to reduce road accidents, either by stressing
the potential injuries or by implementing fines if individuals do not adopt safe behaviors.
This paper exploits original data collected among Delhi motorcyclists in 2011. I study the
influence of perceived consequences of helmet non-use on the decision whether to wear or
not such protective device. I also explore the role of previous experiences in the forma-
tion of these beliefs. I find that expected injuries are correlated with helmet use on long
distance trips while expectations of financial sanctions are linked with helmet adoption on
short distance journeys. Women react more than men to a given level of expected medical
expenditures. Furthermore, poorer individuals are more likely to use a helmet for given lev-
els of health costs and traffic fines. Simulations of policies influencing individuals’ subjective
expectations show that an intensification of police threat and information campaigns would
increase helmet adoption among motorcyclists.
Key words: Subjective expectations, Road safety, Risky behaviors, India
JEL Classification: C81, D84, I15, K42, R41
1
1 Introduction
Every five minutes in India someone dies from a road traffic accident (NCRB, 2011). This
phenomenon is expected to escalate to one death every three minutes by 2020. These striking
figures highlight the growing burden road mortality represents in many developing countries. To
counteract this trend, and given the high share of motorcyclists in the traffic mix, an increasing
number of these countries have started to implement mandatory helmet regulations.1 Despite
such laws, and the fact that these fatalities are preventable and that wearing a helmet could
prevent considerable health and financial costs for many households,2 helmet use remains low
in the majority of African and Asian countries. With a better understanding of road users’
individual behavior, the effectiveness of such policies could be improved, yet this topic has been
largely neglected in the economic literature.
To fill this gap, I study the determinants of helmet use in urban India. I exploit a unique
dataset collected in 2011 among Delhi motorcyclists. I look at standard covariates such as so-
ciodemographic characteristics and risk preferences. I pay special attention to beliefs regarding
injuries and fines as individuals may differ in their expectations regarding the protection offered
by a helmet, or the severity of police sanctions for its non-use. More precisely, road users are
uncertain about the probability of being caught by the police for infringing road rules, or, in the
event of an accident, of being injured and suffering financial, physical and psychological loss.
Such subjective expectations are likely to influence the decision on whether or not to wear a
helmet.
I first investigate the impact of subjective expectations of injury and fines on helmet adop-
1Indeed, Liu et al. (2008) highlighted that standardized quality helmets efficiently reduce the risk of mortalityand injuries by 40% and 70% respectively.
2see Mohan (2001) for the case of India.
2
tion. I find that expected health consequences influence behaviors on long journeys, while
anticipated police sanctions impact attitudes towards short distances. Moreover, I also find
some differentiated effects. In particular, expected medical costs impact on women’s decision
to wear a helmet but not on men’s. Furthermore, the influence of expected medical costs and
expected financial penalties varies across income groups. This is consistent with the fact that
health expenditure and traffic fines represent a smaller share of wealthier individuals’ revenues.
Overall, this shows that expectations of fines and injuries have a strong but differentiated im-
pact on helmet adoption. In a second step, I explore the formation of motorcyclists’ beliefs.
I show that road exposure and previous experiences of road-related risks partly explain the
elicited expectations.
Finally, I simulate the impact of different changes in individuals’ subjective expectations
on the percentage of helmet users among motorcyclists. Police threat through enforcement,
information or fine levels should increase helmet use on short distance trips with a combination
of these policies being the most effective. Information campaigns stressing the advantages of
helmet use, in particular for short distance trips, are also likely to make motorcyclists adopt
safer behavior.
This paper contributes to two different strands of literature. On the one hand it adds to the
health-behavioral economic literature. As mentioned previously, very few studies have investi-
gated the determinants of road safety behaviors. One exception is Ritter and Vance (2011) who
looked at the socioeconomic characteristics influencing voluntary helmet use among German
cyclists. The scarcity of behavioral analyses is mainly due to the absence of data on road habit
issues. This paper provides, to my knowledge, the first empirical study on the determinants of
helmet adoption in developing countries. This paper furthermore adds to the literature on sub-
jective expectations of probabilities and outcomes. In recent years, individual decision-making
3
has been the subject of studies in areas such as investment, education, health and entrepreneur-
ship.3 The paper builds on methodologies developed in this literature and provides a first
application to driving behavior. The findings confirm, in the context under investigation, the
key role played by subjective expectations in explaining actual behavior.
The remainder of the paper is organized as follows. In section 2 I discuss the channels linking
previous experiences, subjective expectations and helmet use. I also present the identification
strategies to be implemented in the empirical analysis. Section 3 introduces the data and the
way subjective expectations have been measured. Section 4 reports the empirical findings. The
impacts of different policy measures which either lead to increased expected medical costs or
level of fines are reported in section 5. Section 6 concludes.
2 Mechanisms at play and identification strategy
Here I discuss the possible mechanisms at play and present the subsequent identification strate-
gies which will be used in the empirical analysis.
I first investigate the role of subjective expectations on decision-making related to helmet
use, along with additional variables which may directly impact the adoption of a head pro-
tection device. In a second step, I consider the formation and updating of individuals’ beliefs
regarding the medical expenditure and fines they expect to pay if they do not use a helmet.
In particular, I look at whether personal experiences of road accidents or traffic police arrests
influence motorcyclists’ subjective expectations.
3See for instance, Attanasio (2009); Delavande and Kohler (2009); Dominitz and Manski (1997); McKenzieet al. (2007).
4

2.1 Influence of subjective expectations on helmet adoption
2.1.1 Subjective expectations
I examine here the impact of beliefs regarding injury and fines on helmet adoption.
Subjective expectations are composed of two components: (i) the likelihood that an acci-
dent or a police arrest will occur and (ii) the financial consequences of these events. When
investigating motorcyclists’ decisions, it may be more relevant to consider the product of these
subjective components rather than the two dimensions separately. On the one hand, two mo-
torcyclists who think they will be caught by the police if they do not wear a helmet but who
have different expectations in terms of fines to be paid may not adopt the same conduct. On the
other hand, a motorcyclist who thinks that he has a low probability of being injured but that,
should he be involved in an accident, he will suffer severe injuries, and a person who believes
he has a high probability of suffering an accident but that the subsequent medical expenditure
will be rather small, may have the same attitude toward helmet use. It is therefore key to
look at the combination of the two dimensions. I call this product of variables “unconditional
expected costs” in the empirical analysis. This decision to consider the variables in combination
is also motivated by the fact that no information regarding expected outcomes is available in
the dataset for people who gave a zero probability of the negative event occurring. I set the
unconditional expected costs to zero for those individuals.
2.1.2 Helmet use
In the following paragraph I highlight the heterogeneity of impacts that beliefs may have on
helmet adoption depending on the circumstances of the journey.
Helmet use is a renewed decision, i.e. individuals decide whether or not to use a helmet
before each of their motorbike trips. The characteristics of each journey (its length, the types
5

of roads taken, etc.) are therefore likely to influence the use of head protection. Habits and
routines may also to some extent be relevant to motorcyclists who may always use the helmet
in some circumstances and never in others. Very short trips along quiet streets are commonly
(but mistakenly) assumed to be less dangerous in terms of injuries. Although statistics from
developed countries showed that a large share of accidents occur very close to the victims’
home, road users often only consider the risk of injuries when taking long distance trips on
major roads with a lot of vehicles circulating at a high speed. A reason for this may be the
desire not to take into account all the risks in order to limit the stress generated by the fear of
injuries. Indian motorcyclists may adopt similar reasoning. Furthermore, the probability of an
accident occurring remains low for short distance trips when related to the number of times a
person takes the same route. Given this difficulty in internalizing the ever-present health risks,
it would not be surprising if subjective expectations of injuries either do not impact at all on
safety behaviors or only influenced helmet use on long trips on main roads. Conversely, as traffic
police operate throughout the city, both on main inner city roads and within neighborhoods,
the threat of financial penalties is more likely to impact helmet use on short distance trips.
In our survey, three different circumstances were presented to the respondents: trips (i) in
residential neighborhoods (areas with small food and clothes markets), (ii) on main roads for
short distances and (iii) on main roads for long distances (more than 15 minutes). While the first
situation refers to narrow streets in residential or market areas, the two last cases correspond to
journeys on large boulevards where the traffic is often heavy. The richness of the data collected
will allow me to look at the impact of different types of subjective expectations on specific
journey situations.
2.1.3 Sociodemographic characteristics
I discuss here additional variables which can impact on helmet use decision-making.
6

Preferences related to risk may impact on helmet usage through the adoption of safer conduct
among risk-averse individuals (Grimm and Treibich, 2014). Age is also likely to affect the
individual’s time-related perspective of the amount of time he or she will have to lie with the
consequences of a negative event. In relation to education level, this may capture the person’s
ability to collect and deal with information regarding road risks. Income earners, in particular
heads of households, married people and individuals with children, may also opt for safer conduct
because of their family responsibilities and the additional financial consequences implied by a
temporary or permanent incapacity to work. Moreover, access to health care may also matter,
through the mitigation of negative health consequences. Finally, people who believe that their
life is in the hands of a superior force and that their date of death is already written may decide
not to use a helmet despite high subjective expectations of injuries. All these variables are thus
included in the specifications.
2.1.4 Identification strategy
I now turn to the identification strategy to be implemented in the empirical analysis to study
the influence of subjective expectations on helmet adoption.
When studying the relationship between beliefs and behaviors, one may argue that local
specificities may be correlated with an individual’s subjective expectations and eventually bias
the estimates. While some variables, such as the quality of roads, the incidence of road ac-
cidents or police presence, may impact on helmet use only through their effect on subjective
expectations, other variables may have a direct effect on helmet use. For instance, the presence
of private emergency services in the area is likely to be associated with the expected medical
costs but may also partly influence the consequences of an accident, impacting directly helmet
use. As for neighbors’ attitudes, which reflect social norms, they are likely to be correlated with
a motorcyclist’s behavior regardless of his subjective expectations and may also modify the
7
perceived consequences of helmet use. Therefore, living, for instance, in a neighborhood where
no-one uses a helmet may simultaneously lower the level of helmet adoption by motorcyclists in
the area and their subjective expectations of being caught by the police. This would lead to an
underestimation of the true relationship between subjective expectations and helmet adoption.
Conversely, the presence of private health centers may increase the medical expenditure individ-
uals expect to incur in the event of a road injury but also decrease the level of helmet adoption
as individuals may expect to receive particularly high quality care. This in turn would lead to
an overestimation of the true coefficient. In other words, some unobservable characteristics at
the geographical level are likely to be correlated with the independent regressors of interest and
have a direct effect on the behaviors I attempt to explain. However, the direction of this bias
is ambiguous.
In order to capture these potential local effects, I take advantage of the geographical divi-
sion of New Delhi into 47 police zones or circles. Each zone has its own policing budget and
man-power. 32 of these “circles” are represented in our survey.
I therefore estimate the following specification:
Helmet useit = βm ·UECmedi + βf ·UECfine
i +∑j
γj ·Xij + µc + εict (1)
Where i refers to the individual and t to the type of trip. Helmet useit is a binary variable
which equals one if the person wears a helmet and zero if not. UECmedi and UECfine
i are the
unconditional expected medical costs and the unconditional expected fines respectively. X is
a set of sociodemographic characteristics. Finally, µc corresponds to the respondent’s circle of
residence.
8
I run fixed effect linear probability estimations and obtain the effect of the variations in
subjective expectations on helmet use within each police zone. I cluster all standard errors at
that level to control for potential auto-correlation in the error terms. The variables of interest are
the unconditional expected costs. I include several individual characteristics which are likely
to be correlated with both subjective expectations (through the likelihood that the person
has already experienced a road accident or a police arrest) and helmet adoption (through the
expected costs and gains of helmet use); and which thus may bias the estimates. More precisely,
I introduce gender, age, education level, marital status, number of children, monthly household
income, personal contribution to the family revenues, religious beliefs, preferences toward risk
and health insurance. Introducing police zone fixed effects in the estimations allows me to
capture the previously mentioned specificities of each area along with the behaviors adopted by
respondents’ neighbors and the socioeconomic status of each residential locality. However, as
Manski (1993) pointed out, these various effects are difficult to disentangle. Indeed, people with
similar tastes and characteristics may select themselves into the same circles. Therefore, the
absence of a significant impact of some of the explanatory variables might in fact be due to their
rather limited variation within a circle. Yet, while circle effects pick up part of the differences in
the level of actual risks faced by individuals in different neighborhoods, they do not annihilate
them completely. This is because, for instance, of different traveling hours, different routes
taken or the different driving skills of motorcyclists living in the same police zone.
2.2 Influence of previous experiences on subjective expectations
I now focus on the role of previous experiences on the formation of motorcyclists’ beliefs.
9

2.2.1 The role of previous experiences
Below, I discuss the channels through which past experiences are likely to influence individual
subjective expectations.
From every motorbike trip individuals obtain new information with respect to the health
and financial risks they face from not using a helmet. This new information may, as defined
by Haselhuhn et al. (2012), come from a traffic accident they witness (information via observa-
tion) or from being involved in a road crash themselves (information via personal experience).
Motorcyclists are also likely to modify their beliefs after hearing the story of someone who has
suffered from road injuries (information via description). Being involved in an accident and
getting injured or being caught by the police while not wearing a helmet certainly increase the
subjective expectations that such events occur. Nonetheless, the effect of personal experiences
on expected medical costs and expected fines are more ambiguous. As a matter of fact, whether
personal experience increases or decreases expected outcomes depends on (i) the individual’s
prior belief and (ii) the severity of the loss the person faces. In other words, if a person who
expected to face tremendous medical expenditure in the event of a road accident is involved in
a minor accident, he will certainly correct his expectations downwards. If, on the other hand,
the motorcyclist thought that he would not sustain any injury, he will be more likely to modify
his beliefs upwards. Furthermore, a person is prone to decrease or increase his perception of the
expected fine to be paid in the event of being stopped by the police based on whether he was
respectively able or not to corrupt the police officer. Finally, a same road experience may have
different lasting effects depending on the frequency with which the victim uses the motorbike
after the event. In the empirical analysis I look separately at subjective probabilities of injuries
and fines and at the subsequent financial consequences. In order to study the potential dif-
ferentiated effects mentioned above, I introduce in the specifications interaction terms between
10

personal experiences and road habits or religious beliefs.
2.2.2 Other possible determinants
One may think of many other variables which may play a role in the formation of individuals’
expectations.
Older people have had more time to experience road accidents or police arrest. Women, given
their low participation in the labor market, have a much lower level of exposure to motorbike
risks. Despite the influence of such sociodemographic characteristics, I focus, in the empirical
analysis, on previous experiences. I only include the frequency and the purpose of motorbike
use in the specifications to control, at least partly, for the probability that the motorcyclist
experienced either a road accident or a police arrest. Religious practices are also introduced in
the analysis as they may actually alter individuals’ beliefs.
2.2.3 Identification strategy
Below I present the identification strategy to be implemented in the empirical analysis.
As previously mentioned, road hazards and police enforcement intensity are likely to vary
across neighborhoods and influence subjective expectations. If in a given area police officers
are more present, individuals living in that neighborhood are likely to report higher levels of
subjective probabilities of being stopped by the police. Similarly, in an accident-prone area,
individuals are more likely to report higher levels of subjective probabilities of being involved
in an accident. These characteristics may thus bias the estimates if not tackled adequately.
Given these local effects, I again take advantage of the administrative organization of Delhi
and estimate the following specification:
11

Expectationitk = β · Experienceit +∑j
γj ·Xij + µc + εitck (2)
I consider separately three different outcomes, refered to as “Expectation” in the above
equation: the subjective probabilities, the expected costs and the variance regarding these costs
which is captured by the inter-quartile range. k thus takes three different values and refers to
these three different types of expectations. The variables of interest are previous experiences,
labeled “Experience” and differ depending on the type of subjective expectations, t, considered
(injury or fine). Both personal and relatives’ experiences of road accidents are introduced as
dummy variables in the analysis when considering expected injuries. The perceived discretionary
power of the police and one’s bargaining power are included when studying expected fines. X is
composed of religious and motorbike use variables. The latter are introduced to capture possible
differences in road risks and traveling experiences. Finally, µc corresponds to the respondent’s
circle of residence.
It is important to note that the cross-section data at hand allows me only to identify whether
individuals who have experienced a traffic accident or who have been sanctioned by the traffic
police report significantly different beliefs regarding injuries and fines.
3 Data
In this section, I introduce the data and the survey methods to measure subjective expectations.
Some descriptive statistics are also displayed.
3.1 Road safety survey
My colleagues and I implemented an household survey in Delhi in 2011 targeting motorcyclists.
Up to three drivers or passengers per household were allowed to answer the survey. In the end,
12

902 motorbike users were interviewed. A part from sociodemographic characteristics, we also
gathered data on risk aversion, perceptions of road rule enforcement and road risks, along with
helmet use, and previous involvement in road traffic accidents or traffic police arrests. Finally,
we attempted to elicit the subjective expectations of medical expenditure and fines, based on
the methodologies developed in the literature and described in more detail below.
3.2 General characteristics
The motorcyclists interviewed in this survey have the following socioeconomic characteristics.
Our respondents are on average 36 years old, two thirds of them are men and 70% pray
daily. Men represent 97% of the drivers and only represent 25% of the passengers. Regarding
road safety efforts, while men use full face helmets, women more often opt for a half helmet.
Motorcyclists were asked about their helmet use in three different circumstances. On average,
motorbike users are more likely to declare wearing a helmet for long trips (81%) than for short
trips on main roads (61%) or trips in residential neighborhoods (54%). Furthermore, significant
differences in helmet use are observed between men and women, drivers and passengers, and
frequent and occasional users of this mode of transportation. Drivers without passengers travel
at a higher speed on average. More than 60% of the passengers declare that they traveled
with three or more people on the same motorbike. 46% of the respondents declare frequently
traveling on a motorbike, 64% use it mainly to commute to work. Finally, 7% of the interviewed
motorcyclists had already been involved in a road accident, about the same percentage that had
been sanctioned by the traffic police for not wearing a helmet.
3.3 Subjective expectations of medical expenditure and fines
In the section below I explain in detail the assessment of subjective expectations.
13

3.3.1 Probability of injury and subsequent medical expenditure
Starting with potential injuries, two situations were presented to the interviewees.
First, they were asked to think of how they usually travel on their motorbike (“in general”).
Second, they were asked to think of a situation in which they would not use the helmet (“if no
helmet”). In each case, respondents were asked to establish the likelihood that they would be
involved in an accident and injured using an 11 point response scale ranging from 0 “this event
will never happen” to 10 “this event will surely happen”. Answers were divided by ten in order
to obtain values between 0 and 1 which can be related to probabilities.
Table 1 provides the distribution of subjective probabilities of injury in the two situations
of interest. Notably, the “if no helmet” variable is on average higher and has fatter tails than
the “in general” probability. Graph 1a illustrates the distribution of subjective probability
of being hurt if not wearing a helmet. This subjective probability varies substantially among
respondents; even for individuals of similar gender, education, and religion or those presenting
the same level of risk aversion (results not shown in Figure 1a).
Table 1: Distribution of subjective probabilities of injuries and police arrest
percentile25th 50th 75th mean std. dev. observations
Probability of injuryin general 0.2 0.4 0.5 0.37 0.25 841if no helmet 0.4 0.5 0.9 0.58 0.31 836
Probability of arrestin general 0.2 0.4 0.5 0.39 0.29 840if no helmet 0.4 0.7 1 0.65 0.34 878for no reason 0.1 0.3 0.5 0.36 0.30 845
14

a. Subjective probabilities if non use of helmet
b. Subsequent expected outcomes
Figure 1: Heterogeneity in beliefs
Box plot legend:
◦upper adjacent value
75th percentile
median
25th percentile
lower adjacent value
◦ outside values◦ 15

If the individual answered that the probability of being hurt while not using a helmet was
greater than zero, the interviewer proceeded with questions regarding the subsequent medical
expenditure. More precisely, respondents were asked what was the percent chance that the
medical expenditure would be less than a series of fixed amounts increasing from 500 INR up
to 200,000 INR. The enumerator kept proposing higher amounts till the respondent answered
100% (see Attanasio, 2009; Delavande et al., 2011, for reviews of this method).
Based on the elicited cumulative distribution function, the expected costs for each respon-
dent were built using the following methodology. pik denotes the percent chance that the cost
will be less than the amount Ck for individual i. The motorcyclist’s expected cost Ei(C) is then
equal to :
Ei(C) =
n∑k=1
(pik − pik−1) ·(Ck + Ck−1
2
)
withCk + Ck−1
2the central value of each interval and pik − pik−1 the percent chance asso-
ciated with each interval. Initial values C0 and pi0 are equal to zero.4
The average expected medical cost is 5,189 INR (94 EUR in 2011).5 We observe a lot of
heterogeneity across motorcyclists, the standard deviation being equal to 9,012 INR (see Table
2). Based on provided answers, the 25th and the 75th percentiles were derived through linear
extrapolation. When a respondent gave a higher percentage than 25% or 75% for the first
proposed amount, the lowest level of medical expenditure (500 INR) was imputed to the related
4When using different computations of the first central value (either by applying an exponential function ora power function instead of a linear one or fixing a strictly positive minimum amount of medical costs), theexpected cost is barely modified – between 0.27% and 1.36% of change.
5I cannot compare this figure with actual medical expenses faced by road victims due to unavailability ofhospital data.
16

percentile.6 Inter-quartile range (75th percentile - 25th percentile) captures the variation in the
potential financial costs individuals have in mind. The extent of potential medical expenditure
appears to vary a lot across respondents. Some individuals may consider both minor and
extremely severe injuries when answering the outcome question, while others may have a clear
opinion of what type of injuries they would face. We note that expectation and variance
parameters of medical expenditure are significantly correlated with the type of injuries a person
thinks he would suffer from if he was not wearing a helmet at the time of the crash. More
precisely, they are positively related to head trauma and negatively correlated with injuries to
limbs.
Table 2: Summary statistics of expected medical expenditure and fines
observations mean std. dev. median minimum maximum
Expected costs (in INR)medical expenditure 772 5,189 9,012 1,688 250 64,003fines 760 129 103 105 25 783
Inter-quartile range (in INR)medical expenditure 772 6,718 15,039 1,500 0 94,000fines 760 112 109 88 0 500
3.3.2 Probability of police arrest and subsequent fines
I now turn to the elicitation of subjective expectations regarding traffic offenses.
The mandatory helmet law aims at providing incentives for helmet use through financial
penalties. Such sanctions are likely to modify motorcyclists’ behavior only if they are credible
and sizable enough. To capture the actual beliefs of motorcyclists regarding helmet legislation,
respondents were asked about their subjective probabilities of being stopped by the police in
the next month in three different situations. In addition to the “in general” and “if no helmet”
cases, individuals were asked about the likelihood that they would be stopped by the police for
6The minimum of 500 INR has been imputed to the 25th percentile for 236 individuals and to the 75th
percentile for 97 of them.
17

no reason (situation labeled “for no reason” in the following sections). It seemed important to
set this third case given that unfair and random police sanctions may have an unproductive
and potentially adverse effect on safety decisions. From Table 1, it appears that the mean of
the perceived probability of being stopped by the police in the “if no helmet” situation is much
higher than “in general” or “for no reason” (0.65 vs. 0.36-0.39). The variance is also slightly
higher.
As with the expected medical expenditure in the event of injury, when the respondent said
that there was a positive probability of being stopped by the police when not wearing a helmet,
his expectations regarding the fine he would have to pay were elicited by the interviewer. More
precisely, interviewees were asked what was the percent chance the financial penalties would
be less than a series of fixed amounts increasing from 50 INR up to 1,000 INR: the official
fine for infringing the helmet law was 100 INR at the time of the survey. Following the same
methodology as used to derive the expected medical expenditure, expected fines were computed
for each individual. The individual’s lack of information regarding the level of financial penalties
was also derived by computing the inter-quartile range.7 On average, motorcyclists slightly
overestimate the financial sanctions with the observed mean of expected fines across respondents
in the sample being 129 INR (see Table 2).
Nonetheless, the variation in answers is quite important and half of the respondents have
expectations which do not exceed the official fine. The dispersion parameter also indicates
that the level of the official fine is rather unclear for many individuals given that on average
interviewees gave an inter-quartile range which was higher than the official fine (112 INR).
7In this case, the minimum of 50 INR was imputed to the 25th percentile for 330 individuals and to the 75th
percentile for 78 of them.
18

4 Results
In this section, I first present the results related to the influence of subjective expectations on
the decision of whether or not to wear a helmet. In a second step, I report the findings regarding
the impact of previous experiences on individuals’ beliefs.
4.1 Influence of subjective expectations on helmet adoption
In order to investigate the influence of injury and fine expectations on helmet adoption, I will
first study the impact of unconditional expected costs and report the effect of the other sociode-
mographic characteristics. I will then decompose the unconditional expected costs in order to
see whether one of the components plays a greater role in the decision to use a helmet. Finally,
before turning to the role of previous experiences in the formation of subjective expectations, I
will examine the direct effect of these past events on helmet use.
4.1.1 Studying the impact of unconditional expected costs
In this part I look at the influence of unconditional expected costs regarding injuries and fines
on motorcyclists’ decision to use a helmet (cf. equation 1).
Table 3 presents the results obtained from the fixed effect linear probability specifications
for the three types of trips considered.8 Police threat and fear of injuries appear to impact on
helmet use in different ways depending on the journey context. Indeed, it seems that subjective
expectations with respect to fines increases helmet use on short distance trips. Conversely,
higher expected medical expenditure leads to greater helmet adoption on long distance trips
only. More precisely, a raise of 1,000 INR in the unconditional expected medical costs increases
by 0.5 percentage points the probability that the person will wear a helmet on long trips on
8From the Hausman test results, it seems that the fixed effect specification should always be preferred to theordinary least square estimation. When looking at helmet use on short distance trips on main roads, the randomeffect specification appears to provide more efficient estimates. As these results are very similar to the fixed effectones, I decided to present only the fixed effect coefficients to avoid any confusion when reading the Table.
19

main roads. An increase of 100 INR in the unconditional expected fines increases by respectively
7.7 and 4.9 percentage points the probability of using a helmet for short trips on main roads
and trips in residential neighborhoods. One issue with linear probability estimations is that
predicted value may be out of the probability range. This is actually the case for only 40 (6%),
13 (2%) and 11 (1.7%) observations regarding respectively helmet use on long distance trips on
main roads, short distance trips and trips in residential areas.
Table 3: Influence of expectations on helmet use - using unconditional expected costs (UEC)
Helmet use on main roads trips in thelong trips short trips neighborhood
(1) (2) (3)
UEC medical expenditure (th. INR) 0.005+ -0.000 0.001(0.003) (0.004) (0.004)
UEC fines (hund. INR) 0.011 0.077??? 0.049??
(0.018) (0.018) (0.023)
R2 0.296 0.261 0.243Observations 670 673 665
Hausman test (p-value)OLS vs. FE 0.000 0.000 0.000FE vs. RE 0.000 1.000 0.000
Predicted values1st percentile 0.248 0.047 -0.00299th percentile 1.071 1.024 0.094
Notes: ??? 1%, ?? 5%, ? 10% and + 15% significance.
Fixed effect linear probability estimations with clustered standard errors reported
in parentheses. UEC medical expenditure is the product of the probability of being
injured if no helmet and the subsequent medical costs. UEC fines is the product of
the probability of being caught by the police if no helmet and the subsequent fine.
Controls are marital status, # of children, head of household, gender, age, income,
education level, contribution to income, Sikh, caste, risk aversion, health insurance
and a belief in the existence of a superior force.
4.1.2 Looking at the effect of sociodemographic characteristics
Alongside the impact of the main variables of interest presented in the previous subsection,
some sociodemographic characteristics are also related to the adoption of a head device. I
report below the main findings (results not reported in Table 3).
20
Men are significantly more likely to use a helmet than women, while Sikhs are significantly
less likely than motorcyclists belonging to other religious communities to use such a protective
device. More precisely, when considering long distance trips, the probability of using a helmet
increases by 41 percentage points if the motorcyclist is a man and decreases by 27 percentage
points if he or she is a Sikh. These findings are consistent with the fact that Sikhs successfully
lobbied against the use of helmets on the grounds that it goes against their religious beliefs.
They managed to persuade the Delhi government to exempt them from the obligation to wear
a helmet. De facto, the helmet law has not been enforced on women due to the difficulty of
distinguishing a Sikh from a Hindu or a Muslim.9 Having health insurance has a significant and
negative impact on helmet use only for long distance trips when not controlling for the circle
of residence. The absence of an effect of access to health care on helmet use may actually be
explained by the inefficiency of ambulance services. According to Hsiao et al. (2013), 58% of all
road traffic injury deaths in India occur at the scene of the collision, either immediately or while
waiting for the emergency ambulance to arrive. No effect of income or level of education are
detected. Finally, preferences toward risk do not appear to significantly influence motorcyclists’
behavior.
Some individual sociodemographic characteristics are likely to modify the influence of sub-
jective expectations on helmet adoption. In particular, women may be more sensitive to health
issues and react more strongly to a given level of expected medical costs. When absolute
amounts of medical expenditure and fines have been elicited, poorer individuals may be more
responsive to a given level of costs as these represent a bigger share of their income. Finally,
more risk-averse individuals may adopt safer behaviors than less risk-averse motorcyclists to
9This softness in the implementation of mandatory helmet law came to an end in September 2014. Trafficpolice began to prosecute women riding two-wheelers without a helmet, Sikh women being exempted only if theywere able to prove their identity (source: The Times of India, September 11, 2014).
21

avoid the same amount of costs. In order to study such differentiated effects, I interact the
unconditional expected costs with gender, level of income and preferences toward risk. Results
are reported in Table 4. Interestingly, when including these interaction terms, I find that the
probability of wearing a helmet on long distance trips increases by 2.3 percentage points if the
level of unconditional expected medical costs raises by 1,000 INR. The net effect of injury ex-
pectations almost vanishes among men. Similarly, for the same level of subjective medical costs
women are more likely to use a helmet on short trips on main roads. An income gradient is found
when introducing interaction terms between subjective expectations and levels of income. More
precisely, poor and middle income individuals are less likely to wear a helmet than individuals
belonging to a wealthier household. Moreover, an increase of 1,000 INR in the unconditional
expected medical costs increases the probability of wearing a helmet for short distance trips on
main roads by 1.6 percentage points more among the poorest individuals (31% of the sample)
compared to individuals who belong to the wealthiest families (17% of the sample). Similarly,
a given level of unconditional expected fines induces a significant difference in the use of head
protection between middle income individuals and wealthier individuals. Finally, the impact
of unconditional expected fines on helmet use for short trips on main roads decreases with the
motorcyclists’ level of risk aversion. While one might expect risk preferences and beliefs to
reinforce one another, this finding may be explained by the fact that preferences toward risk
already partly influence the behavior of more risk-averse motorcyclists, or by the fact that ex-
tremely risk-averse individuals with high expected medical costs simply do not use this mode
of transport and are de facto excluded from our survey.
22

Table 4: Differentiated influence of expectations on helmet use by gender, income, risk aversion
Helmet use on main roads trips in thelong trips short trips neighborhood
(1) (2) (3) (4) (5) (6)
UEC medical expenditure (th. INR) 0.005+ 0.023? -0.000 0.002 0.001 0.014(0.003) (0.013) (0.004) (0.012) (0.004) (0.015)
UEC fines (hund. INR) 0.011 -0.005 0.077??? 0.180??? 0.049?? 0.003(0.018) (0.074) (0.018) (0.062) (0.023) (0.066)
Male 0.409??? 0.430??? 0.414??? 0.480??? 0.390??? 0.393???
(0.052) (0.059) (0.061) (0.059) (0.070) (0.062)Male × UEC medical expenditure -0.019? -0.019?? -0.014
(0.009) (0.009) (0.011)Male × UEC fine 0.024 -0.008 0.030
(0.046) (0.039) (0.033)
Household monthly income, ref: Rich (above 20,000 INR)Poor (less than 10,000 INR) -0.013 -0.066 -0.095+ -0.180?? -0.092 -0.165?
(0.042) (0.062) (0.064) (0.071) (0.078) (0.091)Middle (between 10,000 and 20,000 INR) -0.019 -0.044 -0.097?? -0.090? -0.062 -0.162???
(0.038) (0.046) (0.040) (0.053) (0.049) (0.057)Poor × UEC medical expenditure 0.001 0.016?? 0.012
(0.007) (0.008) (0.012)Middle × UEC medical expenditure 0.002 0.002 0.012
(0.007) (0.007) (0.009)Poor × UEC fines 0.044 0.038 0.043
(0.031) (0.029) (0.043)Middle × UEC fines 0.016 -0.008 0.076???
(0.032) (0.030) (0.026)
Risk aversion (average, 8 points) -0.009 -0.009 0.002 0.020 0.001 0.005(0.015) (0.022) (0.013) (0.019) (0.014) (0.018)
Risk aversion × UEC medical expenditure -0.000 0.001 -0.002(0.001) (0.002) (0.003)
Risk aversion × UEC fine -0.003 -0.021?? -0.003(0.012) (0.010) (0.012)
R2 0.296 0.317 0.261 0.287 0.243 0.255Observations 670 670 673 673 665 665
Notes: ??? 1%, ?? 5%, ? 10% and + 15% significance.
Fixed effect linear probability estimations with clustered standard errors reported in parentheses.
Controls are marital status, # of children, head of household, age, education level, contribution to income, Sikh,
caste, health insurance and a belief in the existence of a superior force.
23

4.1.3 Decomposing the unconditional expected costs
Below I consider the effect of subjective probabilities and the consequences on helmet adoption
separately.
In the previous analysis, the variables of interest were the products of the subjective proba-
bilities of being hurt or being stopped by the police when not using a helmet and their respective
subsequent expected costs. This choice was partly driven by the fact that individuals who think
that injury or police arrest will never occur were not questioned about the possible finan-
cial consequences of these events. This effectively excluded 104 individuals from the sample.
Nonetheless, for the sub-sample of respondents who provided a positive probability of injury
and fine, I am able to investigate the respective roles of subjective probabilities and subsequent
outcomes on helmet adoption. Furthermore, one may argue that the variety of potential finan-
cial consequences is also a dimension which motivates the conduct adopted by motorcyclists.
Therefore, I also include the inter-quartile range in the specification in order to study the in-
fluence of variance and lack of information regarding possible losses on an individual’s risky
behaviors.
Table 5 presents these findings. When comparing the coefficients of unconditional expected
costs obtained with the full sample (Table 3) and with the restricted one (see Table 5 – columns
1, 4 and 7), we see that stronger effects are obtained with the latter sample both in terms of
significance of the coefficient (for long distance trips) and in terms of its magnitude (for short
distance trips). When looking at the respective effect of “frequency” (subjective probabilities)
and “severity” (expected costs) dimensions (columns 2, 5 and 8), we note that expected costs
actually drive the relationships previously detected between subjective expectations of injury
and fines and helmet use on different types of trips. Finally, when introducing the dispersion
dimension in the regression (columns 3, 6 and 9), I find that an increase of 1,000 INR in the
24
expected medical expenditure increases by 1.5 percentage points the probability of wearing a
helmet on long distance journeys. Conversely, a similar increase in the variance regarding such
costs decreases by 0.7 percentage points the probability that the motorcyclist will adopt a safe
behavior. A similar relationship between subjective medical costs and helmet use are found with
short distance trips on main roads. Regarding expected fines, for both short distance trips on
main roads and trips in residential neighborhoods, the lack of information regarding the level of
fine drives the individual’s behavior. More precisely, an increase in 100 INR of the dispersion in
the fine boosts the probability of using a helmet by around 6 percentage points. The coefficient
of expected financial cost is no longer significant.
Table 5: Influence of expectations on helmet use - non zero probability sample
Helmet use on main roads trips in thelong trips short trips neighborhood
(1) (2) (3) (4) (5) (6) (7) (8) (9)
UEC medical expenditure (th. INR) 0.005? 0.000 0.002(0.003) (0.003) (0.004)
UEC fines (hund. INR) 0.001 0.085??? 0.059??
(0.021) (0.016) (0.026)Subjective probability of injury 0.077 0.085 -0.164 -0.158 0.064 0.051
(0.062) (0.065) (0.142) (0.141) (0.120) (0.116)Expected medical costs (th. INR) 0.003? 0.015?? 0.002 0.017?? -0.000 -0.012
(0.002) (0.007) (0.003) (0.007) (0.003) (0.008)IQR of medical costs (th. INR) -0.007? -0.008?? 0.007
(0.004) (0.004) (0.004)Subjective probability of arrest -0.001 -0.003 0.163 0.163 -0.004 -0.003
(0.052) (0.050) (0.103) (0.102) (0.071) (0.073)Expected fine (hund. INR) -0.013 -0.020 0.065??? 0.013 0.075??? 0.028
(0.023) (0.033) (0.014) (0.030) (0.022) (0.034)IQR of fine (hund. INR) 0.008 0.061?? 0.056??
(0.026) (0.026) (0.024)
R2 0.262 0.264 0.269 0.244 0.253 0.265 0.223 0.231 0.239Observations 589 589 589 591 591 591 583 583 583
Notes: ??? 1%, ?? 5% and ? 10% significance. Fixed effect linear probability estimations with clustered standard errors reported.
Controls are marital status, # of children, head of household, gender, age, income, education level, contribution to income caste, risk aversion,
health insurance and a belief in the existence of a superior force.
IQR stands for inter-quartile range and captures the dispersion in the outcome.
25
4.1.4 On the direct influence of experiences on helmet use
While previously implicitly assuming that past experiences of road accidents or police sanctions
only influence helmet use through expectations, in the next paragraph I investigate the direct
influence of previous road related events on helmet adoption.
Indeed, these types of events per se are likely to impact the safety conduct adopted by mo-
torcyclists. Haselhuhn et al. (2012) used data on video rental fines and showed that, controlling
for the level of information regarding the financial sanctions resulting from a delay in returning
the video, previous experience with a fine significantly improved the future compliance rate.
Using the same specification as the one presented in Table 3, I introduce road accident and po-
lice arrest as explanatory variables along with interaction terms between (i) road accident and
unconditional expected medical costs and (ii) police arrest and unconditional expected fines.
From Table 6, we note that the effect of injury expectations on helmet use for short trips is lower
among individuals who have been involved in a traffic accident. The effect of fine expectations
on helmet use for trips in residential neighborhoods among individuals who have been caught
by the traffic police doubles compared to its effect among those who have never been in that
situation. This last result shows the importance of combining information and enforcement to
make motorcyclists adopt safe behaviors.
26

Table 6: Differentiated influence of expectations on helmet use by previous experiences
Helmet use on main roads trips in thelong trips short trips neighborhood
(1) (2) (3) (4) (5) (6)
UEC medical expenditure (th. INR) 0.005 0.005 -0.000 0.000 0.001 0.002(0.003) (0.004) (0.004) (0.003) (0.004) (0.005)
UEC fines (hund. INR) 0.010 0.007 0.077??? 0.085??? 0.049?? 0.031(0.018) (0.023) (0.018) (0.021) (0.023) (0.026)
Road accident -0.049 -0.015 -0.097(0.059) (0.061) (0.064)
Road accident × UEC medical expenditure -0.002 -0.010?? 0.002(0.005) (0.004) (0.005)
Police arrest 0.030 0.047 -0.112(0.050) (0.072) (0.095)
Police arrest × UEC fines 0.009 -0.041 0.080??
(0.026) (0.031) (0.030)
R2 0.287 0.289 0.259 0.262 0.242 0.248Observations 662 662 665 665 657 657
Notes: ??? 1%, ?? 5% and ? 10% significance.
Fixed effect linear probability estimations with clustered standard errors reported.
‘Road accident’ and ‘Police arrest’ are binary variables taking value one if the person has such experience.
Controls are gender, marital status, # of children, head of household, age, education level, income,
contribution to income, Sikh, caste, risk aversion, health insurance and a belief in the existence of a superior force.
27

4.1.5 Robustness checks
In order to provide evidence for the reliability of these findings, I implement different robustness
checks, the results of which are reported below. More precisely, I replace the expected level of
medical costs and fines by maximum values, I investigate a possible reverse causality effect, I
introduce additional potential omitted variables and finally, I control for the understanding of
the probability scale used to assess the expected probabilities.
First, one may argue that it is the highest possible values with respect to potential finan-
cial consequences (i.e. the costs corresponding to the worst case scenario the individual has in
mind), rather than its expected level, which motivates the conduct adopted by motorcyclists.
When replacing expected costs by the 75th percentile or the maximum value, I find similar
results regarding the influence of subjective expectations on helmet use (Table not shown).
Another important concern regarding the previous results is the possibility that individuals
who decide not to wear a helmet may report lower expectations of negative consequences in
order to reduce the stress induced by the behaviors they choose to adopt. This effect is known
as cognitive dissonance and was first highlighted by Akerlof and Dickens (1982). In order to
tackle this reverse causality issue, I show that helmet use does not cause subjective expectations
regarding injury or fine. To do so, I take advantage of a regulation implemented in Delhi in
July 2009 that makes it compulsory to provide a helmet with every new motorbike that is
sold. I regress unconditional expected costs on helmet use, instrumenting the latter variable by
mandatory helmet provision. More precisely, the instrument takes value one if the respondent
is a driver and rides a motorbike purchased first hand less than two years ago. This variable
can be convincingly assumed to be exogenous and unrelated with any omitted variable. Results
28

presented in Table 7 show that the instrumental variable (helmet provision) is positively and
significantly correlated with the endogenous regressor (helmet use) and that helmet adoption
does not explain fine or injury expectations. Such results confirm the direction of the relationship
between subjective expectations and helmet use and therefore also the results previously found.
Table 7: Reverse causality tests
UEC med. UEC fine UEC med. UEC fine UEC med. UEC fine(1) (2) (3) (4) (5) (6)
Helmet useLong trips on main roads 1.860 1.188
(9.388) (1.796)Short trips on main roads 0.709 0.404
(3.213) (0.595)Trips in the neighborhood 2.335 0.905
(6.993) (1.298)
observations 670 670 673 673 665 665
on main roads for trips infor long trips for short trips neighborhoods
First stageHelmet provision (=1) † 0.062??? 0.182??? 0.092?
(0.021) (0.044) (0.054)
Weak identification test ‡ 8.901 16.900 2.873F statistic 12.08??? 15.85??? 17.95???
R2 0.281 0.236 0.252observations 670 673 665
Notes: ??? 1%, ?? 5% and ? 10% significance. Controls are marital status, # of children, head of household, gender,
age, income, education level, contribution to income caste, risk aversion, health insurance and a belief in the existence
of a superior force. † helmet provision is a dummy variable which takes value 1 if the respondent is a driver and
rides a motorbike purchased first hand less than 2 years ago and 0 otherwise. ‡ Kleibergen-Paap rk Wald F statistic.
Furthermore, I acknowledge that some individual’s personality characteristics (such as op-
timism, overconfidence regarding one’s driving skills, time preferences, level of speed or road
habits) still remain unobserved and might bias the results previously obtained. Optimism, for
instance, is likely to reduce the subjective probability of an accident and the expected injury’s
seriousness. Similarly, overconfident drivers are likely to think they are able to avoid both
police officers and road accidents. These two characteristics, so far unobserved, are negatively
29

correlated with the perceived usefulness of a helmet. As for the velocity at which motorcyclists
drive, it certainly increases the probability of an accident and the severity of injuries. If low
speed and helmet use are substitutes for each other (Grimm and Treibich, 2014), individuals
with high subjective expectations of injuries may decide to reduce their speed instead of wear-
ing a helmet. The estimates would in that case be an overestimation of the true relationship
between beliefs and head protection use. As for the absence, in the formulation of the question,
of a clear time horizon to be considered by the respondent when answering a question on the
likelihood of being hurt in a road accident, I acknowledge that comparability between individ-
uals may be problematic. Some individuals may refer to the next trip while others think about
their entire lifetime. Nevertheless, the absence of a time horizon would jeopardize the findings
presented only if individuals who refer to a really short time horizon are different from those
who consider their whole life. One may argue that individuals more oriented to the present
may be more likely to refer to the next motorbike trip and then may report lower probabilities
of injuries. If preference for the present is negatively correlated with subjective expectations
(and not included in the analysis) then the estimate of unconditional expected medical costs on
helmet use will be an underestimation of the true relationship.
When including average speed, road habits, a preference for living in the present and confi-
dence in one’s driving skills to the specifications, the previous results remain similar (Table not
shown). A significant relationship between subjective expected medical costs and helmet use on
long distance trips appears when average speed is added to the specification. Moreover, we note
that subjective expectations of fines also increase helmet use on long distance trips when aver-
age speed or confidence are included in the regressions. Regarding the impact of the previously
omitted variables on helmet adoption, speed appears to be positively correlated with helmet
use on long journeys. Individuals who frequently use a motorbike are significantly more likely
to wear a helmet when traveling on main roads. Finally, drivers who believe they drive better
30

than others are less likely to use a helmet for long trips or trips in residential neighborhoods. In
this latter case, risk-aversion is found to be positively correlated with helmet use on main roads.
Finally, the understanding, by all respondents, of the probability scale used to derive sub-
jective probabilities may be questioned. Before eliciting subjective expectations of probabilities
and outcomes regarding injury and fines, interviewees were asked several questions in order to
be able to verify whether they properly understood the probability scale (see Appendix B).
I compare the results reported in Table 3 to the coefficients obtained if excluding individuals
who did not correctly answer these control questions (Table not shown). Similar findings of
the influence of subjective expectations on helmet adoption are found for the different samples
considered (excluding individuals who answered incorrectly to one or more control questions).
The magnitude of the effects are quite constant across samples: an increase of 100 INR in the
unconditional expected fines, increases by around 7 percentage points (from 6.3 to 7.9) the
probability of wearing a helmet on short distance trips on main roads and by 5 percentage
points (from 4.8 to 5.2) the probability of using a helmet in residential neighborhoods.
Given the outcomes of these further tests, the results presented in the main analysis can be
described as robust.
4.2 Influence of previous experiences on subjective expectations
In the following paragraphs, I study the impact of past road related events on beliefs. I start
with the subjective expectations regarding injuries.
Table 8 reports the results found for the specifications with the police zone fixed effects (cf.
equation 2). Interestingly, involvement in an accident decreases the variance related to medical
31

costs. Following an accident, individuals actually seem to have a clearer idea of the health risks
they face. While praying daily decreases one’s subjective probability of being injured in a road
accident when not using a helmet, expected medical expenditure and variation in these costs
are higher among religious individuals who have personally experienced a road accident than
among those who have not. As for individuals who use the motorbike to commute to work, they
report significantly higher probabilities of being hurt.
When looking at results from the OLS specifications (not shown in Table 8), the frequent
use of a motorbike seems to decrease the impact of a personal road accident on the subjective
probability of being injured, indicating that the number of trips mitigates the adverse impact
of road accident experiences. Furthermore, it appears that knowing someone who has been
involved in an accident increases the subjective probability of being injured in a road accident
if not using a helmet, while personal experience has no significant impact. Different reasons
may explain this finding. First, personal involvement in a traffic accident may correspond to
very different events. Second, sample selection may be at play as individuals who suffered from
severe road injuries may no longer use a motorbike or may not even have survived the crash.10
Third, remembering that a friend or a family member was involved in a traffic accident is more
likely if this crash was quite severe. Differences in road quality and incidences of road accidents
between neighborhoods may partly explain the level of expectations, as the influence of knowing
a person who was involved in an accident vanishes once circle fixed effects are introduced. In
15 circles out of 32 none of the respondents knew a person who had been involved in a road
traffic accident. This may either support the quality of roads argument or imply that fixed
effects estimations cannot capture the effect of knowing someone who is involved in an accident
because, in this regard, individuals are quite homogeneous.
10According to the information gathered, very few individuals (2% of the sample) were involved in a severecrash.
32

Table 8: Determinants of injury expectations
subjective probability subsequent outcomesof injury expected inter-quartile
if no helmet costs range(1) (2) (3)
Experienced a road accident 0.042 -5.377?? -8.266??
(0.052) (2.146) (3.607)Has a relative involved in a road accident 0.030 2.275 3.226
(0.040) (1.500) (2.149)Uses the motorbike to commute to work 0.068??? 0.071 0.758
(0.019) (0.583) (0.851)Uses the motorbike frequently 0.053?? -0.676 -1.254
(0.023) (1.064) (1.769)Experienced a road accident × Uses the motorbike frequently -0.125 2.263 4.119
(0.080) (2.129) (4.422)Prays daily -0.069??? -1.059 -1.420
(0.023) (0.759) (1.208)Experienced a road accident × Prays daily 0.065 5.668?? 10.401??
(0.072) (2.210) (4.183)
R2 within 0.048 0.017 0.018Observations 828 765 765
Hausman test (p-value)OLS vs. FE 0.000 0.000 0.000FE vs. RE 0.000 0.037 0.023
Notes: Robust standard errors are reported in parentheses. ??? 1%, ?? 5% and ? 10% significance.
All explanatory variables are binary variables.
Remark: The difference in the number of observations comes from the fact that individuals who gave a zero probability of injury
did not answer to the medical expenditure questions. Moreover some respondents who gave a non-zero probability did not reply to
the outcome questions.
Let us now focus on the effects of past police sanctions on subjective expectations regarding
fines.
Table 9 presents the results from the random effect specifications.11 Having previously been
sanctioned by the traffic police increases both the expectation that a fine will have to be paid
and the uncertainty with respect to the financial penalty. This latter effect may be explained
by repeated sanctions of different amounts.
Arbitrariness in the traffic police sanctions, measured through the subjective probability
of being stopped by the police for no reason, increases the subjective probability of being
11These should be preferred to the fixed effect specifications according to Hausman tests.
33

sanctioned if not using a helmet. Conversely, individuals who think they can bribe police
officers report significantly lower probabilities of arrest. These two variables can be considered
as proxies for previous interactions with traffic forces. Motorcyclists who use the motorbike to
go to work report significantly higher probabilities of being caught by the police if not wearing
a helmet.
Table 9: Determinants of fine expectations
subjective probability subsequent outcomesof police arrest expected inter-quartile
if no helmet costs range(1) (2) (3)
Has been sanctioned by the police 0.045 0.548? 0.487?
(0.034) (0.298) (0.271)Discretionary power of police 0.201??? 0.198 0.258
(0.059) (0.190) (0.230)Police officers can be bribed -0.044? -0.123 -0.149
(0.025) (0.097) (0.100)Uses the motorbike to commute to work 0.033? 0.044 0.036
(0.019) (0.084) (0.081)Uses the motorbike frequently 0.035 -0.059 0.017
(0.027) (0.093) (0.078)Prays daily -0.042 -0.020 -0.132
(0.029) (0.074) (0.099)
R2 overall 0.025 0.026 0.034Observations 821 702 702
Hausman test (p-value)OLS vs. FE 0.000 0.000 0.000FE vs. RE 0.967 0.689 0.487
Notes: Robust standard errors are reported in parentheses. ??? 1%, ?? 5% and ? 10% significance.
All explanatory variables except the ‘Discretionary power of police’ are binary variables.
The discretionary power of the police corresponds to the probability of being stopped by the police for no reason.
Remark: The difference in the number of observations comes from the fact that individuals who gave a zero probability of injury
did not answer to the medical expenditure questions. Moreover some respondents who gave a non-zero probability did not reply to
the outcome questions.
5 Policy implications
In order to be able to formulate policy recommendations, I now consider different road safety
policies which are likely to influence individuals’ expectations of injuries and fines when not
34

wearing a helmet, and estimate their impact with respect to helmet use.
5.1 Raising the expectations of fines
I first study policies which impact the expectations related to fines by individuals infringing the
helmet law, either through information on the official level of the fine, its perceived enforcement
level or its level per se.
In order to simulate policies and estimate their impact on helmet adoption, I run probit
specifications with circle dummies clustering standard errors at the police zone level. The results
obtained, both in terms of significance and magnitude, are very similar to those obtained with
the fixed effect linear probability model. Based on these probit estimations, Table 10 reports
the estimated impact on helmet use if motorcyclists are fully aware of the current level of fine
(Scenario 1), if the official fine is raised up to 500 INR (Scenario 2), if individuals are fully
aware of the current level of fine and expect always to be caught by the police when not wearing
a helmet (Scenario 3), and if perfect enforcement and information is associated with a higher
official fine of 500 INR (Scenario 4). The chosen multiplication factor of fines (×5) coincides with
an amendment of the Motor Vehicle Act currently under discussion in the Indian Parliament.
As expected from the empirical analysis, larger gains regarding helmet adoption are obtained
on short distance trips, in particular those on main roads. The limited increase in helmet use
for longer trips can be explained both by a bigger role of expected injuries in this particular
decision-making process and by the smaller room for improvement for this type of trip. A larger
impact is found when substantially raising the official fine. More precisely, scenarios 2 and 4
lead to an increase of 25% to 40% respectively of helmet use on short distance trips.
When comparing number of past encounters with the police as stated by the respondents
to the survey with administrative traffic police data, we note that the number of offenses for
not using a helmet in 2011 per police zone is positively correlated to the share of respondents
35
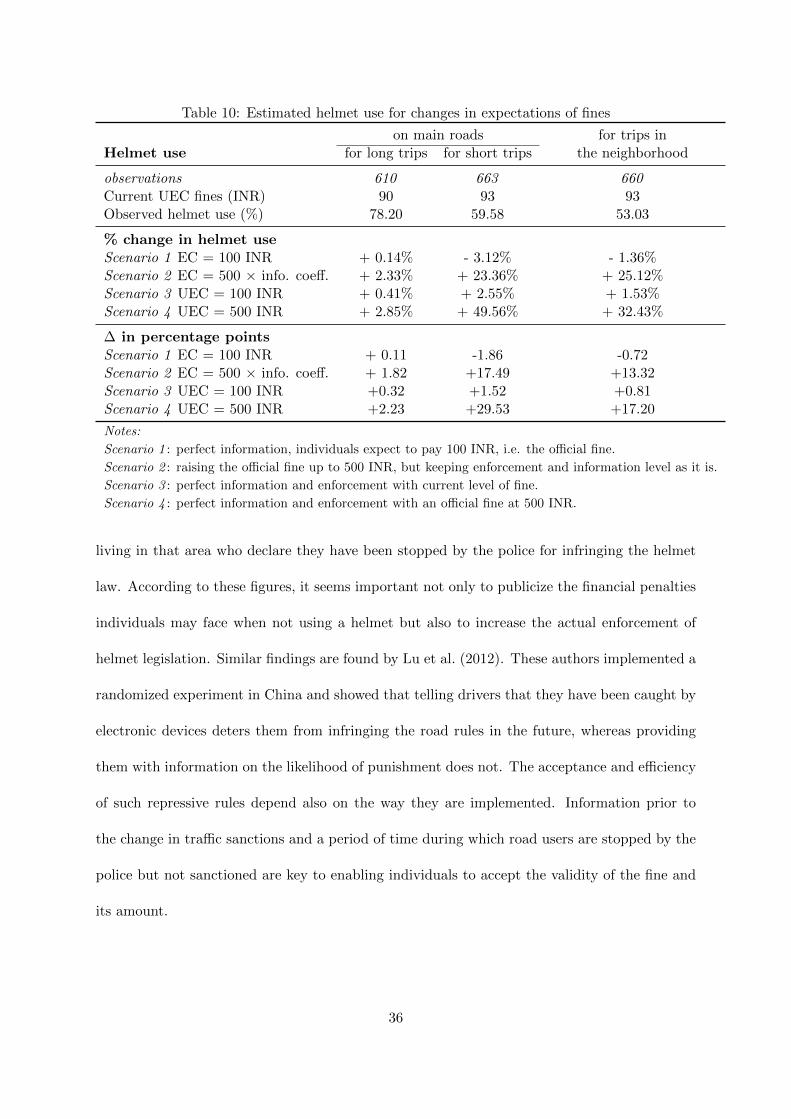
Table 10: Estimated helmet use for changes in expectations of fines
on main roads for trips inHelmet use for long trips for short trips the neighborhood
observations 610 663 660Current UEC fines (INR) 90 93 93Observed helmet use (%) 78.20 59.58 53.03
% change in helmet useScenario 1 EC = 100 INR + 0.14% - 3.12% - 1.36%Scenario 2 EC = 500 × info. coeff. + 2.33% + 23.36% + 25.12%Scenario 3 UEC = 100 INR + 0.41% + 2.55% + 1.53%Scenario 4 UEC = 500 INR + 2.85% + 49.56% + 32.43%
∆ in percentage pointsScenario 1 EC = 100 INR + 0.11 -1.86 -0.72Scenario 2 EC = 500 × info. coeff. + 1.82 +17.49 +13.32Scenario 3 UEC = 100 INR +0.32 +1.52 +0.81Scenario 4 UEC = 500 INR +2.23 +29.53 +17.20
Notes:
Scenario 1 : perfect information, individuals expect to pay 100 INR, i.e. the official fine.
Scenario 2 : raising the official fine up to 500 INR, but keeping enforcement and information level as it is.
Scenario 3 : perfect information and enforcement with current level of fine.
Scenario 4 : perfect information and enforcement with an official fine at 500 INR.
living in that area who declare they have been stopped by the police for infringing the helmet
law. According to these figures, it seems important not only to publicize the financial penalties
individuals may face when not using a helmet but also to increase the actual enforcement of
helmet legislation. Similar findings are found by Lu et al. (2012). These authors implemented a
randomized experiment in China and showed that telling drivers that they have been caught by
electronic devices deters them from infringing the road rules in the future, whereas providing
them with information on the likelihood of punishment does not. The acceptance and efficiency
of such repressive rules depend also on the way they are implemented. Information prior to
the change in traffic sanctions and a period of time during which road users are stopped by the
police but not sanctioned are key to enabling individuals to accept the validity of the fine and
its amount.
36

5.2 Raising the expectations of medical expenditure
I now focus on different scenarios of expectations of medical costs and relate them to policies
such as awareness campaigns regarding the traffic mortality rate or the usefulness of a helmet.
I do not have access to any official data regarding the actual health expenditure road vic-
tims face. I therefore simply consider different scenarios with increasing unconditional expected
medical costs and estimate the level of helmet use associated with each of these levels of ex-
penditure for different motorbike trips. Table 11 reports the simulated change in percentage of
use. While no increase in the share of motorcyclists wearing a helmet is found on short distance
trips, doubling the expected injury costs (from 2,400 to 5,000 INR) raises the use of a head
protection device for long distance trips by 0.5 percentage points. A share of 98.2% of motor-
cyclists using a helmet on long distance trips, implying an increase of 20 percentage points, is
obtained when multiplying by 20 the individuals’ expected medical expenditure. These results
suggest that awareness campaigns stressing the high costs associated with road injuries in the
event of an accident, and in particular if not using a helmet, might be useful in increasing
helmet use among motorcyclists in Delhi. Lewis et al. (2007) summarized the literature on road
safety media campaigns and concluded that the impact of shocking advertisements is somewhat
mixed and inconsistent. Fear campaigns must therefore be used with caution. Using factual
information or humor might be alternative options.
Finally, highlighting the risk one faces even on short distance trips could raise the use of
helmets among individuals who use a motorbike only in the vicinity of their homes. When
imputing the estimated impact of unconditional expected medical costs on long trips to helmet
use on short distance trips (Scenario 8), it appears that if individuals thought that short distance
journeys imply similar health risks as longer trips, an increase of around 6% in the share of
individuals who use a helmet would be observed.
37

Table 11: Estimated helmet use related to changes in expectations of medical expenditure
on main roads for trips inHelmet use for long trips for short trips the neighborhood
observations 610 663 660Current UEC medical expenditure (INR) 2,408 2,704 2,755Observed helmet use (%) 78.20 59.58 53.03
% change in helmet useScenario 5 UEC = 5,000 INR +3.04% +0.82% +1.21%Scenario 6 UEC = 10,000 INR +7.40% +0.99% +1.79%Scenario 7 UEC = 50,000 INR +25.63% +2.40% +6.56%
Scenario 8 βlongUECinj - +4.63% +6.54%
∆ in percentage pointsScenario 5 UEC = 5,000 INR +2.38 +0.49 +0.64Scenario 6 UEC = 10,000 INR +5.79 +0.59 +0.95Scenario 7 UEC = 50,000 INR +20.04 +1.43 +3.48
Scenario 8 βlongUECinj - +2.76 +3.47
Notes:
Scenario 5 : doubling the expectations of injury costs.
Scenario 8 : imputing the estimated impact of unconditional expected medical costs for long journeys
on helmet use to short distance trips.
6 Conclusion
This paper studies motorbike users’ decision of whether to wear head protection or not, using
original data collected in a metropolitan city in a low income country, namely, New Delhi. I
study the impact of subjective expectations of injury and fines on helmet adoption; this in
various traveling situations differing by the length of the trip and the types of roads taken. I
find that expectations regarding medical expenditure increase the adoption of helmet on long
distance trips on main roads. Conversely, the threat of police sanctions explains helmet use on
short distance journeys. Differentiated effects are found along lines of gender and income. In
a second step, I explore the factors which may explain the observed differences in expectations
across motorcyclists. I show that road exposure and previous road related experiences are
correlated with individuals’ personal opinions.
Furthermore, an increased police threat through enforcement, information or fine levels
38

should increase helmet use on short distance journeys. In fact, combining these measures
should be even more effective. Information campaigns stressing the usefulness of a helmet to
avoid severe injuries (implying important health expenditure), even for motorbike trips in the
local vicinity, are also likely to make motorcyclists adopt safer behavior.
Many directions for future research can be undertaken to complete and improve the findings
presented here. First, a follow-up survey could study the evolution of expectations regarding
injury and fines and estimate the actual impact of road accidents and traffic fines by controlling
for the timing of these events. Second, policy evaluations could be implemented in the future,
either through an intervention, for instance an information campaign regarding the utility of
helmet use, or through a quasi-experiment taking advantage of a change in the level of the fines
for the non-use of helmets; a policy which is still being debated in the Indian Parliament.
Acknowledgement
Financial support for this research from the Health Chair - a joint initiative by PSL, Universite
Paris-Dauphine, ENSAE and MGEN under the aegis of the Fondation du Risque (FDR) - the
Paris School of Economics Research Fund and the International Institute of Social Studies of
Erasmus University Rotterdam is gratefully acknowledged.
39

References
G. A. Akerlof and W. T. Dickens. The economic consequences of cognitive dissonance. The
American Economic Review, 72(3):307–319, 1982.
O. Attanasio. Expectations and perceptions in developing countries: Their measurement and
their use. American Economic Review: Papers & Proceedings, 99(2):87–92, 2009.
A. Delavande and H.-P. Kohler. Subjective expectations in the context of hiv/aids in malawi.
Demographic Research, 20:817–875, 2009.
A. Delavande, X. Gine, and D. McKenzie. Measuring subjective expectations in developing
countries: A critical review and new evidence. Journal of Development Economics, 94:151–
163, 2011.
J. Dominitz and C. F. Manski. Perceptions of economic insecurity: Evidence from the survey
of economic expectations. Public Opinion Quarterly, 61:261–287, 1997.
M. Grimm and C. Treibich. Why do some motorbike riders wear a helmet and others don’t?
evidence from delhi, india. IZA Discussion Paper Series, (8042), March 2014.
M. P. Haselhuhn, D. G. Pope, M. E. Schweitzer, and P. Fishman. The impact of personal
experience on behavior: Evidence from video-rental fines. Management Science, 58(1):52–61,
2012.
M. Hsiao, A. Malhotra, J.S. Thakur, J. K. Sheth, A. B. Nathens, N. Dhingra, and P. Jha. Road
traffic injury mortality and its mechanisms in india: nationally representative mortality survey
of 1.1 million homes. BMJ Open, 3, 2013.
I. M. Lewis, B. Watson, R. Tay, and K. M. White. The role of fear appeals in improving
driver safety: A review of the effectiveness of fear-arousing (threat) appeals in road safety
40

advertising. International Journal of Behavioral and Consultation Therapy, 3(2):203–222,
2007.
B. C. Liu, R. Ivers, R. Norton, S. Boufous, S. Blows, and S. K. Lo. Helmets for preventing
injury in motorcycle riders. Cochrane Database of Systematic Reviews, 1, 2008.
F. Lu, J. Zhang, and J. M. Perloff. Deterring traffic violations: Evidence from a randomized
experiment. 2012.
C. F. Manski. Identification of endogenous social effects: The reflection problem. Review of
Economic Studies, 60(3):531–542, 1993.
D. McKenzie, J. Gibson, and S. Stillman. A land of milk and honey with streets paved with
gold: Do emigrants have over-optimistic expectations about incomes abroad? World Bank
Policy Research Paper, (4141), 2007.
D. Mohan. Social cost of road traffic crashes in india. In Proceeding 1st Safe Community
Conference on Cost of Injuries, pages 33–38, Denmark, 2001. Viborg.
NCRB. Accidental deaths and suicides in india 2011. Technical report, National Crime Record
Bureau Ministry of Home Affairs, 2011.
N. Ritter and C. Vance. The determinants of bicycle helmet use: Evidence from germany.
Accident Analysis and Prevention, 43(1), January 2011.
41

Appendices
Appendix A. Formulation of the subjective expectation questions
Probability of injury
in general - “Think about the way you generally travel on the motorcycle. Given this, how
likely do you think it is that you will have an accident in which you get injured?”
if no helmet - “If you are not wearing a helmet, how likely do you think it is that you will
have an accident in which you get injured?”
Probability of police arrest
in general - “Think about the way you generally travel on the motorcycle, what is the likelihood
that you will be stopped by the police in the next month?”
if no helmet - “If you do not use the helmet at all during the next month, what is the
probability that the police will stop you at least once over that period?”
for no reason - “According to you, what is the likelihood that you will be stopped by the police
for no reason in the next month?”
Answer scale
Respondents answered using a 11 point scale from 0 “this event will never happen” up to
10 “this event will surely happen”. I then divided their answers by 10 to obtain probabilities
between 0 and 1.
Medical expenditure
“Thinking about the medical expenditure you would incur if you were injured in a road accident
right now when not wearing a helmet, what do you think is the percent chance that this amount
will be less than X INR ?”
42

A series of fixed amounts ranging from 500 INR up to 200,000 INR were proposed, with the
enumerator proposing higher amounts till the respondent answered 100%.
Fines
“Thinking about the fine you would have to pay if you were stopped by the police right now
for not wearing a helmet, what do you think is the percent chance that this amount will be less
than X INR ?”
A series of fixed amounts ranging from 50 INR up to 1,000 INR were offered.
Variables built
1. The expected cost Ei(C) was computed based on the answers given: Ei(C) =∑n
k=1(pik −
pik−1) ·(Ck + Ck−1
2
), with pik the percent chance that the cost will be less than the amount
Yk for individual i,Ck + Ck−1
2the central value of each interval and pik − pik−1 the percent
chance associated to each interval. Initial values C0 and pi0 are equal to zero.
2. The inter-quartile range, which corresponds to the difference between the 75th and 25th
percentiles, has also been computed. Based on the answers provided, the 25th and the 75th
percentiles were derived through linear extrapolation. When a respondent gave for the first
proposed amount a higher percentage than 25 or 75, the lowest level of medical expenditure
(500 INR) was imputed to the percentile.
43
Appendix B. Excluding individuals who did not understand the probability
scale
Five general questions were asked to respondents in order to control for their understanding of
the scale.
First, we checked their understanding of the probability concept:
1. “Imagine I have 5 balls, one of which is red and four of which are blue. If you pick one
of these balls without looking, how likely it is that you will pick the red ball?” - variable
named “red ball” below.
Two nested questions were also asked:
2. “How likely are you to go to the market sometime in the next two days?” - variable named
“2 days” below.
3. “How likely are you to go to the market sometime in the next two weeks?” - variable
named “2 weeks” below.
The variable called “nested” took the value 1 if the individual gave consistent answers to the
above two questions.
Finally, we tried to check whether the entire scale was used by the respondent and therefore
asked about events for which everybody should reply at the extreme values of the scale:
4. “How likely do you think it is that you will go out of the house for any reason in the next
month?” - variable named “outside” below. This question turned out to be misleading,
while we meant outside the house, some respondents understood out of the city. This
confusion explain the unexpected results presented in Table 12.
5. “How likely is it that Christmas will fall in the month of June?” - variable named “Christ-
mas” below.
44
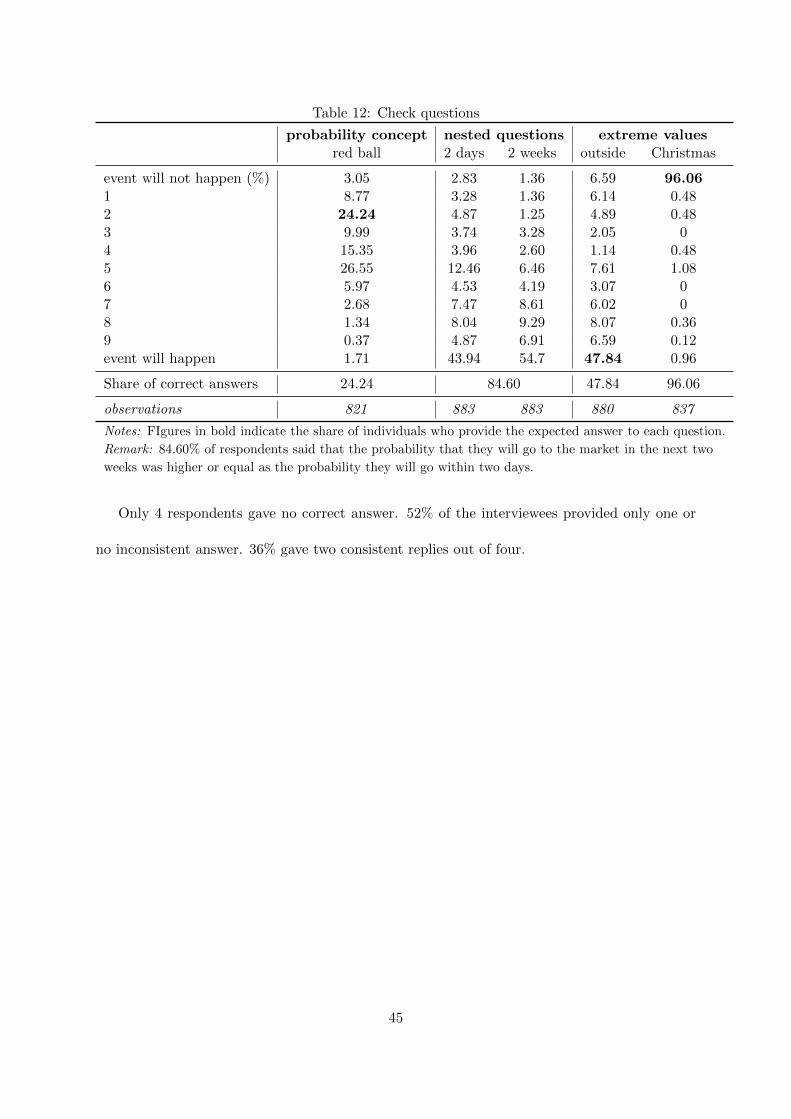
Table 12: Check questions
probability concept nested questions extreme valuesred ball 2 days 2 weeks outside Christmas
event will not happen (%) 3.05 2.83 1.36 6.59 96.061 8.77 3.28 1.36 6.14 0.482 24.24 4.87 1.25 4.89 0.483 9.99 3.74 3.28 2.05 04 15.35 3.96 2.60 1.14 0.485 26.55 12.46 6.46 7.61 1.086 5.97 4.53 4.19 3.07 07 2.68 7.47 8.61 6.02 08 1.34 8.04 9.29 8.07 0.369 0.37 4.87 6.91 6.59 0.12event will happen 1.71 43.94 54.7 47.84 0.96
Share of correct answers 24.24 84.60 47.84 96.06
observations 821 883 883 880 837
Notes: FIgures in bold indicate the share of individuals who provide the expected answer to each question.
Remark: 84.60% of respondents said that the probability that they will go to the market in the next two
weeks was higher or equal as the probability they will go within two days.
Only 4 respondents gave no correct answer. 52% of the interviewees provided only one or
no inconsistent answer. 36% gave two consistent replies out of four.
45