your own bank
TRANSCRIPT

YOUR OWN BANK

Ratings
2
1800 425 00 000 || www.indianbank.in || IndPay App || @MyIndianBank || Indian Bank
S&P (International) (BBB-/Negative/A3)
CRISIL (Upper Tier II) AAA/Stable
CRISIL (Lower Tier II) AAA/Stable
Listed in ‘MSCI India IMI’ index, which include large+ mid+ small
cap stocks

Highlights Q4 2016-17
3
RoA 0.59%
CASA % to Total Deposits (Domestic)
37.65%
Net Interest Income
22.06%
Operating Profit 29.34% Net Profit 278.39%
CRAR 13.64% Net Interest Margin
2.70%
1800 425 00 000 || www.indianbank.in || IndPay App || @MyIndianBank || Indian Bank

Soundness
4
12.86% 13.20%13.64%
10.61%
12.08% 12.20%
31.03.2015 31.03.2016 31.03.2017
CRAR Basel III
CRAR as per BASEL III Tier I (%)
S.No Details 31.03.2015 31.03.2016 31.03.2017
1 Tier I 12473.12 15064.82 16032.43
Of which
Common Equity 12473.12 14568.01 15532.43
Additional Tier I 0 496.81 500.00
2 Tier II 2639.40 1403.25 1897.60
3 Total ( Tier I+ II) 15112.52 16468.07 17930.03
4 Risk-Weighted Assets 117563.30 124743.79 131436.47
5 Tier I 10.61 12.08 12.20
Of which
Common Equity 10.61 11.68 11.82
Additional Tier I 0 0.40 0.38
6 Tier II 2.25 1.12 1.44
7 Total ( Tier I+ II) 12.86 13.20 13.64
Capital Fund (` in crore)
Capital Adequacy Ratio (%)
1800 425 00 000 || www.indianbank.in || IndPay App || @MyIndianBank || Indian Bank

Equity
5
280.63
301.10
31.03.2016 31.03.2017
Book value per share (`)
31.03.2016 31.03.2017
13478.35
14461.59
Networth (` in crore)
1800 425 00 000 || www.indianbank.in || IndPay App || @MyIndianBank || Indian Bank
Net worth increased by 7.30%
during 2016-17
Book value per Share
increased by ` 20.47 as on
31.03.2017

Business Profile
6
(` in crore )
Amt (%)
1 Global Business 310918 309510 314654 3736 1.20 8.22
Domestic 299738 299080 303573 3835 1.28 8.48
Overseas 11180 10430 11081 -99 -0.88 2.27
2 Global Deposits 178286 183652 182509 4223 2.37 8.60
Domestic 172652 178280 177084 4432 2.57 8.87
Overseas 5634 5373 5425 -209 -3.71 1.52
3 Gross Advances 132632 125858 132145 -487 -0.37 7.70
Domestic 127087 120800 126489 -598 -0.47 7.94
Overseas 5545 5057 5656 110 1.99 3.02
4 CD Ratio (%) Global 74.39 68.53 72.40 - - -
Domestic 73.61 67.76 71.43 - - -
Overseas 98.42 94.14 104.25 - - -
Sl. No. Details 31.03.201731.12.201631.03.20165 Year
CAGR
Y-o-Y
1800 425 00 000 || www.indianbank.in || IndPay App || @MyIndianBank || Indian Bank
Amt (%)
1 Average Global Business* 276672 294997 299677 4680 1.59 8.86
2 Average Global Deposits* 157921 170827 175005 4178 2.45 9.23
3 Average Gross Advances* 118751 124170 124672 502 0.40 8.34
Y-o-Y 5 Year
CAGRSl. No. Details 2014-15 2015-16 2016-17
* Including Inter Bank Deposits

Movement of Share Price vis-à-vis select PSBs and Market Capitalisation
7
Market Capitalization improved
from `4990.23 crore as on
31.03.2016 to `13364 crore as
on 31.03.2017.
Return on Equity improved from
5.46% in 2015-16 to 9.97% in
2016-17
1800 425 00 000 || www.indianbank.in || IndPay App || @MyIndianBank || Indian Bank

Deposit Profile
8
(` in crore)
Amt (%)
1 Domestic CASA 55153 69003 66677 11524 20.89 12.83
Current Deposits 8746 9681 9415 669 7.65 7.43
Savings Deposits 46407 59322 57262 10854 23.39 13.89
2
CASA (Domestic) Ratio
(%) 31.94 38.71 37.65 - - -
CA (Domestic) Ratio
(%) 5.07 5.43 5.32 - - -
SB (Domestic) Ratio
(%) 26.88 33.27 32.34 - - -
Sl. No. Details 31.03.201731.12.201631.03.2016Y-o-Y 5 Year
CAGR
1800 425 00 000 || www.indianbank.in || IndPay App || @MyIndianBank || Indian Bank
31.03.2016 31.12.2016 31.03.2017
31.94 38.71 37.65
CASA (% to Total Deposits)
82.31 88.82 87.18
17.69 11.18 12.82
31.03.2016 31.12.2016 31.03.2017
Share of Term Deposits (%)
Above Rs. 5 crore Upto Rs. 5 crore
Details 31.03.2016 31.12.2016 31.03.2017
Term Dep (incl. PDs and CDs) 117339 108061 109886
Of which:
Above Rs. 5 crore 20758 12082 14086
Upto Rs. 5 crore 96581 95978 95800
High Cost Deposits 7702 2843 6887
Of Which: PD * 3301 2843 6887
CD ** 4402 0 0
* Preferential Deposits
** Certificate of Deposits

Break-up of Advances
9
( ` in crore) 13.47%
MSME
7.83%
Agriculture
Details 31.03.2016 31.12.2016 31.03.2017
Gross Advances (Domestic) 127087 120800 126489
of which : Retail Advances 63210 62957 69319
Corporate Advances 63877 57843 57170
Break up of Key Sectors
Agriculture 23018 24308 24820
MSME 21032 19373 23864
Mortgage Loans(Including Home Loan)10460 11912 12825
1800 425 00 000 || www.indianbank.in || IndPay App || @MyIndianBank || Indian Bank
22.63%
Mortgage

Advances – Major Industries
10
(` in crore)
1800 425 00 000 || www.indianbank.in || IndPay App || @MyIndianBank || Indian Bank
Details 31.03.2016
% share to
Gross
Advances
31.12.2016
% share to
Gross
Advances
31.03.2017
% share to
Gross
Advances
Infrastructure 20647 16.25 21665 17.93 21287 16.83
Iron & Steel 3808 3.00 4029 3.34 3934 3.11
Textiles 3962 3.12 4281 3.54 4268 3.37
Food Processing 2776 2.18 2831 2.34 3177 2.51
All Engineering 2532 1.99 2560 2.12 2754 2.18
Other Industries* 5885 4.63 9876 8.18 11348 8.97
Petroleum, Coal Products & Nuclear Fuels 2236 1.76 1846 1.53 2535 2.00
Cement & Cement Products 1426 1.12 1351 1.12 1320 1.04
Construction 1353 1.06 1170 0.97 1251 0.99
*not classified elsewhere

Balance Sheet- Snapshot
11
(` in crore)
As on 31.03.2016 31.03.2017
Capital 480 480
Reserves & Surplus 15779 16682
Deposits 178286 182509
Borrowings 3509 12637
Other Liabilities & Provisions 5655 5925
Total 203710 218233
As on 31.03.2016 31.03.2017
Cash & Balance with RBI 9174 5589
Bal. with banks & money at call 2825 4453
Investments 53089 67552
Advances 129049 127699
Fixed Assets 3511 3443
Other Assets 6062 9498
LIABILITIES
ASSETS
1800 425 00 000 || www.indianbank.in || IndPay App || @MyIndianBank || Indian Bank

Power Sector Exposure [ As on 31.03.2017]
12
(` in crore)
FB NFB FB NFBCentral Govt.
undertakings 783 0
Central Govt.
undertakings 0 0
State Government
Undertakings 2989 263
State Government
Undertakings 2106 296
Private Sector 3889 894 Private Sector 200 72NPA 1016 NPA
Total Exposure 8677 1157 Total Exposure 2306 368
Sector Sector
Central Govt.
undertakings 0 0
Central Govt.
undertakings 783 0
State Government
Undertakings 196 0
State Government
Undertakings 5291 559
Private Sector 113 0 Private Sector 4202 966
NPA NPA 1016 0
Total Exposure 309 0 Total Exposure 11292 1525
DistributionGenerationSector Sector
Transmission Total
1800 425 00 000 || www.indianbank.in || IndPay App || @MyIndianBank || Indian Bank

State-wise: Power Sector Exposure (As on 31.03.2017 )
13
(` in crore)
FRP Bonds - Financial Restructuring Plan Bonds
FRP
BONDSFB NFB Invt FB NFB Invt FB NFB
FRP
BONDSFB NFB
Andhra Pradesh 406.01 32.34 234.37 50.00 32.34 640.38 50.00
Chattisgarh 861.48 309.36 861.48 309.36
Delhi 58.16 724.37 219.33 72.17 58.16 943.70 72.17
Gujarat 121.00 200.00 134.75 121.87 78.76 0.00 377.62 278.76
Haryana 179.15 245.31 0.00 4.60 0.00 179.15 249.91
Karnataka 171.34 895.19 28.85 1095.38
Maharashtra 459.03 158.06 617.09
Madhya Pradesh 83.36 83.36
Orissa 427.98 9.60 427.98 9.60
Punjab 0.00
Rajasthan 252.79 94.12 183.46 252.79 277.58
Tamil Nadu 180.58 839.38 96.00 1278.09 430.91 180.58 2117.47 526.91
Telangana 175.00 203.62 0.00 175.00 203.62
Uttar Pradesh 280.18 280.18
Uttarkhand 238.64 238.64
West Bengal 933.73 262.94 15.01 948.74 262.94
Other States 15.30 34.47 49.77
NPA 1015.96 1015.96
Total 787.52 1580.65 296.00 58.16 3745.86 262.94 32.34 5102.35 950.80 878.02 10428.86 1509.74
CENTRAL/STATE
OTHER THAN DISCOMsSTATE DISCOMs
Total PRIVATEState
1800 425 00 000 || www.indianbank.in || IndPay App || @MyIndianBank || Indian Bank

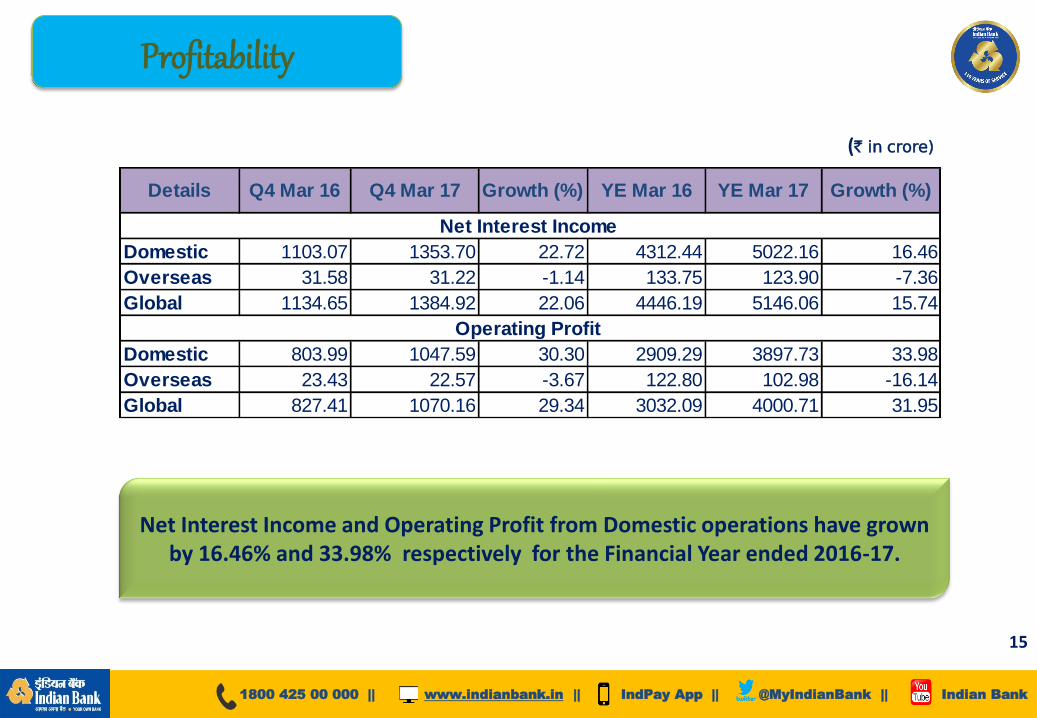
Profitability
14
(` in crore)
827.41
1021.16
1070.16
QE 31.03.2016
QE 31.12.2016
QE 31.03.2017
Quarterly Operating Profit
84.49
373.47
319.70
QE 31.03.2016 QE 31.12.2016 QE 31.03.2017
Quarterly Net Profit
YE 31.03.2016 YE 31.03.2017
3032
4001
Operating Profit
711
1406
YE 31.03.2016 YE 31.03.2017
Net Profit
1800 425 00 000 || www.indianbank.in || IndPay App || @MyIndianBank || Indian Bank
Profitability
15
(` in crore)
1800 425 00 000 || www.indianbank.in || IndPay App || @MyIndianBank || Indian Bank
Net Interest Income and Operating Profit from Domestic operations have grown by 16.46% and 33.98% respectively for the Financial Year ended 2016-17.
Details Q4 Mar 16 Q4 Mar 17 YE Mar 16 YE Mar 17 Growth (%)
Domestic 1103.07 1353.70 22.72 4312.44 5022.16 16.46
Overseas 31.58 31.22 -1.14 133.75 123.90 -7.36
Global 1134.65 1384.92 22.06 4446.19 5146.06 15.74
Domestic 803.99 1047.59 30.30 2909.29 3897.73 33.98
Overseas 23.43 22.57 -3.67 122.80 102.98 -16.14
Global 827.41 1070.16 29.34 3032.09 4000.71 31.95
Net Interest Income
Operating Profit
Growth (%)

Key Ratios
16
(% Annualized)
Parameters (Global) QE 31.03.2016 QE 31.03.2017YE
31.03.2016
YE
31.03.2017
Cost of Deposits 6.48 5.71 6.76 6.03
Cost of Funds 5.65 4.86 5.90 5.21
Yield on Advances 9.28 8.90 9.63 9.17
Yield on Funds 7.91 7.41 8.13 7.67
Return on Assets (RoA) 0.17 0.59 0.36 0.67
Net Interest Margin
Global 2.38 2.70 2.33 2.59
Domestic 2.44 2.75 2.37 2.64
Return on Investments
(Domestic) 8.46 7.88 8.04 8.57
Return on Average
Networth (RoE) 2.52 8.82 5.46 9.97
Business per Employee
(` in lakhs) 1531.19 1487.73 1531.19 1487.73
Business per Branch
(` in crore) 121.22 117.32 121.22 117.32
1800 425 00 000 || www.indianbank.in || IndPay App || @MyIndianBank || Indian Bank
0.17
0.59
QE 31.03.2016 QE 31.03.2017
RoA(%)
2.52
8.82
QE 31.03.2016 QE 31.03.2017
RoE (%)

Other Profitability Ratios
17
1800 425 00 000 || www.indianbank.in || IndPay App || @MyIndianBank || Indian Bank
31.03.2016 31.12.2016 31.03.2017 31.03.2016 31.03.2017
1 Operating profit to AWF (%)* 1.64 1.95 1.97 1.52 1.91
2 Cost to Income ratio (%) 50.28 44.69 45.69 51.31 45.62
3 Salary expenses to Total expenses (%) 13.22 14.07 14.56 13.38 13.97
4 Salary Expenses to AWF (%)* 0.97 0.95 0.95 1.00 0.95
5 Other Operating Expenses to AWF (%)* 0.69 0.63 0.71 0.60 0.65
6 Book value (`) 280.63 302.59 301.10 280.63 301.10
7 Earnings per share (`) 7.04 31.10 26.63 14.81 29.27
*AWF - Average Working Funds
ParticularsSl No.QUARTER ENDED YEAR ENDED
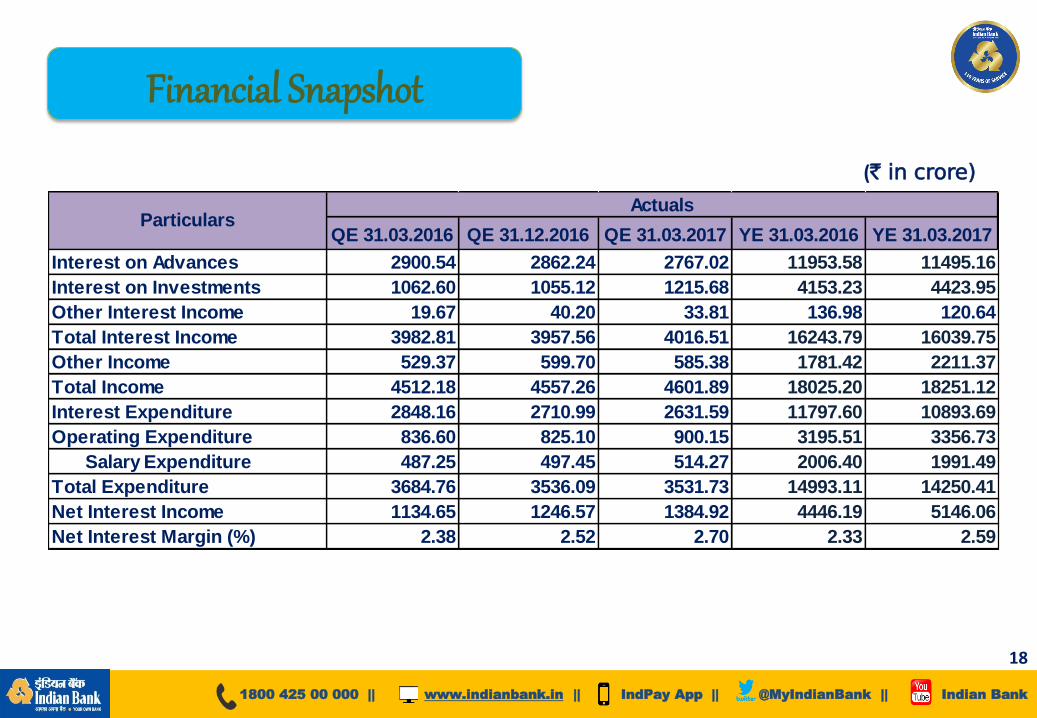
Financial Snapshot
18
(` in crore)
1800 425 00 000 || www.indianbank.in || IndPay App || @MyIndianBank || Indian Bank
QE 31.03.2016 QE 31.12.2016 QE 31.03.2017 YE 31.03.2016 YE 31.03.2017
Interest on Advances 2900.54 2862.24 2767.02 11953.58 11495.16
Interest on Investments 1062.60 1055.12 1215.68 4153.23 4423.95
Other Interest Income 19.67 40.20 33.81 136.98 120.64
Total Interest Income 3982.81 3957.56 4016.51 16243.79 16039.75
Other Income 529.37 599.70 585.38 1781.42 2211.37
Total Income 4512.18 4557.26 4601.89 18025.20 18251.12
Interest Expenditure 2848.16 2710.99 2631.59 11797.60 10893.69
Operating Expenditure 836.60 825.10 900.15 3195.51 3356.73
Salary Expenditure 487.25 497.45 514.27 2006.40 1991.49
Total Expenditure 3684.76 3536.09 3531.73 14993.11 14250.41
Net Interest Income 1134.65 1246.57 1384.92 4446.19 5146.06
Net Interest Margin (%) 2.38 2.52 2.70 2.33 2.59
ParticularsActuals

Non Interest Income
19
(` in crore)
1800 425 00 000 || www.indianbank.in || IndPay App || @MyIndianBank || Indian Bank
31.03.2016 31.12.2016 31.03.2017 31.03.2016 31.03.2017
Commission, Exchange, Brokerage
& Misc Income 195.11 188.58 257.36 615.90 755.06
Profit/loss on sale of investments 104.43 289.91 135.18 314.17 871.93
ATM acquirer fee received 30.10 36.58 43.27 109.51 146.88
Exchange profit 46.87 50.52 22.47 248.64 179.03
Recovery in written - off accounts 140.88 22.00 53.88 352.32 149.92
Others 11.97 12.11 73.22 140.88 108.55
Total Non Interest Income 529.36 599.70 585.38 1781.42 2211.37
ParticularsQUARTER ENDED YEAR ENDED

Profit
20
(` in crore)
1800 425 00 000 || www.indianbank.in || IndPay App || @MyIndianBank || Indian Bank
31.03.2016 31.12.2016 31.03.2017 31.03.2016 31.03.2017
1 Interest Income 3982.81 3957.56 4016.51 16243.79 16039.75
2 Interest Expenses 2848.16 2710.99 2631.59 11797.60 10893.69
3 NII (Spread 1-2) 1134.65 1246.57 1384.92 4446.19 5146.06
4 Other Income 529.37 599.70 585.38 1781.42 2211.37
5 Operating Expenses 836.60 825.10 900.15 3195.51 3356.73
6 Contribution (4-5) -307.23 -225.40 -314.77 -1414.09 -1145.36
7 Operating Profit (3+6) 827.42 1021.17 1070.16 3032.09 4000.71
8 Provisions 742.92 647.69 750.46 2320.71 2595.03
9 Net Profit 84.49 373.48 319.70 711.38 1405.68
Sl. No Parameters
QUARTER ENDED YEAR ENDED

Other Operating Expenses
21
(` in crore)
1800 425 00 000 || www.indianbank.in || IndPay App || @MyIndianBank || Indian Bank
31.03.2016 31.12.2016 31.03.2017 31.03.2016 31.03.2017
Rent, Taxes & Lighting 79.34 66.61 82.06 258.83 294.47
Depreciation 38.90 39.19 45.56 145.52 158.86
Repairs & Maintenance 17.19 20.59 26.22 67.39 85.20
Insurance 43.94 49.17 50.05 160.34 188.95
Fees Others 22.51 17.00 23.29 75.02 74.88
ATM Issuer Fee Paid 38.24 37.69 42.71 137.99 158.37
Others 109.22 97.39 115.99 344.02 404.50
Other Operating Expenditure 349.34 327.64 385.88 1189.11 1365.23
QUARTER ENDEDParticulars
YEAR ENDED

Asset Classification
22
(` in crore)
1800 425 00 000 || www.indianbank.in || IndPay App || @MyIndianBank || Indian Bank
Standard
Advances
Restructured
Standard
Advances
GNPAStressed
Advances Gross Advances
1 2 3 4 (2+3) 5 (1+4)
31.03.16 117439 6366 8827 15193 132632
% Share 88.54 4.80 6.66 11.46 100.00
31.03.17 117957 4322 9865 14187 132145
% Share 89.26 3.27 7.47 10.74 100.00
Share of Standard advances to Total advances improved by 72 bps.

Sector-wise Stressed Advances
23
(` in crore)
1800 425 00 000 || www.indianbank.in || IndPay App || @MyIndianBank || Indian Bank
Stressed
Adv (%) to
Gross
Advances (Respective
Sector)
GNPARestructured
Standard
Advances
Stressed
Advances
Stressed
Adv (%) to
Gross
Advances (Respective
Sector)
31.12.2016
Agriculture 2.69 604 25.39 629.39 2.54
Home Loan 3.40 172 172.18 344.18 6.57
Education Loan 11.54 254 59.29 313.29 11.00
Micro & Small
Enterprises (Priority) 9.45 1210 219.34 1429.34 7.31
Others 17.67 7625 3846.11 11471.11 14.40
Total 12.41 9865 4322.30 14187.30 10.74
Priority 5.76 2142 574.86 2716.86 4.94
Non Priority 16.80 7723 3747.45 11470.45 14.86
Total 12.41 9865 4322.31 14187.31 10.74
31.03.2017
Sector

Asset Quality
24
Gross NPA : 7.47 %
Net NPA : 4.39%
(` in crore)
1800 425 00 000 || www.indianbank.in || IndPay App || @MyIndianBank || Indian Bank
Gross NPAs opening 5670 8827
ADD:Slippages+Additions 5704 3331
Sub-Total 11374 12158
Less:Cash Recovery 526 587
Less:Upgradation 91 264
Less:Technical Write off 906 1086
Less:Normal Write off 20 167
Less:Assigned to ARCs 1004 189
Sub-Total 2547 2293
Gross NPA closing Balance 8827 9865
Provisions 3043 3836
Others (interest Realisable,etc.) 365 422
Net NPAs 5419 5606
Gross NPA% 6.66 7.47
Net NPA% 4.20 4.39
AUC Recovery 247.42 157.00
Provision Coverage Ratio (%) 53.37 58.14
Parameters 31.03.2016 31.03.2017
7.69% 7.47%
4.76%4.39%
0.00%
2.00%
4.00%
6.00%
8.00%
10.00%
12.00%
14.00%
31.12.2016 31.03.2017
Net NPA
Gross NPA

Sector-wise NPA
25
(` in crore)
SectorGNPA
31.03.2016
% to Gross
Advances
(Respective
sector)
GNPA
31.12.2016
% to Gross
Advances
(Respective
Sector)
GNPA
31.03.2017
% to Gross
Advances
(Respective
Sector)
Agriculture 618 2.36 610 2.53 604 2.43
Home Loan 159 1.70 161 1.75 172 1.60
Education Loan 249 7.85 316 8.75 254 8.92Micro & Small
Enterprises (Priority) 1209 7.47 1209 6.68 1210 6.34
Others 6591 8.48 7379 10.42 7625 10.30
Total 8827 6.66 9675 7.69 9865 7.47
Priority 2151 4.27 2208 4.36 2142 4.06
Non Priority 6676 8.12 7467 9.94 7723 9.72
Total 8827 6.66 9675 7.69 9865 7.47
1800 425 00 000 || www.indianbank.in || IndPay App || @MyIndianBank || Indian Bank

Industry-wise NPA
26
(` in crore)
1800 425 00 000 || www.indianbank.in || IndPay App || @MyIndianBank || Indian Bank
Gross NPA
% to Sector
Gross
Advances
(respective
sector)
Gross NPA
% to sector
Gross
Advances
(respective
sector)
Gross NPA
% to Sector
Gross
Advances
(respective
sector)
Basic Metal and Metal Products
(Incl.Iron & Steel)3159 65.23 3615 74.13 3711 75.87
Coal and Mining 99 46.90 320 61.11 326 61.14
All Engineering 389 19.47 416 20.81 422 15.35
Textiles 743 18.07 648 15.72 689 16.14
Infrastructure 1471 7.05 1541 7.08 1643 7.72
Of which: Power & Power Discom 618 5.88 830 8.78 1016 12.04
Constructions (Including EPC) 529 38.94 594 50.92 636 50.85
Other Industries
(including other Sectors)2438 2.46 2540 2.78 2436 2.67
TOTAL 8827 6.66 9675 7.69 9865 7.47
Industry
31.12.201631.03.2016 31.03.2017
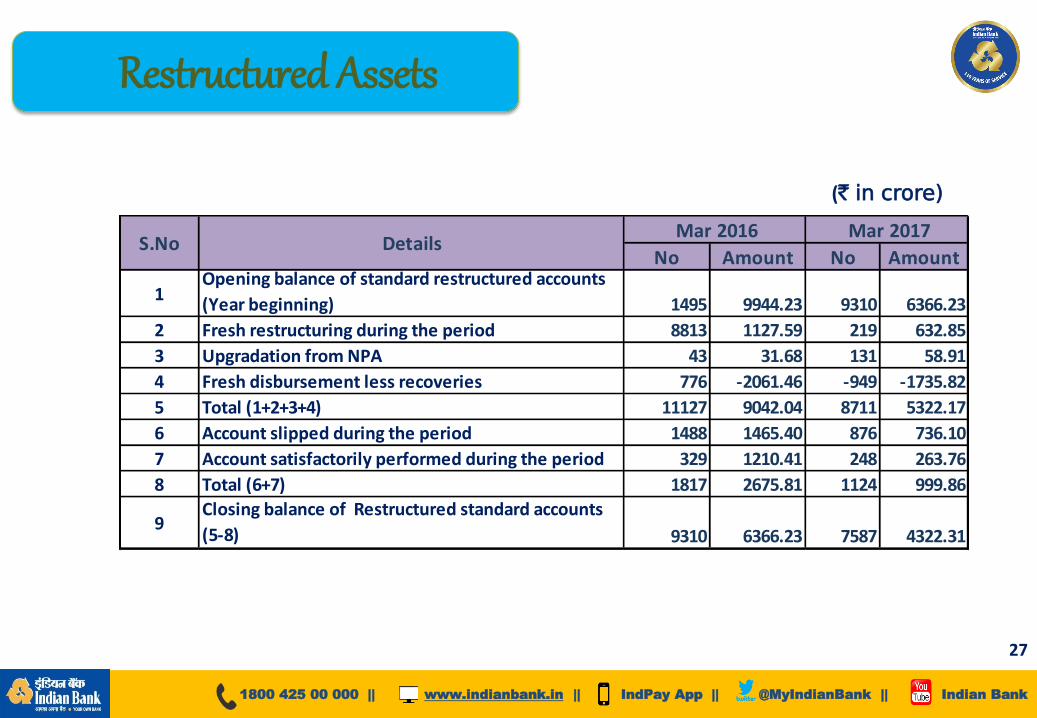
Restructured Assets
27
(` in crore)
1800 425 00 000 || www.indianbank.in || IndPay App || @MyIndianBank || Indian Bank
No Amount No Amount
1Opening balance of standard restructured accounts
(Year beginning) 1495 9944.23 9310 6366.23
2 Fresh restructuring during the period 8813 1127.59 219 632.85
3 Upgradation from NPA 43 31.68 131 58.91
4 Fresh disbursement less recoveries 776 -2061.46 -949 -1735.82
5 Total (1+2+3+4) 11127 9042.04 8711 5322.17
6 Account slipped during the period 1488 1465.40 876 736.10
7 Account satisfactorily performed during the period 329 1210.41 248 263.76
8 Total (6+7) 1817 2675.81 1124 999.86
9Closing balance of Restructured standard accounts
(5-8) 9310 6366.23 7587 4322.31
S.No Mar 2016
Details Mar 2017

Restructured Assets – Sector wise
28
(` in crore)
SectorAs on
31.03.2016
Of which:
Standard
As on
31.12.2016
Of which:
Standard
As on
31.03.2017
Of which:
Standard
Agriculture 111.60 54.22 94.83 43.47 65.89 25.39
Education 80.46 70.03 74.96 55.76 71.61 59.29
Home Loan 228.74 223.42 204.79 199.28 179.89 172.18
Non Priority 7930.58 5558.56 7950.09 5271.60 6545.64 3747.45
Other Priority 209.64 147.86 178.96 130.98 129.83 98.65
SME 429.84 312.15 352.30 244.19 323.22 219.34
Total 8990.86 6366.24 8855.93 5945.28 7316.08 4322.30
Restructured Advances - Sectorwise - Outstanding
1800 425 00 000 || www.indianbank.in || IndPay App || @MyIndianBank || Indian Bank

Restructured Assets – Major Industries
29
(` in crore)
Industry
Total
Outstanding as
on 31.03.2017
% share to
Total
Restructured
Of Which:
Standard
Infra-Power 2492.49 34.07 1899.42
Power discom 28.62 0.39 28.62
Road 620.48 8.48 620.48
Port 115.68 1.58 0.00
Iron & Steel 889.51 12.16 283.32
Contractor 470.08 6.43 62.88
Textiles 138.82 1.90 0.00
Sugar 290.34 3.97 290.34
Chemicals 53.52 0.73 53.52
Edu. Institution 172.34 2.36 141.83
Cement 39.79 0.54 21.64
Engineering 130.95 1.79 1.55
Other Industries 1454.86 19.89 591.81
Total 6868.86 94.29 3966.79
Restructured Advances - Major Industries
1800 425 00 000 || www.indianbank.in || IndPay App || @MyIndianBank || Indian Bank

Provisions
30
(` in crore)
1800 425 00 000 || www.indianbank.in || IndPay App || @MyIndianBank || Indian Bank
Provisions and ContingenciesQE
31.03.2016
QE
31.12.2016
QE
31.03.2017YE 2015-16 YE 2016-17
Total Provisions 742.92 647.69 750.46 2320.71 2595.03
Of which:
Provisions for NPAs 966.56 545.89 589.49 2399.19 2077.34
Provision on Investments 10.75 1.15 163.07 39.90 101.97
Provision towards Standard
Advances-92.72 7.10 -11.91 -134.91 15.00
Provision for Restructured Advances -47.32 -27.16 64.20 -235.46 -0.11
Income Tax -70.67 107.40 -56.46 243.92 352.56
Others -23.69 13.31 2.07 8.06 48.27

Investments
31
(` in crore)
(` in crore)
Gross Domestic Investment
(Without netting LAF) 53874 66800 67483
SLR 41203 55792 56788
Non SLR 12671 11008 10694
Held For Trading (HFT) 301 297 354
Available For Sale (AFS) 21737 27689 27697
Held To Maturity (HTM) 31836 38814 39431
Modified Duration Trading Portfolio 4.68 4.07 4.92
Parameters 31.03.1731.03.16 31.12.16
Central Government Securities 32928 42971 45542
State Government Securities 7065 9838 11210
Other Approved Securities 36 36 36
Debentures & Bonds 8727 8771 8923
Shares 571 551 683
Others 4547 4632 1089
Gross Domestic Investment
(Without netting LAF) 53874 66800 67483
Parameters 31.03.1731.03.16 31.12.16
1800 425 00 000 || www.indianbank.in || IndPay App || @MyIndianBank || Indian Bank

Shareholding Pattern
32
1800 425 00 000 || www.indianbank.in || IndPay App || @MyIndianBank || Indian Bank
Government of India, 82.10
Resident, 2.04
FI, 3.28
FII/FPI, 1.35
Mutual Funds, 4.93
NRI, 0.08
Corporate Body, 0.33
Clearing Member, 0.08
Trusts, 0.02
FPI, 5.64
Employees, 0.15
Others, 4.79
% of Holdings

Branch Network
33
Rural, 705
Semi Urban, 732
Urban, 594
Metro, 648
Overseas, 3
1.NORTHERN REGION
10%
2.NORTH EASTERN REGION
2%
3.EASTERN REGION
10%
4.CENTRAL REGION
8%
5.WESTERN REGION
8%
6.SOUTHERN REGION
62%
31.03.2017
25652682
31.03.2016 31.03.2017
No. of Branches (Global)
1800 425 00 000 || www.indianbank.in || IndPay App || @MyIndianBank || Indian Bank

Performance under 24*7 Banking
34
2784
3358
31.03.2016 31.03.2017
ATM/BNAs
52.69
58.33
31.03.2016 31.03.2017
Transactions on Digital Channels (in %)
1800 425 00 000 || www.indianbank.in || IndPay App || @MyIndianBank || Indian Bank

Digital Banking
35
31.03.2016 31.03.2017
676806
1101163
Mobile Banking Users
I
31.03.2016 31.03.2017
11247721408981
Internet Banking Users
31.03.2016 31.03.2017
136.94
162.65
ATM Card Base (in lakh)
1800 425 00 000 || www.indianbank.in || IndPay App || @MyIndianBank || Indian Bank

Digital Initiatives
36

Clientele Strength
37
No. of customers in Million
31.03.2016 31.03.2017
38.53
39.92Deposits
31.03.2016 31.03.2017
26.53
27.86CASA
31.03.2016 31.03.2017
3.93
4.08Advances
1800 425 00 000 || www.indianbank.in || IndPay App || @MyIndianBank || Indian Bank

Performance under PMJDY/PMSBY/PMJJBY/APY/PMMY
38
As on 31.03.2017Accounts/
Amount
Basic Savings Bank Deposit Accounts (BSBDAs) Opened under PMJDY 32.48 lakh
Balance outstanding under PMJDY Accounts (Amount ` in crore) 467.80
Overdraft Sanctioned under PMJDY Accounts (Amount ` in crore) 15.63
Applications enrolled under Pradhan Mantri Suraksha Bima Yojana
(PMSBY) (during the current financial year)6.90 lakh
Applications enrolled under Pradhan Mantri Jeevan Jyoti Bima Yojana
(PMJJBY) (during the current financial year) 17.48 lakh
Applications enrolled under Atal Pension Yojana 1.41 lakh
Disbursements under Pradhan Mantri Mudra Yojana (Amount ` in crore) 2173.71
Mobilisation under Gold Bond Scheme (Amount ` in crore) 218.80
1800 425 00 000 || www.indianbank.in || IndPay App || @MyIndianBank || Indian Bank

Awards & Accolades
39
1800 425 00 000 || www.indianbank.in || IndPay App || @MyIndianBank || Indian Bank
• India’s Best Bank Award from Financial Express for Strength & Soundness from Hon’ble Finance Minister, Shri. Arun Jaitley.
• Best Social Bank Award (under Large Bank Category) and Runner-up Award (under Large Bank Category) in Government Schemes at ASSOCHAM 12th Annual Business Summit-cum-Social Banking Excellence Awards 2016 from Shri Arjun Ram Meghwal, Hon’ble Minister of State for Finance.
• 2 MSME Banking Excellence Awards 2016 by Chamber of Indian Micro, Small, Medium Enterprises, New Delhi:
• Best MSME Bank Award (Mid - sized category) • Financially Inclusive Bank Award (Mid-sized category) • NABARD awarded first prize for SHG linkage programme, State Level Awards for Best
Performance in 2015-16. • 3 NPCI (National Payments Corporation of India) excellent performance Awards
under: “RuPay” - Winner. “National Automated Clearing House (NACH)” - Winner. “Aadhar Enabled Payment Systems (AEPS)” - Runner-up.

Awards & Accolades
40
1800 425 00 000 || www.indianbank.in || IndPay App || @MyIndianBank || Indian Bank
• Honoured by PFRDA by awarding “Third Rank” among Public Sector Banks on International Day for Elderly - NPS campaign.
• Best Performing Award for APY enrolment. • Six SKOCH Technology Innovation Awards for Techno Products:
‘Scan and Pay’ in Mobile app. ‘Geo -tagging’ - Mapping geographical co -ordinates of property and tagging it with
Core Banking Solution. ‘Digital challan’ – Feature available in app to minimize turnaround time by
dispensing with physical challan. ‘Green Pin’ for Credit/Debit cards and Net/mobile banking customers. ‘Online credit card transaction view’ in app for customers ‘Online branch/ATM room cleanliness feedback’ with photo from user through app
• ACI International award for innovation in Retail Category using Base24 ATM switch • Master Card award for Best Acquirer Business – PoS • Master Card award for Best Innovation- e Purse • Among Top 10 Banks issuing Rupay Cards.
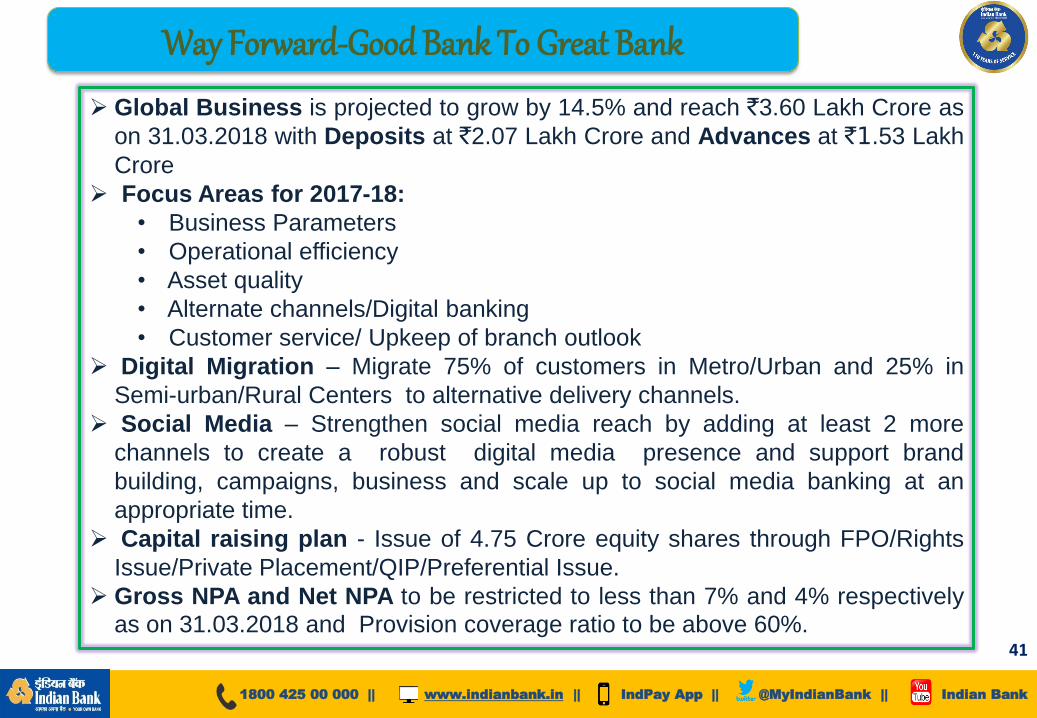
Way Forward-Good Bank To Great Bank
41
1800 425 00 000 || www.indianbank.in || IndPay App || @MyIndianBank || Indian Bank
Global Business is projected to grow by 14.5% and reach `3.60 Lakh Crore as
on 31.03.2018 with Deposits at `2.07 Lakh Crore and Advances at `1.53 Lakh
Crore
Focus Areas for 2017-18:
• Business Parameters
• Operational efficiency
• Asset quality
• Alternate channels/Digital banking
• Customer service/ Upkeep of branch outlook
Digital Migration – Migrate 75% of customers in Metro/Urban and 25% in
Semi-urban/Rural Centers to alternative delivery channels.
Social Media – Strengthen social media reach by adding at least 2 more
channels to create a robust digital media presence and support brand
building, campaigns, business and scale up to social media banking at an
appropriate time.
Capital raising plan - Issue of 4.75 Crore equity shares through FPO/Rights
Issue/Private Placement/QIP/Preferential Issue.
Gross NPA and Net NPA to be restricted to less than 7% and 4% respectively
as on 31.03.2018 and Provision coverage ratio to be above 60%.