youth detention population in australia 2019 (full
TRANSCRIPT

bulle
tin 1
48Bulletin 148 • February 2020
Youth detention population in Australia2019
SummaryThe bulletin compares the numbers and rates of young people aged 10 and over who were in youth detention in Australia due to their involvement, or alleged involvement, in crime. It focuses on trends over the 4-year period from the June quarter 2015 to the June quarter 2019.
There were 949 young people in detention on an average nightThere were 949 young people in youth detention on an average night in the June quarter 2019. The vast majority (90%) were male. Most detainees (83%) were aged 10–17, a rate of 3.3 per 10,000 young people in this age group. The other detainees were aged 18 or over.
Almost 2 in 3 (63%) young people in detention on an average night in the June quarter 2019 were unsentenced—that is, they were awaiting the outcome of their court matter or sentencing. The remainder were serving a sentence.
Numbers and rates of young people in detention have fluctuated over time Over the 4-year period from the June quarter 2015 to the June quarter 2019, the number of young people in detention on an average night fluctuated, with no clear trend. The number was lowest in the September quarter 2016 (806 young people), and highest in the March quarter 2018 (970).
The rate of young people aged 10–17 in detention fluctuated, at 2.8–3.5 per 10,000 each quarter over the 4-year period, but showed no consistent trend.
Rates for sentenced detention fell, while unsentenced detention showed no clear trend over timeIn the June quarter 2019, there were 2.3 per 10,000 young people aged 10–17 in unsentenced detention on an average night, and 1.0 per 10,000 in sentenced detention.
949
Detention
Unsentenced Sentenced

Youth detention population in Australia 2019Bulletin 148
2
The rates of young people in unsentenced detention varied over time, with no clear trend. Over the 4-year period, the rate of young people aged 10–17 in unsentenced detention ranged between 1.7 per 10,000 in the September quarter 2016 to 2.4 per 10,000 in the March quarter 2019.
For young people in sentenced detention, the rates varied, with an overall downward trend. The rates of young people in sentenced detention ranged from a high of 1.3 per 10,000 in the December quarter 2015 to a low of 0.9 per 10,000 in the March quarter 2019, before rising slightly to 1.0 per 10,000 in the most recent quarter.
More than half of those in detention were Aboriginal or Torres Strait Islander Just over half (53%) of all young people in detention on an average night in the June quarter 2019 were Aboriginal or Torres Strait Islander. Young Indigenous Australians aged 10–17 were 21 times as likely as young non-Indigenous Australians to be in detention on an average night, and this fluctuated, at 19–26 times the non-Indigenous rate over the 4-year period.
Trends vary across the states and territoriesThe number of young people in detention on an average night rose over the 4-year period in Victoria and Queensland, and fell in South Australia. Other states and territories showed no clear trend.
ContentsSummary �������������������������������������������������������������������������������������������������������������������������������������������������1
1 Introduction ���������������������������������������������������������������������������������������������������������������������������������������3
2 Trends in detention ��������������������������������������������������������������������������������������������������������������������������6
3 Trends in sentenced and unsentenced detention�����������������������������������������������������������������������8
4 Aboriginal and Torres Strait Islander young people ����������������������������������������������������������������� 11
5 State and territory trends �������������������������������������������������������������������������������������������������������������14
Technical notes �������������������������������������������������������������������������������������������������������������������������������������18
Acknowledgments �������������������������������������������������������������������������������������������������������������������������������22
Abbreviations ���������������������������������������������������������������������������������������������������������������������������������������22
Symbols �������������������������������������������������������������������������������������������������������������������������������������������������22
References ��������������������������������������������������������������������������������������������������������������������������������������������23
Related publications ����������������������������������������������������������������������������������������������������������������������������23
53%

3
1 IntroductionThis bulletin is part of an annual series that looks at trends in the numbers and rates of young people in secure detention facilities in Australia due to their involvement or alleged involvement in crime.
This bulletin and accompanying supplementary tables (those with a prefix of ‘S’) are available from www.aihw.gov.au/reports-data/health-welfare-services/youth-justice/overview.
Youth detention in AustraliaIn Australia, young people who are charged with, or proven guilty of, criminal offences may be supervised by state and territory youth justice agencies. Supervision may take place either in the community or in detention facilities.
Among the states and territories, variations in the numbers and rates of young people under supervision can reflect differences in youth justice legislation, policy and practice. This includes differences in police practices, the types of legal orders available and the options for diversion.
Principles of youth detention
Two main principles upon which the Australian youth justice system is based, and which are incorporated in state and territory legislation, are that young people should be detained only as a last resort and for the shortest appropriate period (Chrzanowski & Wallis 2011). This is consistent with international guidelines, such as the United Nations Convention on the Rights of the Child and the Standard Minimum Rules for the Administration of Juvenile Justice (United Nations 1985, 1989).
Diverting young people from further involvement in the justice system is crucial to applying these principles. Forms of diversion include:
• police warnings
• referral to services such as drug and alcohol treatment
• bail supervision for those at risk of remand
• youth justice conferencing.
Alternatives to detention include:
• transfer to specialist courts or programs
• supervised or unsupervised community orders.
As a result, most young people under supervision in Australia are supervised in the community.
On an average day in 2017–18, 83% of young people under supervision were supervised in the community, and just 18% were in detention (some were supervised in both the community and detention on the same day) (AIHW 2019). But 46% of those who were supervised during 2017–18 spent time in detention at some point during the year.

Youth detention population in Australia 2019Bulletin 148
4
Age limits
In Australia, young people may be charged with a criminal offence if they are aged 10 or over. Separate justice systems operate for young people and adults, each with specific legislation. The upper age limit in the youth justice system is 17 (at the time of the offence) in all states and territories. Those aged 18 or over are dealt with under criminal legislation relating to adults.
In Queensland, legislation to increase the youth justice age limit to 17 was passed in 2016, and was enacted in February 2018. Before then, the age limit in Queensland was 16, and young people aged 17 or over were treated as adults.
From February 2018, young people aged 17 have been transferred from the adult justice system into the youth justice system. This has led to increases in the number of young people held in youth justice detention in Queensland and the national detention rate.
In 2017–18, about 12% of young people under supervision on an average day were aged 18 or over (AIHW 2019). Reasons for this include that:
• young people may be apprehended for an offence that was committed or allegedly committed when they were aged 17 or younger
• young people may continue to be supervised by the youth justice system once they turn 18 (or they may be transferred to the adult correctional system)
• some young people aged 18 or over are supervised by youth justice agencies due to their vulnerability or immaturity (in some jurisdictions)
• young people aged 18–20 in Victoria who appear in courts other than the Children’s Court may be sentenced to detention in a youth facility rather than an adult prison if assessed as suitable and the court deems this appropriate. This is known as the ‘dual track’ sentencing system.
In this bulletin, the term ‘young people’ is used to refer to individuals aged 10 and over who are supervised by a youth justice agency. Numbers of young people in detention relate to young people of all ages unless otherwise specified.
Population rates allow for the comparison of different groups while taking into account different population sizes. In this bulletin, rates are calculated only for young people aged 10–17, as this is the key population in most states and territories. For more information about the calculation of age, see ‘Technical Notes’.
Sentenced and unsentenced detention
Young people might be in detention while they are:
• unsentenced—that is, while awaiting the outcome of their court matter, or while awaiting sentencing after being found or pleading guilty
• sentenced—when they have been found guilty in court and have received a legal order to serve a period of detention.
Whether a young person is unsentenced or sentenced is known as their ‘legal status’.

5
Most young people in unsentenced detention have been remanded in custody by a court until their next court appearance. In 2017–18, the vast majority (98%) of young people in unsentenced detention on an average day were on remand (AIHW 2019). The remainder were in police referred detention—that is, they were detained before their first court appearance (which is possible in most states and territories).
But more than one-third (35%) of those who were in unsentenced detention during 2017–18 experienced police-referred detention at some time during the year.
In this bulletin, young people who are both sentenced and unsentenced at the same time (for example, for 2 different matters) are counted as sentenced.
Youth detention dataThis bulletin looks at the number of young people in detention on an average night in each quarter over the 4-year period from the June quarter 2015 to the June quarter 2019. Each quarter covers 3 months of the year, and is identified with reference to the last month in the quarter (for example, the March quarter comprises January, February, and March).
The states and territories provided data on the average nightly number of young people in detention each quarter between July 2018 and June 2019. These data supplement the Juvenile Justice National Minimum Data Set ( JJ NMDS). For more information, see ‘Technical Notes’.
Queensland’s 2018–19 detention data include sentenced and unsentenced young people in detention centres and other custodial settings. In Queensland, ‘other custodial settings’ includes young people held in police watch houses under remand and sentenced detention, which is unique compared with other jurisdictions.
Trends in the detention population
The number of young people in detention on an average night is relatively small, and the amount of random variation from quarter to quarter is more noticeable when numbers are small. This might affect the appearance and interpretation of trends, and these should be interpreted with caution, particularly where they relate to small populations.
In this bulletin, comparisons are made between the June quarter 2019 and the June quarter 1 year earlier (2018) and 4 years earlier (2015). The same quarters are compared across years to minimise the effect of seasonal variation.
Previous analyses have indicated that there appears to be some seasonal variation in the numbers of young people in sentenced and unsentenced detention each year (AIHW 2019), but this is yet to be fully investigated or explained.
This bulletin aims to summarise key trends over the 1-year and 4-year periods, although there might be fluctuations between quarters.
For more data, including counts of young people who enter the youth justice system throughout the year, and trends over 10 years up to 2017–18, see Youth Justice in Australia 2017–18, at www.aihw.gov.au/reports/youth-justice/youth-justice-australia-2017-18/contents/table-of-contents.

Youth detention population in Australia 2019Bulletin 148
6
Figure 2.1: Young people in detention on an average night, by age group, June quarter 2015 to June quarter 2019 (number)
2 Trends in detention
NumbersOn an average night in the June quarter 2019, there were 949 young people in youth detention in Australia due to their involvement, or alleged involvement, in crime (Figure 2.1).
Over the 4-year period from the June quarter 2015 to the June quarter 2019, the number of young people in detention on an average night fluctuated, at 806–970, with no clear trend (Table S7).
On an average night in the June quarter 2019, most (785 or 83%) young people in detention were aged 10–17. The remainder (163 or 17%) were aged 18 or over. The average nightly population is rounded to whole numbers, so components might not sum to the totals due to rounding (see ‘Technical Notes’).
The number of young people aged 10–17 in detention fluctuated over the 4-year period, while the number aged 18 or over remained steady. The lowest number of young people aged 10–17 was in the September quarter 2016 (653 or 81%), and the highest was in the June quarter 2017 (816 or 85%).
In the June quarter 2019, 9 in 10 (853 or 90%) young people in detention on an average night were male. This was the case in all quarters throughout the 4-year period (90%–92%).
Sources: Tables S7, S8, and S9.
2015Jun Sep Dec
2016Mar Jun Sep Dec
2017Mar Jun Sep Dec
2018Mar Jun Sep Dec
2019Mar Jun
Quarter
0
200
400
600
800
1,000
1,200Total18+10–17
Average nightly population

7
RatesOn an average night in the June quarter 2019, the rate of young people aged 10–17 in detention was 3.3 per 10,000 (Figure 2.2). This rate fluctuated, at 2.8–3.5 per 10,000 each quarter over the 4-year period, with no consistent trend over time. It was lowest in the September quarter 2016, and highest in the June quarter 2017.
The rate remained relatively steady, at 3.1–3.3 per 10,000 during the most recent year.
Figure 2.2: Young people aged 10–17 in detention on an average night, June quarter 2015 to June quarter 2019 (rate)
Source: Table S10.
2015Jun Sep Dec
2016Mar Jun Sep Dec
2017Mar Jun Sep Dec
2018Mar Jun Sep Dec
2019Mar Jun
Quarter
0
1
2
3
4
Number per 10,000

Youth detention population in Australia 2019Bulletin 148
8
3 Trends in sentenced and unsentenced detention
NumbersOn an average night in the June quarter 2019, almost 2 in 3 (599 or 63%) young people in detention were unsentenced. The remainder (349 or 37%) were serving a sentence (Figure 3.1).
The number of young people in unsentenced detention rose over the 4-year period, with a low of 430 in the September quarter 2016 and a high of 619 in the March quarter 2019.
In unsentenced detention, while numbers fluctuated over the 4 years, they tended to be higher in the March and June quarters each year (Table S17).
The number of young people in sentenced detention showed no clear trend. It ranged from a high of 422 young people on an average night in the December quarter 2015 to a low of 327 in the March quarter 2019, with several fluctuations in this period (Table S27).
During the most recent year, the number in unsentenced detention was lowest in the September quarter 2018 (542 or 58%), and highest in the March quarter 2019 (619 or 65%), with variation over time.
For sentenced detention in the most recent year, the number was highest in the September quarter 2018 (390 or 42%), and lowest in the March quarter 2019 (327 or 35%).
Figure 3.1: Young people in detention on an average night, by legal status, June quarter 2015 to June quarter 2019 (number)
Sources: Tables S17 and S27.
2015Jun Sep Dec
2016Mar Jun Sep Dec
2017Mar Jun Sep Dec
2018Mar Jun Sep Dec
2019Mar Jun
Quarter
0
100
200
300
400
500
600
700 UnsentencedSentenced
Average nightly population

9
In the June quarter 2019, a higher proportion of those in unsentenced detention were aged 10–17 (92%), compared with sentenced detention (67%) (tables S17, S18, S27, and S28). This difference occurred throughout the 4-year period, with:
• 92%–95% of those in unsentenced detention being aged 10–17
• 65%–70% of those in sentenced detention being aged 10–17.
One reason more young people aged 18 and over are in sentenced detention than in unsentenced detention is that some might continue serving a sentence in a youth facility once they turn 18. Whether they remain in youth detention or are moved to the adult justice system depends on different policies and practices in the states and territories.
In Victoria, 56%–74% of young people in sentenced detention were aged 18 or over in each quarter over the 4-year period, compared with 30%–35% in Australia overall. This is in part due to the ‘dual track’ sentencing system operating in Victoria, which results in a relatively large proportion of young people aged 18 and over in sentenced detention (see Chapter 1 for more details).
On an average night in the June quarter 2019, a higher proportion of females (78%) than males (62%) in detention were unsentenced (tables S7 and S17). This was the case in each quarter throughout the 4-year period, with:
• 70%–80% of females in detention being unsentenced
• 50%–64% of males in detention being unsentenced.
But due to the small number of females in detention, these results should be interpreted with caution.
RatesOn an average night in the June quarter 2019, 2.3 per 10,000 young people aged 10–17 were in unsentenced detention, and 1.0 per 10,000 were in sentenced detention (Figure 3.2).
Over the 4-year period, the rate of young people aged 10–17 in unsentenced detention rose slightly, but showed no clear trend over time. Rates fluctuated between 1.7 per 10,000 young people in the September quarter 2016 and 2.4 per 10,000 in the March quarter 2017.
As with the numbers, the rate of young people in unsentenced detention tended to be higher in the March and June quarters each year, and lower in the September and December quarters.
Over the same period, the rate of young people aged 10–17 in sentenced detention fell slightly, it was highest in the December quarter 2015, at 1.3 per 10,000, and lowest in the March quarter 2019, at 0.9 per 10,000.
In the most recent year, 2.1–2.4 young people per 10,000 aged 10–17 were in unsentenced detention, and 0.9–1.1 per 10,000 were in sentenced detention.

Youth detention population in Australia 2019Bulletin 148
10
Figure 3.2: Young people aged 10–17 in detention on an average night, by legal status, June quarter 2015 to June quarter 2019 (rate)
Sources: Tables S20 and S30.
2015Jun Sep Dec
2016Mar Jun Sep Dec
2017Mar Jun Sep Dec
2018Mar Jun Sep Dec
2019Mar Jun
Quarter
0.0
0.5
1.0
1.5
2.0
2.5
3.0 UnsentencedSentenced
Number per 10,000

4 Aboriginal and Torres Strait Islander young people
NumbersYoung Aboriginal and Torres Strait Islander people made up about half (500 or 53%) of all those in detention on an average night in the June quarter 2019 (Figure 4.1).
On an average night in each quarter, 50%–57% of young people in detention were Aboriginal or Torres Strait Islander, and 43%–50% of young people were non-Indigenous (tables S1 and S4).
The number of young Indigenous Australians in detention was slightly higher than young non-Indigenous Australians on an average night in every quarter throughout the 4-year period, but showed no clear trend over time.
A higher proportion of young Indigenous Australians in detention were aged 10–17 than young non-Indigenous Australians (Figure 4.2).
In the June quarter 2019:
• 89% of young Indigenous Australians in detention were aged 10–17
• 76% of young non-Indigenous Australians in detention were aged 10–17.
Among young people aged 10–17, about 57% of those in detention in the June quarter 2019 were Aboriginal or Torres Strait Islander. This was fairly consistent over the 4-year period at 55%–62%. Over the same period, young Indigenous Australians made up 6% of the Australian population aged 10–17 (Table S31).
Figure 4.1: Young people in detention on an average night, by Indigenous status, June quarter 2015 to June quarter 2019 (number)
11
Sources: Tables S1 and S4.
2015Jun Sep Dec
2016Mar Jun Sep Dec
2017Mar Jun Sep Dec
2018Mar Jun Sep Dec
2019Mar Jun
Quarter
0
100
200
300
400
500
600
700Non-IndigenousIndigenous
Average nightly population

Youth detention population in Australia 2019Bulletin 148
12
On an average night in the June quarter 2019, the proportions of Indigenous and non-Indigenous males aged 10–17 in detention were the same (both 89%).
This was consistent with the total population of young people in detention over the 4-year period, with males representing 90%–92% of all young people in detention (Table S7).
On an average night in the June quarter 2019, 55% of young people in unsentenced detention and 49% in sentenced detention were Aboriginal and Torres Strait Islander.
Over the 4-year period, young Indigenous Australians made up a higher proportion of those in unsentenced detention (52%–59% each quarter) than those is sentenced (45%–54%).
Over the same period, the number of young Indigenous Australians in unsentenced detention varied—from 274 in the June quarter 2015 to 329 in the June quarter 2019—with no clear trend.
The number of young Indigenous Australians in sentenced detention fell from 210 in the June quarter 2015 to 170 in the June quarter 2019 (tables S11, S17, S21, and S27).
RatesIndigenous over-representation in youth detention can be expressed as a rate ratio, which compares the rate of young Indigenous Australians to that of young non-Indigenous Australians (see ‘Technical Notes’ for more details).
Figure 4.2: Young people in detention on an average night, by Indigenous status and age group, June quarter 2015 to June quarter 2019 (number)
Note: Trends among small populations should be interpreted with caution. Numbers tend to fluctuate from quarter to quarter due to random variation, and this might affect the appearance and interpretation of trends.
Sources: Tables S2, S3, S5, and S6.
2015Jun Sep Dec
2016Mar Jun Sep Dec
2017Mar Jun Sep Dec
2018Mar Jun Sep Dec
2019Mar Jun
Quarter
0
100
200
300
400
500
600
700
Non-Indigenous—18+Non-Indigenous—10–17Indigenous—18+Indigenous—10–17
Average nightly population

13
Nationally, on an average night in the June quarter 2019, 31 per 10,000 young Indigenous Australians aged 10–17 were in detention, compared with 1.5 per 10,000 young non-Indigenous Australians.
This means that young Indigenous Australians aged 10–17 were 21 times as likely as young non-Indigenous Australians to be in detention on an average night in the June quarter 2019 (Table S10).
The rate of young Indigenous Australians aged 10–17 in detention on an average night showed no clear trend over the 4-year period, with a low of 27 per 10,000 in September 2016 and a high of 35 per 10,000 in the March quarter 2017.
Over the 4-year period, the level of Indigenous over-representation fluctuated, at a rate 19–26 times the non-Indigenous rate. The rate ratio was higher in sentenced detention than in unsentenced detention, until the December quarter 2017. After this period, the rate ratios of sentenced and unsentenced detention were relatively similar (Figure 4.3).
In unsentenced detention, the rate ratio fluctuated, at 18–24 times the non-Indigenous rate. In sentenced detention, the rate ratio fluctuated, at 18–30 times the non-Indigenous rate.
From the June quarter 2015 to the June quarter 2019, the rate of young Indigenous Australians in sentenced detention steadily declined—from 13 per 10,000 to 9.3 per 10,000. The rate of young Indigenous Australians in unsentenced detention fluctuated over time, with no clear trend.
The non-Indigenous rates of sentenced and unsentenced detention were relatively steady over time, with no clear trends.
Figure 4.3: Young Indigenous Australians aged 10–17 in detention, by legal status, June quarter 2015 to June quarter 2019 (rate ratio)
Note: Rate ratio is calculated by dividing the Indigenous rate by the non-Indigenous rate.
Sources: Tables S10, S20, and S30.
2015Jun Sep Dec
2016Mar Jun Sep Dec
2017Mar Jun Sep Dec
2018Mar Jun Sep Dec
2019Mar Jun
Quarter
0
5
10
15
20
25
30
35
40TotalUnsentencedSentenced
Rate ratio

Youth detention population in Australia 2019Bulletin 148
14
5 State and territory trends
NumbersNew South Wales had the largest number of young people in detention throughout the 4-year period (253–313 young people each quarter), followed by Queensland (146–270), Victoria (140–200), and Western Australia (122–163) (Figure 5.1).
Over the period, the size of the youth detention population rose in Victoria and Queensland, and fell in South Australia. Other states and territories showed no clear trend.
For Queensland, the number of young people in detention on an average day rose in part due to the transfer of young people aged 17 from detainment in the adult justice system to youth justice detention, from February 2018.
Before then, the number of young people in detention in Queensland fluctuated, at 146–202 between the June quarter 2015 to the December quarter 2017. It then rose to 213 in the March quarter 2018, and to 270 young people in the March quarter 2019, after which it declined.
Figure 5.1: Young people in detention on an average night, by state and territory, June quarter 2015 to June quarter 2019 (number)
Notes
1. In Queensland, legislation to increase the age limit in the youth justice system from 16 to 17 was enacted in the March quarter 2018. This resulted in an increase in young people aged 17 under youth justice supervision.
2. Trends among small populations should be interpreted with caution. Numbers tend to fluctuate from quarter to quarter due to random variation, and this might affect the appearance and interpretation of trends.
Source: Table S7.
2015Jun Sep Dec
2016Mar Jun Sep Dec
2017Mar Jun Sep Dec
2018Mar Jun Sep Dec
2019Mar Jun
Quarter
0
100
200
300
400
NTACTTasSAWAQldVicNSW
Average nightly population

15
RatesOn an average night in the June quarter 2019, the rate of young people aged 10–17 in detention ranged from 2.0 per 10,000 in the Australian Capital Territory to 11 per 10,000 in the Northern Territory (Figure 5.2; Table 5.1).
Over the 4-year period, the Northern Territory consistently had the highest rate of young people in detention on an average night each quarter (11–22 per 10,000 aged 10–17), while Victoria (1.5–2.2 per 10,000) and Tasmania (1.2–3.1 per 10,000) were generally lower (Table S10).
Rates of detention fluctuated from quarter to quarter, particularly among the smaller jurisdictions, due to the small numbers.
Over the most recent year from the June quarter 2018 to the June quarter 2019, rates fell in the Northern Territory and fluctuated in most jurisdictions, with no clear patterns and little overall change.
Figure 5.2: Young people aged 10–17 in detention on an average night, by state and territory, June quarter 2015 to June quarter 2019 (rate)
Notes
1. In Queensland, legislation to increase the age limit in the youth justice system from 16 to 17 was enacted in the March quarter 2018. This resulted in an increase in young people aged 17 under youth justice supervision.
2. Trends among small populations should be interpreted with caution. Numbers tend to fluctuate from quarter to quarter due to random variation, and this might affect the appearance and interpretation of trends.
Source: Table S10.
2015Jun Sep Dec
2016Mar Jun Sep Dec
2017Mar Jun Sep Dec
2018Mar Jun Sep Dec
2019Mar Jun
Quarter
0
5
10
15
20
25
30Number per 10,000
NTACTTasSAWAQldVicNSW

Youth detention population in Australia 2019Bulletin 148
16
Table 5.1: Young people in detention on an average night, by state and territory, June quarter 2015, 2018, and 2019 (number and rate)
NSW Vic Qld WA SA Tas ACT NT Australia
Number
Sentenced detention
June quarter 2015 165 77 27 90 23 5 2 18 407
June quarter 2018 123 116 31 78 20 5 5 19 397
June quarter 2019 105 100 46 59 23 5 3 8 349
Unsentenced detention
June quarter 2015 147 62 143 60 29 6 6 21 475
June quarter 2018 167 74 201 75 17 8 7 23 571
June quarter 2019 160 99 211 77 16 11 6 19 599
Total detention
June quarter 2015 313 140 170 150 53 10 9 39 882
June quarter 2018 290 189 232 152 37 13 12 42 967
June quarter 2019 265 199 257 136 39 16 9 28 949
Rate (number per 10,000)
Sentenced detention
June quarter 2015 1.68 0.39 0.54 3.22 0.73 n.p. n.p. 7.00 1.24
June quarter 2018 1.24 0.81 0.60 2.52 0.58 n.p. n.p. 7.32 1.13
June quarter 2019 0.90 0.62 0.79 1.96 1.41 1.01 n.p. 3.22 0.97
Unsentenced detention
June quarter 2015 1.81 1.10 2.97 2.40 1.74 n.p. 1.64 8.34 1.99
June quarter 2018 2.00 1.15 3.95 2.98 1.02 1.42 1.64 9.05 2.30
June quarter 2019 1.78 1.52 3.82 3.00 0.97 2.09 1.68 7.44 2.29
Total detention
June quarter 2015 3.49 1.49 3.51 5.62 2.47 1.70 1.97 15.34 3.23
June quarter 2018 3.24 1.96 4.55 5.50 1.60 2.18 2.50 16.37 3.44
June quarter 2019 2.68 2.13 4.61 4.96 2.38 3.10 1.96 10.66 3.26
Notes
1. Numbers might not add up to the total due to rounding.
2. Rates are for young people aged 10–17. Numbers include young people aged 18 or over who are under youth justice supervision. For numbers of young people aged 10–17 only, refer to the supplementary tables.
3. Trends among small populations should be interpreted with caution. Numbers tend to fluctuate from quarter to quarter due to random variation, and this might affect the appearance and interpretation of trends.
4. Rates are calculated from the unrounded average nightly populations, and are not published when there are fewer than 5 young people in the numerator. There might be instances when a numerator is presented as 5 due to rounding, and the rate is not calculated (see ‘Technical Notes’).
5. In Queensland, legislation to increase the age limit in the youth justice system from 16 to 17 was enacted in the March quarter 2018. This resulted in an increase in young people aged 17 under youth justice supervision.
Sources: Tables S7, S10, S17, S20, S27, and S30.

17
Sentenced and unsentenced detention
On an average night in the June quarter 2019, the rate of young people aged 10–17:
• in unsentenced detention ranged from 1.0 per 10,000 in South Australia to 7.4 per 10,000 in the Northern Territory
• in sentenced detention ranged from 0.6 per 10,000 in Victoria to 3.2 per 10,000 in the Northern Territory (Table 5.1).
Over the 4-year period, the rate of young people in unsentenced detention on an average night rose in Queensland and declined in South Australia. Other states showed no clear trend.
Over the same period, the rate of young people in sentenced detention fell in New South Wales, Western Australia, and the Northern Territory. Trends could not be reliably determined in Tasmania and the Australian Capital Territory, and other states showed no clear trend.
Young Aboriginal and Torres Strait Islander people
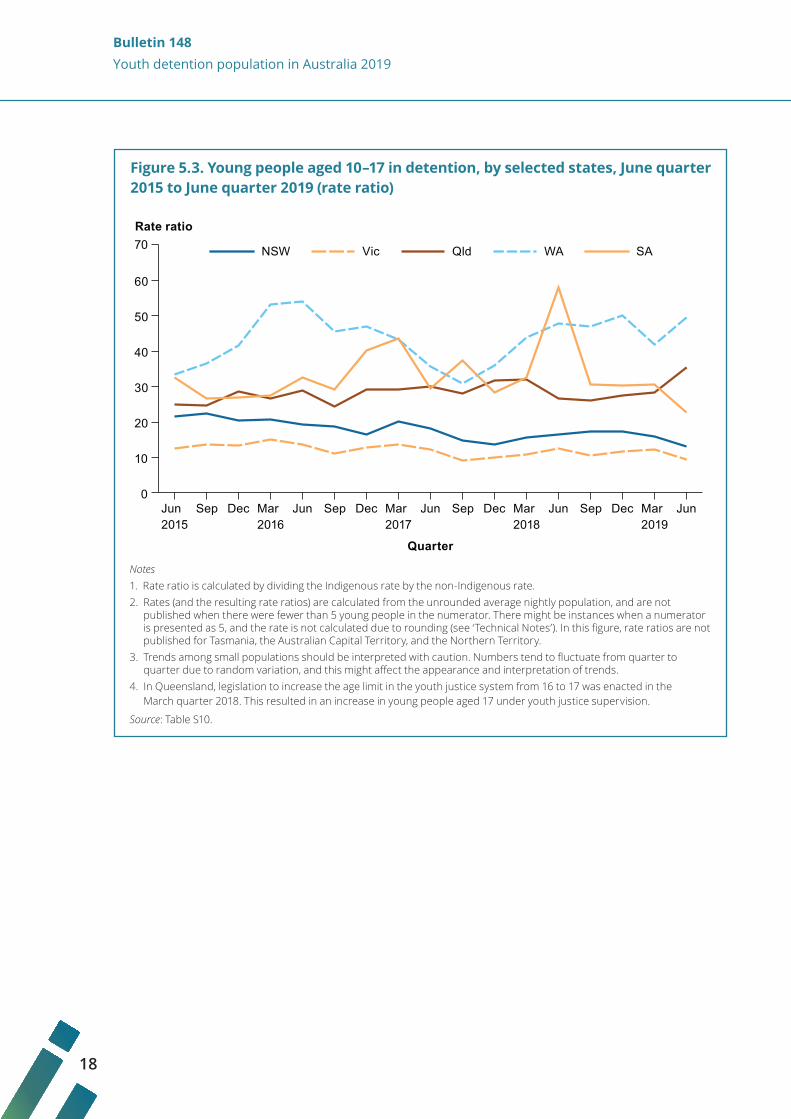
On an average night in the June quarter 2019, the rate of young Indigenous Australians aged 10–17 in detention ranged from 11 per 10,000 in Tasmania to 57 per 10,000 in Western Australia. The non-Indigenous rate ranged from 1.2 per 10,000 in Western Australia and South Australia to 2.2 per 10,000 in Tasmania (Table S10).
Among the states and territories for which rate ratios could be calculated, the rate ratio ranged from 5.2 times the non-Indigenous rate in Tasmania to 49 times in Western Australia in the June quarter 2019 (Table S10).
Over the 4-year period, the rate of young Indigenous Australians aged 10–17 in detention fell in New South Wales and South Australia, and rose in Queensland. The rate ratio was lowest in Victoria, at 9.1–15, and highest in Western Australia, at 31–54 (Figure 5.3).
Due to the small rates of young non-Indigenous Australians in detention, notably in Western Australia and South Australia, variances can cause large fluctuations in the rate ratio.
Rate ratios could not be calculated for the:
• Australian Capital Territory, due to the small number of Indigenous Australians
• Northern Territory, due to the small number of non-Indigenous Australians.
Youth detention population in Australia 2019Bulletin 148
18
Figure 5.3. Young people aged 10–17 in detention, by selected states, June quarter 2015 to June quarter 2019 (rate ratio)
Notes 1. Rate ratio is calculated by dividing the Indigenous rate by the non-Indigenous rate. 2. Rates (and the resulting rate ratios) are calculated from the unrounded average nightly population, and are not
published when there were fewer than 5 young people in the numerator. There might be instances when a numerator is presented as 5, and the rate is not calculated due to rounding (see ‘Technical Notes’). In this figure, rate ratios are not published for Tasmania, the Australian Capital Territory, and the Northern Territory.
3. Trends among small populations should be interpreted with caution. Numbers tend to fluctuate from quarter to quarter due to random variation, and this might affect the appearance and interpretation of trends.
4. In Queensland, legislation to increase the age limit in the youth justice system from 16 to 17 was enacted in the March quarter 2018. This resulted in an increase in young people aged 17 under youth justice supervision.
Source: Table S10.
2015Jun Sep Dec
2016Mar Jun Sep Dec
2017Mar Jun Sep Dec
2018Mar Jun Sep Dec
2019Mar Jun
Quarter
0
10
20
30
40
50
60
70 SAWAQldVicNSW
Rate ratio

19
Technical Notes
Youth detention data sourcesThis bulletin was compiled using 2 data sources. States and territories provided data on the average nightly population per quarter between July 2018 and June 2019. These data were used to supplement the 2017–18 JJ NMDS, which contains data up to and including 30 June 2018 for all states and territories.
This report is not comparable with previous editions of Youth detention population in Australia. Data in previous editions contained non-standard data for the Northern Territory, as well as differences in data formats, specifications, definitions and/or quality across jurisdictions. Comparisons between JJ NMDS and youth detention population data should be made with caution.
A data quality statement for the JJ NMDS 2017–18 is available at https://meteor.aihw.gov.au/content/index.phtml/itemId/715286.
Youth detention reportsIn addition to this bulletin, the Australian Institute of Health and Welfare (AIHW) also publishes the annual Youth justice in Australia report series, which provides comprehensive information on young people under youth justice supervision.
The presentation of data in this bulletin is slightly different from the presentation in Youth justice in Australia:
• This bulletin presents the average nightly population for each quarter, while Youth justice in Australia presents the average daily population for each year. These data are reported differently because unit record data are not available for all reporting years for the youth detention population in Australia.
• Young people who are concurrently unsentenced and sentenced are classified as sentenced in this bulletin, but are counted separately as both unsentenced and sentenced in Youth justice in Australia (although they are only counted once in the total detention population in both publications).
MethodsThis section provides key information about the methods used in this bulletin.
Age
In this bulletin, numbers of young people in detention include all age groups unless otherwise specified. Population rates include young people aged 10–17 only (see ‘Rates’ in this section).
Age is calculated at the start of the relevant quarter, unless the period of detention began within the quarter, in which case age is calculated as at the start of the detention period.
Where a young person was in more than 1 type of detention (both unsentenced and sentenced), their age can vary across tables because age is calculated from the start of each relevant detention period. This means that, for a particular age group, the total number of young people in detention might not be the sum of the number of young people in sentenced and unsentenced detention.

Youth detention population in Australia 2019Bulletin 148
20
Average nightly population
The average nightly population is calculated by adding the duration (in nights) of each period of detention that falls within the quarter, and dividing the summed duration by the number of nights in the quarter.
Indigenous status
Information on Indigenous status has been collected since the implementation of the JJ NMDS. Nationally, the proportion of young people with ‘not stated’ Indigenous status was 0.4%–0.8% each quarter between the June quarter 2015 and the June quarter 2019. This proportion was low (2.4% or less each quarter) in all states and territories. But information on the proportion of young Indigenous Australians who are correctly reported as Indigenous is not available.
Changes in the collection and recording of Indigenous status can affect rates of Indigenous identification over time.
There are some differences in the ways states and territories collect information about Indigenous status. Not all jurisdictions use the national standard question and standard codes for recording Indigenous status, as recommended by the Australian Bureau of Statistics. But some jurisdictions have taken steps to improve their data collection forms and information systems in recent years.
See Aboriginal and Torres Strait Islander identification in community services data collections: an updated data quality report (AIHW 2012) for more information.
Legal status
Young people who are both sentenced and unsentenced at the same time (that is, serving multiple or concurrent supervision orders) are classified as ‘sentenced’ in this bulletin.
Rates
Population rates enable different groups to be compared, while taking into account different population sizes. Because there are differences between the states and territories in the extent to which young people aged 18 or over can be detained in youth justice facilities, rates are restricted to those aged 10–17. Crude rates are presented in this bulletin.
The number of young people in detention on an average night during a quarter is rounded to the nearest person. The rate is calculated using the number on an average day before rounding.
In the text of this bulletin, rates are presented to 1 decimal place for rates less than 10, and to the nearest whole number for rates 10 and over. Rates are presented to 2 decimal places in the tables. As a result, rates calculated by using the average nightly population rounded to whole numbers might differ slightly from the rates presented in this bulletin.
Due to a lack of statistical reliability, rates are not calculated where there are fewer than 5 young people in the numerator. In some instances, the number of young people might be presented as 5, but the rate might not be calculated due to rounding (for example, if there are 4.7 young people in detention on an average night, this will appear as 5 in the table, but the rate will not be calculated). But these young people contribute to overall state and national

21
rates. The calculation of rates for young Indigenous and non-Indigenous Australians excludes young people with unknown Indigenous status.
Population data used in the calculation of rates are provided in Table S31.
Rate ratios
Rates for different groups can be compared using a rate ratio, which is the ratio of 2 rates. In this bulletin, rate ratios are used to compare Indigenous and non-Indigenous rates, and to provide a measure of the level of Indigenous over representation. Rate ratios are calculated by dividing the Indigenous rate by the non-Indigenous rate.
Rate ratios should be interpreted with caution where there are small denominators, rare events, and rates that converge while declining.
Due to a lack of statistical reliability, rate ratios in this bulletin are not calculated where 1 or both of the rates have fewer than 5 young people in the numerator. But these young people contribute to overall state and national rate ratios.
Rounding
The average nightly population is rounded to whole numbers, so components might not sum to the totals.
Rate ratios were calculated using rates rounded to 2 decimal places. Proportions were calculated using average nightly numbers rounded to whole numbers. Numbers and rates displayed in figures are rounded, as presented in the supplementary tables.

Youth detention population in Australia 2019Bulletin 148
22
AcknowledgmentsDr Simone Georg authored this bulletin. Ms Callin Ivanovici, Dr Russell Reid, Ms Anna Ritson and Ms Louise York gave valuable guidance and support. The author gratefully acknowledges the contributions, comments and advice from the Youth Justice Data and Information Group.
Funding for this bulletin was provided by the Australasian Youth Justice Administrators.
Thanks are extended to the data managers and staff in the following state and territory departments:
• Department of Communities and Justice, New South Wales
• Department of Justice and Community Safety, Victoria
• Department of Youth Justice, Queensland
• Department of Justice, Western Australia
• Department for Human Services, South Australia
• Department of Communities Tasmania, Tasmania
• Community Services Directorate, Australian Capital Territory
• Territory Families, Northern Territory.
AbbreviationsACT Australian Capital Territory
AIHW Australian Institute of Health and Welfare
JJ NMDS Juvenile Justice National Minimum Data Set
NSW New South Wales
NT Northern Territory
Qld Queensland
SA South Australia
Tas Tasmania
Vic Victoria
WA Western Australia
Symbols— nil or rounded to zero
n.a. not available
n.p. not publishable because of small numbers, confidentiality or other concerns about the quality of the data

23
ReferencesAIHW (Australian Institute of Health and Welfare) 2012. Aboriginal and Torres Strait Islander identification in community services data collections: an updated data quality report. Cat. no. AIHW 80. Canberra: AIHW.
AIHW 2019. Youth justice in Australia 2017–18. Cat. no. JUV 129. Canberra: AIHW.
Chrzanowski A & Wallis R 2011. Understanding the youth justice system. In: Stewart A, Allard T & Dennison S (eds). Evidence based policy and practice in youth justice. Annandale: The Federation Press, 7–27.
United Nations 1985. United Nations Standard Minimum Rules for the Administration of Juvenile Justice (‘The Beijing Rules’). New York: United Nations. Viewed 2 August 2013, www.ohchr.org/Documents/ProfessionalInterest/beijingrules.pdf.
United Nations 1989. Convention on the Rights of the Child. New York: United Nations. Viewed 2 August 2013, www.ohchr.org/en/professionalinterest/pages/crc.aspx.
Related publicationsThis report, Youth detention population in Australia 2019, is part of an annual series. Earlier editions and any published subsequently can be downloaded for free from www.aihw.gov.au/reports-data/health-welfare-services/youth-justice/overview. The website also includes information on ordering printed copies.
The following AIHW publications might also be of interest:
• AIHW 2018. National data on the health of justice-involved young people: a feasibility study 2016–17. Cat. no. JUV 125. Canberra: AIHW.
• AIHW 2019. Young people in child protection and under youth justice supervision 1 July 2014 to 30 June 2018. Data linkage series no. 25. Cat. no. CSI 27. Canberra: AIHW.
• AIHW 2019. Young people returning to sentenced youth justice supervision 2017–18. Juvenile justice series no. 23. Cat. no. JUV 130. Canberra: AIHW.
• AIHW 2019. Youth justice in Australia 2017–18. Cat. no. JUV 129. Canberra: AIHW.

Stronger evidence, better decisions, improved health and welfare
aihw.gov.au
The Australian Institute of Health and Welfare is a major national agency whose purpose is to create authoritative and accessible information and statistics that inform
decisions and improve the health and welfare of all Australians.bulletin 148
© Australian Institute of Health and Welfare 2020
This product, excluding the AIHW logo, Commonwealth Coat of Arms and any material owned by a third party or protected by a trademark, has been released under a Creative Commons BY 3.0 (CC BY 3.0) licence. Excluded material owned by third parties may include, for example, design and layout, images obtained under licence from third parties and signatures. We have made all reasonable efforts to identify and label material owned by third parties.
You may distribute, remix and build upon this work. However, you must attribute the AIHW as the copyright holder of the work in compliance with our attribution policy available at <www.aihw.gov.au/copyright/>. The full terms and conditions of this licence are available at <http://creativecommons.org/licenses/by/3.0/au/>.
This publication is part of the Australian Institute of Health and Welfare’s bulletin series. A complete list of the Institute’s publications is available from the Institute’s website <www.aihw.gov.au>.
ISSN 2205-5010 (PDF) ISSN 1446-9820 (Print)
ISBN 978-1-76054-663-2 (Online) ISBN 978-1-76054-664-9 (Print)
Suggested citationAustralian Institute of Health and Welfare 2020. Youth detention population in Australia 2019. Bulletin no. 148. Cat. no. JUV 131. Canberra: AIHW.
Australian Institute of Health and WelfareBoard ChairMrs Louise Markus
Chief Executive OfficerMr Barry Sandison
Any enquiries about or comments on this publication should be directed to:Australian Institute of Health and WelfareGPO Box 570Canberra ACT 2601Tel: (02) 6244 1000Email: [email protected]
Published by the Australian Institute of Health and Welfare
Please note that there is the potential for minor revisions of data in this report.Please check the online version at <www.aihw.gov.au> for any amendments.