youth drinking and driving - dphhs · this brief describes drinking and driving among montana high...
TRANSCRIPT

Youth Drinking and Driving
1 February 2020
Problem Statement Driving while impaired by alcohol endangers people beyond the impaired driver. The National Highway Traffic Safety Administration reports that alcohol-impaired-driving accounted for 29% of all traffic fatalities in the US in 2018; Montana state prevalence was twice that (43%) for the same time period (National Highway Traffic Administration, 2019). The risks of drinking and driving are especially pronounced for teenage drivers, who regularly experience other risk factors for suffering a traffic collision (CDC, 2019). This brief describes drinking and driving among Montana high school students.
According to the Montana Youth Risk Behavior Survey, the self-reported prevalence of past 30-day drinking and driving among Montana high school students decreased by 44% since 2013, from 13% in 2013 down to 7% in 2019 (Figure 1). Males (9%) reported more alcohol impaired driving than females (4%). American Indian and Alaska Native students (AI/AN) reported lower alcohol impaired driving (3%) compared to non-Hispanic white (white) students (7%) and students of other or mixed races (other; 8%). Drinking and driving increased in prevalence with grade level (Figure 2).
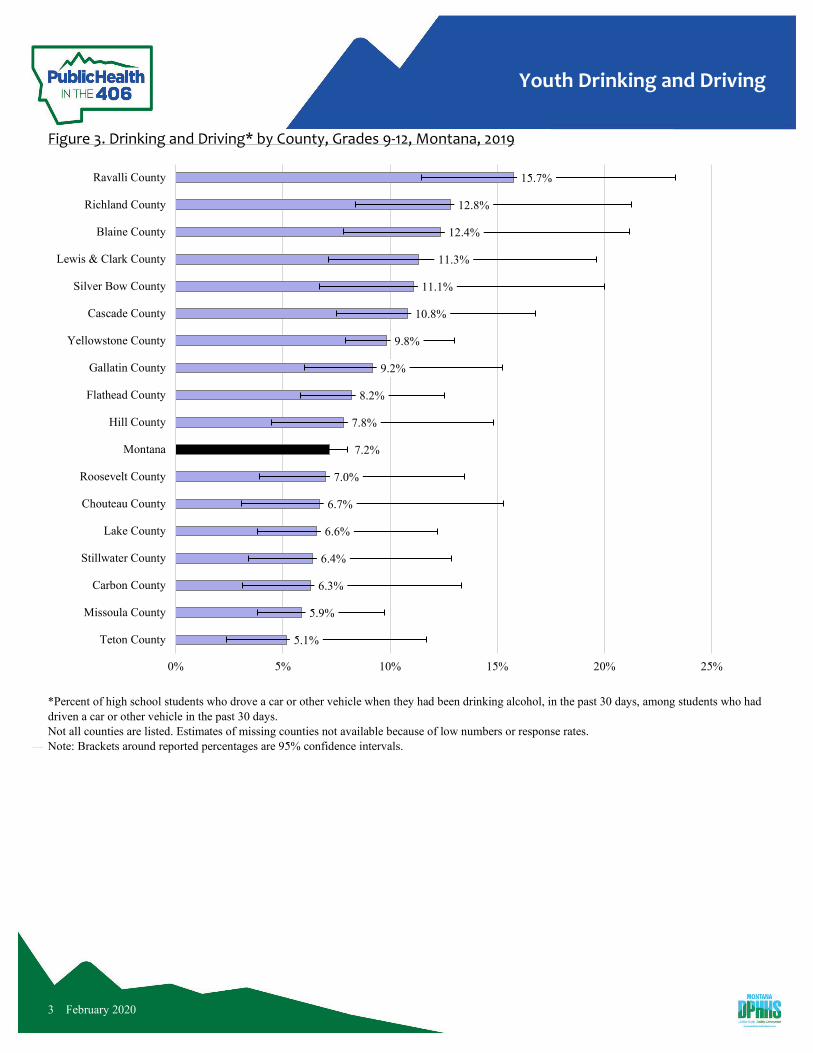
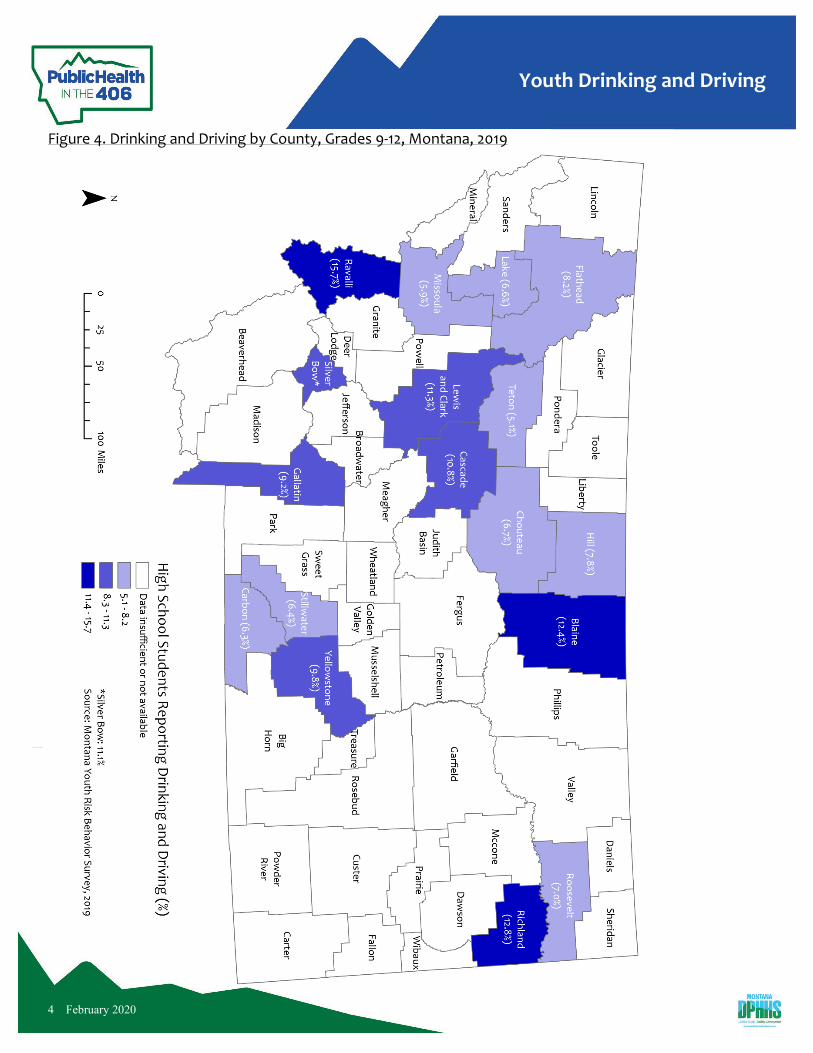
In 2019, the counties with the highest reportable proportion* of high school students indicating drinking and driving within the past 30-days were Ravalli (15.7%), Richland (12.8%), and Blaine (12.4%) counties, and the counties with the lowest reportable prevalence occurred in Teton (5.1%), Missoula (5.9%), and Carbon (6.3%) counties (Figures 3 and 4).
* Estimates not available for all counties because of low numbers or response rates; data are reported for counties with sufficient data only.
Recommendations For Parents:
• Visit ParentingMontana.org, for parenting tools to support your child’s success at all ages. • Talk with your children about the dangers and penalties of drunk driving (Stanford Children's Health, 2019). • Discuss back up plans and alternatives, such as using public transportation, ride share services, having a
designated driver who is not drinking, or calling a parent or family member to pick them up (CDC, 2012). • Prepare your children for responding to peer pressure and how to decline an alcoholic beverage or find an
alternative to riding with a drunk driver (Stanford Children's Health, 2019). • Practice responsible behavior regarding adult alcohol use at your home by avoiding excessive drinking,
discouraging drunkenness among adult guests, and being mindful about how you talk about alcohol (CDC, 2012; Stanford Children's Health, 2019).
For providers: • Provide alcohol screening and interventions to identify at risk patients and refer them to the resources they need
(CDC, 2012; CDC, 2016). • Educate parents and teens about the risks of drinking and driving and encourage parents of new teen drivers to
establish rules and expectations for their teen drivers (CDC, 2012). For public health professionals:
• Mobilize community coalitions and task forces to implement multi-component interventions (CDC, 2016). • Utilize mass media campaigns to keep people informed on the dangers and consequences of impaired driving and
to support other related prevention strategies (CDC, 2016).
Methods Data in this report was obtained from the 2009-2019 Youth Risk Behavior Survey (YRBS), a survey of high school students in grades 9-12. From 2009-2011, youth drinking and driving was defined as students who reported driving a car or other vehicle when they had been drinking alcohol within the past 30 days. Starting in 2013, youth drinking and driving was defined as students who reported driving within the past 30 days and who reported driving a car or other vehicle when they had been drinking alcohol. State-level data were weighted to represent all high school students in Montana. County-level data were not weighted and therefore only represent students who completed the survey.

Youth Drinking and Driving
2 February 2020
Figure 1. Drinking and Driving†* by Year, Grades 9-12, Montana and US, 2009-2019
Montana, 13%
11%
13%
11%
8%Montana, 7%
US, 10%8%
10%
8%
US, 6%
0%
5%
10%
15%
20%
2009 2011 2013 2015 2017 2019Year
†2009-2011: Percent of high school students who drove a car or other vehicle when they had been drinking alcohol in the past 30 days *2013-2019: Percent of high school students who drove a car or other vehicle when they had been drinking alcohol in the past 30 days among students who had driven a car or other vehicle in the past 30 days. Sources: Montana Youth Risk Behavior Survey, 2009-2019; National Youth Risk Behavior Survey, 2009-2017. Note: Brackets around reported percentages are 95% confidence intervals. 2019 data set is only available for statewide comparison; national data is not currently available.
Figure 2. Drinking and Driving*, by Gender, Race, and Grade Level, Grades 9-12, Montana, 2019
7%
5%
9%
3%
7%
8%
***
4%
8%
12%
0%
5%
10%
15%
20%
Total Female Male AI/AN White Other 9th 10th 11th 12th
Per
cent
(%
)
*Percent of high school students who drove a car or other vehicle when they had been drinking alcohol in the past 30 days among students who had driven a car or other vehicle in the past 30 days. *** Data insufficient or not available because of low numbers or response rates. Note: Brackets around reported percentages are 95% confidence intervals. AI/AN: single race non-Hispanic American Indian/ Alaska Native students. White: single race non-Hispanic white students.
Youth Drinking and Driving
3 February 2020
Figure 3. Drinking and Driving* by County, Grades 9-12, Montana, 2019
5.1%
5.9%
6.3%
6.4%
6.6%
6.7%
7.0%
7.2%
7.8%
8.2%
9.2%
9.8%
10.8%
11.1%
11.3%
12.4%
12.8%
15.7%
0% 5% 10% 15% 20% 25%
Teton County
Missoula County
Carbon County
Stillwater County
Lake County
Chouteau County
Roosevelt County
Montana
Hill County
Flathead County
Gallatin County
Yellowstone County
Cascade County
Silver Bow County
Lewis & Clark County
Blaine County
Richland County
Ravalli County
*Percent of high school students who drove a car or other vehicle when they had been drinking alcohol, in the past 30 days, among students who had driven a car or other vehicle in the past 30 days. Not all counties are listed. Estimates of missing counties not available because of low numbers or response rates. Note: Brackets around reported percentages are 95% confidence intervals.
Youth Drinking and Driving
4 February 2020
Figure 4. Drinking and Driving by County, Grades 9-12, Montana, 2019

Youth Drinking and Driving
5 February 2020
Figure 5. Drinking and Driving by Montana Health Planning Region, Grades 9-12, Montana, 2019

Youth Drinking and Driving
6 February 2020
References The Centers for Disease Control and Prevention [CDC]. (2012, October 2). Teen drinking and driving: a dangerous mix. Retrieved December 12, 2019, from https://www.cdc.gov/vitalsigns/teendrinkinganddriving/index.html.
CDC. (2019, October 30). Teen drivers: get the facts. Retrieved February 10, 2020, from https://www.cdc.gov/motorvehiclesafety/teen_drivers/teendrivers_factsheet.html.
CDC. (2016, March 22). What works: Strategies to reduce or prevent drunk driving. Retrieved December 12, 2019, from https://www.cdc.gov/motorvehiclesafety/impaired_driving/strategies.html.
National Highway Traffic Administration. (2019). 2018 Fatal motor vehicle crashes: Overview. Retrieved December 12, 2019, from https://crashstats.nhtsa.dot.gov/Api/Public/ViewPublication/812826.
Stanford Children's Health. (2019). Preventing impaired driving in your teen. Retrieved December 12, 2019, December, from https://www.stanfordchildrens.org/en/topic/default?id=preventing-impaired-driving-in-your-teen-160-47