youth voice for the future of work - en.worldskills.ru
TRANSCRIPT
Do young people feel ready for...the future of work?
Youth Voice for the Future of Work
with the contribution of
ForewordWork is changing. Analysis by the OECD estimates that, on average, nearly half the jobs in member countries are expected to radically change over the next 10-20 years. Digitalisation is changing the nature of work as the specific tasks that make up a job are becoming increasingly automated. Technology is also changing the way that we access work. Employment through online platforms is increasing rapidly and these changes are a matter of real concern for countries. This raises serious questions about how adults will be retrained. For young people, questions are broader. How can countries ensure that young people are gaining the knowledge and skills which will not simply help them get a job when they leave education, but also prepare them for a lifetime of learning? How can young people make the best decisions about their education and training choices when work itself is becoming so unpredictable? For schools, colleges and universities, the importance of foundational learning (literacy and numeracy), social and entrepreneurial skills and career guidance is growing. The OECD “I am the future of work” campaign and WorldSkills have come together to explore what young people think about their futures as working adults. The study looks across 19 countries – the national members of the G20 – to dip into the attitudes, experiences and expectations of thousands of young adults, aged 18-24. The study draws on two datasets. In the first part of the study, through statistical weighting of the data, insights emerge into the breadth of experiences and opinions of respondents from across the world. The study explores their awareness and impact of technological change, the importance of career guidance and school-mediated access to the world of work. The second part of the study presents unweighted data from opt-in polls of young people who form part of WorldSkills communities in six countries. In this uncertain world, it is essential that young people have every opportunity to engage, through their schools with modern workplaces. It is already known that teenage career aspirations are narrow and often poorly informed. PISA data tell us that one in three 15 year olds across the OECD in 2015 anticipated doing just 10 different types of job by the time they reached 30 - half expected to be involved in only three economic sectors. Analysis shows, moreover, that what young people think about work is shaped deeply by their social backgrounds. As the working world becomes increasingly dynamic, the need for education systems – both vocational and general – to prepare young people to go into working life with their eyes open is becoming ever more urgent. The future of work is now and we must take action today to shape a better and fairer world of work tomorrow.
Foreword
02 | Foreword WorldSkills | OECD
Andreas SchleicherDirector for Education and Skills and Special Advisor on Education Policy to the Secretary-General at the Organisation for Economic Co-operation and Development (OECD)
WorldSkills works with young people across the globe and celebrates their dynamism, their creativity and their resilience. It works with governments, education providers, and industry to allow these youngsters to fulfil their potential for themselves. But assumptions can often be made about what young people want and how they feel about the future. Far too often the voices of young people can be represented by older generations, who believe that they know what young people want, and what is best for them. It was our desire to address this generational gap, by learning how young people feel about the potential impact of technological change in future workplaces, that led us to commission the “Youth Voice for the Future of Work” survey with our partners in the OECD. This survey has produced some striking results that should help us all better understand how young people feel about how their education is preparing them for the future. The vital and compelling insights in this report should give us all pause for thought about which policies and practices can work to best support young people to be more confident about their futures and therefore the future of the global economy. The key message from young people from around the world is their overwhelming positivity with regard to change. Rather than fearing the Fourth Industrial Revolution, more than half of those surveyed (56%) said that they believe that new technologies will create more jobs, with two-thirds excited by the prospect of flexible working. Further, half of all those surveyed said they were more positive than negative about the prospects of finding a job they wanted to do - although young women were less confident than young men in this regard. There were also dramatic differences between countries – with 71% of young Turks and Mexicans positive about finding work compared to just 27% in South Korea and Japan. These are just a few of the highlights in this extensive report, which we will use to inform decision-makers in our network of governments, international organizations, education providers, businesses and beyond. WorldSkills believes we all have so much to learn by engaging with and listening to young people. That’s why this research is so important to us and marks a major first step for WorldSkills, in partnership with the OECD, to amplify our belief in young people’s ability to shape the future and create opportunities to help more young people from across the globe succeed in work and life. When young people succeed, we all succeed.
Youth voice for the future of work Foreword | 03
Laurence GatesVice Chair of the Strategic Development Committee, WorldSkills International

04 | Contents WorldSkills | OECD
Contents

Contents06 Introduction: Youth voice for the future of work
08 Section one: Job confidence & the value of education
10 - Job confidence
14 - Technology optimism
20 - Value of school today
22 - Impact of school-mediated activities
28 Section two: Global findings by samples from WorldSkills members 30 - Country comparisons
32 - Australia
34 - Canada
36 - France
38 - Russia
40 - United Kingdom
44 - United States of America
45 Acknowledgements
with the contribution of
Youth voice for the future of work Contents | 05
Youth voice for the future of work research
06 | Introduction WorldSkills | OECD
Introduction
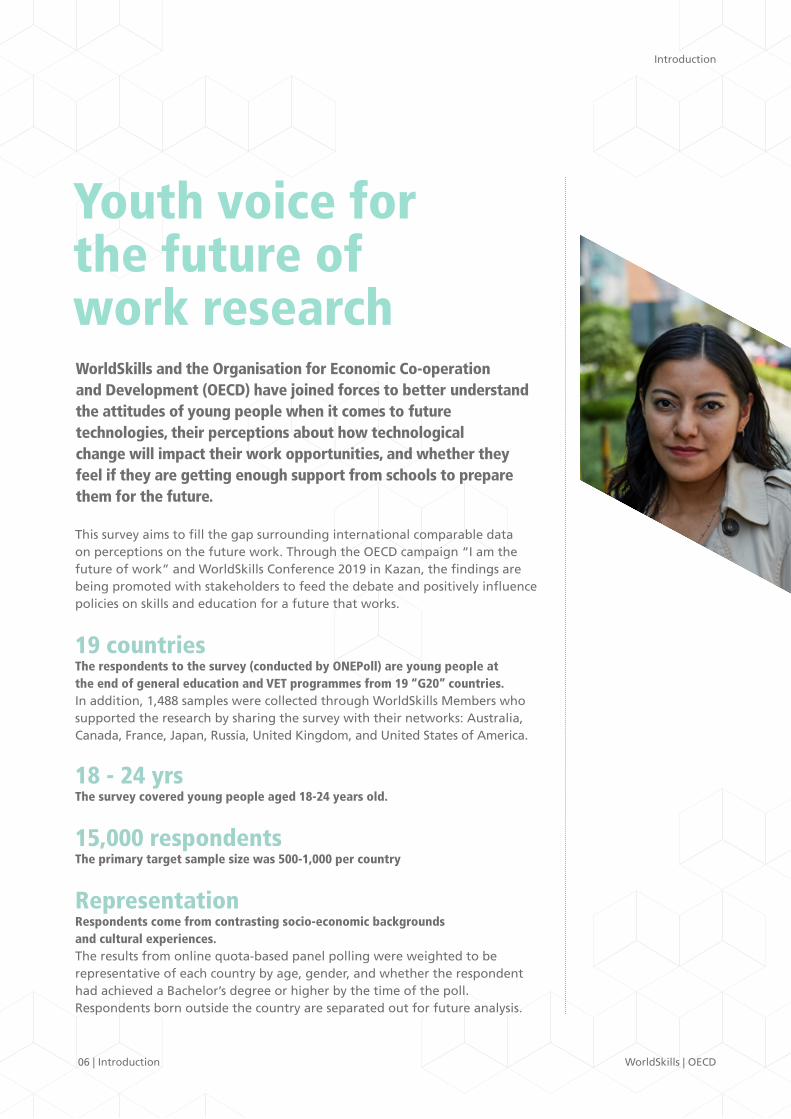
WorldSkills and the Organisation for Economic Co-operation and Development (OECD) have joined forces to better understand the attitudes of young people when it comes to future technologies, their perceptions about how technological change will impact their work opportunities, and whether they feel if they are getting enough support from schools to prepare them for the future.
This survey aims to fill the gap surrounding international comparable data on perceptions on the future work. Through the OECD campaign “I am the future of work” and WorldSkills Conference 2019 in Kazan, the findings are being promoted with stakeholders to feed the debate and positively influence policies on skills and education for a future that works.
19 countriesThe respondents to the survey (conducted by ONEPoll) are young people at the end of general education and VET programmes from 19 “G20” countries. In addition, 1,488 samples were collected through WorldSkills Members who supported the research by sharing the survey with their networks: Australia, Canada, France, Japan, Russia, United Kingdom, and United States of America.
18 - 24 yrs The survey covered young people aged 18-24 years old.
15,000 respondents The primary target sample size was 500-1,000 per country
RepresentationRespondents come from contrasting socio-economic backgrounds and cultural experiences.The results from online quota-based panel polling were weighted to be representative of each country by age, gender, and whether the respondent had achieved a Bachelor’s degree or higher by the time of the poll. Respondents born outside the country are separated out for future analysis.

“I am the Future of Work” is a people powered initiative by the OECD, which gathers stories, insights and experiences about the way the world of work is changing, and the risks and opportunities it raises along the way. Our message that “the future of work is now” and that our actions today are shaping tomorrow’s world, places the OECD as a positive contributor to an inclusive transition for a future that works. Workers, students, job seekers, employers and leaders are all the future of work. It is time to be part of the conversation.
oe.cd/fow
Youth voice for the future of work Introduction | 07
WorldSkills is a movement. We are a group of people and organizations that advance the shared social objective of increasing the provision of skills. Our Member organizations cover more than two-thirds of the world’s population.
At WorldSkills, we strive to reflect the authentic voice of the youth in all aspects of skills debates. They are our spokespeople, beneficences, and our heroes. We want to capture what inspires and challenges them when it comes to technological changes and the future of work.
Images Credit: © Agence
MYOP for OECD 2019

08 | Section one WorldSkills | OECD
Section one

Job confidence & the value of education
Youth voice for the future of work Section one | 09
- Job confidence
- Technology optimism
- Value of school today
- Impact of school-mediated activities

Job confidenceAre young people confident that they will be able to find the job that they really want?
Mostly positive outlookMost young people in the majority of countries that we surveyed are confident that they will be able to find the job they really want to do, with an average of 50 percentage points more being confident than not (excluding those who are unsure). There is little direct difference overall between students who attended a fee-paying secondary school and those who did not.
Relatively positiveYoung people who are not in education, employment or training are more negative, but still relatively positive with 35% more feeling confident than not, albeit with 34% who are not sure or have no particular opinion.
Privately educated are more confidentOnce we “use regression analysis to” control for gender, age and parental higher education achievement, respondents who attend private school are more confident – the equivalent of one in ten respondents saying they “agree” that they are confident rather than “disagree”. This effect halves the scale but remains significant if we control for average differences between countries.
I would feel more
confident about
my future job if I
was assured that
technology wouldn’t
surpass the average
worker, leaving me
out of a job and
out of pocket.
Survey respondent
Job confidence
50%
50%
35%
10 | Job confidence WorldSkills | OECD

41%of young women feel confident about their future working life compared to 50% of young men
just 2%
Students who already had a Bachelor’s degree or higher by the time of the survey are slightly more pessimistic than those who did not, the equivalent of one in 28 respondents shifting from agree to disagree. This effect is no longer present if we control for average differences between countries.
One country stands out as markedly more neutral in its overall opinion, in Japan only 2% felt more confident than not, reducing to 0% for those who did not attend fee-paying private school. Otherwise, countries with slightly fewer confident young people are South Korea, followed by Italy, Saudi Arabia, UK and Australia.
in Japan felt more confident than not
Job confidence | 11Youth voice for the future of work

Full sample Not attending requiring tuition in scope secondary school
Country NPJC % Unweighted n NPJC % Unweighted n
Argentina 68% 449 68% 180
Australia 39% 412 33% 243
Brazil 67% 358 68% 213
Canada 43% 792 40% 634
China 57% 918 60% 555
France 43% 872 36% 512
Germany 42% 756 41% 635
India 67% 732 80% 118
Indonesia 69% 443 67% 167
Italy 35% 900 33% 813
Japan 2% 905 0% 633
Mexico 72% 909 71% 450
Russia 52% 908 52% 848
Saudi Arabia 36% 378 35% 298
South Africa 68% 416 71% 196
South Korea 27% 488 24% 303
Turkey 72% 472 72% 345
United Kingdom 39% 842 39% 756
United States 50% 840 39% 628
Simple average 50% 12,790 49% 8,527
Net positive job confidence (NPJC)
Job confidence
12 | Job confidence WorldSkills | OECD
Net positive job confidence (NPJC) is the sum of those who agreed or strongly agreed that they were confident they would be able to find the job they really wanted to do, minus those who disagreed or strongly disagreed. Those who were unsure or neither agreed nor disagreed were excluded from the calculation.
The confidence scale
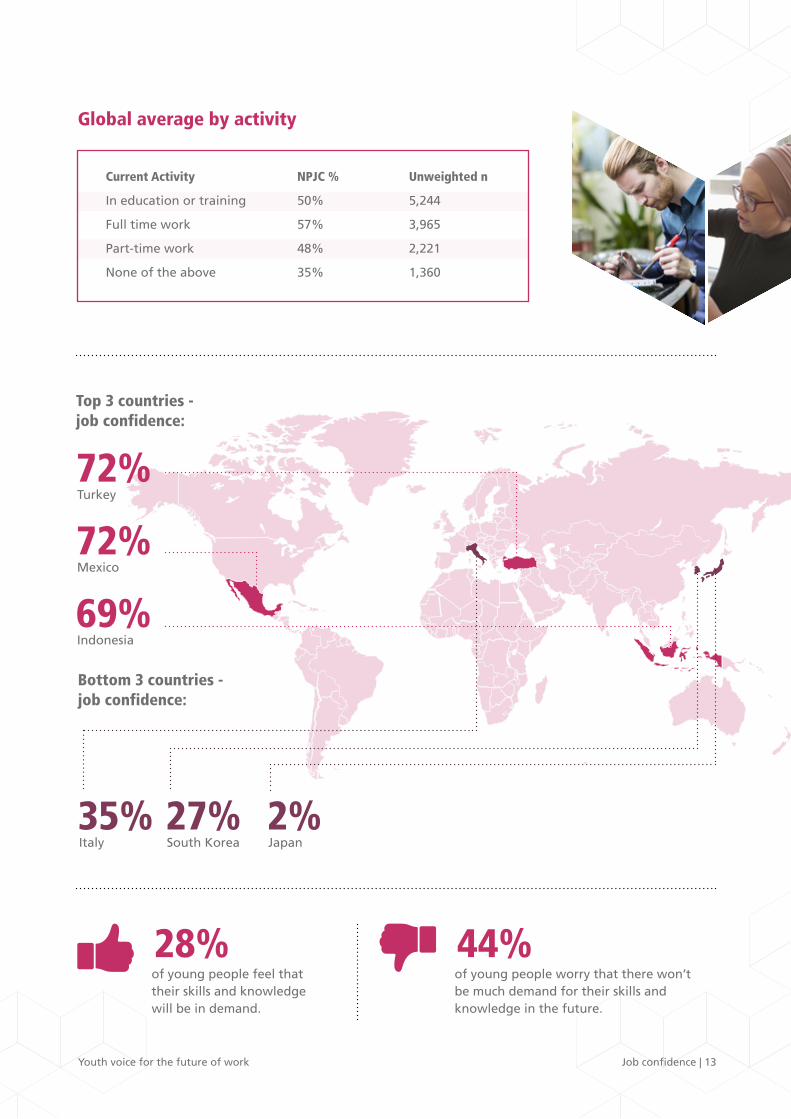
Current Activity NPJC % Unweighted n
In education or training 50% 5,244
Full time work 57% 3,965
Part-time work 48% 2,221
None of the above 35% 1,360
Global average by activity
35% Italy
27% South Korea
Bottom 3 countries - job confidence:
Job confidence | 13
72% Turkey
72% Mexico
69% Indonesia
Top 3 countries - job confidence:
2% Japan
28%of young people feel that their skills and knowledge will be in demand.
44%of young people worry that there won’t be much demand for their skills and knowledge in the future.
Youth voice for the future of work
14 | Technology optimism
Technology optimism
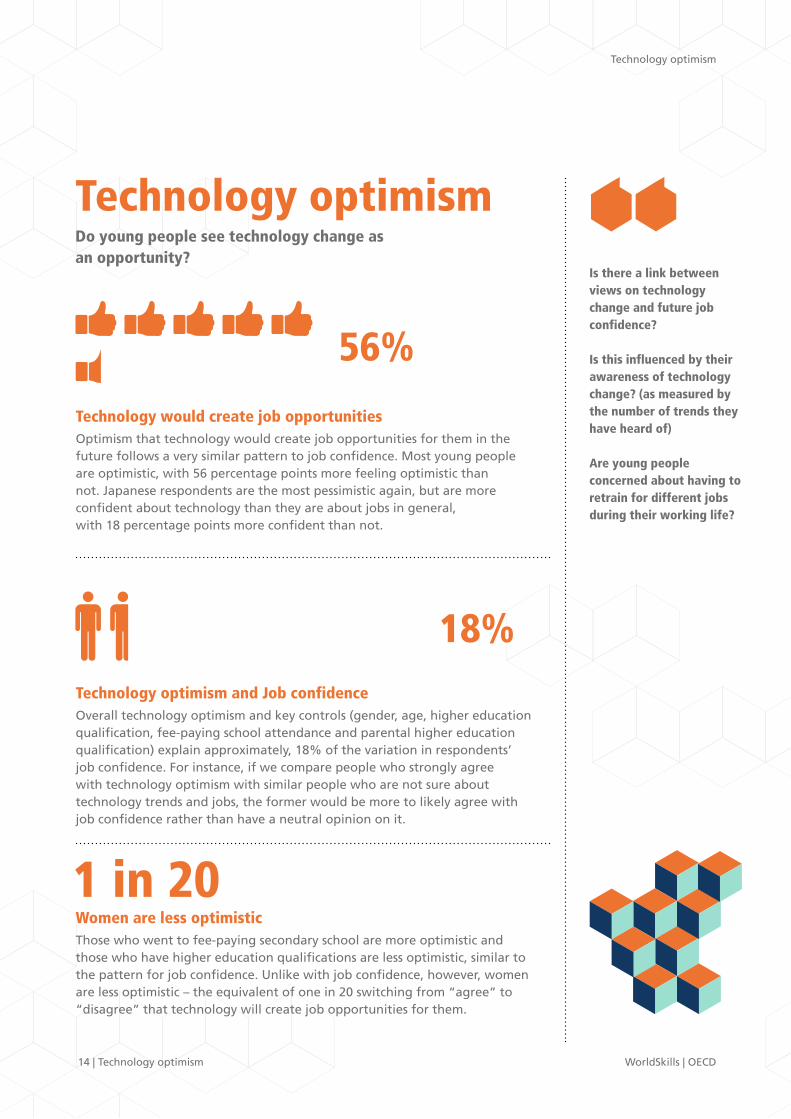
Technology would create job opportunitiesOptimism that technology would create job opportunities for them in the future follows a very similar pattern to job confidence. Most young people are optimistic, with 56 percentage points more feeling optimistic than not. Japanese respondents are the most pessimistic again, but are more confident about technology than they are about jobs in general, with 18 percentage points more confident than not.
Technology optimism and Job confidenceOverall technology optimism and key controls (gender, age, higher education qualification, fee-paying school attendance and parental higher education qualification) explain approximately, 18% of the variation in respondents’ job confidence. For instance, if we compare people who strongly agree with technology optimism with similar people who are not sure about technology trends and jobs, the former would be more to likely agree with job confidence rather than have a neutral opinion on it.
Women are less optimisticThose who went to fee-paying secondary school are more optimistic and those who have higher education qualifications are less optimistic, similar to the pattern for job confidence. Unlike with job confidence, however, women are less optimistic – the equivalent of one in 20 switching from “agree” to “disagree” that technology will create job opportunities for them.
Is there a link between views on technology change and future job confidence?
Is this influenced by their awareness of technology change? (as measured by the number of trends they have heard of)
Are young people concerned about having to retrain for different jobs during their working life?
1 in 20
Technology optimism
18%
WorldSkills | OECD
Do young people see technology change as an opportunity?
56%

Technology optimism | 15
Young people are broadly both confident that they will have to retrain many times during their life (with 43 percentage points more agreeing with this than not) and confident that they will be able to do so (with 53 percentage points more agreeing with this than not). Those who went to fee-paying secondary school and those whose parents have higher education are more confident than those who did not, but there is little difference by age, gender and having achieved an higher education degree by the time of the survey.
With the same controls in place, being aware of more technology trends (out of a list of 16 possible emerging technology areas) is closely correlated with technology optimism; although the effect remains modest. Someone aware of 10 or more trends than another respondent would be 20% more likely to strongly agree with the statement on average, rather than disagree (or to feel neutral rather than disagree).
Young People are confidentAwareness of technology
63% 41% 66%of young people see the possibility to work flexibly as an exciting prospect.
of young women feel confident about their future working life compared to 50% of young men.
of young women believe they have what it takes to retrain during their careers because of technological change.
Tech awareness driving optimismThe survey asks whether respondents have heard of 16 different trends. Each of these is scored, allowing respondents a score from 0 to 16 reflecting their tech awareness. These are listed together below with the weighted number of people across the full qualifying sample (i.e. excluding those born in another country) who say they have heard of them:
AI 64%
3D Printing 63%
VR 63%
Renewable Energy 49%
Advanced Robotics 49%
Cloud 40%
AR 39%
IoT 33%
BigData 25%
Healthtech 24%
Collaborative Networks 16%
Fintech 14%
Genomics 14%
Telematics 13%
Generative Design 13%
BIM 11%
Youth voice for the future of work

Full sample Not attending fee-paying in scope secondary school
Country NPTO % Unweighted n NPTO % Unweighted n
Argentina 70% 449 70% 180
Australia 45% 412 46% 243
Brazil 73% 358 76% 213
Canada 53% 792 52% 634
China 72% 918 73% 555
France 42% 872 38% 512
Germany 40% 756 40% 635
India 77% 732 70% 118
Indonesia 72% 443 71% 167
Italy 61% 900 59% 813
Japan 18% 905 16% 633
Mexico 81% 909 79% 450
Russia 52% 908 51% 848
Saudi Arabia 27% 378 25% 298
South Africa 71% 416 70% 196
South Korea 25% 488 29% 303
Turkey 79% 472 78% 345
United Kingdom 49% 842 48% 756
United States 60% 840 54% 628
Simple average 56% 12,790 55% 8,527
Technology as an opportunity
Net Positive Tech Optimism (NPTO) NPTO is the sum of those who agreed or strongly agreed that they were optimistic that technological change would give them job opportunities in the future, minus those who disagreed or strongly disagreed. Those who were unsure or neither agreed nor disagreed were excluded from the calculation.
16 | Technology optimism
Technology optimism
WorldSkills | OECD
Technology optimism | 17Youth voice for the future of work

18 | Technology optimism
Technology optimism
WorldSkills | OECD
Full sample Not attending fee-paying in scope secondary school
Country FRE % Unweighted n FRE % Unweighted n
Argentina 43% 449 38% 180
Australia 42% 412 42% 243
Brazil 67% 358 67% 213
Canada 33% 792 32% 634
China 68% 918 69% 555
France 21% 872 19% 512
Germany 2% 756 0% 635
India 48% 732 56% 118
Indonesia 65% 443 58% 167
Italy 44% 900 45% 813
Japan 43% 905 40% 633
Mexico 46% 909 44% 450
Russia 40% 908 40% 848
Saudi Arabia 16% 378 16% 298
South Africa 43% 416 43% 196
South Korea 58% 488 54% 303
Turkey 60% 472 57% 345
United Kingdom 35% 842 33% 756
United States 46% 840 40% 628
Simple average 43% 12,790 42% 8,527
Supporting tables: Retraining
I believe that technological developments will mean that I will have to retrain many times during my career (Frequent Retraining Expected, FRE%)

Full sample Not attending fee-paying in scope secondary school
Country RFC % Unweighted n RFC % Unweighted n
Argentina 72% 449 68% 180
Australia 44% 412 44% 243
Brazil 84% 358 84% 213
Canada 51% 792 48% 634
China 61% 918 59% 555
France 33% 872 25% 512
Germany 39% 756 38% 635
India 67% 732 65% 118
Indonesia 58% 443 52% 167
Italy 38% 900 36% 813
Japan 18% 905 16% 633
Mexico 72% 909 70% 450
Russia 52% 908 51% 848
Saudi Arabia 36% 378 35% 298
South Africa 67% 416 66% 196
South Korea 45% 488 40% 303
Turkey 71% 472 70% 345
United Kingdom 49% 842 48% 756
United States 58% 840 51% 628
Simple average 53% 12,790 51% 8,527
Technology optimism | 19
I feel confident that I have what it takes to retrain when I am older if my job is automated (Retraining Feasibility Confidence, RFC%)
Youth voice for the future of work
Value of school today
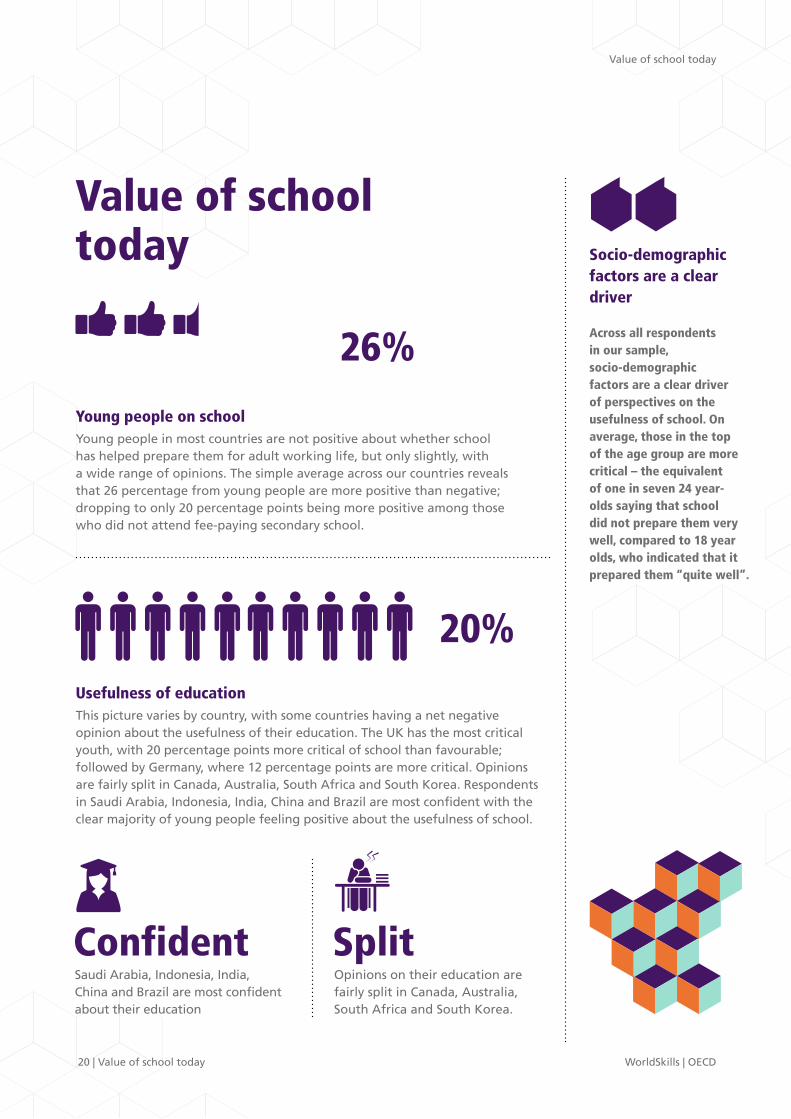
Young people on schoolYoung people in most countries are not positive about whether school has helped prepare them for adult working life, but only slightly, with a wide range of opinions. The simple average across our countries reveals that 26 percentage from young people are more positive than negative; dropping to only 20 percentage points being more positive among those who did not attend fee-paying secondary school.
Usefulness of educationThis picture varies by country, with some countries having a net negative opinion about the usefulness of their education. The UK has the most critical youth, with 20 percentage points more critical of school than favourable; followed by Germany, where 12 percentage points are more critical. Opinions are fairly split in Canada, Australia, South Africa and South Korea. Respondents in Saudi Arabia, Indonesia, India, China and Brazil are most confident with the clear majority of young people feeling positive about the usefulness of school.
Saudi Arabia, Indonesia, India, China and Brazil are most confident about their education
Opinions on their education are fairly split in Canada, Australia, South Africa and South Korea.
Socio-demographic factors are a clear driver
Across all respondents in our sample, socio-demographic factors are a clear driver of perspectives on the usefulness of school. On average, those in the top of the age group are more critical – the equivalent of one in seven 24 year-olds saying that school did not prepare them very well, compared to 18 year olds, who indicated that it prepared them “quite well”.
Value of school today
26%
20%
Confident Split
20 | Value of school today WorldSkills | OECD

Youth Voice for the Future Technology Optimism | 10
Women are more critical, compared to those without higher education or whose parents do not have higher education, and to those who did not attend fee-paying school. The average effect is equivalent to around one in three of those attending fee-paying schools feeling that school prepared them “quite well” compared to “not very well”. These effects are broadly robust compared to adjustments for the average within each country.
Net positive feeling towards the support from school is based on the proportion who responded “Very Well” or “Quite Well” to the question “How well in general do you feel your school/college prepared you for adult working life?”, minus those who responded “Not Very Well” or “Not Well At All”.
Full sample Not attending fee-paying in scope secondary school
Country Positive % Unweighted n Positive % Unweighted n
Argentina 18% 449 13% 180
Australia 9% 412 2% 243
Brazil 47% 358 38% 213
Canada 5% 792 -4% 634
China 51% 918 50% 555
France 31% 872 19% 512
Germany -12% 756 -15% 635
India 55% 732 40% 118
Indonesia 86% 443 82% 167
Italy 25% 900 21% 813
Japan 16% 905 14% 633
Mexico 38% 909 34% 450
Russia 21% 908 20% 848
Saudi Arabia 51% 378 49% 298
South Africa 6% 416 0% 196
South Korea 6% 488 1% 303
Turkey 33% 472 30% 345
United Kingdom -20% 842 -24% 756
United States 26% 840 9% 628
Simple average 26% 12,790 20% 8,527
Support from school
Value of school today | 21Youth voice for the future of work
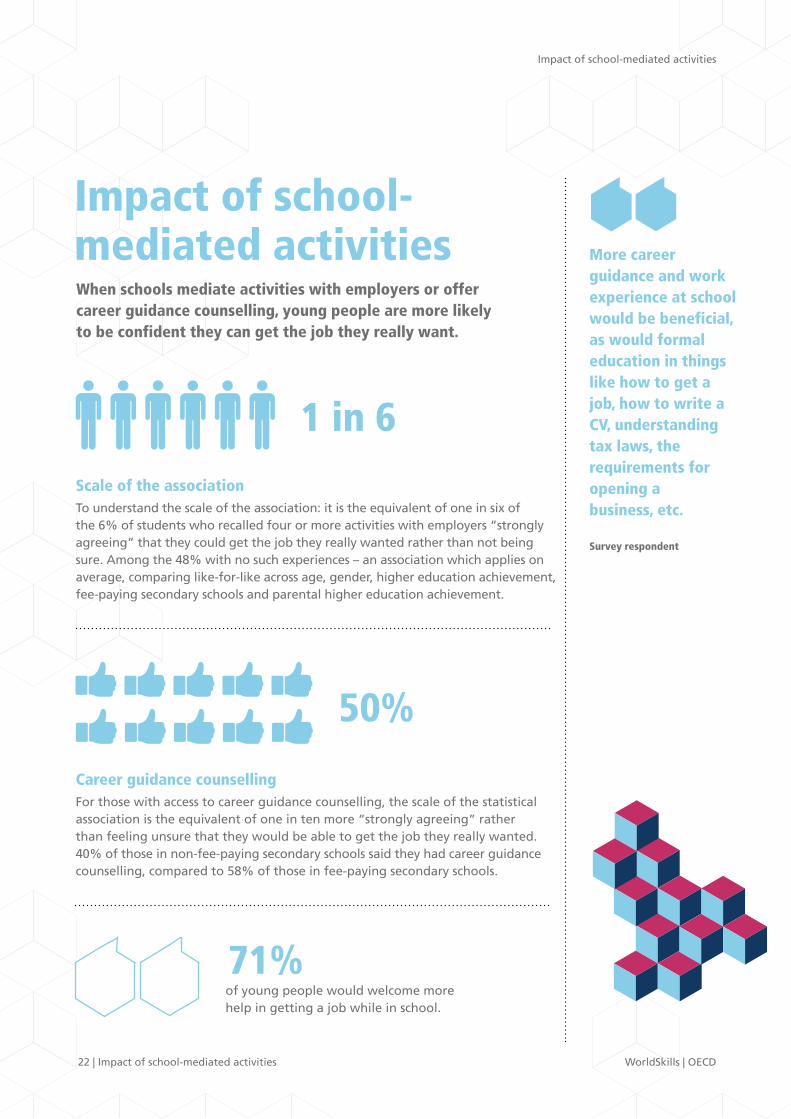
Impact of school-mediated activitiesWhen schools mediate activities with employers or offer career guidance counselling, young people are more likely to be confident they can get the job they really want.
Scale of the associationTo understand the scale of the association: it is the equivalent of one in six of the 6% of students who recalled four or more activities with employers “strongly agreeing” that they could get the job they really wanted rather than not being sure. Among the 48% with no such experiences – an association which applies on average, comparing like-for-like across age, gender, higher education achievement, fee-paying secondary schools and parental higher education achievement.
Career guidance counsellingFor those with access to career guidance counselling, the scale of the statistical association is the equivalent of one in ten more “strongly agreeing” rather than feeling unsure that they would be able to get the job they really wanted. 40% of those in non-fee-paying secondary schools said they had career guidance counselling, compared to 58% of those in fee-paying secondary schools.
1 in 6
Impact of school-mediated activities
22 | Impact of school-mediated activities WorldSkills | OECD
50%
More career guidance and work experience at school would be beneficial, as would formal education in things like how to get a job, how to write a CV, understanding tax laws, the requirements for opening a business, etc.
Survey respondent
71% of young people would welcome more help in getting a job while in school.
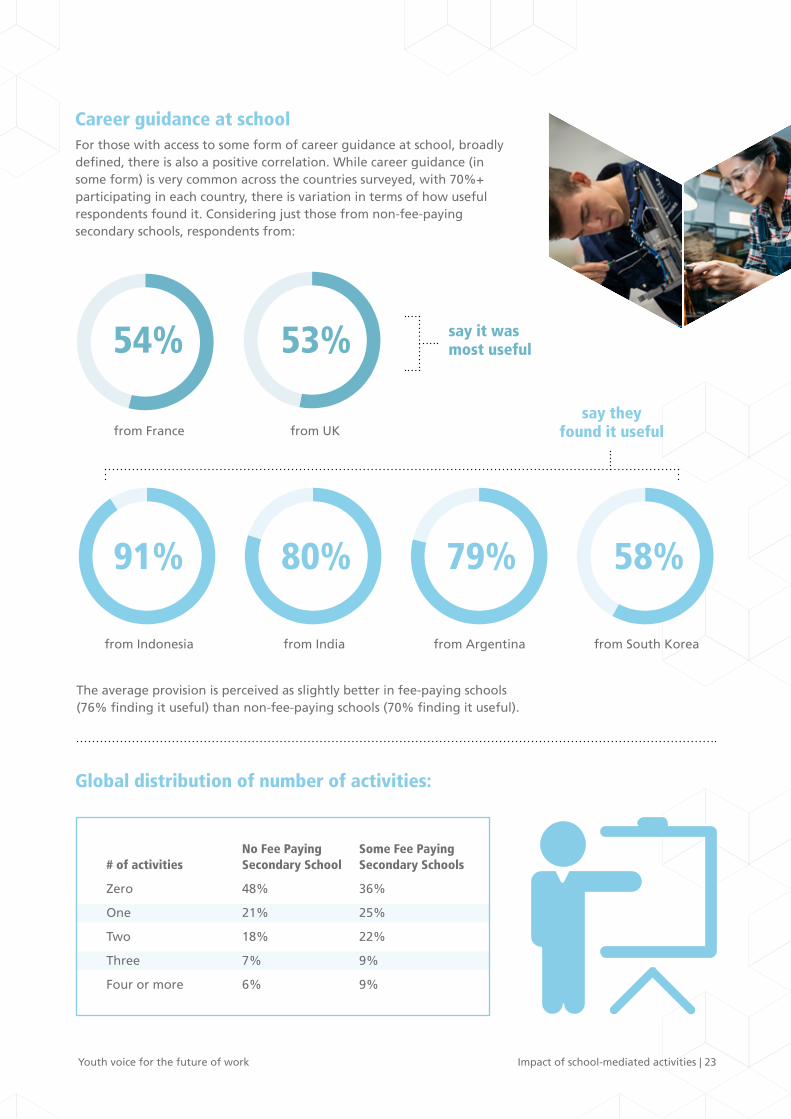
No Fee Paying Some Fee Paying # of activities Secondary School Secondary Schools
Zero 48% 36%
One 21% 25%
Two 18% 22%
Three 7% 9%
Four or more 6% 9%
The average provision is perceived as slightly better in fee-paying schools (76% finding it useful) than non-fee-paying schools (70% finding it useful).
from France
from Indonesia from India from Argentina from South Korea
from UKsay they
found it useful
Global distribution of number of activities:
Impact of school-mediated activities | 23
Career guidance at schoolFor those with access to some form of career guidance at school, broadly defined, there is also a positive correlation. While career guidance (in some form) is very common across the countries surveyed, with 70%+ participating in each country, there is variation in terms of how useful respondents found it. Considering just those from non-fee-paying secondary schools, respondents from:
54+46+P53+47+P91+9+P 79+21+P80+20+P 58+42+P
54%
91% 79%
53%
80% 58%
say it was most useful
Youth voice for the future of work

Weighted average number of recalled school-mediated employer activities during secondary school
No Fee Paying Some Fee Paying Country Secondary School Secondary School
Argentina 0.97 1.09
Australia 1.06 1.00
Brazil 0.92 1.41
Canada 0.83 1.08
China 1.32 1.48
France 0.81 1.34
Germany 1.59 1.94
India 1.00 1.36
Indonesia 0.89 1.15
Italy 1.24 1.49
Japan 0.81 0.85
Mexico 0.98 1.26
Russia 0.73 1.22
Saudi Arabia 0.76 1.24
South Africa 1.06 1.24
South Korea 1.20 1.56
Turkey 1.25 1.64
United Kingdom 1.06 1.16
United States 0.84 1.53
Simple Average 1.02 1.32
Impact of school-mediated activities
24 | Impact of school-mediated activities WorldSkills | OECD
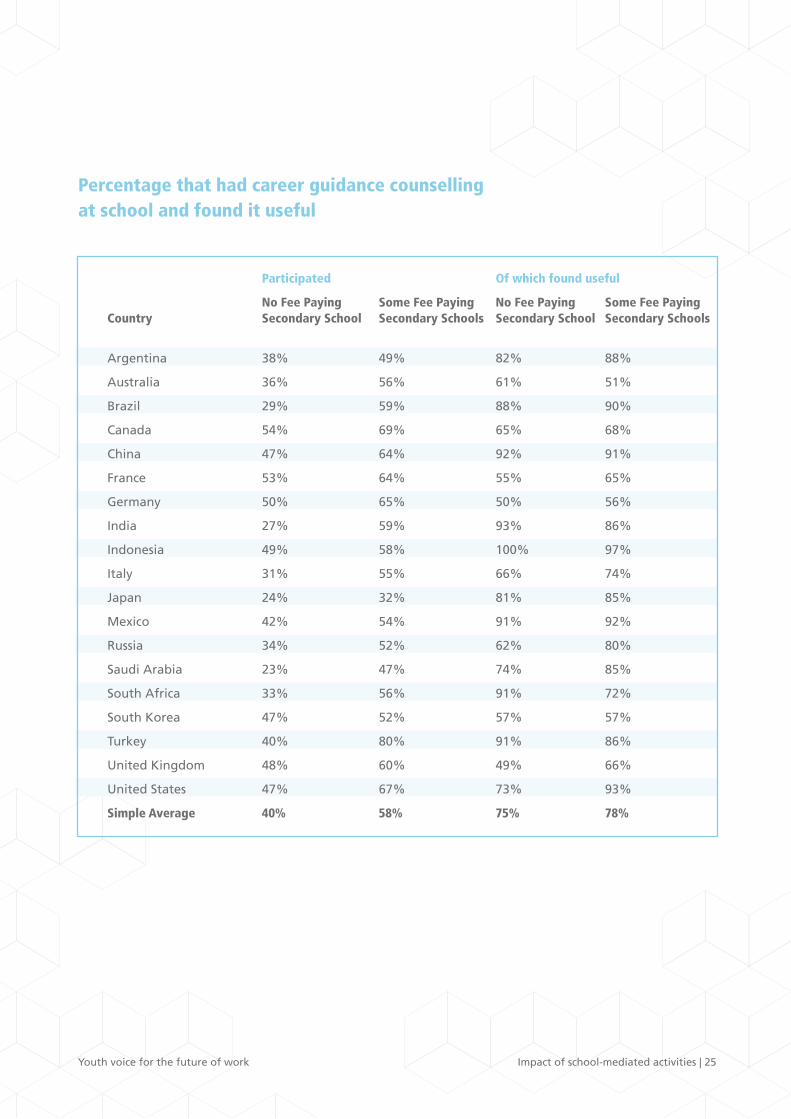
Percentage that had career guidance counselling at school and found it useful
Participated Of which found useful
No Fee Paying Some Fee Paying No Fee Paying Some Fee Paying Country Secondary School Secondary Schools Secondary School Secondary Schools
Argentina 38% 49% 82% 88%
Australia 36% 56% 61% 51%
Brazil 29% 59% 88% 90%
Canada 54% 69% 65% 68%
China 47% 64% 92% 91%
France 53% 64% 55% 65%
Germany 50% 65% 50% 56%
India 27% 59% 93% 86%
Indonesia 49% 58% 100% 97%
Italy 31% 55% 66% 74%
Japan 24% 32% 81% 85%
Mexico 42% 54% 91% 92%
Russia 34% 52% 62% 80%
Saudi Arabia 23% 47% 74% 85%
South Africa 33% 56% 91% 72%
South Korea 47% 52% 57% 57%
Turkey 40% 80% 91% 86%
United Kingdom 48% 60% 49% 66%
United States 47% 67% 73% 93%
Simple Average 40% 58% 75% 78%
Impact of school-mediated activities | 25Youth voice for the future of work

Percentage that had some form of career guidance at school and found it useful
Participated Of which found useful
No Fee Paying Some Fee Paying No Fee Paying Some Fee Paying Country Secondary School Secondary Schools Secondary School Secondary Schools
Argentina 97% 97% 79% 81%
Australia 83% 87% 69% 69%
Brazil 86% 89% 78% 88%
Canada 90% 95% 63% 67%
China 90% 91% 74% 70%
France 88% 96% 54% 67%
Germany 90% 93% 64% 69%
India 84% 95% 80% 87%
Indonesia 92% 97% 91% 93%
Italy 93% 98% 60% 64%
Japan 74% 75% 70% 79%
Mexico 95% 96% 82% 86%
Russia 77% 90% 60% 75%
Saudi Arabia 71% 89% 72% 87%
South Africa 85% 91% 68% 69%
South Korea 93% 91% 58% 52%
Turkey 79% 95% 77% 78%
United Kingdom 79% 94% 53% 64%
United States 83% 94% 70% 91%
Simple Average 86% 92% 70% 76%
Impact of school-mediated activities
26 | Impact of school-mediated activities WorldSkills | OECD

Impact of school-mediated activities | 27Youth voice for the future of work

28 | Section two WorldSkills | OECD
Section two

Global findings by samples from WorldSkills membersA separate set of samples were collected through the networks of WorldSkills Members - WorldSkills Australia, Skills/Compétences Canada, WorldSkills France, WorldSkills Russia, WorldSkills UK, WorldSkills USA, and WorldSkills Japan* - to look at the attitudes and perceptions of youth from the Members’ networks.
*Sample size is insufficient to generate meaningful analysis.
- Country comparisons
- Australia
- Canada
- France
- Russia
- United Kingdom
- United States of America
Section two | 29Youth voice for the future of work

ConfidenceI worry that technological change will threaten my prospects of getting the kind of work I would like to get
In the UK, Canada, and France, half or more of the respondents do NOT think technological change will threaten their work prospects. Even in these countries, 21% to 27% agree that technological change is a threat.
In the US, Australia and Russia, fewer than half disagree that technological change will threaten their work prospects. In these countries, between 30% and 34% of respondents agree that technological change is a threat.
Australia
Canada
France
Russia
United Kingdom
United States
AgreeDisagree
34%38%
27%52%
24%50%
30%45%
21%50%
32%41%
I feel confident that I have what it takes to retrain when I am older if my job is automated
Australia
Canada
France
Russia
United Kingdom
United States
Agree
The threat of technological changes is largely, but not entirely, mitigated by respondents’ belief that they will be able to retrain and re-focus their careers in the future. Not everyone believed this, with endorsement varying between 57% in France and 74% in Canada.
69%
74%
57%
66%
69%
71%
30 | WorldSkills Awareness WorldSkills | OECD
WorldSkills awareness

WorldSkills Awareness | 31
University
Clearly, University is felt to be far more accessible in Russia (where 84% think they may attend in future) than in France (where 17% think they may).
Possibly the largest single concern in this data set is the wide variability of career advice, both within countries and between countries.
Careers advice
Australia
Canada
France
Russia
United Kingdom
United States
Agree
39%
46%
17%
84%
47%
62%
Australia
Canada
France
Russia
United Kingdom
United States
HappyPoor or terrible
34%33%
56%27%
50%43%
30%27%
40%48%
67%23%
67% 23% 48% are happy with career advice in the USA
describe their career advice as poor or terrible in the USA
describe their career advice as poor or terrible in the UK
are happy with career advice in the UK
40%
Youth voice for the future of work
65+11+3+21+M
Australia
ww
w.w
orldskills.org.au
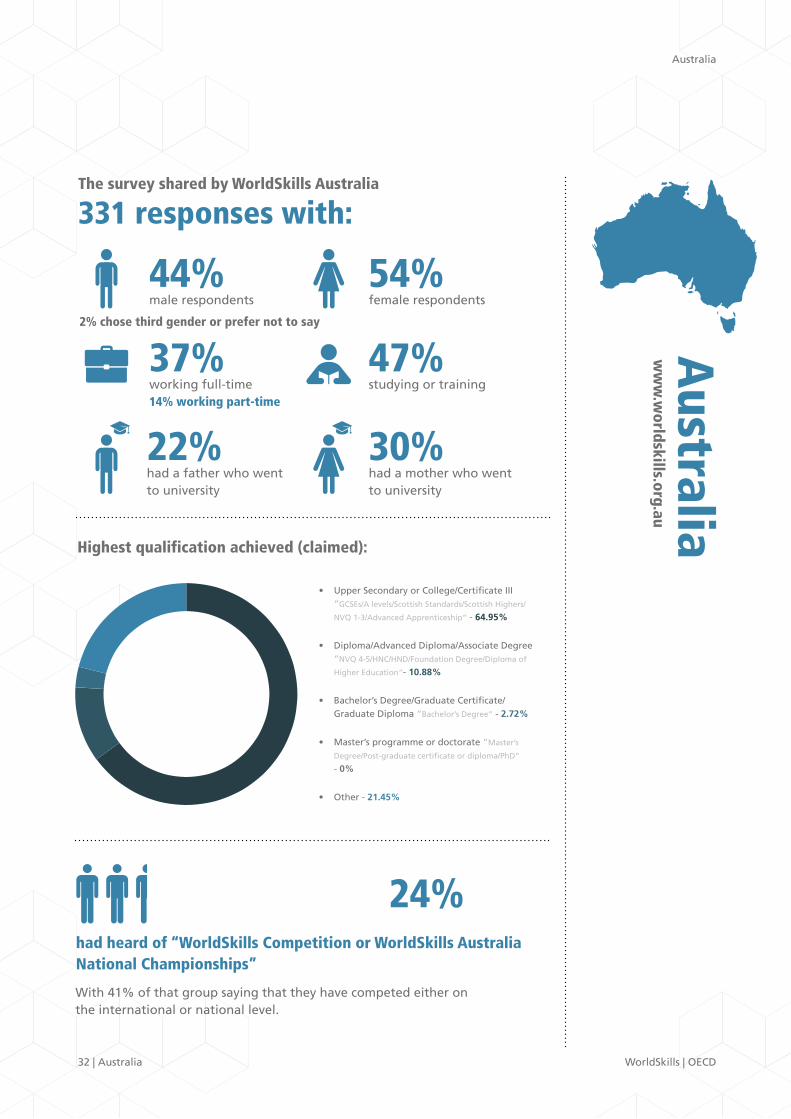
44% male respondents
47% studying or training
37% working full-time14% working part-time
54% female respondents
With 41% of that group saying that they have competed either on the international or national level.
had heard of “WorldSkills Competition or WorldSkills Australia National Championships”
24%
30% had a mother who went to university
22%had a father who wentto university
Highest qualification achieved (claimed):
The survey shared by WorldSkills Australia
331 responses with:
32 | Australia WorldSkills | OECD
Australia
• Upper Secondary or College/Certificate III “GCSEs/A levels/Scottish Standards/Scottish Highers/
NVQ 1-3/Advanced Apprenticeship” - 64.95%
• Diploma/Advanced Diploma/Associate Degree “NVQ 4-5/HNC/HND/Foundation Degree/Diploma of
Higher Education”- 10.88%
• Bachelor’s Degree/Graduate Certificate/Graduate Diploma “Bachelor’s Degree” - 2.72%
• Master’s programme or doctorate “Master’s
Degree/Post-graduate certificate or diploma/PhD” - 0%
• Other - 21.45%
2% chose third gender or prefer not to say

+ on a positive note
34% Worry: “technological change will threaten my prospects of getting the kind of work I would like to get”.
60% Agree: “technological developments will mean that I will have to retrain many times during my career”.
76% Say: they are excited about the prospect of being able to work flexibly
69% Agree: “I feel confident that I have what it takes to retrain when I am older if my job is automated”
65% Agree: “I am optimistic that technological change will give me job opportunities in the future”
69% Agree: “I know what I need to do to get the job I really want”
68% Agree: “I am confident that I will be able to find the job that I really want”
33%
53%
14%
3D printing/Additive manufacturing 80%
VR (Virtual Reality) 76%
Artificial Intelligence (AI) 65%
Renewable energies 63%
Advanced robotics 55%
AR (Augmented Reality) 46%
Cloud technologies 44%
Internet of Things 24%
Collaborative networks 19%
Healthtech 18%
Big data 14%
Generative Design 14%
BIM (Building Information Modelling) 13%
Genomics 13%
Telematics 9%
Fintech 7%
None of the above 12%
There was good awareness of a range of new technologies:
Australia | 33
say it was not good or terrible
received no career advice
say the career guidance they received at school was OK or good
Youth voice for the future of work
Thoughts from young people who responded to the survey shared by WorldSkills Australia on prospects and preparation
Canadaw
ww
.skillscompetencescanada.com
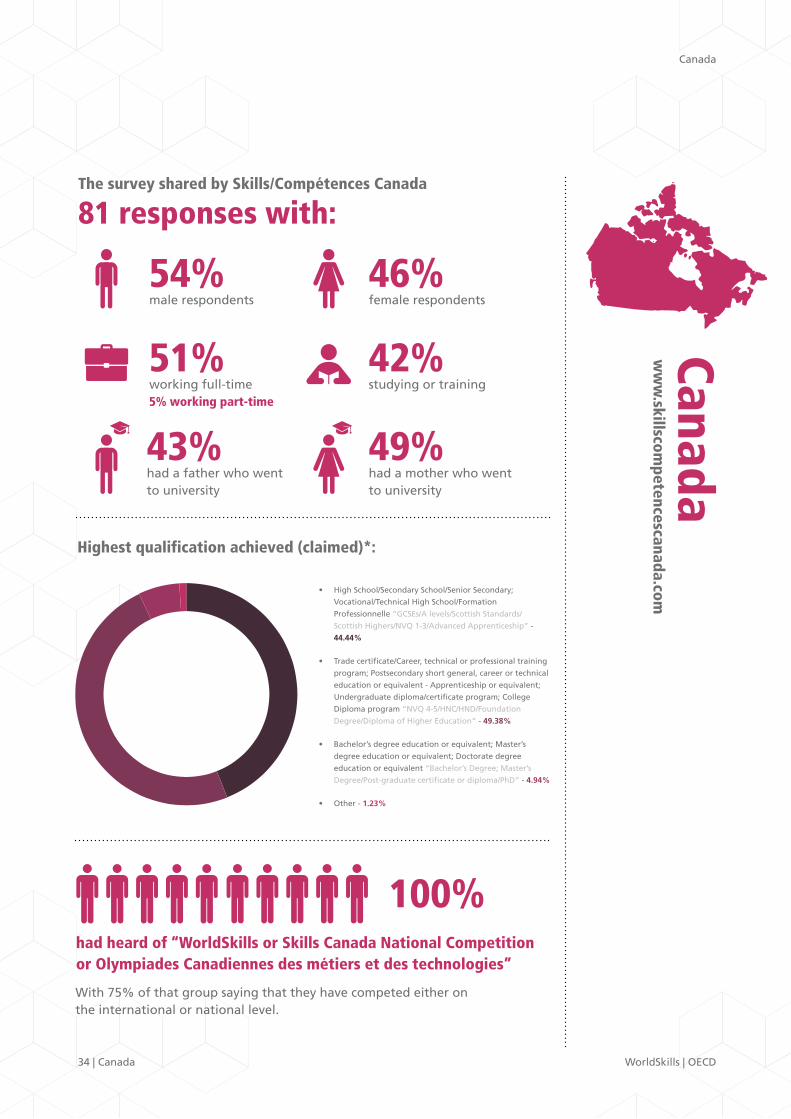
54% male respondents
42% studying or training
51% working full-time5% working part-time
46% female respondents
With 75% of that group saying that they have competed either on the international or national level.
had heard of “WorldSkills or Skills Canada National Competition or Olympiades Canadiennes des métiers et des technologies”
100%
49% had a mother who went to university
43%had a father who wentto university
Highest qualification achieved (claimed)*:
The survey shared by Skills/Compétences Canada
81 responses with:
34 | Canada WorldSkills | OECD
Canada
• High School/Secondary School/Senior Secondary;
Vocational/Technical High School/Formation
Professionnelle “GCSEs/A levels/Scottish Standards/
Scottish Highers/NVQ 1-3/Advanced Apprenticeship” -
44.44%
• Trade certificate/Career, technical or professional training
program; Postsecondary short general, career or technical
education or equivalent - Apprenticeship or equivalent;
Undergraduate diploma/certificate program; College
Diploma program “NVQ 4-5/HNC/HND/Foundation
Degree/Diploma of Higher Education” - 49.38%
• Bachelor’s degree education or equivalent; Master’s
degree education or equivalent; Doctorate degree
education or equivalent “Bachelor’s Degree; Master’s
Degree/Post-graduate certificate or diploma/PhD” - 4.94%
• Other - 1.23%44+49+6+1+M

+ on a positive note
52% Disagree: “I worry that technological change will threaten my prospects of getting the kind of work I would like to get”.
27% Agree: “I worry that technological change will threaten my prospects of getting the kind of work I would like to get”.
68% Say: that they are excited about the prospect of being able to work flexibly
74% Agree: “I feel confident that I have what it takes to retrain when I am older if my job is automated”
70% Agree: “In my country, vocational/technical education/training is highly respected”
70% Agree: “I know what I need to do to get the job I really want”
72% Agree: “I am confident that I will be able to find the job that I really want”
Thoughts from young people who responded to the survey shared by Skills/Compétences Canada on prospects and preparation
3D printing/Additive manufacturing 86%
VR (Virtual Reality) 85%
Artificial Intelligence (AI) 73%
Renewable energies 68%
Advanced robotics 63%
AR (Augmented Reality) 53%
Cloud technologies 52%
Internet of Things 31%
Big data 30%
Healthtech 27%
Genomics 16%
Collaborative networks 14%
BIM (Building Information Modelling) 14%
Generative Design 12%
Telematics 7%
Fintech 2%
None of the above 5%
Canadians show high awareness of technology:
Canada | 35
27%
56%
17%say it was not good or terrible
received no career advice
say the career guidance they received at school was OK or good
Youth voice for the future of work
45+22+15+4+14+M
Francew
ww
.worldskills-france.org
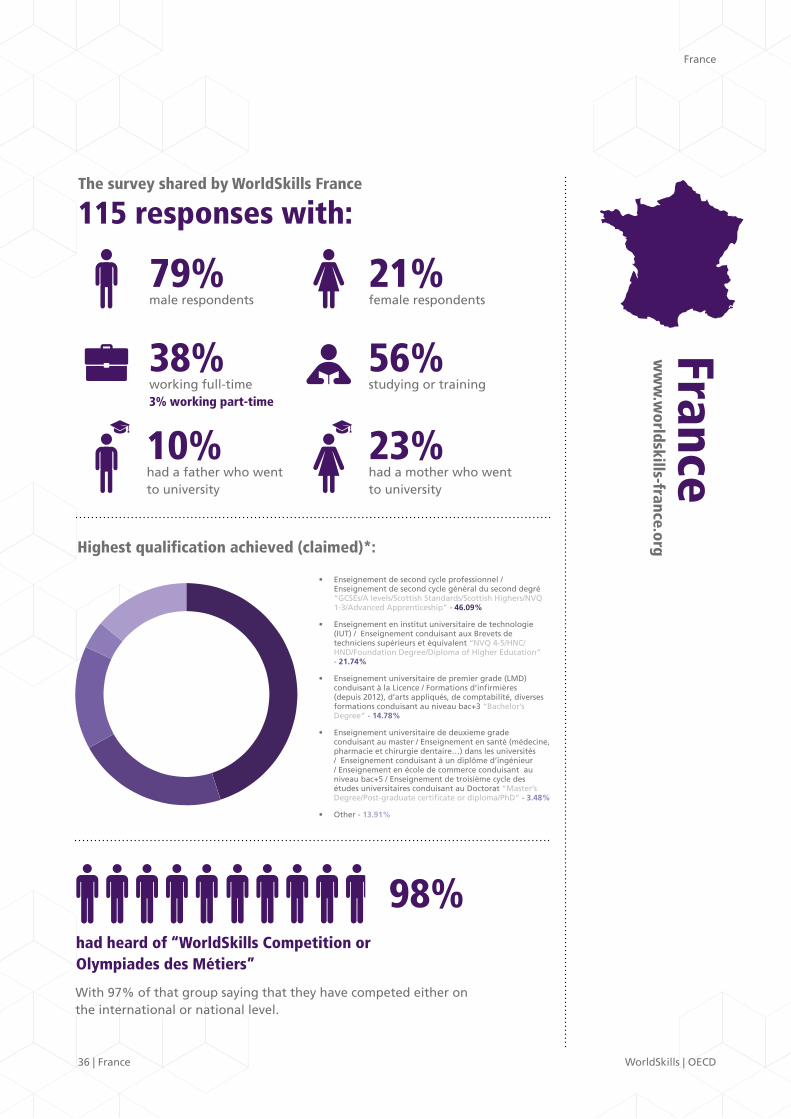
79% male respondents
56% studying or training
38% working full-time3% working part-time
21% female respondents
With 97% of that group saying that they have competed either on the international or national level.
had heard of “WorldSkills Competition or Olympiades des Métiers”
98%
23% had a mother who went to university
10%had a father who wentto university
Highest qualification achieved (claimed)*:
The survey shared by WorldSkills France
115 responses with:
36 | France WorldSkills | OECD
France
• Enseignement de second cycle professionnel / Enseignement de second cycle général du second degré “GCSEs/A levels/Scottish Standards/Scottish Highers/NVQ 1-3/Advanced Apprenticeship” - 46.09%
• Enseignement en institut universitaire de technologie (IUT) / Enseignement conduisant aux Brevets de techniciens supérieurs et équivalent “NVQ 4-5/HNC/HND/Foundation Degree/Diploma of Higher Education” - 21.74%
• Enseignement universitaire de premier grade (LMD) conduisant à la Licence / Formations d’infirmières (depuis 2012), d’arts appliqués, de comptabilité, diverses formations conduisant au niveau bac+3 “Bachelor’s Degree” - 14.78%
• Enseignement universitaire de deuxieme grade conduisant au master / Enseignement en santé (médecine, pharmacie et chirurgie dentaire…) dans les universités / Enseignement conduisant à un diplôme d’ingénieur / Enseignement en école de commerce conduisant au niveau bac+5 / Enseignement de troisième cycle des études universitaires conduisant au Doctorat “Master’s Degree/Post-graduate certificate or diploma/PhD” - 3.48%
• Other - 13.91%

+ on a positive note
24% Agree: ”I worry that technological change will threaten my prospects of getting the kind of work I would like to get”.
30% Agree: “I worry technological developments will mean that I will have to retrain many times during my career”.
56% Worry: there won’t be much demand in the future for the knowledge and skills I have learned
57% Agree: “I have what it takes to retrain when I am older if my job is automated”
86% Agree: “I am confident that I will be able to find the job that I really want”
83% Agree: “I know what I need to do to get the job I really want”
73% Agree: ”I think I might run my own business/enterprise one day”
3D printing/Additive manufacturing 79%
Artificial Intelligence (AI) 74%
VR (Virtual Reality) 74%
Renewable energies 71%
Advanced robotics 65%
AR (Augmented Reality) 59%
Cloud technologies 43%
Collaborative networks 37%
Big data 35%
Healthtech 26%
Internet of Things 25%
BIM (Building Information Modelling) 22%
Generative Design 14%
Genomics 9%
Fintech 8%
Telematics 7%
None of the above 8%
Awareness of new technology was high across a range of technologies:
France | 37
43%
50%
7%say it was not good or terrible
received no career advice
say the career guidance they received at school was OK or good
Youth voice for the future of work
Thoughts from young people who responded to the survey shared by WorldSkills France on prospects and preparation

+55 +10 +4 +M
Russiaw
ww
.worldskills.ru
50% male respondents
61% studying or training
24% working full-time8% working part-time
49% female respondents
With 81% of that group saying that they have competed either on the international or national level.
had heard of “WorldSkills Competition or WorldSkills Russia
96%
47% had a mother who went to university
37%had a father who wentto university
Highest qualification achieved (claimed)*:
The survey shared by WorldSkills Russia
123 responses with:
38 | Russia WorldSkills | OECD
Russia
•
Полное (среднее) общее образование“GCSEs/A levels/Scottish Standards/Scottish Highers/
NVQ 1-3/Advanced Apprenticeship”
- 30.89%
• 31 •
Высшее профессиональное образование(степень бакалавра, специалиста или магистра) “Bachelor’s Degree; Master’s Degree/
Post-graduate certificate or diploma/PhD” - 9.76%
• Other - 4.07%
1% prefer not to say
Среднее профессиональное образование
““NVQ 4-5/HNC/ HND/Foundation Degree/Diploma of Higher Education”
- 55.28%

+ on a positive note
33% Worry: “there won’t be much demand in the future for the knowledge and skills they have learnt”.
72% Say: they are excited about the prospect of being able to work flexibly
66% Agree: “I have what it takes to retrain when I am older if my job is automated”
67% Agree: “I am optimistic that technological change will give me job opportunities in the future”
63% Agree: “I know what I need to do to get the job I really want”
84% Agree: “I think I might attend university one day”
3D printing/Additive manufacturing 72%
Artificial Intelligence (AI) 65%
VR (Virtual Reality) 65%
Advanced robotics 51%
Cloud technologies 44%
Internet of Things 37%
AR (Augmented Reality) 37%
Healthtech 29%
Renewable energies 29%
BIM (Building Information Modelling) 24%
Telematics 23%
Fintech 18%
Big data 16%
Genomics 13%
Collaborative networks 10%
Generative Design 10%
None of the above 6%
Awareness of modern technology was slightly lower in Russia, but still a majority:
Russia | 39
27%
42%
31%say it was not good or terrible
received no career advice
say the career guidance they received at school was OK or good
Youth voice for the future of work
Thoughts from young people who responded to the survey shared by WorldSkills Russia on prospects and preparation
78+13+1+1+7+M
United K
ingdomw
ww
.worldskillsuk.org
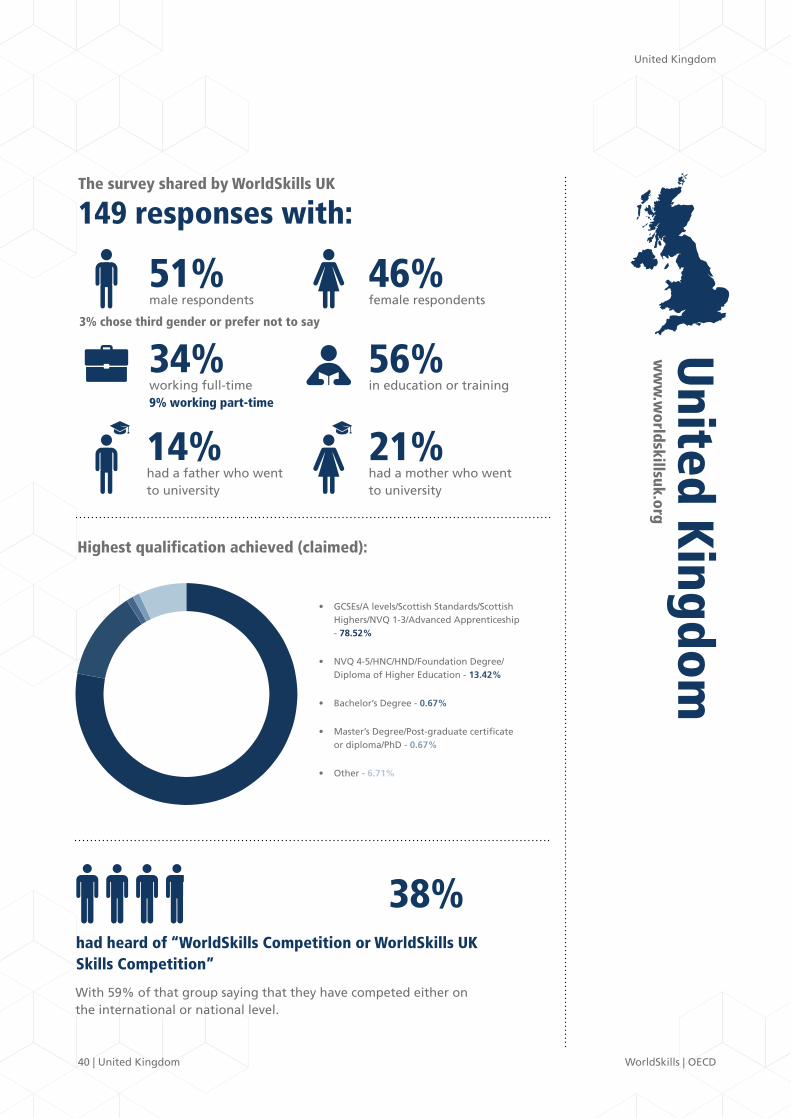
51% male respondents
56% in education or training
34% working full-time9% working part-time
46% female respondents
With 59% of that group saying that they have competed either on the international or national level.
had heard of “WorldSkills Competition or WorldSkills UK Skills Competition”
38%
21% had a mother who went to university
14%had a father who wentto university
Highest qualification achieved (claimed):
The survey shared by WorldSkills UK
149 responses with:
40 | United Kingdom WorldSkills | OECD
United Kingdom
• GCSEs/A levels/Scottish Standards/Scottish Highers/NVQ 1-3/Advanced Apprenticeship - 78.52%
• NVQ 4-5/HNC/HND/Foundation Degree/Diploma of Higher Education - 13.42%
• Bachelor’s Degree - 0.67%
• Master’s Degree/Post-graduate certificate or diploma/PhD - 0.67%
• Other - 6.71%
3% chose third gender or prefer not to say
+ on a positive note
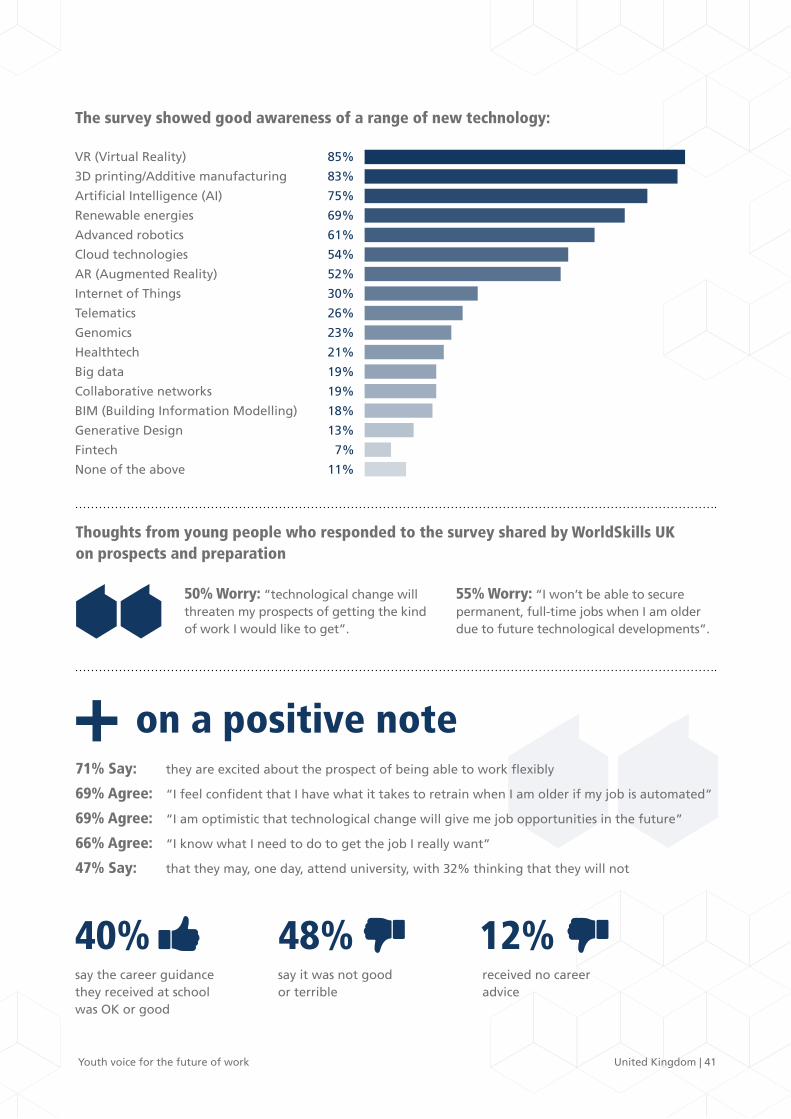
50% Worry: “technological change will threaten my prospects of getting the kind of work I would like to get”.
55% Worry: “I won’t be able to secure permanent, full-time jobs when I am older due to future technological developments”.
71% Say: they are excited about the prospect of being able to work flexibly
69% Agree: “I feel confident that I have what it takes to retrain when I am older if my job is automated”
69% Agree: “I am optimistic that technological change will give me job opportunities in the future”
66% Agree: “I know what I need to do to get the job I really want”
47% Say: that they may, one day, attend university, with 32% thinking that they will not
VR (Virtual Reality) 85%
3D printing/Additive manufacturing 83%
Artificial Intelligence (AI) 75%
Renewable energies 69%
Advanced robotics 61%
Cloud technologies 54%
AR (Augmented Reality) 52%
Internet of Things 30%
Telematics 26%
Genomics 23%
Healthtech 21%
Big data 19%
Collaborative networks 19%
BIM (Building Information Modelling) 18%
Generative Design 13%
Fintech 7%
None of the above 11%
The survey showed good awareness of a range of new technology:
United Kingdom | 41
48%
40%
12%say it was not good or terrible
received no career advice
say the career guidance they received at school was OK or good
Youth voice for the future of work
Thoughts from young people who responded to the survey shared by WorldSkills UK on prospects and preparation

73+17+3+1+6+M
United States of A
merica
ww
w.w
orldskillsusa.org
59% male respondents
48% in education or training
17% working full-time29% working part-time
40% female respondents
With 43% of that group saying that they have competed either on the international or national level.
had heard of “WorldSkills Competition or Skills USA Championships”
80%
37% had a mother who went to went to college/university
29%had a father who went to went to college/university
Highest qualification achieved (claimed):
The survey shared by WordSkills USA
689 responses with:
42 | United States of America WorldSkills | OECD
United States
• High School Diploma, High School Equivalency Diploma or General Educational Development Award (GED) “GCSEs/A levels/Scottish Standards/Scottish Highers/NVQ 1-3/Advanced Apprenticeship”
- 72.86%
• Occupationally-specific technical certificate or Associate Degree “NVQ 4-5/HNC/HND/Foundation
Degree/Diploma of Higher Education” - 17.42%
• Bachelor’s Degree “Bachelor’s Degree” - 2.90%
• Post-graduate/Post-bachelor’s certificates (e.g. teaching credential)/Master’s degree ”Master’s
Degree/Post-graduate certificate or diploma/PhD” - 1.02%
• Other - 5.81%
1% chose third gender of prefer not to say

+ on a positive note
30% Worry: “there won’t be much demand in the future for the knowledge and skills I have learnt”.
28% Worry: “I won’t be able to secure permanent, full-time jobs when I am older due to future technological developments”.
69% Say: they are excited about the prospect of being able to work flexibly
71% Agree: “I feel confident that I have what it takes to retrain when I am older if my job is automated”
76% Agree: “I know what I need to do to get the job I really want”
74% Agree: “I am confident that I will be able to find the job that I really want”
65% Agree: “I feel confident that my job quality and rights as a worker (e.g. pay, benefits, working conditions) will be properly defended in the future”
3D printing/Additive manufacturing 75%
VR (Virtual Reality) 71%
Artificial Intelligence (AI) 61%
Advanced robotics 53%
Renewable energies 46%
AR (Augmented Reality) 38%
Cloud technologies 35%
Internet of Things 27%
Healthtech 26%
Telematics 18%
Collaborative networks 14%
Genomics 14%
BIM (Building Information Modelling) 14%
Big Data 13%
Generative Design 12%
Fintech 3%
None of the above 13%
There was good awareness of many new technologies:
United States of America | 43
23%
67%
10%say it was not good or terrible
received no career advice
say the career guidance they received at school was OK or good
Youth voice for the future of work
Thoughts from young people who responded to the survey shared by WordSkills USA on prospects and preparation

AcknowledgementsThank you to the following organizations who have contributed greatly and made young people’s voices the centre of their work.
Education and Employers is an independent UK based charity launched in 2009 with the vision of “providing children and young people with the inspiration, motivation, knowledge, skills and opportunities they need to help them achieve their potential”. It does this through ensuring that every school and college has an effective partnership with employers, connecting schools and colleges with volunteers from the world of work, quickly, easily and for free using innovative matchmaking technology – for more details: www.inspiringthefuture.org
It undertakes research on the effectiveness of employer engagement in education and works with the leading national bodies representing education leaders, business and government. The charity also works with partners internationally – for more details: www.educationandemployers.org
The research team, led by Dr Elnaz Kashefpakdel (Head of Research) and Christian Percy (Senior advisor), at the charity Education and Employers, have supported WorldSkills and the OECD in designing a weighting regime for the international database provided by OnePoll, and have undertaken detailed analysis of young people’s view about the future of work and their transition to the modern labour market using quantitative methods.
Acknowledgements | 44
WorldSkills Members
WorldSkills Global Industry Partner
Youth voice for the future of work

with the contribution of