y/ts-1613/r3, oak ridge y-12 plant biological monitoring .../67531/metadc740709/m2/1/high... · oak...
TRANSCRIPT

Y/TS-1613/R3
OAK RIDGE Y-12 PLANTBIOLOGICAL MONITORING AND
ABATEMENT PROGRAM PLAN
S. M. AdamsC. C. BrandtS. W. ChristensenM. S. Greeley, Jr.W. R. Hill
M. J. PetersonM. G. Ryon J. G. SmithG. R. SouthworthA. J. Stewart
September 2000
Prepared for the
Oak Ridge Y-12 PlantOak Ridge, Tennessee 37831-8098
managed by LOCKHEED MARTIN ENERGY SYSTEMS, INC.
for the U.S. DEPARTMENT OF ENERGY
under contract DE-AC05-840R21400
DISCLAIMER
This report was prepared as an account of work sponsored by an agency of the UnitedStates Government. Neither the United States Government nor any agency thereof, norany of their employees, makes any warranty, express or implied, or assumes any legalliability or responsibility for the accuracy, completeness, or usefulness of anyinformation, apparatus, product, or process disclosed, or represents that its use wouldnot infringe privately owned rights. Reference herein to any specific commercialproduct, process, or service by trade name, trademark, manufacturer, or otherwise, doesnot necessarily constitute or imply its endorsement, recommendation, or favoring of theUnited States Government or any agency thereof. The views and opinions of authorsexpressed herein do not necessarily state or reflect those of the United StatesGovernment or any agency thereof.
Biological Monitoring and Abatement Program Plan
iii
CONTENTS
Page
List of Figures . . . . . . . . . . . . . . . . . . . . . . . . . . . . . . . . . . . . . . . . . . . . . . . . . . . . . v
List of Tables . . . . . . . . . . . . . . . . . . . . . . . . . . . . . . . . . . . . . . . . . . . . . . . . . . . . . . vi
Acronyms and Abbreviations . . . . . . . . . . . . . . . . . . . . . . . . . . . . . . . . . . . . . . . . . . . vii
Preface . . . . . . . . . . . . . . . . . . . . . . . . . . . . . . . . . . . . . . . . . . . . . . . . . . . . . . . . . . ix
1. INTRODUCTION . . . . . . . . . . . . . . . . . . . . . . . . . . . . . . . . . . . . . . . . . . . . . 1-1
1.1 DESCRIPTION OF THE STUDY AREA . . . . . . . . . . . . . . . . . . . . . . . 1-5
1.2 LAND USE . . . . . . . . . . . . . . . . . . . . . . . . . . . . . . . . . . . . . . . . . . . . . . 1-8
1.3 WATER QUALITY . . . . . . . . . . . . . . . . . . . . . . . . . . . . . . . . . . . . . . . . 1-8
1.4 AMBIENT TEMPERATURE REGIMES . . . . . . . . . . . . . . . . . . . . . . . 1-11
2. AMBIENT TOXICITY MONITORING (TASK 1)
(M.S. Greeley, Jr., and A. J. Stewart) . . . . . . . . . . . . . . . . . . . . . . . . . . . . . . 2-1
2.1 TOXICITY MONITORING . . . . . . . . . . . . . . . . . . . . . . . . . . . . . . . . . . 2-1
3. BIOACCUMULATION MONITORING (TASK 2)
( M. J. Peterson and G. R. Southworth) . . . . . . . . . . . . . . . . . . . . . . . . . . . . 3-1
3.1 BIOACCUMULATION OF CONTAMINANTS IN AQUATIC
ORGANISMS . . . . . . . . . . . . . . . . . . . . . . . . . . . . . . . . . . . . . . . . . . . 3-1
3.2 BIOACCUMULATION MONITORING PROGRAM DESIGN . . . . . . . 3-2
3.2.1 Contaminant Screening . . . . . . . . . . . . . . . . . . . . . . . . . . . . . . . . . 3-3
3.2.2 Contaminant Tracking . . . . . . . . . . . . . . . . . . . . . . . . . . . . . . . . . . 3-3
3.2.3 Source Identification . . . . . . . . . . . . . . . . . . . . . . . . . . . . . . . . . . . 3-3

Oak Ridge Y-12 Plant
iv
4. BIOLOGICAL INDICATORS OF CONTAMINANT-RELATED STRESS
(TASK 3) (S. M. Adams and M. S. Greeley, Jr.) . . . . . . . . . . . . . . . . . . . . . 4-1
4.1 BIOLOGICAL INDICATORS APPROACH . . . . . . . . . . . . . . . . . . . . . 4-1
4.2 BIOINDICATORS OF FISH HEALTH (SUBTASK 3a) . . . . . . . . . . . . 4-1
4.3 BIOINDICATORS OF REPRODUCTIVE COMPETENCE
(SUBTASK 3b) . . . . . . . . . . . . . . . . . . . . . . . . . . . . . . . . . . . . . . . . . . . . . 4-2
4.3.1 Reproductive Bioindicators . . . . . . . . . . . . . . . . . . . . . . . . . . . . . . . 4-2
4.3.2 Developmental Bioindicators . . . . . . . . . . . . . . . . . . . . . . . . . . . . . 4-3
4.4 COMMON DESIGN FOR THE BIOLOGICAL INDICATORS
TASK . . . . . . . . . . . . . . . . . . . . . . . . . . . . . . . . . . . . . . . . . . . . . . . . . 4-3
4.4.1 Sentinel Species . . . . . . . . . . . . . . . . . . . . . . . . . . . . . . . . . . . . . . 4-4
4.4.2 Sites . . . . . . . . . . . . . . . . . . . . . . . . . . . . . . . . . . . . . . . . . . . . . . . 4-4
4.4.3 Sampling Frequency . . . . . . . . . . . . . . . . . . . . . . . . . . . . . . . . . . . 4-5
5. INSTREAM ECOLOGICAL MONITORING (TASK 4) . . . . . . . . . . . . . . . . . 5-1
5.1 PERIPHYTON (SUBTASK 4a) (S. M. Adams and W. R. Hill) . . . . . . . . 5-1
5.1.1 Methods . . . . . . . . . . . . . . . . . . . . . . . . . . . . . . . . . . . . . . . . . . . . 5-2
5.2 BENTHIC MACROINVERTEBRATES (SUBTASK 4b)
(J. G. Smith) . . . . . . . . . . . . . . . . . . . . . . . . . . . . . . . . . . . . . . . . . . . . . 5-3
5.2.1 Benthic Macroinvertebrate Monitoring Task Plan . . . . . . . . . . . . . . 5-4
5.3 FISH COMMUNITY STUDIES (SUBTASK 4c) (M. G. Ryon) . . . . . . . 5-5
5.3.1 Sampling Procedures . . . . . . . . . . . . . . . . . . . . . . . . . . . . . . . . . . . 5-7
5.3.2 Special Studies . . . . . . . . . . . . . . . . . . . . . . . . . . . . . . . . . . . . . . . 5-7
6. DATA INTEGRATION AND INTERPRETATION
(TASK 5) (S. W. Christensen and C. C. Brandt) . . . . . . . . . . . . . . . . . . . . . 6-1
6.1 DATA MANAGEMENT APPROACH . . . . . . . . . . . . . . . . . . . . . . . . . 6-1
7. REFERENCES . . . . . . . . . . . . . . . . . . . . . . . . . . . . . . . . . . . . . . . . . . . . . . . R-1

Biological Monitoring and Abatement Program Plan
v
List of Figures
Page
1.1 Map of the East Fork Poplar Creek watershed showing the locations
of the original BMAP sampling sites . . . . . . . . . . . . . . . . . . . . . . . . . . . . . . . 1-3
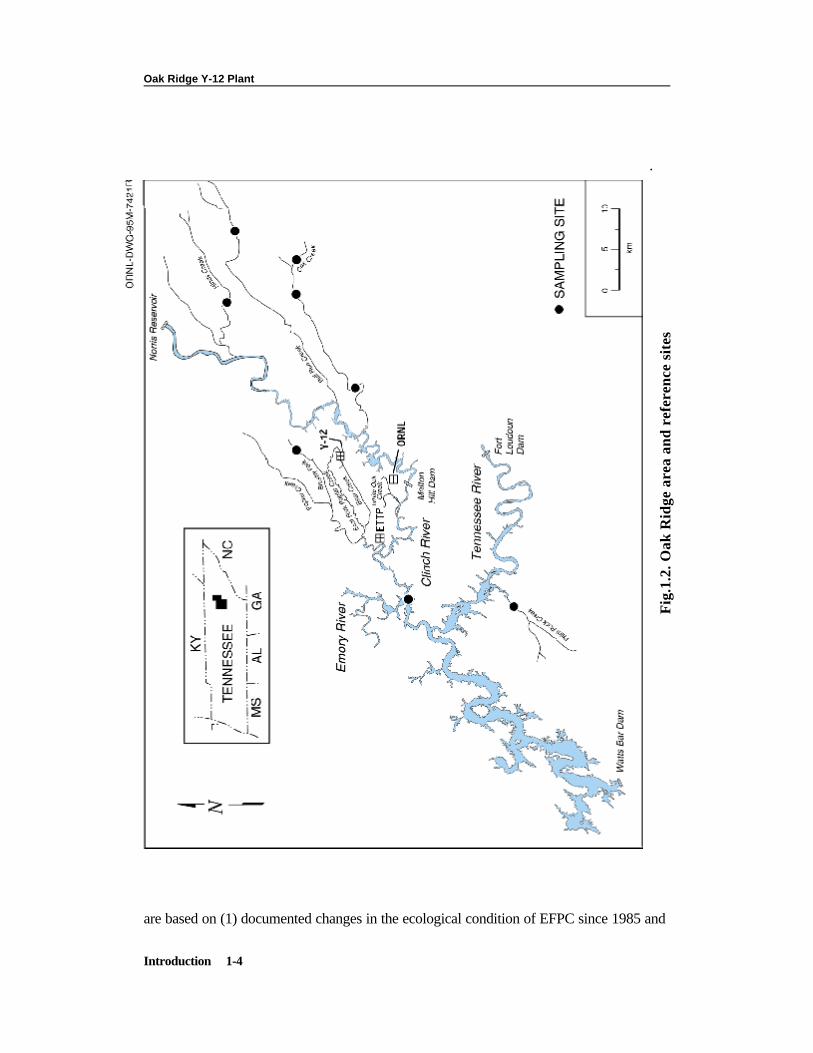
1.2 Map of the Oak Ridge area showing locations of the reference
sites . . . . . . . . . . . . . . . . . . . . . . . . . . . . . . . . . . . . . . . . . . . . . . . . . . . . . . 1-4
1.3 Map of East Fork Poplar Creek as it flows through the Y-12 Plant . . . . . . . . . 1-7

Oak Ridge Y-12 Plant
vi
List of Tables
Page
2.1 Site designations, sample dates, sites of the Ambient Toxicity Monitoring
task for the initial Plan year . . . . . . . . . . . . . . . . . . . . . . . . . . . . . . . . . . . . . 2-2
3.1 Site designations, sampling period, and analyses to be performed for the
Bioaccumulation Monitoring task . . . . . . . . . . . . . . . . . . . . . . . . . . . . . . . . . 3-4
4.1 Site designations, sample period, and sample forms for the Biological Indicator
task . . . . . . . . . . . . . . . . . . . . . . . . . . . . . . . . . . . . . . . . . . . . . . . . . . . . . . 4-5
5.1 Site designations and analyses to be performed for the Periphyton Community task
..5-3
5.2 Sites sampled for the Benthic
Macroinvertebrate Community Studies task . . . . . . . . . . . . . . . . . . . . . . . . 5-5
5.3 Site designations and sampling dates for electrofishing sampling
of the Fish Community Studies task . . . . . . . . . . . . . . . . . . . . . . . . . . . . . . . 5-8

Biological Monitoring and Abatement Program Plan
vii
Acronyms and Abbreviations
BF Brushy Fork
BFK Brushy Fork kilometer
BMAP Biological Monitoring and Abatement Program
BMP Best Management Practices
CRK Clinch River kilometer
DOE U.S. Department of Energy
EFK East Fork Poplar Creek kilometer
EFPC East Fork Poplar Creek
EPA U. S. Environmental Protection Agency
ESD Environmental Sciences Division
FS Feasibility Study
FFA Federal Facilities Agreement
GIS Geographic Information Systems
GSI gonadal-somatic index
HC Hinds Creek
HCK Hinds Creek kilometer
IBI Index of Biotic Integrity
LR Lake Reality
LR-i Lake Reality inlet
LR-o Lake Reality outlet
MGD Million gallons per day
NHP New Hope Pond
NPDES National Pollutant Discharge Elimination System
NSP North/South Pipes
OREIS Oak Ridge Environmental Information System
ORNL Oak Ridge National Laboratory
ORR Oak Ridge Reservation

Oak Ridge Y-12 Plant
viii
ORTF Oak Ridge Task Force
ORWTF Oak Ridge Wastewater Treatment Facility
PAH polycyclic aromatic hydrocarbons
PCB polychlorinated biphenyl
PCK Poplar Creek kilometer
QA/QC Quality Assurance/Quality Control
RCS Revision Control System
RI Remedial Investigation
ROD Record of Decision
RTL Ready-to-Load
SAS Statistical Analysis System
SPMD semi-permeable membrane devices
TDEC Tennessee Department of Environment and Conservation
TIE Toxicant Identification Evaluation
TOA Tennessee Oversight Agreement
TRC total residual chlorine
TSS total suspended solids
TVA Tennessee Valley Authority
USGS U. S. Geological Survey

Biological Monitoring and Abatement Program Plan
ix
PREFACE
The revised Biological Monitoring and Abatement Program (BMAP) for East
Fork Poplar Creek (EFPC) at the Oak Ridge Y-12 Plant, as described, will be conducted
as required by the National Pollutant Discharge Elimination System permit issued for the
Y-12 Plant on April 28, 1995 and became effective July 1, 1995. The basic approach to
biological monitoring used in this program was developed by the staff in the Environmental
Science Division (ESD) at the Oak Ridge National Laboratory (ORNL) at the request of
the Y-12 Plant. The revision to the BMAP plan is based on results of biological
monitoring conducted during the period of 1985 to present. Details of the specific
procedures used in the current routine monitoring program are provided; experimental
designs for future studies are described in less detail. The overall strategy used in
developing this plan was, and continues to be, to use the results obtained from each task to
define the scope of future monitoring efforts. Such efforts may require more intensive
sampling than initially proposed in some areas (e.g., additional bioaccumulation monitoring
if results indicate unexpectedly high PCBs or Hg) or a reduction in sampling intensity in
others (e.g., reduction in the number of sampling sites when no impact is still observed).
The program scope will be re-evaluated annually. By using the results of previous
monitoring efforts to define the current program and to guide us in the development of
future studies, an effective integrated monitoring program has been developed to assess
the impacts of Y-12 Plant operations (past and present) on the biota of EFPC and to
document the ecological effects of remedial actions.

Page
left
blank

Biological Monitoring and Abatement Program Plan
Introduction 1-1
1. INTRODUCTION
In May 1985, a National Pollutant Discharge Elimination System (NPDES) permit
was issued for the Oak Ridge Y-12 Plant, located in Oak Ridge, Tennessee. As a
condition of the permit, a Biological Monitoring and Abatement Program (BMAP) was
developed to demonstrate that the effluent limitations established for the Y-12 Plant
protect the classified uses of the receiving stream [East Fork Poplar Creek (EFPC)], in
particular, the growth and propagation of fish and aquatic life (Loar et al. 1989). A second
objective of the BMAP was to document the ecological effects resulting from the
implementation of a water pollution control program designed to eliminate direct discharges
of wastewaters to EFPC and to minimize the inadvertent release of pollutants to the
environment. Because of the complex nature of the discharges to EFPC and the temporal
and spatial variability in the composition of the discharges, a comprehensive, integrated
approach to biological monitoring was developed. The objectives of the BMAP remain
important today because of ongoing and changing programs and activities at the Y-12
Plant.
The mid-1980's began a period of numerous improvements to the upper reach of
EFPC. Wastewater treatment facilities were constructed to treat specific waste streams,
and all remaining untreated discharges to EFPC were either eliminated or collected for
treatment. A Best Management Practices (BMP) program was initiated that included a
site-specific BMP for the Y-12 Plant. A Spill Prevention Control and Countermeasures
Plan was also implemented, and water quality monitoring was expanded. To help raise the
awareness of the need for environmental compliance, an Environmental Officers
organization was initiated with representatives from each plant division. Improvements that
continued through the 1990's included a reduction in the amount of chlorinated water
entering EFPC, sink and drain surveys that led to reductions of drains in use and
restrictions on others, addition of dechlorination units on EFPC and related outfalls,
enactment of an improved storm water management and sampling plan, and
implementation of a site-wide Pollution Prevention program.
The BMAP consists of four major tasks that reflect different but complementary

Oak Ridge Y-12 Plant
Introduction 1-2
approaches to evaluating the effects of the Y-12 Plant discharges on the biotic integrity of
EFPC. These tasks include (1) toxicity testing, (2) bioaccumulation studies, (3) biological
indicator studies, and (4) ecological surveys of the benthic macroinvertebrate and fish
communities. The results of the previous BMAPs are summarized in Loar et al. (1992a)
and Hinzman et al. (1993, 1998).
In the original BMAP, six primary study sites were selected on EFPC. Criteria used
in the selection of these sites included (1) location of sampling sites utilized in other studies,
(2) known or suspected sources of downstream pollution, (3) proximity to U.S.
Department of Energy Oak Ridge Reservation (DOE ORR) boundaries, (4) concentration
of mercury in adjacent floodplain, (5) appropriate habitat distribution, and (6) access. The
sampling sites included EFPC at kilometer (EFK) 24.4 and EFK 23.4 [above and below
Lake Reality (LR), respectively]; EFK 18.2, located off the ORR and below an area of
intensive commercial and limited light industrial development and just above the area of
greatest mercury contamination (Table 11 in TVA 1986); EFK 13.8, located approximately
400 m above the outfall of the Oak Ridge Wastewater Treatment Facility (ORWTF);
EFK 10.0, located approximately 900 m below Gum Hollow Road bridge and 3.4 km
below the ORWTF; and EFK 6.3, located approximately 1.4 km below the ORR boundary
and 1.0 km above the U.S. Geological Survey (USGS) gaging station (Fig. 1.1). These
sites were routinely sampled for fish and benthic invertebrates as part of the instream
monitoring task (Sect. 5). For other tasks, sites may have been excluded and/or others
added, depending upon the specific objectives of the various tasks; one original site, EFK
10.0, has not been routinely sampled by any task for several years.
Brushy Fork (BF) at kilometer (BFK) 7.6 has been used as a reference stream in all
four tasks of the BMAP. Additional sites off the ORR were also used for reference,
including Beaver Creek, Bull Run, Hinds Creek, Paint Rock Creek, and the Emory River
in Watts Bar Reservoir (Fig. 1.2).
A new NPDES permit was issued by the Tennessee Department of Environment and
Conservation (TDEC) to the Y-12 Plant April 26, 1995 and became effective July 1, 1995.
BMAP Plan Y/TS-1613/R1 was submitted to TDEC in March 1998. This plan was
subsequently revised and Y/TS-1613/R2 was approved by TDEC in October, 1998. The
current revision of the BMAP plan meets the requirements of the permit. Plan revisions

Biological Monitoring and Abatement Program Plan
Introduction 1-3
Oak Ridge Y-12 Plant
Introduction 1-4
Fig
.1.2
. Oak
Rid
ge a
rea
and
refe
renc
e si
tes
.
are based on (1) documented changes in the ecological condition of EFPC since 1985 and

Biological Monitoring and Abatement Program Plan
*Poplar Creek Kilometer (PCK) 0.0 and East Fork Poplar Creek Kilometer (EFK 0.0) are located at the confluence of Poplar Creek with theClinch River and at the confluence of East Fork Poplar Creek with Poplar Creek, respectively. All discharges are based on the list of keyfeatures described in Table I-1 in TVA 1986.
Introduction 1-5
(2) the need to evaluate the effects of continuing changes in the composition of discharges
resulting from scheduled abatement and remedial actions at the Y-12 Plant.
To understand the nature and complexity of the existing environment, a brief
description of the EFPC watershed is given below. Detailed descriptions of each task are
presented in Sects. 2–6.
1.1 DESCRIPTION OF THE STUDY AREA
The EFPC drainage basin is located near the northern boundary of the ORR and has
an area of 77.2 km2 from the headwaters to the mouth at Poplar Creek kilometer (PCK)
8.7*. Parallel northeast-tending ridges constitute the northern (Black Oak Ridge) and
southern (Chestnut Ridge) boundaries of the watershed. Elevations in the basin range
from 226 to 390 m. The largest tributary to EFPC is Bear Creek, which has a drainage
area of 19.1 km2 and joins EFPC at kilometer (EFK) 2.4*. The Y-12 Plant is located near
the watershed divide of Bear Creek and EFPC, which flow to the west and east,
respectively, of the Plant (Fig. 1.1).
The study area is located in the Valley and Ridge physiographic province of the
Southern Appalachians. The ridges are composed primarily of sandstones and dolostones
and the valleys are underlain by shales, limy shales, and limestones (Geraghty and Miller,
Inc. 1985). The principal groundwater-bearing formation in the Oak Ridge area is the
Knox Dolomite which comprises 25 percent of the surface area of the EFPC drainage
basin; another 32 percent of the area consists of Chickamauga Limestone.
The primary reference area used in the BMAP is the BF watershed located just
north of Oak Ridge and adjacent to the EFPC watershed (Fig. 1.2). The two drainages,
which are separated by Black Oak Ridge, have a similar geologic composition. The Knox
Dolomite that underlies Black Oak Ridge is the source of three large springs that are
tributaries to BF above the study site (BFK 7.6). The almost identical unit-area, low-flow
discharges (~0.95 L3•sec-1•km-2) EFPC at EFK 5.3 and BF at BFK 10.1 provide additional

Oak Ridge Y-12 Plant
Introduction 1-6
evidence of the similarity in their geologic composition.
The headwaters of EFPC consist of springs on the northwest slope of Chestnut
Ridge. The stream originates at the North/South Pipes (NSP) into a rip-rap channel
approximately 2.4 m wide and 2.6 m high (Kasten 1986). In the past, the stream received
discharges from more than 200 outfalls (M. C. Wiest, Y-12 Plant Department of
Environmental Management, personal communication). These discharges included once-
through cooling water, storm water, condensate, groundwater, cooling tower blowdown,
and treated process wastewater (CDM Federal 1994).
Prior to November 7, 1988, EFPC flowed into New Hope Pond (NHP), a 2.2-ha
impoundment constructed in 1963 to equalize the pH of the effluent from the Y-12 Plant
(Pritz and Sanders 1982). The pond was also used for neutralization, sediment retention,
and spill control (including provision for oil recovery by means of skimmers). Construction
of a bypass (diversion) channel around NHP permitted retention of spills within the pond.
On November 7, 1988, flow to the pond was terminated and directed to Lake Reality
(LR), a new 1-ha impoundment that is slightly deeper than NHP, and has a synthetic liner
(Fig. 1.3). In addition, the outlet from LR was lower in elevation than that of NHP,
allowing the passage of fish into upper EFPC. Prior to this time, fish could not migrate
upstream of NHP due to a weir at the entrance to NHP. Since July 9, 1998, stream flow
has been diverted around LR (except for some portion of peak flow events which will flow
through LR) and into EFPC over a diversion channel waterfall which re-established a
barrier to fish migration. From the outlet of the diversion channel, EFPC flows a distance
of 23.4 km to the confluence with Poplar Creek, a tributary of the Clinch River. The
average gradient between the upstream limits of the reservoir backwater area and EFPC
at LR is approximately 1.7 m/km (TVA 1985).
Effluent discharges from the Y-12 Plant above LR and from the ORWTF at EFK
13.4 augment streamflow of EFPC. Since July 1996, approximately 4.5 million gallons of
raw water per day are pumped from the Clinch River and added to EFPC at a point
approximately 50 feet below Outfall 2000 (North/South Pipes). This allows EFPC flow to
be managed at 7 million gallons per day (monthly daily average) at Station 17, as required
by the NPDES Permit.
A resultant characteristic of streamflow in EFPC is lower temporal variability due to

Biological Monitoring and Abatement Program Plan
Introduction 1-7
Fig
.1.3
. Map
of
Eas
t F
ork
Pop
lar
Cre
ek a
s it
flo
ws
thro
ugh
the
Y-1
2P
lant

Oak Ridge Y-12 Plant
Introduction 1-8
the near-constant average daily flow at Station 17. Although the increased minimum flow
may benefit aquatic biota by reducing the risk of streambed dewatering, increased flow
stability also lowers environmental heterogeneity (i.e., habitat diversity), which can
adversely affect species richness and/or density.
1.2 LAND USE
Land use in the EFPC watershed reflects the public and private ownership of
property in the basin. The creek flows less than 1 km below LR before leaving the ORR
at EFK 22.7. For the next 15 km, EFPC flows through the city of Oak Ridge, which had a
population of 27,310 in 1990 (Southeast Directory Co., Inc. 1995), before crossing the
ORR boundary again at EFK 7.7 for the remainder of its course. The lower portion of the
watershed within the ORR is undeveloped, consisting mostly of pine plantations and mixed
hardwood stands. Many pine plantations on the ORR have been destroyed as a result of
pine beetle infestations.
Land use in Oak Ridge consists mostly of commercial and residential developments,
some light industry and agriculture, and forested areas. Most of the industrial development
is limited to the northeastern part of the basin. Drainage from this area enters EFPC
between EFK 22.5 and EFK 21.5. Commercial development occupies much of the
floodplain and adjacent areas of the creek from EFK 22.5 to EFK 18.0. Farther
downstream to the ORR boundary, residential and some agricultural development
(primarily livestock grazing) occur. Construction of single and multifamily homes between
EFPC and Route 95 (Oak Ridge Turnpike), which parallels EFPC west of Oak Ridge,
continues to increase.
1.3 WATER QUALITY
Water and sediments in EFPC downstream from the Y-12 Plant contain metals,
organic chemicals, and radionuclides discharged over many years of operation. Most of
the information about these contaminants was obtained in studies conducted by TVA for
the Oak Ridge Task Force (ORTF), a multiagency group established in November 1983 to
evaluate potential off-site contamination problems associated with the DOE facilities near
Oak Ridge. Prior to 1983, the only surveys of ambient water quality in EFPC below NHP

Biological Monitoring and Abatement Program Plan
Introduction 1-9
(currently LR) were those conducted in 1961–1964 (McMasters 1967) and 1974–1975
(ERDA 1975).
The ORTF survey involved extensive sampling both on and off the ORR. Water
samples were taken at EFK 23.1 during the baseflow survey and analyzed for
conventional parameters, priority pollutants (organics and metals) and radionuclides; only
lithium and mercury exceeded background levels (Table 3 in TVA 1986). Sediment
samples were collected from EFPC and the floodplain near EFK 21.7 and EFK 2.7 and
from the western and eastern ends of NHP; samples were analyzed for 114 organics, 14
metals, and 12 radionuclides (Table I in Hoffman et al. 1984). Of these, 10 priority
pollutants [7 polycyclic aromatic hydrocarbons or PAHs, bis (2-ethyl hexyl) phthalate, total
polychlorinated biphenyls (PCBs) and total phenols] and 7 metals (arsenic, cadmium, lead,
mercury, nickel, silver, and zirconium) were found in EFPC at concentrations above
background levels and/or above the analytical detection limit (Table 4 in TVA 1986).
Additional and more extensive sampling of sediments in EFPC was conducted to estimate
the quantity of mercury-contaminated sediment and floodplain deposits and to assess the
transport and/or stability of mercury-contaminated sediment in the EFPC watershed (TVA
1985).
Water quality characterizations for BMAP have been based on analyses of NPDES
data collected at the outfalls of NHP (before November 1988) and LR [Stations 303 (now
eliminated) and 17, respectively]. Additional information was provided from supplemental
analyses conducted in various subtasks of the BMAP, including (1) routine measurements
of several conventional parameters as part of the toxicity testing protocol (Sect. 2.1) and
(2) nonroutine water and sediment sampling as part of the bioaccumulation and periphyton
tasks, respectively (Sects. 3 and 5). Elevated levels of copper, lithium, mercury, ammonia,
nitrogen, residual chlorine, and perchloroethylene were identified and discussed in previous
reviews (Loar et al. 1992a). Water in EFPC is enriched in nutrients (nitrogen and
phosphorus) that stimulate biological activity. Mercury levels were of particular concern in
that the mean and maximum values exceeded the Environmental Protection Agency
(EPA) chronic value of 1.2 Fg/L (EPA 1986) over the 1988–91 study period (Hinzman et
al. 1998). Concentrations of total residual chlorine were of concern prior to 1992, when a

Oak Ridge Y-12 Plant
Introduction 1-10
dechlorination project was implemented in upper EFPC.
Lower EFPC and its floodplain were the subjects of a remedial investigation (RI) and
feasibility study (FS) that culminated in a record of decision (ROD). Under the ROD that
was signed August 18, 1995, areas of the EFPC floodplain containing soil contaminated
with >400 mg mercury/kg were excavated, and the soil replaced with clean soil
(SAIC 1995). The decision was based on administrative record for Lower EFPC,
including the RI report (DOE 1994a), the baseline risk assessment, the FS report (DOE
1994b), the addendum to the RI (DOE 1994c) that includes the sediment toxicity special
study, the proposed plan (DOE 1995a,b), and other documents contained in the
administrative record file for the site (DOE 1995c).
Results from the first phase of the soil, sediment, groundwater, and surface sampling
in the RI showed detectable levels of 13 heavy metals, 9 PAHs, 2 PCBs, and 11
radionuclides (DOE 1994a, 1995c). For heavy metals, mercury was by far the most
significant contributor of human health risk with over 85 percent of the total toxicity. For
radionuclides, total uranium accounted for 98 percent of the total activity. The organic
compound groups of PAHs and PCBs did not substantially contribute to the estimated
risks to human health. Risk associated with exposure to radionuclides fell within the EPA
acceptable target range in all cases. The results of the baseline human health assessment
confirmed mercury as the predominant contaminant of concern in Lower EFPC (DOE
1995c).
The RI (DOE 1994a) concluded that there was ongoing risk to ecological resources,
especially aquatic organisms in the upper part of the creek, from exposure to contaminants
in environmental media and food. Mercury was the primary contaminant of concern in the
sediment and floodplain soils. PCBs were a contaminant of concern associated with biota
(DOE 1995c). Toxicity studies (DOE 1994c) showed no toxicity to test organisms from
chemicals extracted when sediment was suspended in water. Sediment-based food chain
effects were also evaluated (DOE 1995a). The food chain is the most important exposure
pathway for terrestrial organisms (DOE 1995c). Initial results from the RI report (DOE
1995c) indicated that there are potential risks to terrestrial organisms. Additional studies
were conducted to determine the relationship of apparent risks to soil mercury
concentrations (DOE 1994c). These studies included analysis of organisms exposed in

Biological Monitoring and Abatement Program Plan
Introduction 1-11
wetlands and expanded analysis of mercury content in vegetation. These studies
concluded that there is no threat to plant communities from mercury in floodplain soils.
Mercury concentrations in some floodplain soils prior to remediation were a potential
threat to biota by exposure through the food chain (DOE 1995c).
1.4 AMBIENT TEMPERATURE REGIMES
Water temperatures have been monitored at three sites in EFPC downstream of LR,
one site upstream of LR, and in BF. Since July 1996, a temperature drop of approximately
5EC was observed along the length of upper EFPC due to the Flow Management Project,
which is providing approximately 4.5 million gallons of raw water per day to EFPC
immediately below Outfall 200. Before the Flow Management Project, mean water
temperatures averaged 4–7EC higher year-round at EFK 23.4 than in BF. Temperatures
in the streams are now much more similar during the summer months (e.g., 19EC in BF
and 21EC in EFPC during August 1997) while remaining several degrees higher in upper
EFPC during late fall to early spring (e.g., 14EC in BF and 19EC in EFPC during October
1997). A gradient of decreasing temperatures with increasing distance downstream of the
Y-12 Plant remains a characteristic of EFPC. Temperatures in EFPC have been
monitored by BMAP for approximately 15 years, including nearly 4 years of Flow
Management. Because spatial and temporal patterns of temperature fluctuation within
EFPC are now well-characterized, the BMAP temperature monitoring program is being
discontinued in this new plan. Water temperatures continue to be monitored by the Y-12
Plant at sites within upper EFPC. The results of this monitoring is submitted to TDEC
annually.

Biological Monitoring and Abatement Program Plan
Ambient Toxicity Monitoring 2-1
2. AMBIENT TOXICITY MONITORING (TASK 1)
M. S. Greeley, Jr., and A. J. Stewart
The ambient toxicity monitoring task uses U.S. Environmental Protection Agency
(EPA) approved methods with Ceriodaphnia dubia and fathead larvae to provide
systematic information that can be used to determine changes in the biological quality of
water in EFPC through time. Supporting studies have been used to (1) investigate the
relationship between the physicochemical and biological conditions in EFPC, particularly as
they relate to processes or rates of ecological recovery, and (2) develop better methods
for accurately predicting ecological recovery with changes in water quality in EFPC.
Toxicity monitoring is conducted quarterly at EFK 24.1 (a site just upstream of Lake
Reality) with Ceriodaphnia , and at Outfall 201 (near the North-South Pipes) with fathead
minnows and Ceriodaphnia , in accordance with the Y-12 Plant National Pollutant
Discharge Elimination System (NPDES) permit. No adverse effect of Y-12 Plant effluent
has been detected at either site since the implementation of Flow Management in 1996.
The majority of the earlier toxicity test failures at these two upstream sites were caused
by chlorine (Stewart et al. 1996), which now has been largely eliminated.
Static-renewal tests with Ceriodaphnia and fathead minnow larvae, which use
grab samples of water and moderately short (7-day) exposure periods, are more
appropriate for monitoring effluent streams than ambient water sources. As water-quality
conditions continue to improve in EFPC, these tests are increasingly less useful for
demonstrating further water-quality improvements.
2.1 TOXICITY MONITORING
This Plan describes a phased approach to modifying the current ambient-monitoring

Oak Ridge Y-12 Plant
Ambient Toxicity Monitoring 2-2
task to better address the needs of the Y-12 Plant and the monitoring program. During the
first year of this Plan, water from EFK 24.1 and Outfall 201 (EFK 25.1) will continue to
be tested quarterly for acute and chronic toxicity to Ceriodaphnia and fathead minnows,
using standard EPA-approved procedures. The two sites to be monitored in this manner
are EFK 24.1 and Outfall 201 (EFK 25.1) (see Fig. 1.3 and Table 2.1); the latter site is
tested in accordance with the Y-12 Plant National Pollutant Discharge Elimination System
(NPDES) permit. On each test day, water samples will be analyzed for pH, conductivity,
alkalinity, hardness, total residual chlorine (TRC), and total suspended solids (TSS).
In addition, several alternatives to the ambient Ceriodaphnia and fathead minnow
testing will be explored during the first year of the Plan with the intent of replacing at least
the EFK 24.1 tests during subsequent years with more appropriate procedures. Possible
candidates include the medaka test (Section 4) and other laboratory-based tests, and in
situ tests with species such as Sphaerium fabale (fingernail clam: Section 5.2) and Elimia
clavaeformis and/or Pleurocera unicale (pleurocerid snails). The two snail taxa are
common at sites in EFPC downstream from the Y-12 Plant, but are not prevalent at sites
upstream of Bear Creek Road. In situ tests with fingernail clams have been used
previously for site characterization and biomonitoring in EFPC (Smith and Beauchamp
2000). These taxa are particularly useful for monitoring of conditions in EFPC because
they are relatively long-lived and respond measurably to poor water quality. Proposed
changes to the ambient toxicity monitoring task will be evaluated annually. The frequency
of Ceriodaphnia and fathead minnow tests is expected to decrease during subsequent
years of the Plan as alternative monitoring strategies are phased in.
Table 2.1. Site designations, sample dates, and sitesof the Ambient Toxicity Monitoring task for the initial Plan year
Site Sample Dates Test Frequency
EFKa 25.1b Jun. 1990 - Present Quarterly
EFK 24.1 Dec. 1988 - Present Quarterly aEFK = East Fork Poplar Creek kilometer bOutfall 201 (EFK 25.1) tested in accordance with the Y-12 Plant National Pollutant Discharge Elimination System (NPDES) permit.

Biological Monitoring and Abatement Program Plan
Bioaccumulation Monitoring 3-1
3. BIOACCUMULATION MONITORING (TASK 2)
M. J. Peterson and G. R. Southworth
3.1 BIOACCUMULATION OF CONTAMINANTS IN AQUATIC
ORGANISMS
Contaminants from the Y-12 Plant may affect aquatic organisms directly, or may be
accumulated in organism tissues resulting in exposure and impacts further up the food
chain (e.g., in man or terrestrial animal species). Previous studies have indicated that
contaminants commonly measured in biota, such as mercury, zinc, PAHs, and PCBs, could
also be negatively affecting aquatic organisms in EFPC, although the importance of these
contaminants in relation to other factors is not well understood (Loar et al. 1992a, Hinzman
et al 1993, Ham et al. 1997). Better understood are the potential risks to humans and
wildlife that eat contaminated fish. Monitoring of EFPC has identified mercury and PCBs
as substances that accumulate to levels in fish that pose health concerns to human
consumers as well as terrestrial wildlife (Loar et al. 1992a, Hinzman et al. 1993, Sample et
al. 1996). Metals other than mercury continue to be elevated in periphyton and fish near
the Y-12 Plant, and although reported levels in fish filets do not appear to indicate a human
health concern, the concentrations in whole fish may be of ecological relevance.
Historically, the bioaccumulation task provided an assessment of the level of concern
regarding contaminants in EFPC biota (contaminant screening), an evaluation of changes
in contaminant levels as a consequence of abatement actions that change contaminant
loading or availability (contaminant tracking), and identified contaminant sources and
pathways to biota so actions could be effectively taken to reduce contaminant levels in
aquatic organisms (source identification). Contaminant screening studies designed to
characterize the system were the major focus of the bioaccumulation task in the early
years of the BMAP, when a large number of locations, species, and analytes were
monitored. Early efforts indicated that mercury and PCBs were the primary contaminants

Oak Ridge Y-12 Plant
Bioaccumulation Monitoring 3-2
of concern, a spatial pattern of higher concentrations nearest the Y-12 Plant with
decreasing concentrations downstream was evident, and larger and/or fattier species
contained the highest concentrations. The more recent focus has been on evaluating
changes in the concentrations of mercury and PCBs in fish (primarily redbreast sunfish) as
the result of various actions taken at the Y-12 Plant. In addition to providing a reliable
measure of change in human health concerns, the long-term measurement of fish
concentrations provides an important measure of contaminant exposure for evaluating in-
stream ecological impacts.
Identifying contaminant sources and understanding contaminant pathways to biota is
an important consideration for determining the appropriate abatement actions to apply.
Investigative BMAP activities have used passive PCB monitors (SPMDs, or
semipermeable membrane devices) to document PCB sources in both the Y-12 storm
drain network and open creek channel, while studies on the relationship between aqueous
mercury concentrations, water quality, and accumulation in fish have provided valuable
information for predicting the consequences of various Y-12 actions as well as suggesting
appropriate reduction strategies.
3.2 BIOACCUMULATION MONITORING PROGRAM DESIGN
Routine monitoring of the contaminants of most concern in fish from EFPC will
continue under this Plan. Bioaccumulation monitoring is a key component of any biological
monitoring program, as it provides key measures of exposure that may help explain the
physiological and ecological effects observed, as well as a measure of human health
concerns. Of crucial value is the long-term consistent sampling regime that has provided
an important measure of change in contaminants over time. The temporal tracking effort
is the main current focus of this task. Requirements for sampling of sunfish at downstream
sites (Poplar Creek for Hg, EFK 6.3 for PCBs) and monitoring of stonerollers at EFK 24.5
will be evaluated annually against improving conditions in EFPC and continuing trends in
the data generated by these activities. A more detailed outline of the bioaccumulation task
is presented in Table 3.1.

Biological Monitoring and Abatement Program Plan
Bioaccumulation Monitoring 3-3
3.2.1 Contaminant Screening
Assessment of the degree of contamination in EFPC will center on evaluation of the
maximum human and ecotoxicological health risks associated with EFPC fish. The
maximum human health concerns in EFPC are associated with larger, older fish such as
largemouth bass or carp. Largemouth bass are a highly sought-after game fish that are
abundant in upper EFPC and have been shown to accumulate elevated levels of mercury
and PCBs. Four bass will be collected once yearly from two upper EFPC sites, LR and
EFK 23.4, and the filets analyzed for mercury and PCBs.
Whole-body analyses of herbivorous minnows are used for evaluating
ecotoxicological concerns associated with Y-12 discharges. Screening of edible tissues of
fish for metals (other than mercury) has not yielded evidence of a human health concern in
EFPC, but herbivorous forage fish have contained elevated concentrations of PCBs and
some metals. Three composite samples of stonerollers will be analyzed for a suite of
metals, or other contaminants of concern if warranted, at EFK 24.8 once yearly.
3.2.2 Contaminant Tracking
Redbreast sunfish will continue to be the primary species utilized in tracking studies.
Using the same species and sites since 1985 provides an uninterrupted record of changes
in mercury and PCB exposure in EFPC. Redbreast sunfish sampling will be conducted
twice yearly in EFPC to adequately evaluate changes in contamination over time. Six fish
will be collected from each site. Because mercury remains elevated in fish downstream
of EFPC, annual monitoring of sunfish will continue at two downstream sites (one in
Poplar Creek and one in the Clinch River).
3.2.3 Source Identification
Source identification efforts will be discontinued at this time. On an “as-needed”
basis, efforts to identify sources or understand processes regarding contaminants in EFPC
will be conducted as requested by the Y-12 compliance organization.

Oak Ridge Y-12 Plant
Bioaccumulation Monitoring 3-4
Table 3.1 Site designations, sampling period, and analyses to be performed forthe Bioaccumulation Monitoring task
Analyses
Site Sampling period Mercury PCBs Metals Frequency
EFKa 24.5 May 1991- present X X X Biannual
EFK 23.4 May 1985- present X X Biannual
EFK 18.2 May 1985- present X X Biannual
EFK 13.8 May 1985- present X X Biannual
EFK 6.3 May 1985- present X X Biannual
PCKb 1.6 Dec. 1987- present X Annual
CRKc 15.0 Nov. 1987- present X Annual
Hinds Creek(reference)
May 1985- present X X X Biannual
aEast Fork Poplar Creek kilometer.bPoplar Creek kilometer.cClinch River kilometer.

Biological Monitoring and Abatement Program Plan
Biological Indicators 4-1
4. BIOLOGICAL INDICATORS OF CONTAMINANT-
RELATED STRESS (TASK 3)
S. M. Adams and M. S. Greeley, Jr.
4.1 BIOLOGICAL INDICATORS APPROACH
The biological indicators task consists of two subtasks: (1) bioindicators of fish health
and (2) bioindicators of reproductive competence. This task involves the use and
application of various bioindicators of fish health and reproductive competence to evaluate
the effects of water quality on the health of fish in EFPC. A suite of health bioindicators
has been used since the fall of 1985 and reproductive bioindicators since 1988 to evaluate
the health of an important indicator species, the redbreast sunfish, in EFPC as a
component of the BMAP program (Loar et al. 1989; Loar et al. 1992a; Hinzman
et al. 1998; Adams et al. 1989; Adams et al. 1992a).
Bioindicators have been used successfully to (1) evaluate the effect of water quality
and other environmental variables on the health of individual fish populations in EFPC,
(2) determine the effectiveness of past and ongoing remedial actions on these fish
populations, and (3) aid in the identification of causative agents or mechanisms responsible
for observed effects on aquatic ecosystem health. It is only through an understanding of
such effects and mechanisms that reliable and defensible decisions can be made
concerning the specific remedial actions to be undertaken and the application of the
appropriate monitoring strategies for assessing the effectiveness of such actions. Results
of bioindicator studies to date indicate that the health status of sunfish continues to improve
in response to remedial actions within the EFPC watershed, although fish remain
chronically stressed particularly in the upper sections of the stream.
4.2 BIOINDICATORS OF FISH HEALTH (SUBTASK 3a)
The original BMAP sampling plan for the Y-12 Plant included measurement of a
wide variety of indicators at each of several levels of biological organization. Because
bioindicator-type studies had not been conducted in EFPC at the time of issuance of the
original plan, the basic strategy of initial sampling was to measure a large suite of
Oak Ridge Y-12 Plant
Biological Indicators 4-2
indicators and responses representative of several levels of biological organization. After
several years of screening and evaluation of the bioindicator data, a subset of the most
effective bioindicators was chosen for future monitoring. The principal functional
bioindicator groups included in the remaining subset are (1) detoxification enzymes (P450
enzymes), (2) metabolic dysfunction indicators (blood biochemical parameters), (3)
condition indices (liver, spleen, and fat-somatic indices), (4) bioenergetic function
parameters (indicators of lipid status), (5) indicators of feeding and nutrition (lipid indices,
amount of food consumed, condition of gall bladder) , (6) reproductive responses
(measures of fecundity, atresia, steroid hormones), and (7) population-level indices
(growth, size-frequency distributions).
4.3 BIOINDICATORS OF REPRODUCTIVE COMPETENCE (SUBTASK 3b)
Reproduction is widely considered to be the most critical life function affected by
chronic contaminant-related stress (Birge et al. 1985). The ability to successfully
reproduce is essential for the establishment and continued maintenance of viable fish
populations. In addition, certain reproductive processes, including egg production (Suter et
al. 1987) and embryonic development (Adams and Greeley 1993), are among the most
sensitive life stages to environmental toxicants. Reproduction (propagation) of aquatic life
is a classified use of EFPC as determined by the State of Tennessee. Goals of the
reproductive competence subtask include characterization of the reproductive competence
of fish populations in EFPC downstream of the Y-12 Plant, relating reproductive
bioindicator responses measured in adult fish from EFPC to the actual recruitment success
of select species, and monitoring the potential adverse effects of EFPC water on fish
embryonic and larval development.
4.3.1 Reproductive Bioindicators
For each EFPC and reference site, gonadal condition of adult fish will be assessed
by calculating the gonadal-somatic index (GSI, the percentage of total body weight
contributed by the gonad) and by visual examination of gonadal appearance (color, shape,
and, in females, gross appearance of the oocytes). Estimates of oocyte abundance and
oocyte developmental stages will be determined for females. Particular emphasis will be
Biological Monitoring and Abatement Program Plan
Biological Indicators 4-3
placed on determining fecundity through enumeration of oocytes in the developing
clutches, quantifying oocyte atresia and reabsorption, and obtaining a value for total
vitellogenic oocytes (an indirect measure of the bioenergetic effort expended during the
reproductive process). Plasma concentrations of estradiol and testosterone will be
measured in female fish, and 11-ketotestosterone and testosterone in male fish (if
sufficient plasma is available for each of these assays following completion of the various
plasma assays associated with the bioindicators of fish health subtask).
4.3.2 Developmental Bioindicators
One potential cause for the lack of reproductive success in fish populations, in
addition to observable problems with adult reproductive activities, is the failure of spawned
eggs to develop properly into new reproductive cohorts. Fertilized eggs of the Japanese
medaka experience a high percentage of developmental failure when exposed to EFPC
water during embryonic and early fry development. Direct chemical toxicity to developing
embryos and fry could partially explain the continuing absence from upper EFPC of
reproducing populations of several pollution-sensitive fish species native to this area. An
ongoing toxicant identification evaluation (TIE) aimed at identifying the factors responsible
for the developmental effects seen in the medaka test will be completed during the course
of this Plan. Once identified, these factors will be tested against native species to
determine the relevance of the medaka results to the EFPC fish community. Assessment
criteria for fish embryo-larval tests will continue to include hatching success, time-to-hatch,
the incidence of developmental abnormalities during both embryonic and early larval
development, and the survivorship of embryos and yolk-sac larvae.
4.4 COMMON DESIGN FOR THE BIOLOGICAL INDICATORS TASK
The principal sampling design components of the Biological Indicators Task are the
species to be collected, sampling sites, sampling frequencies, and the specific responses to
measured. Response measurements are discussed in Sections 4.3 and 4.4. The sampling
design for both subtasks is summarized in Table 4.1. Sites and monitoring parameters will
be re-evaluated annually.

Oak Ridge Y-12 Plant
Biological Indicators 4-4
4.4.1 Sentinel Species
To assure continuity of results with previous fish health and reproductive studies in
EFPC, redbreast sunfish will continue to remain the primary target species for this task.
The Japanese medaka (Oryzias latipes), a small fish native to Southeastern Asia, will be
the primary fish species utilized in the embryo-larval testing portion of the reproductive
subtask. Medaka is an increasingly popular aquatic species for both carcinogenicity and
toxicity testing of chemicals in the laboratory. This fish has several advantages for use in
developmental toxicity testing, including its ease of maintenance in the laboratory, the
reliability with which eggs can be obtained for testing purposes on a daily basis year-round,
its long embryonic period with a resulting increase in sensitivity to many environmental
contaminants, the clarity of the embryo (which allows easy observation of developmental
abnormalities arising prior to hatch), and the relatively long embryonic period which
enables tests of longer duration (to 21 days).
4.4.2 Sites
Of the four sites in EFPC sampled at least annually since 1986, three will continue to
be sampled annually under this plan for both the fish health and reproductive competence
subtasks. These sites are (1) upper EFPC between EFK 22.5 and 24.4, (2) EFK 19,
downstream of the Highway 95 bridge; and (3) EFK 14, above the ORWTF. At least
200 m of stream will be sampled at each site to obtain the required number, size, and sex
ratio of fish. Fish sampling upstream of Lake Reality is being discontinued. Fish sampling
at both EFK 19 and 14 will be re-evaluated annually. If habitat and general stream
conditions at EFK 14 continue to degrade at EFK 14 due to construction in the area, fish
sampling at this site could be discontinued or alternated on an every other year basis with
sampling at EFK 19.
In addition to the three primary EFPC sites, two reference streams will also continue
to be sampled on an annual basis. During the past 3 years, sunfish have been increasingly
difficult to obtain at BF. In addition, the health of individuals sampled from the site
appears to have declined during the last two years from unknown causes. A new
reference stream will most likely replace Brushy Fork as the second reference site for this

Biological Monitoring and Abatement Program Plan
Biological Indicators 4-5
task.
Water samples to be tested for toxicity to fish embryos will be collected from the
fish sampling sites in the downstream reaches of EFPC, as well as from sites in the
upstream reaches of EFPC (EFK 23.4 and EFK 25.1). Water from additional sites,
including EFK 10.0 and EFK 6.3, may be occasionally sampled in conjunction with the
ongoing medaka TIE.
4.4.3 Sampling Frequency
The results of previous bioindicator studies conducted in a variety of aquatic systems
including EFPC (Loar et al. 1992a; Hinzman et al. 1993, 1998; Adams et al. 1992a, 1992b;
Adams and Greeley 1991) have demonstrated that for most bioindicator responses, annual
sampling is adequate for evaluating the effects of water quality and other environmental
variables on fish health. Indeed, many bioindicators, including the condition indices, various
population-level indices, and reproductive responses, are
Table 4.1. Site designations, sampling period, and sample forms for the BiologicalIndicator task
Site Sampling
Period
Sample Form Frequency Comments
EFKa 25.1 1992-present Waterb Annualc
EFK 23.4 1990-present Water Annual
EFK 23 1985-present Fishd Annual
EFK 19 1985-present Water, Fish Annual/Annual EFK 18 in 1985
EFK 14 1985-present Water, Fish Annual/Annual
Brushy Forke 1985-present Fish Annual Reference Site
Hinds Creek 1989-present Fish Annual Reference Site
aEast Fork Poplar Creek kilometer.bWater = surface water samples for medaka embryo-larval tests.cAnnual during 1st year with emphasis on TIE; frequency of medaka tests could change thereafter.dRedbreast sunfish.eBrushy Fork is likely to be replaced by an alternative reference site due to degraded conditions.

Oak Ridge Y-12 Plant
Biological Indicators 4-6
integrative in nature and reflect the effect of environmental variables over long time
periods (Adams 1990b). Thus, fish sampling for both the fish health and reproductive
competence subtasks of this task will continue to be conducted annually.
Embryo-larval tests of grab-samples of water from EFPC will be conducted annually
rather than twice annually in the first year of the Plan. Initial emphasis of the medaka
testing portion of this task will remain on the ongoing TIE. The frequency status of the
medaka tests will be re-evaluated annually. This procedure is one of several being
evaluated as possible replacements for ambient Ceriodaphnia and fathead minnow
toxicity monitoring in EFPC.

Pageleft
blank

Biological Monitoring and Abatement Program Plan
Instream Ecological Monitoring 5-1
5. INSTREAM ECOLOGICAL MONITORING (Task 4)
5.1 PERIPHYTON (SUBTASK 4a) (W. R. Hill)
Periphyton (attached algae) forms the base of the food web in streams, using sunlight
to convert dissolved inorganic carbon and other plant nutrients into biomass that is grazed
by invertebrates and fish (e.g., stoneroller minnows). Periphyton is a useful component to
measure impacts because of its (1) importance to higher trophic levels, (2) sensitivity to
both enrichment and contaminants, (3) effect on water chemistry, and (4) potential
significance in the sorption and transfer of waterborne contaminants (Boston et al. 1991,
Stewart et al. 1993). Five sites on EFPC and one reference site on Brushy Fork have
been used to assess Y-12 Plant effects on periphyton biomass (chlorophyll a),
photosynthesis, and taxonomic composition. Nutrients (dissolved phosphorus and nitrogen)
and metals have been measured as well.
Previous studies indicated that operations at the Y-12 Plant have impacted periphyton
communities. The effects of the Y-12 Plant on nutrients and streamside shade also
influence periphyton in EFPC. Nutrients in EFPC have been higher than expected
(compared with other streams and groundwater emanating from Chestnut Ridge),
implicating the Y-12 Plant as a significant source of nitrogen and phosphorus. These
elevated concentrations of nutrients undoubtedly contribute to the relatively high levels of
primary production at unshaded sites in EFPC. Periphyton biomass (chlorophyll a)
generally decreased in a downstream direction, probably as a result of increasing shade
from streamside vegetation. Upstream sites (EFKs 24.4, 23.4, and 13.8) have little shade
compared with downstream site EFK 6.3 and the reference site (BFK 7.6). The projected
increase in streamside vegetation (e.g., trees) at the two upper sites (EFKs 24.4 and 13.8)
will decrease periphyton production at these sites.
Metal concentrations in periphyton were very high at upstream EFPC sites.
Mercury, for example, has been present at over 600 ppm dry mass at EFK 24.4. Other
metals of concern that were found at elevated concentrations at upstream sites were
cadmium, copper, nickel, zinc, and silver. Metal concentrations in periphyton generally

Oak Ridge Y-12 Plant
Instream Ecological Monitoring 5-2
decreased with distance downstream of the Y-12 Plant, a trend consistent with the
downstream decline of contaminant concentrations in EFPC fish (Hinzman et al. 1993),
indicating that the Y-12 Plant was the source of the metals.
Monitoring of periphyton biomass (chlorophyll a) and photosynthesis will continue at
approximately twice-annual intervals (Table 5.1). Emphasis will be placed on the
detection of remediation-related changes in the periphyton. Many metals are accumulated
to higher levels in periphyton than in upper trophic levels (Hill et al., in press), so
periphyton will be used to assess changes in metal levels that occur through remediation.
5.1.1 Methods
Monitoring biomass and photosynthesis
Chlorophyll a and single-irradiance photosynthesis will be measured every 6 months
at three EFPC sites (EFKs 24.4, 23.4, and 6.3) and one site in Brushy Fork (BFK 7.6).
These sites have been used extensively in the past, and maintaining the monitoring at these
sites will provide the continuity necessary for the detection of environmental changes in
EFPC. Methods for assessing chlorophyll a and photosynthetic rates will be the same as
used previously: four small rocks from each site will be collected, returned to the
laboratory, and assayed for chlorophyll a and 14C uptake [at ca. 350 Fmol quanta m-2 s-1
(Hinzman et al. 1993)]. If photosynthesis continues to remain highly correlated with
chlorophyll a, it may be possible to eliminate photosynthesis measurements in future years,
and measure only chlorophyll a.
Contaminant burdens
Metals in EFPC periphyton will be measured once a year in samples from EFK 24.4,
EFK 23.4, EFK 18.4, and EFK 6.3. In addition, metal concentrations will be compared in
shaded and unshaded periphyton at upstream EFPC sites (EFK 24.4 and EFK 23.4) in
order to predict effects of riparian revegetation. Eventual elimination of the downstream
monitoring site at EFK 6.3 is anticipated if metal concentrations at this site continue to
converge towards the reference condition. Sites and frequency of sampling will be re-
evaluated annually.

Biological Monitoring and Abatement Program Plan
Instream Ecological Monitoring 5-3
Table 5.1. Site designations and analyses to be performed for the Periphyton
Community task
Site Chlorophyll andphotosynthesis Frequency Metal analysis Frequency
EFKa 24.4 X Biannual X Annual
EFK 23.4 X Biannual X Annual
EFK 18.4 X Annual
EFK 6.3 X Biannual X Annual
BFKb 7.6 X Biannual
aEast Fork Poplar Creek kilometer.bBrushy Fork kilometer.
5.2 BENTHIC MACROINVERTEBRATES (SUBTASK 4b) (J. G. Smith)
Benthic macroinvertebrates are organisms that lack spinal columns, are large enough
to be seen without the aid of magnification, and live on or among the substrate particles of
flowing and non-flowing bodies of water. The limited mobility and relatively long life spans
(a few months to more than a year) of most species make them ideal for use in assessing
the condition of aquatic environments (Platts et al. 1983). Monitoring the composition and
structure of the benthic macroinvertebrate community, which reflects the recent history of
water quality at a site, can provide a better assessment of the condition of aquatic
environments than simple reliance on physical water quality analyses.
Subtle but persistent improvement in the condition of the macroinvertebrate
community in upper EFPC has occurred since the initiation of the BMAP. The
macroinvertebrate community remains significantly impacted near the Y-12 Plant, but
exhibits distinct improvement with increasing distance from the plant. This spatial trend is
supported by the results of an in situ clam (Sphaerium fabale) bioassay conducted
regularly since 1988 (Smith and Beauchamp 2000).

Oak Ridge Y-12 Plant
Instream Ecological Monitoring 5-4
5.2.1 Benthic Macroinvertebrate Monitoring Plan
Sample Collection and Analysis
Five quantitative benthic macroinvertebrate samples will be collected biannually
(April and October) from randomly selected locations from three sites in EFPC (EFKs
24.4, 23.4, and 13.8), and one site in each of two reference streams (BFK 7.6 and HCK
20.6; Fig. 1.2 and Table 5.2). Samples will be collected annually (April) from EFK 6.3 at
the request of Tennessee Division of Water Pollution Control (TDEC) personnel. Samples
will be collected with a modified Hess sampler (0.1 m2) fitted with a 363-Fm-mesh
collection net. Each sample will be preserved in ~ 80 percent ethanol, and then processed
in a laboratory. Details of the procedures that will be followed for collecting, processing,
and maintaining the samples are in Smith and Smith (1995).
Temporal and spatial trends that could be associated with abatement activities or
remedial actions, will be evaluated using a variety of analysis techniques with Statistical
Analysis System (SAS) software and procedures (e.g., general descriptive statistics and
parametric statistics such as analysis of the variance on density, total richness, etc.), and
other software and procedures where appropriate (e.g., multivariate analyses with PC-
ORD software, McCune and Medfford 1999).
Either EFK 23.4 or 24.4 may be eliminated in future years of the Plan if current
trends of these two sites performing similarly since the bypass of LR continue.
Invertebrate monitoring at EFK 6.3 could be discontinued after the first year if current
trends continue and TDEC agrees. Sites and frequency of benthic macroinvertebrate
sampling will be re-evaluated annually.
In situ Bioassays
An In situ bioassay, using the clam S. fabale , will be conducted approximately every
two years or more frequently when appropriate (e.g., to more closely follow changes in
stream associated with flow augmentation). The procedures followed for this assay are
described in detail in Smith and Beauchamp (2000). This bioassay is being considered
along with others as a possible replacement for the current ambient Ceriodaphnia and
fathead minnow toxicity tests.

Biological Monitoring and Abatement Program Plan
Instream Ecological Monitoring 5-5
Table 5.2. Sites sampled for the Benthic Macroinvertebrate
Community Studies task
Site Sample Period Frequency
EFKa 24.4 Jun. 1985 to present Biannual (spring and fall)
EFK 23.4 Jun. 1985 to present Biannual
EFK 13.8 Jun. 1985 to present Biannual
EFK 6.3 Jun. 1985 to present Annual (spring)
BFKb 7.6 Jan. 1986 to present Biannual
HCKc 20.6 Oct. 1987 to present Biannual
aEast Fork Poplar Creek kilometer.bBrushy Fork kilometer.cHinds Creek kilometer.
5.3 FISH COMMUNITY STUDIES (SUBTASK 4c) (M. G. Ryon)
Fish population and community studies can be used to assess the ecological effects of
changes in water quality and habitat. These studies offer several advantages over other
indicators of environmental quality (Karr 1987) and are especially relevant to assessment
of the biotic integrity of EFPC. Monitoring of fish communities has been used within
BMAP for receiving streams associated with the Y-12 Plant (Loar et al. 1989, Ryon 1992,
Southworth et al. 1992), with some programs operational since 1984. Sampling of the fish
community in EFPC under the initial BMAP began with quarterly samples in 1985 (Loar et
al. 1992) and continued from 1986 with spring and fall samples. The primary objectives of
this sampling were to characterize the fish communities in the stream and to identify
impacts associated with Y-12 Plant operations. The objectives of the fish community task
under the current plan are to continue monitoring the fish community structure and conduct
supplemental studies as needed.
Data obtained from 1985 to 1993 for EFPC documented a substantial impact on the
fish community in the vicinity of the Y-12 Plant and downstream more than 5 km into the
city of Oak Ridge (Loar et al. 1992, Ryon 1993). However, the monitoring also detected a
gradual recovery of the fish communities in EFPC, beginning with the most downstream

Oak Ridge Y-12 Plant
Instream Ecological Monitoring 5-6
sites and slowly progressing through time to sites closer to the Y-12 Plant. The degree of
impact and the pattern of recovery are supported by changes in species richness, species
abundance, and species composition (see Adams et al. 1998). In the vicinity of the Y-12
Plant, recovery has been dominated by more tolerant species that have increased in
density (up to 100 fold) and biomass (up to 7 fold). The composition of this community has
also become more complex, with an increase in species richness and occasional
occurrences of intolerant species. At downstream sites, there were similar but smaller
increases in density and biomass. However, the increase in species richness was
proportionally greater at downstream sites than at sites closer to the Y-12 Plant, with more
intolerant species, more benthic insectivores, and more sensitive species (e.g., darters and
suckers). Despite the continual improvement in overall species richness, the number of
intolerant and sensitive species remains below levels in similar-sized reference streams.
This deficiency indicates that there is the potential for further recovery of fish communities
in EFPC. Efforts in the revised BMAP will focus on this recovery and try to differentiate
impacts impending further recovery.
In November 1988, NHP was drained, capped, and replaced by LR, a lined-basin.
Upper EFPC was routed around the NHP cap to LR in a concrete diversion channel and
flowed out of LR through a v-notch weir. The design of the weir allowed fish to access
LR and upper EFPC and led to established fish communities in both the basin and the
stream above it. In 1998, the flow of water was rerouted around LR, to discharge from the
bottom of the diversion channel. This change essentially isolated the upstream populations
from fish communities downstream. The change will prevent further recolonization of
upper EFPC by additional fish species.
As a result of the 1988 change in access to upper EFPC that allowed fish access
through LR to upper EFPC, fish were in closer contact with effluents from the Y-12 Plant,
and more frequent fish kills occurred. During 1988 to 1993, chlorinated water released to
upper EFPC produced a chronic kill resulting in a low (<10 dead fish/day) but nearly
continuous level of mortality (Etnier et al. 1995). Additional releases or episodes produced
more acute-type kills, often with high mortality over a few days (up to 350 fish in a day).
Dechlorination of two major outfalls in late 1992 reduced the mortality from chronic
toxicity. Fish kills from acutely toxic conditions are now rarely a factor in upper EFPC,

Biological Monitoring and Abatement Program Plan
Instream Ecological Monitoring 5-7
although they can reach epic proportions because of the population sizes in this section of
stream.
5.3.1 Sampling Procedures
Quantitative sampling of the fish populations will be conducted at five sites in EFPC
and at a site in each of two reference streams, BF and Hinds Creek (Table 5.3), by
electrofishing in March–April and September–October. Details of field sampling and
analysis are given in Adams et al. (1998). All field sampling is conducted according to
specific quality control and standard operating procedures (Ryon 2000). The resulting data
will be used to estimate population size (numbers and biomass per unit area), determine
community structure, estimate production, and calculate Index of Biotic Integrity (IBI)
values as per Adams et al. (1998).
The current sampling plan for EFPC recognizes the improvement in fish communities
that occurred in reaches downstream from the ORR from 1988 to 1999. Data from
sampling in fall 1999 also indicate that populations are established and are similar at sites
upstream of EFK 24.4 and knowledge gained by further sampling is negligible. Therefore,
sampling at EFK 25.1 will be discontinued. Sampling at EFK 6.3 and EFK 13.8 will
continue as before, but will be the focus of annual re-evaluation. Currently, unique
information on the fish community is provided by both sites. If future sampling indicates
that the sites are no longer unique, and provide essentially similar information (i.e., same
species and densities), then a possible reduction of one of these sites will be proposed.
5.3.2 Special Studies
In addition to the routine fish community monitoring, limited habitat studies may be
conducted to determine specific factors that may be affecting fish community structure.
Limitations imposed by the existing habitat in upper EFPC could be a principal determinant
of the fish community structure. Habitat has been shown to be a critical factor in fish
community composition (Gorman and Karr 1978, McClendon and Rabeni 1987, Wesche et
al. 1987), and there is reason to suspect it limits the communities in EFPC. Any special
studies would focus on specific aspects of habitat and perhaps modifications to increase

Oak Ridge Y-12 Plant
Instream Ecological Monitoring 5-8
critical habitat parameters such as riparian cover or instream cover. These investigations
could involve manipulative field studies or limited laboratory evaluations.
Table 5.3. Site designations and sampling dates for electrofishing
sampling of the Fish Community Studies task
Site Sample dates Frequency Comments
EFKa 24.4 Jun. 1985 to present Biannual (spring and fall)
Site shifted upstream andshortened from 234 to 109 min fall 1989 in response topresence of fish
EFK 23.4 May 1985 to present Biannual Site shortened from 116 to 90m in October 1987 followingincrease in fish abundance
EFK 18.7 Mar. 1990 to present Biannual Site added as replacement forEFK 18.2
EFK 13.8 May 1985 to present Biannual Site shifted upstream inSeptember 1992 and March1993 when raw sewageflowed into sampling reach
EFK 6.3 Jun. 1985 to present Biannual No changes
BFKb 7.6 Nov. 1985 to present Biannual Reference site
HCKc 20.9 Mar. 1991 to present Biannual Reference site
aEast Fork Poplar Creek kilometer.bBrushy Fork kilometer.cHinds Creek kilometer.

Biological Monitoring and Abatement Program Plan
Data Integration and Management 6-1
6. DATA INTEGRATION AND MANAGEMENT (TASK 6)
S. W. Christensen and C. C. Brandt
The BMAP measures numerous parameters in assessing the ecological health of
EFPC. This extensive set of data is a resource designed to meet several major objectives
(as outlined in Sect. 1). Meeting these objectives is a substantial challenge with respect to
data analysis, interpretation, and management. Even the most fundamental objective—i.e.,
determining whether growth and propagation of fish and aquatic life are
protected—inherently involves analysis and interpretation. Unlike comparing the
concentration of a chemical in water with a specified standard that is not to be exceeded,
“protection of growth and propagation” requires evaluation and judgment about what
would be expected in a nonimpacted setting and comparison and interpretation of the
site-specific results. Evaluating trends and changes in response to remediation is even
more complex than the original BMAP mission of evaluating the ecological status and
condition of EFPC.
The requirements and needs for an integrated BMAP database originate from a
number of sources. The Federal Facilities Agreement (FFA) and the Tennessee Oversight
Agreement (TOA) (OREIS 1993) specifically require development of centralized data
facilities that can make data available to regulators and the public. Because of the
increasing extent and complexity of the data, there is also a greater need to share data
more effectively among BMAP tasks.
To meet these needs, an integrated BMAP data base has been established and
populated with historical and ongoing BMAP data. The primary purpose of this data base
is to facilitate sending the rather complex biological BMAP data to the Oak Ridge
Environmental Information System (OREIS). Secondary benefits include support of
investigators’ needs, providing the capability to perform integrative analyses of BMAP
data, and assisting in meeting the requirements of the NPDES permit.
6.1 Data Management Approach
In the approach to data management chosen for BMAP, investigators will continue to

Oak Ridge Y-12 Plant
Data Integration and Management 6-2
acquire the data, assemble basic two-dimensional data bases (e.g., ASCII files,
spreadsheets, SAS data sets), and perform QA/QC reviews before providing them to the
central BMAP data base. SAS software is provided on a UNIX workstation as a
pathway for integration. This workstation-based version of SAS, accessed through
X terminal emulation, now provides the investigators with extended and more effective
analysis capability than has previously been available on the mainframes. ORACLE
software contains the integrated data base. ARC/INFO (including ARC/VIEW) software
provides geographic information system (GIS) capability. SAS, ORACLE, and
ARC/INFO were chosen in part because of their effectiveness and broad acceptance but
also because these were the software packages used for these purposes by OREIS.
Data integration activities associated with loading data on bioindicators, contaminant
bioaccumulation, ambient toxicity tests, fish communities, and benthic macroinvertebrate
communities to the BMAP database, and then to OREIS, are as follows:
! Receive data from investigators
! Register data in the Electronic Data Registration System and check into the
Revision Control System (RCS).
! Prepare file for processing (when needed).
! Read data into SAS.
! Edit data, including adding unique sample identifiers and observation identifiers.
! Standardize data, including adding additional variables, translating site identifiers
into BMAP standard nomenclature, and transposing data to put it in the form required
by the BMAP and OREIS relational databases.
! Normalize the data, creating one data set for each table that will receive data.
! Check constraints, and resolve any that may be violated. When this occurs,
processing usually resumes from a prior step after problems are corrected.
! Load data to the BMAP database.
! Reprocess data, incorporating corrections to or adjustments of the data if needed.
This includes occasional incorporation of changes in taxonomic nomenclature.
! Generate OREIS deliverables from the BMAP database in OREIS ready-to-load
(RTL) format.
! Check the RTL data sets.

Biological Monitoring and Abatement Program Plan
Data Integration and Management 6-3
! Transmit data to OREIS, with required paperwork.
! Interact with OREIS to resolve issues that may arise as OREIS processes the
deliverables.
! Review OREIS data release packages, and after resolving necessary issues,
approve release of the data to the OREIS community.
! Submit OREIS change requests as needed, primarily to handle investigator-
requested corrections to or updates of their data or updates of reference tables.
! Perform workstation system administration (including backups), software
renewals, and hardware maintenance and replacement as necessary.
The TOA drivers for the continued loading of BMAP data into OREIS will be
confirmed annually. A number of additional activities related to data integration are either
necessary or highly desirable, and these will be carried out as resources permit. To
minimize disturbance to the data processing infrastructure used to provide data to OREIS,
assistance is provided to OREIS from time to time in areas in which BMAP has expertise
(such as taxonomic nomenclature and key attributes) and in areas in which BMAP has an
active interest (such as agreement on a structure for and list of results qualifier codes,
which could require more extensive changes in our processing infrastructure if not handled
in a harmonizing way). Requests for data or information from BMAP investigators are
met when possible, particularly in making their data available from the BMAP database.
Metadata, in the form of explanatory information about the data, will continue to be
developed as resources permit by data management staff or by investigators. Support,
primarily training, will continue to be provided to the BMAP investigators and other staff in
such areas as using computer network technology to access the workstation, and on the
UNIX operating system. Assistance will be provided to investigators for some specific
uses of the BMAP workstation. Views to the data will continue to be developed to enable
data from the database to be provided to the investigators in familiar format.

Biological Monitoring and Abatement Program Plan
References R-1
References
Adams, S.M. 1990. Biological Indicators of Stress in Fish. Amer. Fish. Soc. Sym. No. 8.
Amer. Fish. Soc., Bethesda, Maryland.
Adams, S. M., and 13 coauthors. 1998. Oak Ridge Y-12 Plant Biological Monitoring and
Abatement Program (BMAP) Plan. Y/TS-1613/R1. Oak Ridge Y-12 Plant, Oak
Ridge, Tennessee.
Adams, S. M., and M.S. Greeley, Jr. 1991. Assessment and evaluation of the ecological
health of fish populations exposed to PCBs in Hartwell Reservoir. Tennessee Valley
Authority Publ. TVA/WR/AB-91/14, Chattanooga, Tennessee.
Adams, S.M., and M.S. Greeley, Jr. 1993. Biological indicators of contaminant-related
stress, Sec. 5, pp. 1-60. IN: R. L. Hinzman (ed.), Second Report on the Oak Ridge
Y-12 Plant Biological Monitoring and Abatement Program for East Fork Poplar
Creek. Y/TS-888. Oak Ridge National Laboratory, Oak Ridge, Tennessee.
Adams, S.M., W.D. Crumby, M.S. Greeley, Jr., M.G. Ryon, and E.M. Schilling. 1992a.
Relationships between physiological and fish population responses in a contaminated
stream. Environ. Toxicol. Chem. 11:1549–1557.
Adams, S.M., W.D. Crumby, M.S. Greeley, Jr., and L.R. Shugart. 1992b. Responses of
fish populations and communities to pulp mill effluents: a holistic assessment.
Ecotoxicol. and Environ. Safety 24:347–360.
Adams, S.M., K.L. Shepard, M.S. Greeley, Jr., B.D. Jimenez, M.G. Ryon, L.R. Shugart,

Oak Ridge Y-12 Plant
References R-2
J. F. McCarthy, and D.E. Hinton. 1989. The use of bioindicators for assessing the
effects of pollutant stress on fish. Mar. Environ. Res. 28:459–464.
Birge, W.J., J.A. Black, and A.G. Westerman. 1985. Short-term fish and amphibian
embryo-larval tests for determining the effects of toxicant stress on early life stages
and estimating chronic values for single compounds and complex effluents. Environ.
Toxicol. Chem. 4: 807–821
Boston, H. L., W. R. Hill, and A. J. Stewart. 1991. Evaluating direct toxicity and food
chain effects in aquatic systems using natural periphyton communities, pp. 126-145.
IN: J. W. Gorsuch, W. R. Lower, and K. R. St. John (eds.), Plants for Toxicity
Assessment: Second Volume. ASTM STP 1115.
CDM Federal Programs Corporation. 1994. Water Balance Report. Oak Ridge,
Tennessee.
DOE (U.S. Department of Energy). 1994a. East Fork Poplar Creek—Sewer Line
Beltway Remedial Investigation Report. DOE/OR/02-1119&D2. Prepared by
Science Applications International Corporation, Oak Ridge, Tennessee; Submitted to
U.S. Department of Energy under Contract No. DE-AC05-91OR21950.
DOE (U.S. Department of Energy). 1994b. Feasibility Study for the Lower East Fork
Poplar Creek—Sewer Line Beltway. DOE/OR/02-1185&D2, Volumes 1 and 2.
Prepared by Science Applications International Corporation, Oak Ridge, Tennessee;
Submitted to U.S. Department of Energy under Contract No. DE-AC05-91OR21950.
DOE (U.S. Department of Energy). 1994c. Addendum to the East Fork Poplar
Creek—Sewer Line Beltway Remedial Investigation Report. DOE/OR/02-
119&D2/A1/R1. Prepared for U.S. DOE by Science Applications International
Corporation (SAIC), Oak Ridge, Tennessee.
Biological Monitoring and Abatement Program Plan
References R-3
DOE (U.S. Department of Energy). 1995a. Remedial Goal Options for Mercury in
Sediment of East Fork Poplar Creek, Oak Ridge, Tennessee. DOE/OR/01-
1342&D2. Prepared for U.S. DOE by Science Applications International
Corporation (SAIC), Oak Ridge, Tennessee.
DOE (U.S. Department of Energy). 1995b. Proposed Plan, East Fork Poplar
Creek—Sewer Line Beltway, Oak Ridge, Tennessee. DOE/OR/02-1209&D3.
DOE (U.S. Department of Energy). 1995c. Record of Decision for Lower East Fork
Poplar Creek, DOE/OR/02-1370&D1.
ERDA (Energy Research and Development Administration). 1975. Preliminary Draft
Environmental Analysis. Oak Ridge Operations, Vol. VI. Section. 2.5.5. Mimeo.
Etnier, E. L., D. M. Opresko, and S. A. Talmage (eds). 1995. Evaluation of Fish Kills
during July 1990 to March 1993 in upper East Fork Poplar Creek near the Y-12
Plant. Draft ORNL/TM-12636. Oak Ridge National Laboratory, Oak Ridge
Tennessee.
Geraghty and Miller, Inc. 1985. Remedial Alternatives for the Bear Creek Valley Waste
Disposal Area. Final Report No. Y/SUB/85-00206C/3. Geraghty and Miller, Inc.
Tampa, Florida.
Gorman, O. T., and J. R. Karr. 1978. Habitat structure and stream fish communities.
Ecology 59:507–515.
Ham, K. D., S. M. Adams, and M. J. Peterson. 1997. Application of Multiple
Bioindicators to Differentiate Spatial and Temporal Variability from the Effects of
Contaminant Exposure on Fish. Ecotoxicology and Environmental Safety. 37, 53-61.

Oak Ridge Y-12 Plant
References R-4
Hill, W. R., A. J. Stewart, and G. E. Napolitano. In Press. Mercury speciation and
bioaccumulation in lotic primary producers and primary consumers. Can. J. Fish.
Aquat. Sci. 53:000–000.
Hinzman, R. L., S. M. Adams, M. C. Black, H. L. Boston, W. Burton, A. J. Gatz, Jr., M.
S. Greeley, Jr.,W.R. Hill, J. M. Loar, J. F. McCarthy, M. J. Peterson, M. G. Ryon, J.
G. Smith, G. R. Southworth, A.J. Stewart, and V. R. Tolbert. 1993. Second Report
on the Oak Ridge Y-12 Plant Biological Monitoring and Abatement Program for East
Fork Poplar Creek. Y/TS-888. Oak Ridge Y-12 Plant. Oak Ridge, Tennessee.
Hinzman, R. L., S. M. Adams, J. J. Beauchamp, S. W. Christensen, B. R. Gray, M. S.
Greeley, Jr. K. D. Ham, W. R. Hill, C. G. Hull, S. R. Jardine, L. L. Kohring, J. M.
Loar, J. W. Lotts, J. F. McCarthy, G. E. Napolitano, M. J. Peterson, M. G. Ryon, E.
M. Schilling, S. K. Sharp, L. R. Shugart, J. G. Smith, G. R. Southworth, A. J.
Stewart, C. W. Theodorakis, and V. R. Tolbert. 1998. Third Report on the Oak
Ridge Y-12 Plant Biological Monitoring and Abatement Program for East Fork
Poplar Creek. Y/TS-889, Oak Ridge Y-12 Plant, Oak Ridge, Tennessee.
Hoffman, F. O., B. G. Blaylock, C. C. Travis, K. L. Daniels, E. L. Etnier, K. E. Cowser,
and C. W. Weber. 1984. Preliminary Screening of Contaminants in Sediments.
ORNL/TM-9370. Oak Ridge National Laboratory, Oak Ridge, Tennessee.
Karr, J. R. 1987. Biological monitoring and assessment: A conceptual framework.
Environ. Manag. 11:249–256.
Kasten, J. L. 1986. Resource Management Plan for the Oak Ridge Reservation, Vol. 21:
Water Conservation Plan for the Oak Ridge Reservation. ORNL/ESH-1/V21. Oak
Ridge National Laboratory, Oak Ridge, Tennessee.
Loar, J. M., S. M. Adams, L. J. Allison, J. M. Giddings, J. F. McCarthy, G. R. Southworth,
J. G. Smith, and A. J. Stewart. 1989. The Oak Ridge Y-12 Plant Biological

Biological Monitoring and Abatement Program Plan
References R-5
Monitoring and Abatement Program for East Fork Poplar Creek. ORNL/TM-10265.
Oak Ridge National Laboratory, Oak Ridge, Tennessee.
Loar, J. M., S. M. Adams, L. J. Allison, M. C. Black, H. L. Boston, A. J. Gatz, Jr., R. L.
Hinzman, M. A. Huston, B. D. Jimenez, J. F. McCarthy, S. D. Reagan, J. G. Smith,
G. R. Southworth, and A. J. Stewart. 1992a. First Report on the Oak Ridge Y-12
Plant Biological Monitoring and Abatement Program for East Fork Poplar Creek.
Y/TS-886. Oak Ridge Y-12 Plant. Oak Ridge, Tennessee.
McClendon, D. D., and C. F. Rabeni. 1987. Physical and biological variables useful for
predicting population characteristics of smallmouth bass and rock bass in an Ozark
stream. N. Amer. J. Fish. Manag. 7:46–56.
McCune, B., and M. J. Medfford. 1999. PC-ORD. Multivariate Analysis of Ecological
Data, Version 4. MjM Software Design, Gleneden Beach, Oregon.
McMasters, W. M. 1967. Hydrologic data for the Oak Ridge area, Tennessee. U.S.
Geological Survey–Water Supply Paper No. 1838-N. U.S. Government Printing
Office, Washington, D.C.
OREIS (Oak Ridge Environmental Information System). 1993. Draft Data Management
Plan for the Oak Ridge Environmental Information System, Version 2.0.
ES/ER/TM-39/R1, Environmental Restoration Division, Oak Ridge, Tennessee
37831.
Platts, W. S., W. F. Megahan, and G. W. Minshall. 1983. Methods for evaluating stream,
riparian, and biotic conditions. U.S. Forest Service General Technical Report INT-
138. Intermountain Forest and Range Experimental Station, Ogden, Utah.
Pritz, P. M., and M. Sanders. 1982. Spill Prevention Control and Countermeasure

Oak Ridge Y-12 Plant
References R-6
(SPCC) Plan for Oil and Hazardous Substances at the Oak Ridge Y-12 Plant.
Y/DD-242, R2. Oak Ridge Y-12 Plant, Oak Ridge, Tennessee.
Ryon, M. G. 1992. Fishes. IN: M. G. Ryon (ed.), Ecological Effects of Contaminants in
McCoy Branch, 1989–1990. ORNL/TM-11926. Oak Ridge National Laboratory.
Oak Ridge, Tennessee.
Ryon, M. G. 2000. Biological Monitoring and Abatement Program Fish Community
Studies, standard operating procedures. QAP-X-90-ES-067. Oak Ridge National
Laboratory, Oak Ridge, Tennessee.
SAIC. 1995. East Fork Poplar Creek Ecological Monitoring Program Plan. Final Draft.
Oak Ridge, Tennessee.
Sample, B. E., R. L. Hinzman, B. L. Jackson, and L. Baron. 1996. Preliminary
Assessment of the Ecological Risks to Wide-ranging Species on the Oak Ridge
Reservation, 1996 Update. DOE/OR/01-1407&D2. Oak Ridge National
Laboratory. Oak Ridge, Tennessee.
Smith, J. G., and J. J. Beauchamp. 2000. Evaluation of caging designs and a fingernail
clam for use in an in situ bioassay. Environm. Monitor. Assess. 2: 205-230.
Smith, M. R., and J. G. Smith. 1995. Biological Monitoring and Abatement Program,
Benthic Macroinvertebrate Community Studies Quality Assurance Plan, QAP-X-89-
ES-068, Rev. 1, November 1995. Oak Ridge National Laboratory, Oak Ridge,
Tennessee.
Southeast Directory Company, Inc. 1995. Anderson, Roane, Morgan Counties Telephone
Book. September 1995–1996. Knoxville, Tennessee.
Southworth, G. R., J. A. Burris, J. M. Loar, M. G. Ryon, J. G. Smith, and A. J. Stewart.

Biological Monitoring and Abatement Program Plan
References R-7
1992. Ecological Effects of Contaminants and Remedial Actions in Bear Creek.
ORNL/TM-11977. Oak Ridge National Laboratory. Oak Ridge, Tennessee.
Stewart, A. J., W. R. Hill, and H. L. Boston. 1993. Grazers, periphyton, and toxicant
movement in streams. Environ. Toxic. Chem. 12:955–957.
Stewart, A. J., W. R. Hill, K. D. Ham, and S. W. Christensen. 1996. Chlorine dynamics
and ambient toxicity in receiving streams. Ecol. Appl. 6: 458-471.
Suter, G.W. II, A. E. Rosen, E. Linder, and D. F. Parkhurst. 1987. Hazard assessment.
Endpoints for responses of fish to chronic toxic exposures. Environ. Toxicol. Chem.
6:793–809.
TVA (Tennessee Valley Authority). 1985. Instream Contaminant Study, Task 3:
Sediment Tranport Report to U.S. Department of Energy, Oak Ridge Operations
Office. Office of Natural Resources and Economic Development, Tennessee Valley
Authority, Knoxville, Tennessee.
TVA (Tennessee Valley Authority). 1986. Instream Contaminant Study, Task 5:
Summary Report. Report to U.S. Department of Energy, Oak Ridge Operations
Office. Office of Natural Resources and Economic Development, Tennessee Valley
Authority, Knoxville, Tennessee.
Wesche, T. A., C. M. Goertler, and C. B. Frye. 1987. Contribution of riparian vegetation
to trout cover in small streams. N. Amer. J. Fish. Manag. 7:151–153.