yucca mountain transportation, aging and disposal canister ... · yucca mountain transportation,...
TRANSCRIPT

QA: N/A
SAND2007-5851P
September 2007
Yucca Mountain Transportation, Aging and Disposal Canister Leak Path Factor Analysis Donald A. Kalinich Prepared for: U.S. Department of Energy Office of Civilian Radioactive Waste Management Office of Repository Development 1551 Hillshire Drive Las Vegas, Nevada 89134-6321
Prepared by: Sandia National Laboratories OCRWM Lead Laboratory for Repository Systems 1180 Town Center Drive Las Vegas, Nevada 89144
Under Contract Number DE-AC04-94AL85000 Approved for public release; further dissemination unlimited.

2 September 2007
NOTICE: This report was prepared as an account of work sponsored by an agency of the United States Government. Neither the United States Government, nor any agency thereof, nor any of their employees, nor any of their contractors, subcontractors, or their employees, make any warranty, express or implied, or assume any legal liability or responsibility for the accuracy, completeness, or usefulness of any information, apparatus, product, or process disclosed, or represent that its use would not infringe privately owned rights. Reference herein to any specific commercial product, process, or service by trade name, trademark, manufacturer, or otherwise, does not necessarily constitute or imply its endorsement, recommendation, or favoring by the United States Government, any agency thereof, or any of their contractors or subcontractors. The views and opinions expressed herein do not necessarily state or reflect those of the United States Government, any agency thereof, or any of their contractors.

3 September 2007
SAND2007-5851P Unlimited Release September 2007
Yucca Mountain Transportation, Aging and Disposal Canister Leak Path Factor Analysis
Donald A. Kalinich 6762 Analysis and Modeling Sandia National Laboratories
P.O. Box 5800 Albuquerque, New Mexico 87185-MS0748
Abstract
A very simple MELCOR model of the Yucca Mountain Transportation, Aging and Disposal (TAD) canister was developed. A series of parametric studies were performed with the model to determine the feasibility of using it to determine the canister’s leak path factor for Uranium Oxide (UO2) particles that are released in a postulated event at Yucca Mountain. The simple model conservatively characterizes gravitational settling and some degree of thermophresis onto the canister interior. Additional model sophistication is needed to simulate thermophresis on fuel assemblies and internal canister structures, as well as aerosol diffusion out of the canister or oxygen diffusion into the canister after the canister has depressurized.

4 September 2007
ACKNOWLEDGMENTS The author would like to thank Kathy Ashley of the Yucca Mountain Project for her help in obtaining and characterizing the input used to develop the model herein, and for her feed-back on what analyses would be the most useful and of most interest.
5 September 2007
CONTENTS
1. INTRODUCTION ..................................................................................................................... 7
2. TAD CANISTER MELCOR MODEL...................................................................................... 9 2.1. MELCOR Code .............................................................................................................. 9 2.2. MELCOR Model ............................................................................................................ 9
2.2.1. Control Volumes............................................................................................. 10 2.2.2. Flow Paths....................................................................................................... 11 2.2.3. Heat Structures................................................................................................ 12 2.2.4. Radionuclides.................................................................................................. 14
3. ANALYSIS.............................................................................................................................. 15 3.1. Circular Opening Parametric Analysis ......................................................................... 15 3.2. Rectangular Crack Parametric Analysis ....................................................................... 22
4. CONCLUSIONS...................................................................................................................... 25
5. REFERENCES ........................................................................................................................ 27
Distribution ................................................................................................................................... 28
FIGURES Figure 1. Control Volume/Flow Path Diagram. .......................................................................... 10 Figure 2. Canister Pressure vs. Time – Circular Opening ........................................................... 17 Figure 3. LPF vs. Time – Circular Opening ................................................................................ 17 Figure 4. Respirable Mass Location – No Crack......................................................................... 18 Figure 5. Respirable Mass Location – Circular Opening, 1.0x10⁻⁴ m2........................................ 18 Figure 6. Respirable Mass Location – Circular Opening, 1.0x10⁻⁹ m2........................................ 19 Figure 7. Radionuclide Mass Deposition – No Crack ................................................................. 21 Figure 8. LPF vs. Maximum Fractional Volumetric Flow – Circular Opening .......................... 21 Figure 9. LPF vs. Maximum Fractional Volumetric Flow – Circular Openings and Rectangular Cracks ........................................................................................................................................... 23
TABLES Table 1. Control Volume Thermodynamic Conditions. .............................................................. 10 Table 2. Control Volume Altitude/Volume Tables...................................................................... 11 Table 3. Circular Opening Flow Path Parameters. ...................................................................... 11 Table 4. Rectangular Crack Flow Path Parameters. .................................................................... 11 Table 5. Heat Structure Characterization..................................................................................... 13 Table 6. Radionuclide Parameters. .............................................................................................. 14 Table 7. Maximum Fractional Volumetric Flow – Circular Opening. ........................................ 16 Table 8. Maximum LPF for Rectangular Crack. ......................................................................... 22

6 September 2007
This page is intentionally left blank.

7 September 2007
1. INTRODUCTION The leak path factor (LPF) is defined as part of the “five factor” formula [DOE, 1994]:
LPFRFARFDRMARST ××××= (1.1)
where,
ST - depleted source term released to the environment1 MAR - material-at-risk DR - damage ratio ARF - airborne release fraction (or airborne release rate for continuous release) RF - respirable fraction of material released from the MAR LPF - leak path factor
Hence, in terms of Eq. (1.1) the LPF is the fraction of the respirable material released from the material-at-risk that is released from the TAD canister. A simple MELCOR model has been developed to evaluate the LPF of an assumed breach of a TAD canister. Parametric studies are performed with the model to evaluate a circular opening, as well as a more realistic rectangular crack. Note that there is no identified mechanism in the postulated accident scenarios that would provide enough force to breach a TAD canister. At the time this report was produced the design of the TAD canister was not completed. Thus, there are no citable source documents for many of the parameters used in the MELCOR model. Draft (i.e., assumed) values have been provided by the Yucca Mountain Preclosure Safety Analysis group.
1 In the context of this analysis “environment” is “external to the TAD canister”.

8 September 2007
This page is intentionally left blank.

9 September 2007
2. TAD CANISTER MELCOR MODEL
Section 2.1 provides a brief description of the MELCOR code. The TAD canister MELCOR model is discussed in the Section 2.2. 2.1. MELCOR Code MELCOR is a fully integrated, engineering-level computer code that models the progression of severe accidents in light water reactor nuclear power plants. MELCOR is being developed at Sandia National Laboratories for the U.S. Nuclear Regulatory Commission as a second-generation plant risk assessment tool and the successor to the Source Term Code Package. A broad spectrum of severe accident phenomena in both boiling and pressurized water reactors is treated in MELCOR in a unified framework. These include thermal-hydraulic response in the reactor coolant system, reactor cavity, containment, and confinement buildings; core heat-up, degradation, and relocation; core-concrete attack; hydrogen production, transport, and combustion; fission product release and transport behavior. Current uses of MELCOR include estimation of severe accident source terms and their sensitivities and uncertainties in a variety of applications [Gauntt, et al., 2005]. The capability of MELCOR to model the thermal-hydraulic response of containment and confinement buildings and the release, transport, and deposition of fission product aerosols and vapors is directly applicable to modeling postulated source term releases from a TAD canister. Moreover, MELCOR is the designated “toolbox” code for leak path factor analysis in the DOE’s Safety Software Central Registry [DOE 2005]. MELCOR 1.8.6 YN (64-bit) is the code version used for this analysis. 2.2. MELCOR Model A very simple MELCOR model of the TAD canister has been developed. The model treats a vertically orientated TAD canister as a single control volume (CV) that is connected to an “environment” CV via a flow path (FL) that represents the breach in the canister. The bottom, top, and sidewall of the canister are modeled as heat structures (HS), which allows MELCOR to model deposition of aerosols (e.g., gravitational settling, thermophoresis) onto the surfaces. Rather than model the detailed thermal behavior of the TAD, representative boundary conditions are applied at the canister outer surface and the centerline of the fuel rods. The model is a conservative representation of the fuel assemblies, structural components and the canister. The vertical orientation provides a smaller deposition area and a longer deposition length for aerosols released from the fuel rods. The single CV treatment ignores any transport time from the point of release from one or more fuel rods to the canister breach location. The model does not include internal structural components, thermal shunts, poison inserts, etc. It also does not model the fuel assembly structure. All of these ignored structures/components would

10 September 2007
provide additional surfaces on which particles could deposit. Moreover, the potential for impingement of particles as they are blown out of the fuel rods on to these structures is ignored. Figure 1 shows a diagram of the model.
Figure 1. Control Volume/Flow Path Diagram. 2.2.1. Control Volumes Each control volume is defined in terms of its thermodynamic conditions and an altitude/volume table. The draft dimensions of the TAD canister are a height of 210 in (5.334 m), an internal diameter of 66 in (1.676 m) and a wall thickness of 1 in (0.0254 m). Table 1 lists the control volume thermodynamic conditions. Table 2 provides the altitude/volume tables for the control volumes.
Table 1. Control Volume Thermodynamic Conditions.
Control Volume Initial Pressure Initial
Temperature Gas Composition
CV101 (TAD) 57.4 psia
(395759.1 Pa) 1078 °F
(854.3 K) 100% He
CV900 (environment) 14.65 psia
(101,000 Pa) 80.33 °F (300 K)
100% N2

11 September 2007
Table 2. Control Volume Altitude/Volume Tables.
Control Volume Altitude [m] Altitude [in] Volume [m3] Volume [ft3]
CV101 (TAD) 0.0
5.334 0
210 0.0 5.0
0.0 176.57
CV900 (environment) -1.0 10.0
-39.37 393.7
0.0 1000.0
0.0 35314.7
2.2.2. Flow Paths A single flow path models the opening between the interior of the canister and the environment. The flow path is held closed during the steady-state initialization of the problem (i.e., t < 0 s) and is opened at the initiation of the postulated accident (i.e., t = 0 s). The flow path length is equal to the thickness of the canister (1 inch). The flow path opening is modeled as a circular opening (see Table 3) and a rectangular crack (see Table 4).
Table 3. Circular Opening Flow Path Parameters. Area [m2] Area [in2] Hydraulic Diameter [m] Hydraulic Diameter [in]
1.0x10⁻³ 1.55x100 3.57x10⁻² 1.40x100 1.0x10⁻⁴ 1.55x10⁻¹ 1.13x10⁻² 4.44x10⁻¹ 1.0x10⁻⁵ 1.55x10⁻² 3.57x10⁻³ 1.40x10⁻¹ 1.0x10⁻⁶ 1.55x10⁻³ 1.13x10⁻³ 4.44x10⁻² 1.0x10⁻⁷ 1.55x10⁻⁴ 3.57x10⁻⁴ 1.40x10⁻² 1.0x10⁻⁸ 1.55x10⁻⁵ 1.13x10⁻⁴ 4.44x10⁻³ 1.0x10⁻⁹ 1.55x10⁻⁶ 3.57x10⁻⁵ 1.40x10⁻³
Table 4. Rectangular Crack Flow Path Parameters. Area [m2] Area [in2] L/W [-] Hydraulic Diameter [m] Hydraulic Diameter [in]
1.0x10⁻⁴ 1.55x10⁻¹ 100 1000
10000
1.98x10⁻³ 6.32x10⁻⁴ 2.00x10⁻⁴
7.80x10⁻²
2.49x10⁻²
7.87x10⁻³
1.0x10⁻⁵ 1.55x10⁻² 100 1000
10000
6.26x10⁻⁴ 2.00x10⁻⁴ 6.32x10⁻⁵
2.47x10⁻²
7.87x10⁻³
2.49x10⁻³
1.0x10⁻⁷ 1.55x10⁻⁴ 100 1000
10000
6.26x10⁻⁵ 2.00x10⁻⁵ 6.32x10⁻⁶
2.47x10⁻³
7.78x10⁻⁴
2.49x10⁻⁴
1.0x10⁻⁹ 1.55x10⁻⁶ 100 1000
10000
6.26x10⁻⁶ 2.00x10⁻⁶ 6.32x10⁻⁷
2.47x10⁻⁴
7.87x10⁻⁵
2.49x10⁻⁵

12 September 2007
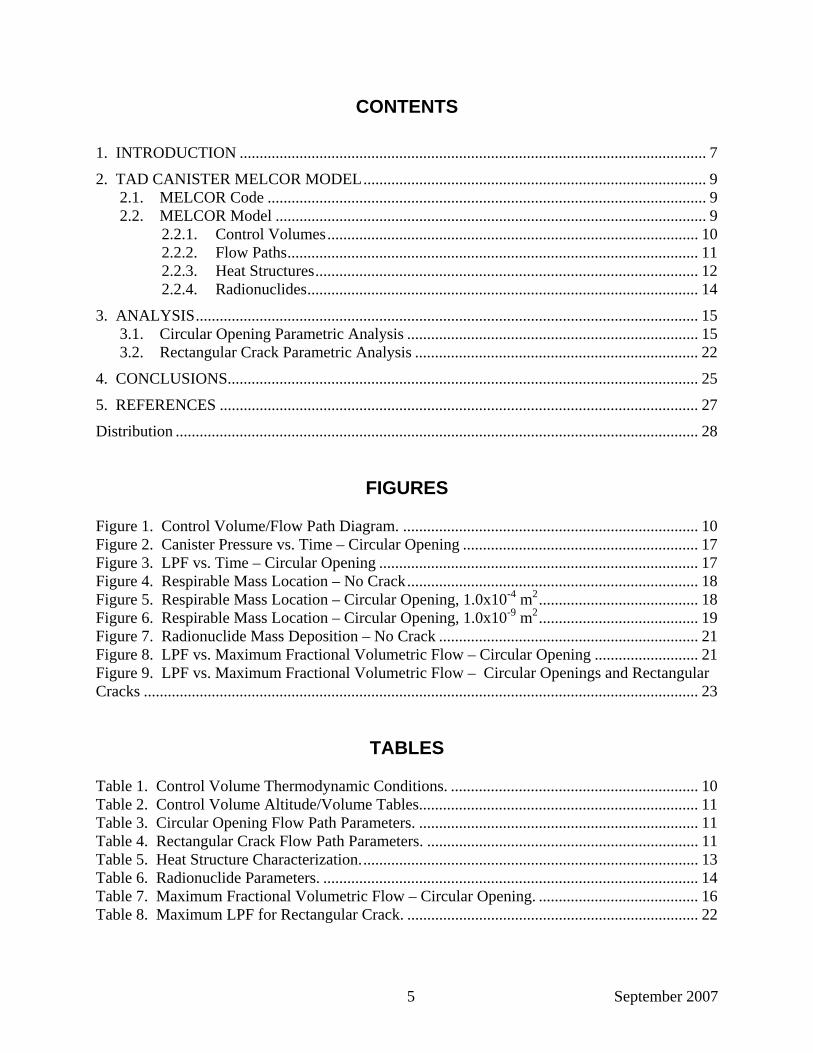
2.2.3. Heat Structures Heat structures are implemented in the model to provide surface area for deposition and to provide a mechanism to introduce the heat generation of the fuel rods within the canister into the model. A separate heat structure is implemented for top, bottom, and sidewall of the canister. A heat structure is also defined for the fuel rods. The fuel rod centerline temperature is held constant at the draft accident-condition fuel surface temperature limit of 1076 °F (854.3 K). The outer surfaces of the canister are held constant at 400 °F (477.6 K), which is long-term post-accident temperature of a dry shield canister as calculated in the NUHOMS-MP187 Multi-Purpose Cask Safety Analysis Report [Transnuclear 2003].
13 September 2007
Table 5. Heat Structure Characterization.
Heat Structure Geometry Boundary Conditions
TAD bottom HS00101
horizontal flat plate thickness = 1 in (0.0254 m) diameter = 66 in (1.676 m)
bottom (associated with CV900): constant temperature T = 400 °F (477.6 K) top (associated with CV101): convective
TAD side wall HS00102
vertical cylinder inner diameter = 66 in (1.676 m) outer diameter = 68 in (0.8509 m) height = 210 in (5.334 m)
inside (associated with CV101): convective outside (associated with CV900): constant temperature T = 400 °F (477.6 K)
TAD top HS00103
horizontal flat plate thickness = 1 in (0.0254 m) diameter = 66 in (1.676 m)
bottom (associated with CV101): convective top (associated with CV900): constant temperature T = 400 °F (477.6 K)
fuel rod2 HS00104
vertical cylinder inner diameter3 = 0.003937 in (0.0001 m) outer diameter = 2 in (0.0508 m) height = 210 in (5.334 m) HS is duplicated 6069 times to represent the total number of fuel rods in the canister for 21 17x17 assemblies.
inside (center line): constant temperature T = 1078 °F (854.3 K) outside (associated with CV101): convective
2 The actual dimensions of a 17x17 PWR fuel rod is an outer diameter of 0.374 inches (0.00999 m) and a length of ~153 inches (3.8862 m). A test case was run with the PWR fuel rod dimensions and no difference was seen between it and the case run with these fuel rod dimensions. 3 MELCOR will not allow a constant temperature boundary condition for a boundary with a zero area. Therefore a very small inner diameter is assumed to allow this boundary condition to be implemented.

14 September 2007
2.2.4. Radionuclides One radionuclide release, a “puff” release of UO2 particles from a rupture of 100% of the fuel rods into the canister, is implemented in the model. The release is input into the model via the MELCOR radionuclide (RN) package. Table 6 contains the assumed parameters that define the release in the model.
Table 6. Radionuclide Parameters.
Parameter Value RN Class 10 Aerosol or Vapor aerosol Particle Mass Median Diameter 0.005906 in (150 microns) Particle Geometric Standard Deviation
3.8
Release 0.002205 lb (24 g)
released uniformly over 0.1 s

15 September 2007
3. ANALYSIS
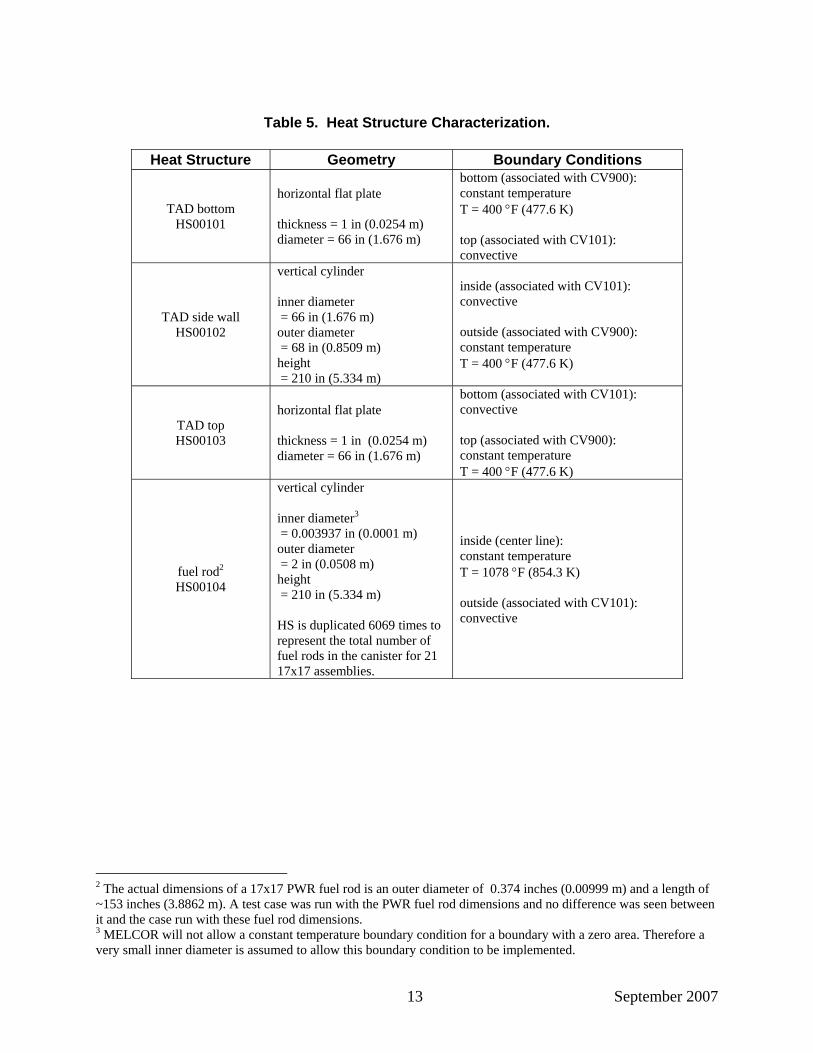
A set of parametric studies were performed to investigate the impact on LPF of varying leak path areas and geometry. First a circular leak path was evaluated with the area was varied from 1.0x10⁻³ m2 to 1.0x10⁻⁹ m2. This analysis is discussed in Section 3.1. An additional analysis was performed for the 1.0x10⁻⁴ m2, 1.0x10⁻⁵ m2, 1.0x10⁻⁷ m2, and 1.0x10⁻⁹ m2 leak path areas using a rectangular geometry for the leak path with length-to-width ratios (L/Ws) of 1.0x10², 1.0x10³, and 1.0x10⁴. This analysis is discussed in Section 3.2. 3.1. Circular Opening Parametric Analysis A parametric study of the leak path area for a circular geometry was performed using the MELCOR model described in Section 2. The parametric study evaluated the LPF for leak path areas from 1.0x10⁻³ m2 to 1.0x10⁻⁹ m2 (see Table 3). The TAD canister pressure as a function of time is shown in Figure 2. The time-axis is in log-scale in order to display the very short blow-down times for the larger areas as well as the relatively constant pressures at longer times for the smaller areas. Figure 3 shows the LPF as a function of time. Comparing Figures 2 and 3 finds that the larger crack results in a rapid depressurization and a large release fraction of the respirable mass to the environment. For cracks 1.0x10⁻⁶ m2 or smaller, the LPF plateaus at about 1000 s. The plateau is reached before the canister has completely depressurized, which means that beyond ~1000 s there is only a negligible amount of respirable material airborne in the canister. Table 7 lists the maximum fractional volumetric flow for each case. The maximum fractional standard volumetric flow is defined as the maximum standard4 volumetric flow divided by the TAD canister volume. It is of interest to note that the maximum fractional volumetric flow for the 1.0x10⁻⁹ m2 crack is on the same order as the proposed TAD canister leak limit under accident conditions of 9.3 x10⁻¹⁰ fraction of the canister free volume per second. As expected, decreasing the leak path area resulted in a reduction in the maximum fractional volumetric flow and, accordingly, the LPF. It also increased the time needed to completely depressurize the canister.
4 Standard conditions are defined as 300 K and 101,000 Pa.
16 September 2007
Table 7. Maximum Fractional Volumetric Flow – Circular Opening.
Area [m2] Area [in2] Maximum Fractional Volumetric Flow [1/s]
1.0x10⁻³ 1.55x100 3.35x10⁻¹ 1.0x10⁻⁴ 1.55x10⁻¹ 3.28x10⁻² 1.0x10⁻⁵ 1.55x10⁻² 3.03x10⁻³ 1.0x10⁻⁶ 1.55x10⁻³ 2.76x10⁻⁴ 1.0x10⁻⁷ 1.55x10⁻⁴ 1.17x10⁻⁵ 1.0x10⁻⁸ 1.55x10⁻⁵ 1.17x10⁻⁷ 1.0x10⁻⁹ 1.55x10⁻⁶ 1.17x10⁻⁹
Figures 4 through 6 show where the respirable radionuclide mass released from the fuel rods are located in the model (e.g., canister atmosphere, canister heat structures, environment) for the following cases:
• a canister with no crack, • a 1.0x10⁻⁴ m2 circular opening area • a 1.0x10⁻⁹ m2 circular opening area.
The no-crack case is of interest as it shows the time it would take the aerosol released from the fuel rods to deposit on the interior of the canister in the absence of any release to the environment. Figure 4 shows that at 3000 s there has been approximately a four order-of-magnitude reduction in the amount of respirable material airborne (i.e., available for release to the environment) in the canister. This illustrates that the early time-period is important in terms of the LPF as after that time there is only a negligible amount of respirable material that has not deposited onto the interior of the canister. Note that the time of the LPF plateaus in Figure 3 are consistent with when all of the respirable material in the canister is deposited on its interior surfaces. For the 1.0x10⁻⁴ m2 circular opening area case the release rate of respirable material to the environment is greater than the rate at which respirable material deposits on the canister’s interior surfaces (see Figure 5). This is due to the relatively high fractional volumetric flow. The release of respirable mass to the environment is effectively completed by 100 s (consistent with its LPF in Figure 4) due to the cessation of flow out of the canister. For the 1.0x10⁻⁹ m2 circular opening area case the release rate of respirable material to the environment is much less than the rate at which respirable material deposits on the canister’s interior surfaces (see Figure 6). This is due to the relatively low fractional volumetric flow. The release to the environment is effectively completed by 1000 s (consistent with its LPF in Figure 4). In this case the release to the environment ceases due to the effectively all of the respirable material in the canister depositing on its interior surfaces. The lower LPF for this case compared to that for the 1.0x10⁻⁴ m2 circular opening area is due to the lower volumetric flow to the environment during the period during which deposition is taking place.

17 September 2007
0
50000
100000
150000
200000
250000
300000
350000
400000
450000
1.0E-02 1.0E-01 1.0E+00 1.0E+01 1.0E+02 1.0E+03 1.0E+04 1.0E+05time [s]
can
iste
r p
ress
ure
[P
a]
1.0e-3 m21.0e-4 m21.0e-5 m21.0e-6 m21.0e-7 m21.0e-8 m21.0e-9 m2
Figure 2. Canister Pressure vs. Time – Circular Opening
1.0E-10
1.0E-09
1.0E-08
1.0E-07
1.0E-06
1.0E-05
1.0E-04
1.0E-03
1.0E-02
1.0E-01
1.0E+00
1.0E-01 1.0E+00 1.0E+01 1.0E+02 1.0E+03 1.0E+04 1.0E+05time [s]
LP
F [
-]
1.0e-3 m21.0e-4 m21.0e-5 m21.0e-6 m21.0e-7 m21.0e-8 m21.0e-9 m2
Figure 3. LPF vs. Time – Circular Opening

18 September 2007
1.0E-09
1.0E-08
1.0E-07
1.0E-06
1.0E-05
1.0E-04
0 600 1200 1800 2400 3000
time [sec]
resp
irab
le m
ass
fuel rod releasecanister atmospherecanister HSsenvironment
Figure 4. Respirable Mass Location – No Crack
1.0E-09
1.0E-08
1.0E-07
1.0E-06
1.0E-05
1.0E-04
0 20 40 60 80 100
time [sec]
resp
irab
le m
ass
fuel rod releasecanister atmospherecanister HSsenvironment
Figure 5. Respirable Mass Location – Circular Opening, 1.0x10⁻⁴ m2

19 September 2007
1.0E-12
1.0E-11
1.0E-10
1.0E-09
1.0E-08
1.0E-07
1.0E-06
1.0E-05
1.0E-04
0 1200 2400 3600 4800 6000
time [sec]
resp
irab
le m
ass
fuel rod releasecanister atmospherecanister HSsenvironment
Figure 6. Respirable Mass Location – Circular Opening, 1.0x10⁻⁹ m2

20 September 2007
Figure 7 show the radionuclide mass (both respirable and non-respirable) deposition onto the TAD top, side wall, and bottom HSs for the no-crack case. The majority of the deposition is driven by gravitational settling onto the bottom of the canister. The large imposed temperature gradient between the canister surfaces and the fuel rods causes some deposition to occur due to thermophoresis. The deposition onto the fuel rod HSs must be due to Brownian diffusion, as their vertical orientation precludes gravitational settling, there are no concentration gradients (i.e., no diffusiophoresis), and the thermal gradient for thermophoresis is away from the fuel rods. Figure 8 shows the plot of the maximum LPF versus the maximum fractional volumetric flow. This is a measure of the ability of the flow to move aerosols out to the environment before they can deposit onto the canister interior surfaces. There is a near-linear relationship between the base-10 logarithms of the LPF and maximum fractional volumetric flow rate. This relationship begins to break down as deposition starts becoming negligible in relation to the amount of radionuclide mass that is moved to the environment.

21 September 2007
1.0E-08
1.0E-07
1.0E-06
1.0E-05
1.0E-04
1.0E-03
1.0E-02
1.0E-01
0 600 1200 1800 2400 3000
time [sec]
Rad
ion
ucl
ide
Mas
s [k
g]
bottomside walltopfuel rods
Figure 7. Radionuclide Mass Deposition – No Crack
1.0E-07
1.0E-06
1.0E-05
1.0E-04
1.0E-03
1.0E-02
1.0E-01
1.0E+00
1.0E-09 1.0E-08 1.0E-07 1.0E-06 1.0E-05 1.0E-04 1.0E-03 1.0E-02 1.0E-01 1.0E+00
maximum fractional canister volumetric leak rate [1/s]
LP
F [
-]
Figure 8. LPF vs. Maximum Fractional Volumetric Flow – Circular Opening

22 September 2007
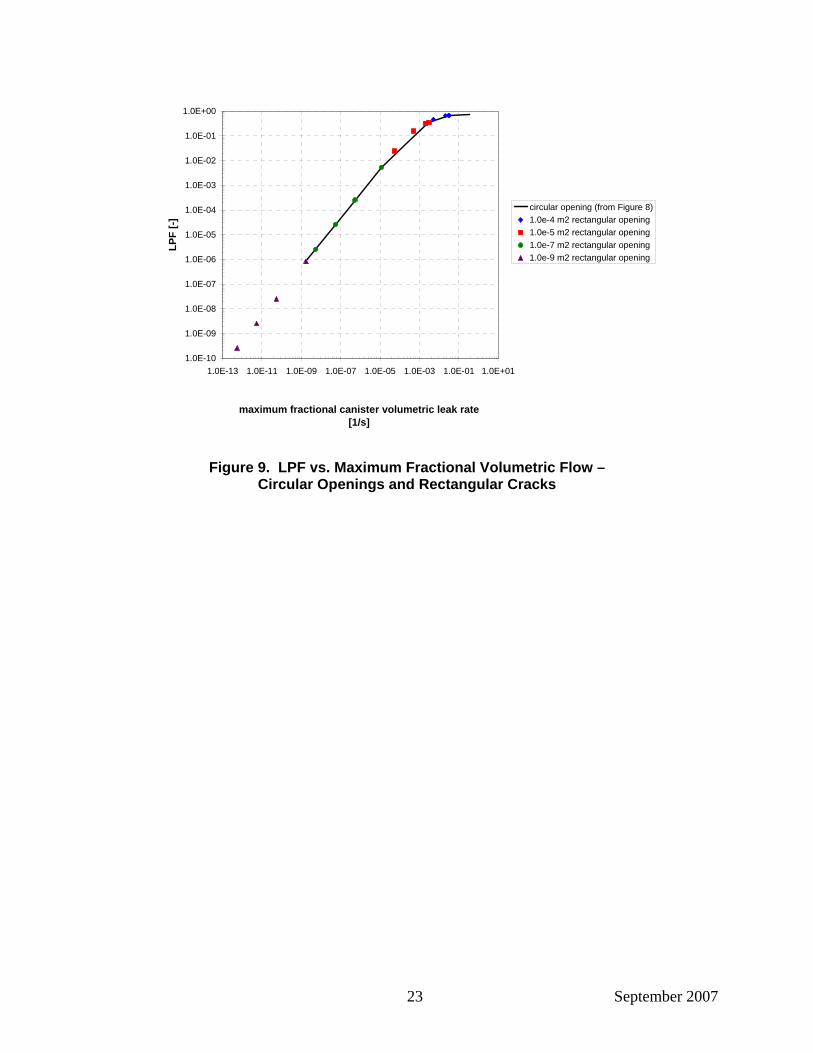
3.2. Rectangular Crack Parametric Analysis A parametric study of the leak path area for a rectangular geometry was performed using the MELCOR model described in Section 2. The parametric study evaluated the LPF for leak path areas of 1.0x10⁻⁴ m2, 1.0x10⁻⁵ m2, 1.0x10⁻⁷ m2, and 1.0x10⁻⁹ m2 for crack length-to-width ratios of 1.0x10², 1.0x10³, and 1.0x10⁴. (see Table 4). Table 8 and Figure 9 shows maximum LPFs for the cases. For the 1.0x10⁻⁴ m2 rectangular crack case increasing the L/W to 1.0x10⁴ reduces the maximum LPF by only ~30%. However, as the crack area is decreased the effect of larger L/Ws becomes much more pronounced, such that in the 1.0x10⁻⁹ m2 rectangular crack case increasing the L/W to 1.0x10⁴ reduces the maximum LPF by approximately three orders-of-magnitude.
Table 8. Maximum LPF for Rectangular Crack.
Area [m2] Area [in2] L/W [-]
Maximum Fractional Volumetric Flow [1/s]
Maximum LPF [-]
1.0x10⁻⁴ 1.55x10⁻¹
circular opening 1.0x10² 1.0x10³ 1.0x10⁴
3.28x10⁻² 2.88x10⁻² 2.04x10⁻² 5.02x10⁻³
6.80x10⁻¹ 6.76x10⁻¹ 6.55x10⁻¹ 4.73x10⁻¹
1.0x10⁻⁵ 1.55x10⁻²
circular opening 1.0x10² 1.0x10³ 1.0x10⁴
3.03x10⁻³ 2.03x10⁻³ 5.02x10⁻⁴ 5.37x10⁻⁵
3.51x10⁻¹ 3.20x10⁻¹ 1.54x10⁻¹ 2.41x10⁻²
1.0x10⁻⁷ 1.55x10⁻⁴
circular opening 1.0x10² 1.0x10³ 1.0x10⁴
1.17x10⁻⁵ 5.27x10⁻⁷ 5.39x10⁻⁸ 5.38x10⁻⁹
5.38x10⁻³ 2.55x10⁻⁴ 2.60x10⁻⁵ 2.60x10⁻⁶
1.0x10⁻⁹ 1.55x10⁻⁶
circular opening 1.0x10² 1.0x10³ 1.0x10⁴
1.72x10⁻⁹ 5.28x10⁻¹¹ 5.39x10⁻¹² 5.38x10⁻¹³
8.29x10⁻⁷ 2.55x10⁻⁸ 2.60x10⁻⁹ 2.60x10⁻¹⁰
23 September 2007
1.0E-10
1.0E-09
1.0E-08
1.0E-07
1.0E-06
1.0E-05
1.0E-04
1.0E-03
1.0E-02
1.0E-01
1.0E+00
1.0E-13 1.0E-11 1.0E-09 1.0E-07 1.0E-05 1.0E-03 1.0E-01 1.0E+01
maximum fractional canister volumetric leak rate [1/s]
LP
F [
-]
circular opening (from Figure 8)1.0e-4 m2 rectangular opening1.0e-5 m2 rectangular opening1.0e-7 m2 rectangular opening1.0e-9 m2 rectangular opening
Figure 9. LPF vs. Maximum Fractional Volumetric Flow – Circular Openings and Rectangular Cracks

24 September 2007
This page is intentionally left blank.

25 September 2007
4. CONCLUSIONS
A simple MELCOR model of the TAD canister was constructed and used to evaluate LPFs for a puff release from a postulated event that resulted in a TAD canister breach. A parametric analysis was performed with the leak path modeled as a circular opening with areas ranging from 1.0x10⁻³ to 1.0x10⁻⁹ m2. A parametric analysis was also performed with the leak path modeled as a rectangular crack with areas of 1.0x10⁻⁴ and 1.0x10⁻⁵ m2 with L/Ws of 1.0x10², 1.0x10³, and 1.0x10⁴. The estimated LPFs ranged from ~7x10⁻¹ to ~1x10⁻⁶. The magnitude of the LPF is dependent on the rate at which respirable material is deposited on the interior surfaces of the canister and the rate at which it is released from the canister. An analysis of the canister with no leak path (i.e., no release from the canister) shows that all of the respirable material will deposit on interior surfaces within ~1000 s. Hence, for postulated large leak paths that depressurize the canister rapidly (<< 1000 s), the bulk of the respirable material is released from the canister and very little is deposited on the interior surfaces. A more realistic model that includes the internal structures and a more detailed thermal profile would provide more cooler surface areas for deposition via thermophoresis. In addition, for a horizontal canister, there would be more surface area for gravitational settling as well as a shorter deposition distance. The result of taking credit for these existing surfaces would be higher deposition estimates and therefore lower LPFs. If sufficient design information was available, the detailed thermal profile for a more realistic model could be calculated using a code such as ANSYS. In lieu of design information sufficient to build a detailed model, a temperature profile could be abstracted from calculations that have been performed on canister designs that are similar to the TAD canister. In either case, the calculated temperature profile would be used as boundary conditions for representative heat structures. A more detailed set of internal control volumes and flow paths, consistent with the representative heat structures would replace the single canister control volume. Credit for deposition due to aerosol impaction could be taken by performing a separate analysis to evaluate the degree of impaction deposition that occurs. However, due to the large degree of uncertainty in the parameters of the problem (e.g., burst location, crack geometry) it may be necessary to evaluate the impact deposition in terms of a distribution of results rather than a bounding/conservative deterministic value. Another issue that the current simple model does not address is flow into/out of the canister once the blow down is complete. While particle diffusion out of the canister is not an issue due to the very low diffusion coefficient of even micron-sized particles, the diffusion of oxygen into the canister would occur. Moreover, the current model does not have the capability to evaluate the potential for buoyancy-driven bi-directional flow. A computational fluid dynamics code (e.g., FLUENT) could be used to evaluate these problems.

26 September 2007
This page is intentionally left blank.

27 September 2007
5. REFERENCES DOE, 1994, DOE Handbook, Airborne Release Fractions/Rates and Respirable Fractions for
Nonreactor Nuclear Facilities, Volume 1 – Analysis of Experimental Data, DOE-HDBK-3010-94, US Department of Energy, Washington, D.C.
DOE, 2004, Software Quality Assurance Improvement Plan: MELCOR Gap Analysiss, DOE-
EH-4.2.1.3-MELCOR-Gap Analysis, US Department of Energy, Washington, D.C. Gauntt, R., et al., 2005, MELCOR Computer Code Manuals, NUREG/CR-6119, SAND2005-
5713, US Nuclear Regulatory Commission, Washington, D.C. Transnuclear, 2003 NUHOMS-MP187 Multipurpose Cask Safety Analysis Report, NUH-5-151, Rev. 17. Volume 1. Transnuclear, Inc., Freemont, CA.

28 September 2007
DISTRIBUTION 5 Katheryn Ashley 1450 Center Crossing Drive
Las Vegas, NV 89144 1 Sen Sung-Tsai 1450 Center Crossing Drive
Las Vegas, NV 89144 1 Mark Wisenburg 1450 Center Crossing Drive
Las Vegas, NV 89144 5 MS0748 Donald A. Kalinich 6762 2 MS9018 Central Technical Files 8944 2 MS0899 Technical Library 4536