yukon state of the environment · 1.1 greenhouse gas emissions ... reporting this interim report...
TRANSCRIPT
Yukon State of the Environment INTERIM REPORT
An Update for Environmental Indicators
2013

Yukon State of the Environment
Interim Report
An Update for Environmental Indicators, 2013

ii
Acknowledgements
Project Coordination:
Tim Sellars, Policy, Planning and Aboriginal Relations, Environment Yukon
Consultant:
Teresa Earle, writer
Reviewers and Contributors:
Yukon Government:
Energy, Mines and Resources: Lyle Dinn (Forest Planning and Development), Jerome McIntyre, Doris Dreyer (Land Planning).
Community Services: Cheryl Baxendale, (Community Affairs), David Milne (Wildland Fire Management).
Environment Yukon: Bruce McLean, Tess McLeod (Habitat Management, Fish and Wildlife), Oliver Barker, Rob Florkiewicz, Troy Hegel (Species Programs, Fish and Wildlife), Todd Powell (Biodiversity Programs, Fish and Wildlife), Afan Jones, Dave Ladret (Yukon Parks), Rebecca World, Eric Schroff, Johanna Smith (Climate Change Secretariat), Janine Kostelnik, Beth Peters (Standards and Approvals, Environmental Programs), Bob Truelson, Jean Beckerton, Heather Jirousek, Erin Light (Water Resources), Nancy Campbell, Jen Edwards (Communications), Dan Paleczny, Diane Gunter (Policy, Planning and Aboriginal Relations), Ken Knutson (Conservation Officer Services).
Others:
City of Whitehorse: Bryna Cable, Wayne Tuck. Environment Canada: Celine Audette. Yukon Land Use Planning Council: Ron Cruikshank, Nick Gryzbowski Gamberg Consulting: Mary Gamberg.
Photos: Yukon Government, unless otherwise noted.
© Government of Yukon Published April 2013 ISBN 978-1-55362-653-4 www.env.gov.yk.ca
iii
Table of Contents
Highlights ......................................................................................... ivList of Figures .................................................................................. viList of Tables .................................................................................. viiIntroduction ...................................................................................... 11. Climate Change ......................................................................... 3
1.1 Greenhouse Gas Emissions ......................................................................... 31.2 Changing Climate ..................................................................................... 10
2. Air ............................................................................................ 142.1 Air Quality ............................................................................................... 142.2 Interesting Story: Landfill burning ends across Yukon ................................... 19
3. Water ...................................................................................... 203.1 Water Quality Index .................................................................................. 203.2 Interesting Story: New Yukon water website ................................................ 233.3 Interesting Story: White Gold Cumulative Effects Study ............................... 24
4. Land ......................................................................................... 244.1 Land Use and Resource Management Planning ............................................. 254.2 Interesting Story: New building on Herschel Island ....................................... 334.3 Solid Waste Management ........................................................................... 34
5. Fish and Wildlife ....................................................................... 405.1 Population Trends and Planning Initiatives ................................................... 405.2 Interesting Story: New bear incident map ..................................................... 465.3 Contaminants ............................................................................................ 475.4 Species at Risk .......................................................................................... 49
Conclusion ...................................................................................... 52References ...................................................................................... 53

iv
HighlightsReporting
This interim report provides the best information available on climate change, air, water, land, and fish and wildlife in order to update the previous Yukon State of Environment Full Report, 2008. The base year for comparable trend data is 2010. More recent data and information, up to the end of 2012, was incorporated where possible.
Climate Change
In 2010, Yukon produced 340 kilotonnes of greenhouse gas emissions, a 36.5% decrease from 1990. In September 2012, Yukon government published the Climate Change Action Plan Progress Report providing updates on priority and ongoing climate change actions.
Air
In 2011 air quality in Whitehorse was better than in 2010. Since monitoring began in 2001, 2010 has proven to have the highest level of particulate matter concentrations, most likely due to wildfires that year. To-date, Yukon’s particulate matter concentrations have consistently remained below the Canadian annual average.
Water
In 2010, a total of 111 samples were collected from eight monitoring stations in Yukon, providing data for the Water Quality Index. Stations whose results are reported at the national level had water quality scores calculated by the time of publication. The results for these four stations are: Yukon River below City of Whitehorse was rated ‘good’; Klondike River was rated ‘fair’; Liard River was rated ‘good’; and South McQuesten River was rated ‘fair’.
Land
Land use and resource management planning
As of 2012, land use, resource, and protected area plans were in place for 37 areas. Another 14 plans were underway and five plans were lapsed or not started.
v
Solid waste management
In 2012, overall the City of Whitehorse diverted 22% of its solid waste from landfills by recycling and composting. Households with curbside compost collection diverted 44% of garbage from the City’s landfill.
Fish and Wildlife
Population trends
In 2012, preliminary data shows that the goal was not met for the number of Chinook salmon returning to spawn in the Canadian portion of the Yukon River drainage.
The majority of lake trout fisheries were considered sustainable; harvest levels for four lakes exceeded sustainable limits (2011).
Of the 27 caribou herds in Yukon, six were assessed as stable/increasing, 14 were considered relatively stable, five were unknown and two were thought to be declining.
Species at risk
In 2012, Yukon had the second lowest number of species identified at risk (23) in Canada. Recovery and management plans are being developed for three of those species.
vi
List of Figures
Figure 1.1.1 2010 greenhouse gas emissions by sector
Figure 1.2.1 Annual Canadian temperature departures and trend, 1948-2011
Figure 2.1.1 Monthly averages of particulate matter (PM2.5) in Whitehorse for 2010, 2011 and an average from 2001-2009
Figure 2.1.2 Monthly averages of particulate matter (PM2.5) in Whitehorse and Smithers, British Columbia
Figure 4.1.1 Status of land use and resource management plans in Yukon in 2012
Figure 4.1.2 Yukon planning regions
Figure 4.1.3 Parks and other protected areas in Yukon, including those awaiting designation
Figure 4.3.1 Waste handled at the City of Whitehorse Waste Management Facility, 2000-2011
Figure 4.3.2 Whitehorse waste diverted compared to total waste generated, 2000-2011
Figure 4.3.3 Curbside waste collected from single family homes in Whitehorse, 2000-2011
Figure 5.1.1 Number of Chinook salmon spawning in the Canadian portion of the Yukon River, excluding the Porcupine River drainage, 1982-2012
Figure 5.1.2 Sustainability of angler harvest on select Yukon lake trout populations based on angler harvest data in 2011
Figure 5.1.3 Status and ranges of caribou in Yukon, 2013

vii
List of Tables
Table 1.1.1 Trends in greenhouse gas (GHG) emissions in Yukon, 1990-2010
Table 1.1.2 Yukon greenhouse gas (GHG) emissions by sector, 1990-2010
Table 2.1.1 Average ambient annual particulate matter (PM2.5) and number of days that particulate matter levels exceeded the national standard in Whitehorse, 2001-2011
Table 3.1.1 Water Quality Index ratings defined by Canadian Environmental Sustainability Indicators
Table 3.1.2 Number of samples collected at Yukon monitoring stations, 2008-2010
Table 3.1.3 Water Quality Index rolling average ratings for Yukon monitoring stations, 2002-2010
Table 4.1.1 Status of land use, forest resources, and official community planning processes in Yukon in 2012
Table 4.1.2 Status of local area plans and zoning regulations in 2012
Table 4.1.3 Status of parks and other protected area plans in Yukon, 2011
Table 5.1.1 Status of community-based wildlife plans and species plans in 2012
Table 5.4.1 National status of species at risk that occur in Yukon, 2012

viii

1
IntroductionWhy produce a State of the Environment Report for Yukon?
This report provides insight into whether Yukon is achieving the goal of maintaining and enhancing the quality of Yukon’s natural environment for present and future generations. It provides an opportunity to reflect on the status of the environment and to help guide future decision-making.
This interim report presents information on climate change, air, water, land, and fish and wildlife. It supplements information available from the last edition of the Yukon State of Environment Full Report 2008. Yukon’s Environment Act requires full state of the environment reports every three years along with interim reports in intervening years (see box text on page 2).
This report includes the best information available at the end of the 2012 calendar year (which includes data from 2010 to December 2012). The base year for comparing trend data in this report is 2010 because several agencies require up to 24 months to complete the data collection, compilation, analysis and reporting to Environment Yukon.
This report answers five basic questions:
What is the issue?
What are the indicators?
What is happening?
Why is it happening?
Why is it significant?
This report tracks environmental indicators, which are key measurements used to monitor, describe and interpret change. Indicators cannot provide all of the information on a particular topic, but they give information that shows how aspects of the environment are doing. The indicators featured here are based on criteria including data availability, data reliability, usefulness and ease of understanding. Indicators are used to evaluate and demonstrate whether environmental conditions are improving, remaining stable or declining.
This report represents a collective effort from scientific experts, government agencies, and non-governmental organizations that have provided information, data and advice.
2
Environment Act: State of Environment Report
47. (1) The government of Yukon shall report publicly on the state of the environment pursuant to this Act.
(2) The purpose of this report under subsection (1) is:
a. to provide early warning and analysis of potential problems for the environment;
b. to allow the public to monitor the progress toward the achievement of the objectives of this Act; and
c. to provide baseline information for environmental planning, assessment and regulation.
48. (1) The Minister shall prepare and submit to the Legislative Assembly a Yukon State of the Environment Report within three years of the date this section comes into force and thereafter within three years of the date of the previous report.
50. (1) Commencing from the date of the first Yukon State of the Environment Report, for every period of twelve consecutive months in which a Yukon State of the Environment Report is not made, the Minister shall prepare an interim report and submit it to the Legislative Assembly.
(2) An interim report under subsection (1) shall comment on matters contained in the previous Yukon State of the Environment Report.

3
1. Climate Change 1.1 Greenhouse Gas Emissions
What is the issue?
Climate change is a global issue, presenting a range of challenges in many parts of the world. The Intergovernmental Panel on Climate Change, a scientific body established to collect and synthesize the world’s best research on climate change, considers global climate change to be the most significant threat facing our world’s environment today. Many jurisdictions, including Yukon, are introducing measures to limit greenhouse gas (GHG) emissions that are produced from human activities, such as the burning of fossil fuels.
What are the indicators?
Levels of GHG emissions, which include carbon dioxide, methane and nitrous oxide, have increased since the industrial revolution. Carbon dioxide (CO2) is the most common GHG in the atmosphere. Today, the world is experiencing the highest CO2 levels in over 400,000 years. The CO2 traps more and more of the energy radiated from the earth into our atmosphere which, in turn, affects our climate.
GHG emissions information available for Yukon is from Environment Canada’s National Inventory Report. The most recent data from 2010 includes:
Total Yukon GHG emissions (Table 1.1.1).
Yukon GHG emissions by sector (Table 1.1.2 and Figure 1.1.1).
Table 1.1.1 Trends in greenhouse gas (GHG) emissions in Yukon, 1990-2010
1990 2000 2005 2006 2007 2008 2009 2010 Total GHG Emissions (KtCO2e)1 536 451 414 507 522 463 344 340
Annual Change (%) NA NA NA 22.46 2.96 -11.3 -25.70 -1.16 Change since 1990 (%) NA -15.86 -22.76 -5.41 -2.61 -13.62 -35.82 -36.57
Source: Environment Canada, National Inventory Report 1990–2010, 2012.
Note: (1) KtCO2e: kilotonnes of carbon dioxide equivalent.

4
Canada Agriculture
Energy: Fugitive Sources
Energy: StationaryCombustion SourcesEnergy: Transport
Industrial Processes
Waste
Yukon
Figure 1.1.1 2010 greenhouse gas emissions by sector
Source: Environment Canada, National Inventory Report 1990–2010, 2012
What is happening?
Canadian emissions for 2010 were 692 megatonnes or 692,000 kilotonnes. This is approximately 17% above 1990 levels. Canada is ranked among the highest of all countries in the world in terms of per-capita GHG emissions largely due to its size, climate and resources-based economy. Yukon’s total GHG emissions for 2010 were 340 kilotonnes. This is a 36.5% reduction since 1990 (Table 1.1.1). Yukon’s total GHG emissions (340 kilotonnes) contributed only 0.05% of Canada’s total emissions (692 megatonnes) in 2010. In 2010, Yukon produced fewer GHG emissions per capita (approximately 9.76 tonnes/person) than the rest of Canada (20.3 tonnes). Although Yukon’s emissions are low compared to the rest of the country, Yukon residents and businesses rely on goods and services produced nationally and internationally.

5
Table 1.1.2 Yukon greenhouse gas (GHG) emissions by sector, 1990-2010
Greenhouse Gas Categories 1990 2005 2006 2007 2008 2009 2010 TOTAL (kt CO2 equivalent) 536 414 507 522 463 344 340ENERGY 533 402 496 510 451 329 324
a. Stationary Combustion Sources 221 132 232 241 234 134 136Electricity and Heat Generation 93.6 17.1 18.1 17.9 18.1 17.0 18.7 Fossil Fuel Production & Refining 2.8 29 81 88 46 12 19 Mining & Oil and Gas Extraction 5.72 4.87 18.7 21.6 25.0 4.35 5.52 Manufacturing Industries 6.00 0.00 - 1.22 20.4 16.8 14.6 Construction 3.53 1.13 1.98 2.41 2.04 1.52 1.81 Commercial & Institutional 76.3 34.6 54.0 59.3 65.3 53.6 42.5 Residential 32 39 53 51 57 28 33 Agriculture & Forestry 1.08 6.12 6.02 - - - -
b. Transport 312 267 261 266 213 193 185Civil Aviation (Domestic Aviation) 34 34 34 39 34 33 37 Road Transportation 179 157 145 134 128 119 114
Light-Duty Gasoline Vehicles 79.4 34.4 29.9 24.2 19.5 19.8 19.4 Light-Duty Gasoline Trucks 30.4 37.1 32.2 26.2 21.1 21.4 20.9 Heavy-Duty Gasoline Vehicles 10.0 5.91 5.12 4.16 3.39 3.50 3.48 Motorcycles 0.50 0.32 0.28 0.23 0.19 0.19 0.19 Light-Duty Diesel Vehicles 0.77 0.38 0.33 0.27 0.22 0.23 0.24 Light-Duty Diesel Trucks 0.62 2.42 2.11 1.71 1.39 1.39 1.39 Heavy-Duty Diesel Vehicles 55.7 75.1 73.5 75.2 80.1 71.3 67.1 Propane & Natural Gas Vehicles 1.5 1.1 1.5 1.8 1.8 0.92 1.3
Other Transportation 100 75 82 94 52 41 35 Off-Road Gasoline 10 2.8 2.5 1.8 1.5 1.8 0.86 Off-Road Diesel 89 73 79 92 50 40 34
c. Fugitive Sources - 3.88 3.32 3.02 3.10 2.77 2.90Oil and Natural Gas - 3.88 3.32 3.02 3.10 2.77 2.90
INDUSTRIAL PROCESSES 1.50 9.19 8.71 9.60 9.82 11.4 12.8a. Mineral Products Use 0.13 - - - - - -d. Production and Consumption of Halocarbons
- 8.9 8.4 8.9 9.3 11 12
e. Other & Undifferentiated Production
1.4 0.33 0.28 0.71 0.56 0.56 0.85
SOLVENT & OTHER PRODUCT USE 0.18 0.37 0.33 0.32 0.34 0.26 0.25AGRICULTURE 0.0 0.0 0.0 0.0 0.0 0.0 0.0WASTE 1.4 2.2 2.3 2.4 2.4 2.5 2.6
a. Solid Waste Disposal on Land 0.60 1.3 1.3 1.4 1.4 1.5 1.5b. Wastewater Handling 0.76 0.95 0.96 0.98 0.98 0.99 1.0
Source: Environment Canada, National Inventory Report 1990–2010, 2012
Notes: (1) - Indicates no emissions. (2) kt CO2 equivalent: Kilotonnes of CO2 equivalent. (3) Emission totals in chart may not add up due to rounding protocol. Categories with 0 or no emissions are not shown.

6
Why is it happening?
Reductions in Yukon GHG emissions since 1990 are mainly due to changes in the nature and extent of industry (Table 1.1.2). The cyclical nature of Yukon’s resource economy significantly affects GHG emission levels. Emissions were high in 1990 and low in 2010 (most recent data available) which can be linked to the fact that there was more activity in Yukon’s mining industry in the 1990s than in 2010.
Transportation accounts for the largest share of GHG emissions in Yukon (Table 1.1.2 and Figure 1.1.1). In this energy combustion sub-sector, heavy-duty diesel vehicles are the largest contributors followed by off-road diesel use. Off-road diesel use includes the use of heavy mobile equipment in construction, agriculture and mining, as well as diesel that is used to generate electricity in remote locations.
Electricity generation has been a major contributor to GHG emissions in Yukon when energy demands are high. When the demand for electricity exceeds Yukon’s hydro generation capacity, diesel generators are used to make up the shortfall, which results in a significant increase in GHG emissions. With regards to electricity generation, diesel is second only to coal in terms of CO2 outputs per unit of energy.
Why is it significant?
A variety of conditions unique to Yukon present challenges in addressing climate change and reducing GHG emissions. A high energy input is required to live long distances from production centres and to heat buildings during long, cold winters. Irregular industrial activity and an isolated electricity grid that is not always able to meet the demand of the developmental activity often results in fluctuations in emission levels.
From a global perspective, Yukon-generated GHG emissions are very low, while the rate and magnitude of temperature change in the region is predicted to be one of the largest. Although Yukon GHG emissions have limited influence over global emission levels, Yukon government is prepared to demonstrate environmental leadership and responsibility as it communicates the magnitude of northern climate change impacts to the rest of the world.
Taking action
In February 2009, Yukon government published the Climate Change Action Plan, building on the vision and goals set out in its Climate Change Strategy. The Action Plan outlines concrete actions Yukon government is taking to address climate change within its areas of responsibility, based on the following goals:
1. Enhance Yukon’s knowledge and understanding of climate change;
2. Adapt to climate change;

7
3. Reduce Yukon’s GHG emissions; and
4. Lead Yukon action in response to climate change.
In September 2012, Yukon government published the Climate Change Action Plan Progress Report providing updates on priority and ongoing climate change actions. The report includes the following highlights:
Yukon government is tracking its greenhouse gas emissions from internal government activities with the goal of achieving a 20% GHG emission reduction below 2010 levels by 2015.
Working with key players in the electricity, building, transportation and industrial operations sectors, Yukon government has established sector-based greenhouse gas emissions targets that will support growth and prosperity in Yukon while demonstrating environmental stewardship.
Yukon government has secured annual funding of up to $500,000 from the federal department of Aboriginal Affairs and Northern Development for four years to support nine adaptation projects including: documenting ecosystem changes; flood risk mapping; and the impact of thawing permafrost on Yukon highways, agriculture, and water resources.
Some of the specific actions and initiatives set out in the Climate Change Action Plan and the Energy Strategy for Yukon include:
The Climate Change Secretariat collected, calculated and submitted Yukon government’s 2010 energy and fuel consumption data to The Climate Registry. The data was independently verified by external auditors and we now know that Yukon government generated 43.7 kilotonnes (calculated) of GHG emissions in 2010.
Green Action Committees have been established in all Yukon government departments to help identify, develop and implement actions to support the further reduction of GHG emissions by departments.
The Energy Solutions Centre and the Climate Change Secretariat are in the process of completing an extensive study of the transportation sector which will be used as a baseline from which to develop options to further reduce GHG emissions.
Yukon government is working with key players in the electricity, building and energy efficiency, industrial, and transportation sectors to identify actions that will lead to realistic and measurable outcomes to minimize growth in Yukon’s overall GHG emissions. Examples of the established targets include (a full listing can be found in the Climate Change Action Plan Progress Report):
o By 2015, reduce emissions in the transportation sector by 10%;
o By 2016, increase the average energy efficiency of new residential, commercial and institutional buildings constructed outside of Whitehorse by 25% when compared to buildings constructed to 2011 energy efficiency standards;

8
o By 2016, reduce the electrical energy intensity of industrial operations, including mines, which were operating in 2011 by 15%; and
o By 2020, reduce the emission intensity of on-grid diesel power generation by 20%.
The Good Energy program by the Energy Solutions Centre continues to provide information and financial rebates for best-in-class household energy equipment. The Energy Solutions Centre encourages improvements in energy efficiency and the adoption of more forms of renewable energy. The Centre is in the advanced stages of developing a draft bio-energy strategy that will be used to develop wood energy opportunities for residential and institutional heating.
The Yukon Housing Corporation implemented GreenHome energy efficiency standards for its government-funded home ownership programs. All new construction done by the corporation is now carried out under the new Green Home standard which means that home heating costs are much lower than conventionally built Yukon homes.
In 2009, Yukon government also published its Energy Strategy for Yukon, recognizing that climate change and energy are inextricably linked and common issues should be dealt with in a consistent manner. The vision of the Energy Strategy is for a sustainable and secure energy sector that is environmentally, economically and socially responsible. It identified four priorities and 24 actions to achieve them. In 2011, Yukon government published the Energy Strategy for Yukon – Progress Report 2010 to highlight progress on the priority actions, such as reducing energy consumption in Yukon buildings and promoting renewable energy sources for transportation. The 2012 Progress Report is expected to be published in 2013.
The Yukon Energy Corporation is also taking steps to address greenhouse gas emissions through its operations. Adding hydro power and flexibility to Yukon’s system reduces the need to use diesel generators and the greenhouse gases they create.
Yukon Energy undertook the $160 million Yukon Green Energy Legacy Project which included the addition of hydro capacity and the interconnection of Yukon’s two electrical grids:
The Carmacks-Stewart transmission line was energized in June, 2011. Joining together the Whitehorse-Aishihik-Faro grid and the Mayo-Dawson grid, it enables the Yukon Energy Corporation to manage its assets as one integrated system, creating greater efficiencies and allowing for better use of hydro resources.
The Mayo B powerhouse started operating in December 2011, providing up to 10 megawatts of hydro-generated electricity to the Yukon grid without the need for a new dam. The project will offset greenhouse gas emissions by approximately 25,000 tonnes a year.

9
In addition to the Green Energy Legacy Project, Yukon Energy added a third turbine to the Aishihik hydro facility which helps use water more efficiently and displaces diesel during times of peak electrical demand. The Aishihik third turbine was in operation by the end of 2011, adding seven megawatts of hydroelectricity to Yukon Energy’s system. The turbine displaces approximately 3,800 tonnes of GHG emissions annually.
The federal government provided funding for both projects.
Data quality
National and territorial GHG emissions data are compiled and published annually by Environment Canada. Environment Canada notes that interpretation of the data must consider the possible presence of estimation, calculation or input errors. The 2010 per capita GHG emissions for Yukon were calculated based on a population of 34,600.

10
1.2 Changing Climate
What is the issue?
The annual mean temperature in Yukon has warmed by approximately 0.35° C per decade in recent decades. Increased winter precipitation and increased variability in precipitation patterns year-round is also expected in Yukon. Essential steps in adapting to climate change include understanding current and future climate change data, as well as what impact this will have on key aspects of our environment.
What are the indicators?
Long term trend in temperature variation (Figure 1.2.1).
Amount of precipitation in the winter.
Number of extreme weather events, e.g. winter storms, heavy rainfall observed.
Figure 1.2.1 Annual Canadian temperature departures and trend, 1948-2011
Source: Environment Canada, Climate Trends and Variations Bulletin, 2012.
Note: The solid line shows the temperature difference (positive or negative) from the long-term average annual temperatures (dashed line). Positive temperatures are warmer than normal and negative temperatures are colder than normal.

11
What is happening and why is it happening?
There is considerable year-to-year variation in average temperature but the long term trend in Canada is a rising average annual temperature.
Yukon’s average temperature rose approximately 2.2º C since 1948 while Canada’s average temperature rose 1.5º C (Figure 1.2.1). This trend toward higher year-round temperatures is expected to continue in Yukon.
Severe storm events are becoming more frequent in Yukon and that trend is expected to continue in the future. The summer of 2011 was the wettest Yukon summer since 1948, 40% wetter than average.
The climate of Yukon Territory has fluctuated considerably over the last century with increasing temperatures and precipitation resulting in permafrost degradation.
Annual precipitation trends are not consistent. Winter precipitation has generally increased in northern regions and decreased in southern regions of Yukon. Summer precipitation has generally increased slightly throughout, with greater increases in southeast and central Yukon.
Snowmelt has started earlier in Yukon over recent decades, particularly in mountain streams. This contributes to a decrease in the period of snow-cover and bringing an earlier peak flow to most Yukon River basins. In 2010, a new record was set for shortness of spring snow-cover duration.
In the last three decades, annual peak stream-flows have decreased within regions of significant permafrost, while winter low flows have increased. Also, there is an apparent trend of increasing peak flows and water levels within Yukon’s glacial regime.
Ice break-up timing on major rivers has advanced by one week over the last century, while break-up severity has generally increased.
Why is it significant?
The most recent Arctic Climate Impact Assessment (2004) projected that the rate and magnitude of future temperature change will be greatest in the high latitude regions of the northern hemisphere, including Yukon.
With winters warming more than summers and winter warming being greater farther north, summers will warm more in the south and central Yukon than in the north due to the moderating effect of the Beaufort Sea.
Precipitation patterns will continue to become more variable with greater uncertainty in frequency and amount received during a precipitation event. While there will be little change in average summer precipitation levels, climate change projections indicate that the frequency of heavy summer rainfall events for Yukon is likely to increase.

12
Decreased periods of snow-cover and earlier peak flows in Yukon River basins will have impacts on water quantities and quality as well as on Yukon fish and wildlife.
Yukon residents should use research, innovation, and collaboration to understand and adapt to the impacts of a changing climate.
Taking action
Yukon government is implementing the Climate Change Action Plan and the Energy Strategy for Yukon which each set out specific actions and initiatives:
In 2009, Yukon government created the Climate Change Secretariat to provide government-wide leadership and coordination of action on climate change including projects detailed within ClimateChange Action Plan.
In 2009, the Council of Yukon First Nations, Yukon College, and Yukon government, partnered to establish a Yukon Research Centre at Yukon College. The research centre supports Yukon-based research on climate change adaptation as well as the development of cold climate technologies to address the needs of northerners and their communities. Examples of projects include: Community climate change adaptation project, Climate change information and mainstreaming program, Landscape hazards: geoscience mapping for climate change adaptation planning, Yukon/Stikne regional science fair, Biodiversity assessment and monitoring research, Biochar project, Plastovac: removing plastics from compost, Whitepass weather data, Permafrost bioengineering project, and Electric Car Conversion Course.
From 2008-2011, the federal department of Aboriginal Affairs and Northern Development provided Yukon government with $2.1 million for adaptation projects dealing with water resources, building infrastructure, forests, and climate change scenario development. The department provided additional funding in May 2012 to support nine adaptation projects in Yukon over four years including: Documenting ecosystem changes; flood risk mapping; and the impact of thawing permafrost on Yukon highways, agriculture, and water resources.
Through the Pan-Territorial Adaptation Strategy, the Governments of Yukon, NorthwestTerritories and Nunavut are working together on climate change with a focus on practical adaptation measures. This partnership will host a permafrost adaptation workshop in 2013 to bring together adaptation professionals and researchers to examine and address the impacts of thawing permafrost on infrastructure.
The Climate Change Secretariat is working in partnership with the Northern Climate ExChange to incorporate climate change considerations into government decision-making. The Climate Change Information and Mainstreaming Program offers climate change courses and project support. Since the program’s inception in 2010, more than 100 government employees across eight departments have participated in the “Decision Making for Climate Change” course and five government

13
departments or non-government organizations have taken advantage of climate change project support.
The Climate Change Secretariat has hosted five annual youth engagement forums for taking action on climate change. These forums continue to provide Yukon youth an opportunity to learn about climate change and to get involved in climate change action in the territory.
Data Quality
National and territorial greenhouse gas emission data are compiled and published annually by Environment Canada. Environment Canada notes that interpretation of the data must consider the possible presence of estimation, calculation or input errors.

14
2. Air 2.1 Air Quality
What is the issue?
Poor air quality can harm human and environmental health. Children, the elderly, and people with respiratory problems are particularly at risk. Air quality is affected by natural events, such as wildfires, and pollution from wood stoves, emissions of fossil fuel burning, and industrial activities.
What are the indicators?
To monitor air quality, scientists measure fine particulate matter, ground level ozone, nitrogen oxides and carbon monoxide. Fine Particulate Matter (PM2.5), comprised of airborne pollutants in the form of smoke liquid droplets or dust that are 2.5 microns or less in diameter, is a toxic substance that can be inhaled deeply into the lungs. The concentration of this pollutant in the atmosphere is one indicator of air quality. Specific indicators monitored through a single surveillance station in Whitehorse are:
Average ambient annual PM2.5 levels in the City of Whitehorse (Table 2.1.1).
Number of days per year that PM2.5 levels (24-hour average) exceeds Yukon’s Ambient Air Quality Standard of 30 micrograms/m3 (standard adopted from the Canada Wide Standard for Particulate Matter) (Table 2.1.1).
Average monthly PM2.5 levels compared with average values for the City of Whitehorse (Figure 2.1.1).
Average monthly PM2.5 levels compared with other relevant jurisdictions (Figure 2.1.2).

15
Table 2.1.1 Average ambient annual particulate matter (PM2.5) and number of days that particulate matter levels exceeded the national standard (30 μg/m3) in Whitehorse, 2001-2011
Year Mean Annual PM2.5 (μg/m3)*Number days PM2.5 (μg/m3)
Whitehorse Exceeded National Standard
2001 Began monitoring in August Began monitoring in August
2002 2.4 0
2003 2.4 0
2004 4.8 12
2005 2.8 4
2006 Not Available Not Available
2007 1.8 0
2008 1.9 0
2009 Not Available 15
2010 6.1 0
2011 3.1 1
Source: Whitehorse National Air Pollution Surveillance Station data, Standards and Approvals, Environmental Programs Branch, Environment Yukon.
*Canadian annual average for the same period was 7.2 μg/m3
“Not Available” information is due to technical issues during that period (2006 & 2009)

16
Figure 2.1.1 Monthly averages of particulate matter (PM2.5) in Whitehorse for 2010, 2011 and an average from 2001-2009
0
1
2
3
4
5
6
7
8
9
10
JAN FEB MAR APR MAY JUN JUL AUG SEP OCT NOV DEC
PM2.5(g/m
3 )
Whitehorse average (2001 2009)
Whitehorse 2010
Whitehorse 2011
Source: Whitehorse National Air Pollution Surveillance Station data, Standards and Approvals, Environmental Programs Branch, Environment Yukon.

17
Figure 2.1.2 Monthly averages of particulate matter (PM2.5) in Whitehorse and Smithers, British Columbia
Sources: Environment Canada National Air Pollution Surveillance Program Network; National Air Pollution Surveillance Station data from Whitehorse Standards and Approvals, Environmental Programs Branch, Environment Yukon; British Columbia Environment.
Annual PM2.5 averages for 2010 and 2011 were 6.11 and 3.06 in Whitehorse and 5.72 and 5.32 in Smithers; respectively.
What is happening?
The 2011 average ambient annual PM2.5 concentration for Whitehorse was lower than in 2010. 2010 has proven to be the highest than all previous years since monitoring began; however the concentration remained below the Canadian annual average of 7.2 μg/m3 (Table 2.1.1).
In 2010, Whitehorse did not exceed Yukon’s Ambient Air Quality Standard of 30 μg/m3. In 2011, the Ambient Air Quality Standard was exceeded on one day (Table 2.1.1).
Monthly PM2.5 levels in Whitehorse for 2010 were consistently higher than the average from 2002-2009. Monthly PM2.5 levels in 2011 were higher than the 2002-2009 average in the months of February, March, May and November (Figure 2.1.1).
Monthly PM2.5 levels for Whitehorse in 2010 were higher in most months than those reported in Smithers. Monthly PM2.5 levels for Whitehorse in 2011 were lower than those reported in Smithers (Figure 2.1.2).

18
Why is it happening?
Elevated PM2.5 levels often occur as a result of wood smoke from woodstoves or wildfires, from backyard burning and barbeques, from improperly burned fuels for heating or vehicles, and from road dust, particularly in the spring. Elevated PM2.5 levels may also occur as a result of natural causes such as pollen events, dust storms, or volcanic eruptions.
Higher PM2.5 levels in Whitehorse during the 2010 summer season as compared to the 2001-2009 average is possibly due to wildfires. The 2010 wildfire season saw 110 fires burning a 1461 km2 area. The summer of 2011 had a much lower number of fires, where only 401 km2 was burned.
Why is it significant?
Fine particulate matter may pose serious risks to human health when inhaled, especially among the elderly, children and people with chronic respiratory illnesses. Health impacts include chronic bronchitis, asthma, and premature death. Reduced visibility as a result of high levels of fine particulate matter may affect aviation, driving and daily life.
Taking action
The National Air Pollution Surveillance station in Whitehorse continues to record ambient air quality data for particulate matter, ozone, nitrous oxide, and carbon monoxide.
The Clear the Air campaign continued in 2010 and 2011. It is a joint educational program between the City of Whitehorse and Environment Yukon to discourage vehicle idling and promote good woodstove burning practices. The program’s goal is to improve air quality.
The Yukon government’s Good Energy program offers rebates for EPA approved woodstoves and CSA approved pellet stoves. These stoves are the most efficient and emit the lowest particulate amounts.
In 2011, the practice of burning domestic waste ceased at 20 Yukon government community solid waste facilities.
Data quality
National Air Pollution Surveillance data are quality controlled, assured and standardized by Environment Canada and Environment Yukon for inclusion into the Canada-wide air quality database. The program is managed by a cooperative agreement between Environment Canada and Environment Yukon. Data from all of 2006 and January and February of 2009 were not available due to technical problems and therefore did not contribute to annual averaging. The air quality data for the Whitehorse area may not be representative of air quality throughout Yukon.

19
2.2 Interesting Story: Landfill burning ends across Yukon
Yukon has 29 public solid waste disposal facilities; 21 in unincorporated communities managed by Yukon government and 8 facilities in the incorporated municipalities managed by the municipality (Whitehorse, Haines Junction, Dawson, Teslin, Watson Lake, Mayo, Faro, and Carmacks). This year marked the end of a longstanding practice at Yukon landfills: all but one of the Yukon government’s public solid waste disposal facilities and all but one of the municipal stopped open burning in 2012. Now, most regional facilities solely bury waste, while some have been turned into transfer stations. The Watson Lake garbage dump continues to upgrade equipment in order to end burning within the next year.
In 2008, all public landfills were reviewed under the Yukon Environmental and Socio-Economic Assessment Act. The YESAA review recommended that open burning stop at all facilities. Environment Yukon accepted this recommendation and proceeded to implement it through solid waste permitting.
In 2009, during a series of consultations about the future of solid waste management in Yukon, the public emphasized the need to stop the practice of open burning garbage.
The Solid Waste Action Plan was developed in 2010 and set out goals for modernizing waste management facilities and introducing innovative, long-term solutions consistent with sustainable energy and land use objectives. One of the plan’s outcomes was to phase out and eliminate open burning by 2012.
20
3. Water 3.1 Water Quality Index
What is the issue?
Freshwater of sufficient quality and quantity is essential for aquatic life and to support human uses for industry, recreation, agriculture and drinking. Yukon’s water bodies and watersheds are monitored to determine ambient water quality.
What is the indicator?
The Canadian Water Quality Index (Table 3.1.1).
The Water Quality Index (the Index) comprises important information about the state of water quality and identifies emerging trends. Data about the quality of a water body is reduced to a number scale that corresponds to a rating such as poor, good or excellent. The Index allows evaluation of the suitability of the streams to support aquatic life (Tables 3.1.2 and 3.1.3).
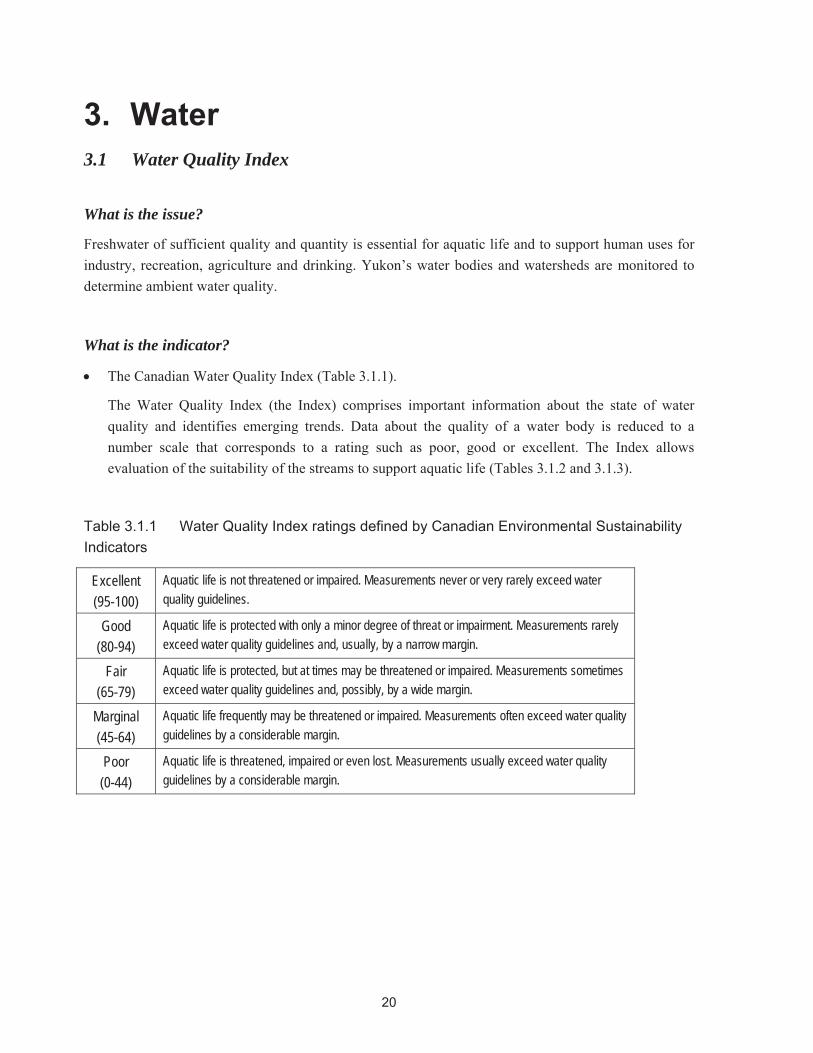
Table 3.1.1 Water Quality Index ratings defined by Canadian Environmental Sustainability Indicators
Excellent (95-100)
Aquatic life is not threatened or impaired. Measurements never or very rarely exceed water quality guidelines.
Good (80-94)
Aquatic life is protected with only a minor degree of threat or impairment. Measurements rarely exceed water quality guidelines and, usually, by a narrow margin.
Fair(65-79)
Aquatic life is protected, but at times may be threatened or impaired. Measurements sometimes exceed water quality guidelines and, possibly, by a wide margin.
Marginal(45-64)
Aquatic life frequently may be threatened or impaired. Measurements often exceed water quality guidelines by a considerable margin.
Poor (0-44)
Aquatic life is threatened, impaired or even lost. Measurements usually exceed water quality guidelines by a considerable margin.

21
Table 3.1.2 Number of samples collected at Yukon monitoring stations, 2008-2010 River Station Ecoregion 2008 2009 2010 Alsek River Above Bates River Yukon-Stikine Highlands 6 6 6 Dezadeash River At Haines Junction Ruby Range 27 23 24 Klondike River Above Bonanza Klondike Plateau 7 8 8 Liard River At Upper Crossing Liard Basin 15 17 19 Old Crow River At mouth Old Crow Flats 6 -- -- Porcupine River Above Old Crow River Old Crow Flats 6 -- -- Rose Creek Above Anvil Creek Yukon Plateau – Central 20 23 25 S. McQuesten R Below Flat Creek Yukon Plateau – North 8 11 9 Yukon River Above Takhini River Yukon Southern Lakes 12 10 10 Yukon River At Marsh Lake Dam Yukon Southern Lakes 19 10 10
Total samples 126 108 111
Table 3.1.3 Water Quality Index rolling average ratings for Yukon monitoring stations, 2002-2010*
Location 2002-2004
2003-2005
2004-2006
2005-2007
2006-2008
2007-2009
2008-2010
Current Rating
Dezadeash R. at Haines Junction 83.8 84.2 84.2 89.5 n/a 89.5 n/a n/a Klondike R. above Bonanza Creek n/a n/a n/a 66.8 66.6 67.4 74.2 Fair Liard River at Upper Crossing 93.6 93.6 93.6 93.6 87.2 93.6 87.2 Good S McQuesten R. below Flat Cr n/a n/a n/a 64.4 64.3 64.0 70 Fair Yukon River at Marsh Lake Dam n/a n/a n/a 100 n/a 100 n/a n/a Yukon River above Takhini River n/a n/a n/a 100 100 100 93.6 Good * At the time of publication, only sites reported at the national level had scores calculated. Sources: Environment Canada and Environment Yukon. Note: (n/a) Not available.
What is happening? In 2010, the most recent year for which data have been evaluated, a total of 111 samples were collected from eight monitoring stations in Yukon operated by Environment Canada and Environment Yukon (Table 3.1.2).
The Water Quality Index ratings for the Liard, Klondike, South McQuesten and the Yukon River above Takhini River are stable and ranged from fair to good (Table 3.1.3). Three-year rolling average scoring provides additional confidence in the ratings.

22
Why is it happening?
The water quality index rating for Yukon River above Takhini River dropped from ‘excellent’ to ‘good’ for the first time since monitoring began in 2005. This site is located below the city of Whitehorse and is influenced by urbanization which includes an annual discharge of treated sewage from the Livingston Trail Lagoon.
The rating for the Klondike River above Bonanza Creek has remained consistent since 2005. The Klondike River is influenced by historic gold mining, rural development, agriculture, placer mining and recreation. Concentrations of metals exceed aquatic life guidelines during the May-June period and coincide with high flow and turbidity, while phosphorus is occasionally exceeded during the open-water season.
The water quality index rating for South McQuesten improved from ‘marginal’ to ‘fair.’ The South McQuesten River is a snowmelt-fed system in a naturally mineralized area and is influenced by historic mining. Concentrations of metals exceeded guidelines in the May to September period. ERDC, a subsidiary of Alexco Resource Corporation, has managed the care and maintenance of the historic liabilities at the Keno Hill mine with funding from the federal government and has made substantial improvements in reducing metal loads from the mine site to the South McQuesten River. Plans for further reduction of metal loads will be part of the historic liabilities closure plan. There has been renewed mining and milling activities near Keno City since 2010.
The Liard River is stable and rated as ‘good’, as one would expect in a natural system with little human impact. Increases in zinc concentrations are associated with spring melt and are naturally occurring. Water quality varies throughout the year. Suspended solids and turbidity are higher in spring when increased stream flow from melting snow accelerates bank erosion. Metals can exceed the site-specific objectives during high flow. However, metals primarily associated with suspended solids are not available for uptake by fish and other aquatic organisms and are not a concern. The three-year index score period at each station may have natural variations or human-caused impacts on water quality that can result in changes to the index score.
Why is it significant?
Concentrations of metals that exceed Canadian Water Quality Guidelines may have negative (toxic) effects on aquatic organisms and some metals can bioaccumulate in invertebrates, fish and eventually impact human health. Excessive nutrients in water can cause aesthetic and nuisance issues in recreational waters.

23
Taking action
A three-year water quality index scoring is now possible for Rose Creek, which is located downstream of the abandoned lead-zinc mine in Faro that is undergoing remediation. In 2013, water quality objectives for the site will be established so that scores can be calculated.
Since 2010, the Klondike River monitoring station was augmented by real-time sensor equipment that transmits several water quality measurements to a display screen set up for public viewing.
Since 2010, a Klondike River display has been in place in the Dawson Visitor Reception Centre. In addition to water quality information, there is weather and hydrologic data (flow, water level), webcam views and other visuals of the site including surface images and underwater video. These displays and accompanying poster serve to raise the profile of water and promote proper management of this valuable resource. Visitor Reception Centre staff report that the display is quite popular with visitors.
Data quality
Water quality samples were obtained by locally trained personnel using established protocols for sample collection and transport. Samples were analyzed in Environment Canada laboratories. The data was quality controlled, assured and standardized by Environment Canada and Environment Yukon following the program for the Canadian Environmental Sustainability Indicators. Chronological Index reporting was led by Statistics Canada.
3.2 Interesting Story: New Yukon water website
In 2011, the Water Resources Branch launched a public access website: yukonwater.ca. This online resource provides a variety of information about water resources in Yukon with topics including the hydrological cycle, statistics on water use, water management, and the legislation that guides interactions with water and water monitoring. In addition to a wealth of detailed information, yukonwater.ca features an online catalogue of water data collection sites in the territory. This online catalogue is the first centralized water database in Yukon.
Data catalogued on yukonwater.ca includes a variety of environmental parameters that measure water quality, water flow, historic climate (e.g. snowfall and rainfall) as well as aquatic health (including aquatic organisms). Twenty-seven different data collection networks are included in the water data catalogue and 13 have been loaded as of December 2012. This website is being used as a platform to share new water-related resources generated in the territory.

24
In 2012, a one-year review of the website was conducted and it highlighted the utility of the website and determined areas for improvement. Recommendations for how to improve the website will be incorporated into the Water Resources Branch work plan in 2013.
3.3 Interesting Story: White Gold Cumulative Effects Study
In recent years the White Gold area has seen record-setting quartz exploration activity. As part of a cumulative effects study in this area, two new water quality stations were established. In 2012, both water quality and water quantity instrumentation were installed on Thistle Creek to collect information during the open water season. In 2013, the instrumentation will be enhanced to allow for remote access of the near real-time data.
Also in 2013, instrumentation will be installed at Scroggie Creek and a synoptic water quality survey of multiple streams within the area will be conducted. The purpose of this work is to determine pre-quartz development ‘baseline’ conditions. The pre-quartz distinction is made as placer mining has occurred in the area for decades.
White Gold area water monitoring installations. Bob Truelson, Water Resources Branch, Summer 2012

25
4. Land 4.1 Land Use and Resource Management Planning
What is the issue?
The sustainability of resource use and development depends on effective planning for future human activities and environmental protection.
What are the indicators?
The status of management plans related to land use, resources and protected areas (Figure 4.1.1).
These plans generally include an inventory of resources and interests, and strategies to meet a set of management objectives. For this report, 59 plans were tallied, and were divided into three status categories: current (37 plans were finalized and in use), underway (14 plans were in development), or not started/lapsed (8 plans were out of date or awaiting a new planning process) (Figure 4.1.1). The types of plans include regional land use plans, official community plans, local area plans, forest resource management plans, protected area management plans, and other areas (includes Canadian Heritage Rivers).
Figure 4.1.1 Status of land use and resource management plans in Yukon in 2012
0
5
10
15
20
25
30
Not Started/Lapsed
Underway
Current
78 9
6
25
4
Num
bero
fPlans
Source: Updates from resource planners.

26
What is happening, and why is it happening?
Regional Land Use Plans (Table 4.1.1)
The regional planning process is set out in Chapter 11 of First Nations Final Agreements.
In 2009, the Vuntut Gwitchin First Nation and Yukon government approved the North Yukon Regional Plan. The plan provides a sustainable development framework for land management and addressed key issues of oil and gas development in Porcupine caribou habitat and development impacts in wetlands. The plan also recommends protected area status for the Whitefish Wetlands and the Summit Lake-Bell River area. The plan identifies important traditional use and wildlife areas that were mapped from local and traditional knowledge.
In 2011, the Peel Watershed Planning Commission submitted for consideration its Final Recommended Peel Watershed Regional Land Use Plan to the Na-Cho Nyak Dun, Vuntut Gwitchin, Tr’ondëk Hwëch’in, Gwich’in Tribal Council, and Yukon governments. In 2012, Yukon government began its public consultation on the plan and potential modifications.
In 2010, the Dawson Regional Planning Commission was formed. Planning is ongoing through 2013.
The Teslin Regional Planning Commission was suspended in 2004 at the conclusion of their 3-year mandate without the completion of a plan. Regions identified for potential future planning include Kluane, Whitehorse and Northern Tutchone.

27
Figure 4.1.2 Yukon planning regions
Source: Yukon Land Use Planning Council
Forest Resources Management Plans (Table 4.1.1).
In 2008, the Yukon Forest Resources Act was passed and outlines the planning process and purpose and scope of these plans. Plans have been completed for the Teslin Tlingit and Champagne and Aishihik traditional territories under Chapter 17 of First Nations Final Agreements.
In 2012, Yukon government and the Tr’ondëk Hwëch’in received a recommended Forest Resources Management Plan from the Dawson Forest Resources Planning team to be considered for approval. Also, terms of reference and planning committees were established to produce a forest management plan in the Whitehorse/Southern Lakes planning area. This includes participation from the Carcross/Tagish First Nation, the Kwanlin Dün First Nation and the Ta'an Kwäch'än Council.
28
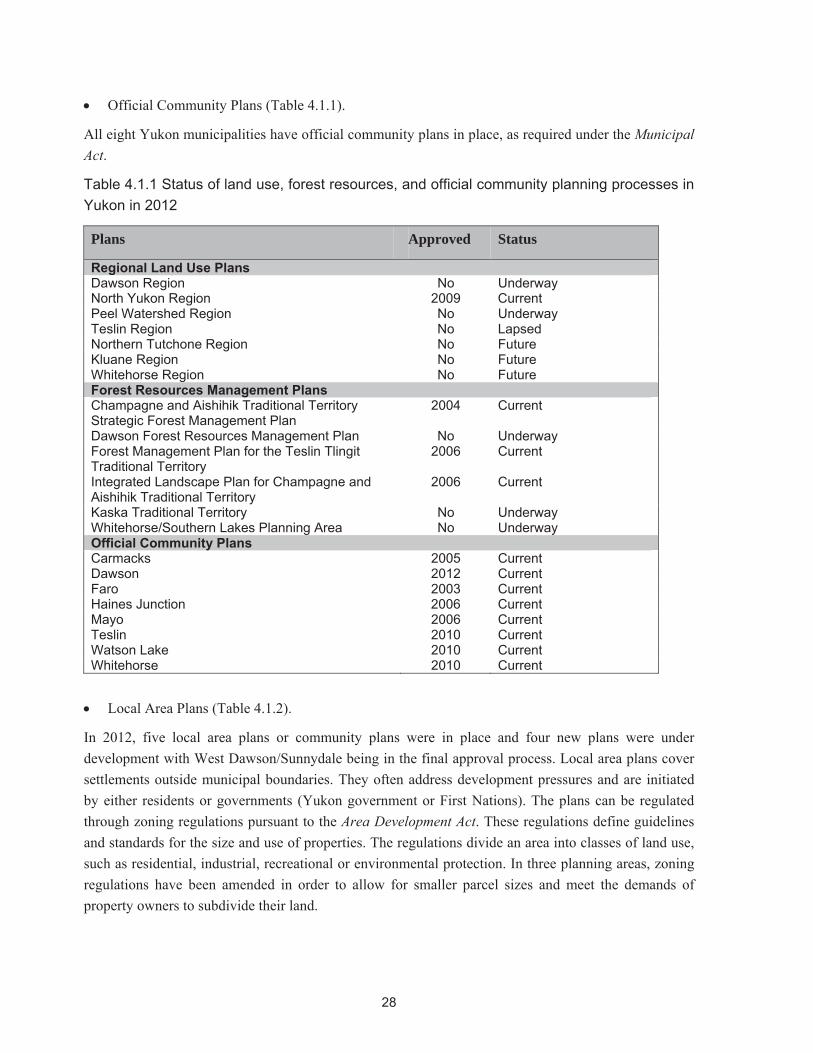
Official Community Plans (Table 4.1.1).
All eight Yukon municipalities have official community plans in place, as required under the Municipal Act.
Table 4.1.1 Status of land use, forest resources, and official community planning processes in Yukon in 2012
Plans Approved Status
Regional Land Use PlansDawson Region No Underway North Yukon Region 2009 Current Peel Watershed Region No Underway Teslin Region No Lapsed Northern Tutchone Region No Future Kluane Region No Future Whitehorse Region No Future Forest Resources Management PlansChampagne and Aishihik Traditional Territory Strategic Forest Management Plan
2004 Current
Dawson Forest Resources Management Plan No Underway Forest Management Plan for the Teslin Tlingit Traditional Territory
2006 Current
Integrated Landscape Plan for Champagne and Aishihik Traditional Territory
2006 Current
Kaska Traditional Territory No Underway Whitehorse/Southern Lakes Planning Area No Underway Official Community PlansCarmacks 2005 Current Dawson 2012 Current Faro 2003 Current Haines Junction 2006 Current Mayo 2006 Current Teslin 2010 Current Watson Lake 2010 Current Whitehorse 2010 Current
Local Area Plans (Table 4.1.2).
In 2012, five local area plans or community plans were in place and four new plans were under development with West Dawson/Sunnydale being in the final approval process. Local area plans cover settlements outside municipal boundaries. They often address development pressures and are initiated by either residents or governments (Yukon government or First Nations). The plans can be regulated through zoning regulations pursuant to the Area Development Act. These regulations define guidelines and standards for the size and use of properties. The regulations divide an area into classes of land use, such as residential, industrial, recreational or environmental protection. In three planning areas, zoning regulations have been amended in order to allow for smaller parcel sizes and meet the demands of property owners to subdivide their land.

29
Table 4.1.2 Status of local area plans and zoning regulations in 2012
Development Area Local Area Plan Zoning Regulation
Bear Creek No 1983 Carcross Underway 1976 Deep Creek 2001 2011 Dempster Highway No 1979 Destruction Bay No 1980 Fox Lake Underway No Golden Horn 2004 2011 Grizzly Valley No 1996 Hamlet of Ibex Valley 2001 2005 Hamlet of Mount Lorne 1995 2006 Hot Springs Road 2002 2005 Jackfish Bay No 2000 Klondike Valley No 1992 Little Teslin Lake Recreation No 2010 M’Clintock Place Part of Marsh Lake Plan 1996 Marsh Lake Underway Restricted to M’Clintock Pl Mayo Road No 2005 Mendenhall No 1990 Pine Lake No 1990 Ross River No 1978 Watsíx Eetí Part of Golden Horn Plan 2011 West Dawson/Sunnydale Underway 1990 Whitehorse Periphery No 1978
Note: Local area plans are requested to be established by the community and are not required, so are not calculated into the “not started” category.
Protected area plans (Table 4.1.3 and Figure 4.1.3).
The majority of protected areas are first recognized as Special Management Areas under Chapter 10 of First Nations Final Agreements and then later designated. Protected areas have varying levels of legal protection and include national parks and wildlife areas as well as territorial parks and habitat protection areas.
Management plans are current for the three national parks (Ivvavik, Kluane, and Vuntut) and one national wildlife area (Nisutlin River Delta).
Four territorial park management plans are current, including Herschel Island-Qikiqtaruk, Ni’iinlii Njik (Fishing Branch) Ecological Reserve, Ni’iinlii Njik (Fishing Branch) Wilderness Preserve and Tombstone. Tombstone Park Management Plan will undergo a public review during the winter of 2013. Interim management guidelines are in place for Coal River Springs. The planning process for Asi Keyi

30
has not started. The planning processes for Kusawa Park and Agay Mene Park are scheduled to resume early in in 2013. Summit Lake-Bell River was identified as a future protected area in 2009 through the North Yukon Land Use Plan. A boundary is yet to be confirmed.
In 2012, seven habitat protection area management plans were in place, three more were underway and two have not yet been initiated (Figure 4.1.3). Whitefish Wetlands was identified as a future protected area in 2009 through the North Yukon Land Use Plan, and both Vuntut Gwitchin and Environment Yukon agree that Habitat Protection Area designation and planning is appropriate.
Other Areas (Table 4.1.1)
Canadian Heritage River designation recognizes rivers or river segments for their natural heritage and recreational values, but does not provide protection. Yukon has four Canadian heritage rivers, all with current management plans or strategies (Alsek – Kluane National Park; Bonnet Plume, Thirty Mile Section of the Yukon River and Upper Tatshenshini).
The Kluane Wildlife Sanctuary provides a refuge for wildlife from licensed hunters, with only two permits allowed in most years.
Why is it significant?
The development of long-term management plans through public processes is a proactive way for government to recognize and balance competing views about how lands and natural resources should be used. Regional planning is intended to reflect the traditional knowledge, experience and recommendations of residents as well as incorporate science and broad socio-economic and environmental interests.

31
Table 4.1.3 Status of parks and other protected areas in Yukon1
Area (km2) and % of Yukon2
Map #
Area Name Designated ManagementPlan Status
No Withdrawal
Interim Withdrawal
Permanent Withdrawal
Territorial Park 1 Agay Mene No Underway 725 2 Asi Keyi No Not started 2,984 3 Coal River Springs 1991 2009 16 4 Herschel Island - Qikiqtaruk 1987 2006 113 5 Kusawa No Underway 3,082 6 Ni’iinlii Njik (Fishing Branch)
Ecological Reserve 2003 2010 169
7 Ni’iinlii Njik (Fishing Branch) Wilderness Preserve
2003 2010 5,203
8 Tombstone 2004 2009 2,050 Subtotal 725 (0.1%) 13,617
(2.8%) Habitat Protection Area
9 Ddhaw Ghro No Underway 1,609 10 Devil’s Elbow & Big Island 2011 2011 83 11 Horseshoe Slough 2011 2008 77 12 Lewes Marsh No Not started 20 13 útsäw Wetland 2006 2006 32 14 Nordenskiold3 2010 2010 78 15 Ni’iinlii Njik (Fishing Branch) 2004 2010 978 16 Old Crow Flats (Yukon land) 2007 2006 3238 545 17 Pickhandle Lakes No Underway 51 18 Ta’Tla Mun Special Management
Area No 2005 33
19 Tagish River No Not started 4 Subtotal 4,300
(0.9%) 1,879
(0.4%) 14,186(2.9%)
National Park and Wildlife Area 20 Ivvavik 1984 2007 9,704 21 Kluane 1972 2010 22,155 22 Vuntut 1995 2010 4,350 23 Nisutlin Wildlife Area 2004 55 Subtotal 36,264
(7.5%) First Nation Settlement Land
7 Ni’iinlii Njik (Fishing Branch)4 141 16 Old Crow Flats4 3,947 Subtotal 4,088
(0.8%) Proposed Protected Area
24 Summit Lake-Bell River No Not started 1,525 25 Whitefish Wetlands No Underway 468 Subtotal 1,993
(0.4%)
Grand Total 4,300(0.9%)
3,872(0.8%)
54,538(11.3%)
Source: Environment Yukon 1Records are based upon Yukon Department of Environment Environmentally Significant Area (ESA) and Canadian Conservation Area Tracking System (CARTS) databases 2013 2Areas are calculated from the best available digital polygons compiled by Environment Yukon. Yukon = 482,443 km2
3 Nordenskiold HPA is 100% Little Salmon/Carmacks First Nation category B Settlement Land 4 Vuntut Gwitchin First Nation category A Settlement Land

32
Figure 4.1.3 Parks and other protected areas in Yukon, including those awaiting designation
Source: Environment Yukon. Note that Summit Lake-Bell River boundary is preliminary

33
4.2 Interesting Story: New building on Herschel Island It Takes a Village to Raise a House on Herschel Island
In summer 2012 Yukon Parks Branch undertook a challenging and unique construction project: building new living quarters for park rangers at Herschel Island-Qikiqtaruk Territorial Park. Designing and building a house involves a considerable amount of work under normal circumstances. Imagine meeting modern building codes as well as historical and archaeological requirements for a construction project on a remote island in the Beaufort Sea!
In April 2012, a DC-3 made three flights from Inuvik to Herschel Island to position lumber and building materials. Due to its remote location, aircraft charter costs accounted for over half of the total budget. A work crew of three arrived on July 18 and, with the help of rangers, researchers and others, construction was completed by August 9.
The 20’ x 24’ building has a small footprint and was carefully designed to meet historical design considerations. The new structure is sited on a dry area within the existing cluster of buildings at Pauline Cove, and it was built on 2-foot bracing to allow for relocation.
To minimize disturbance, planners also factored in Herschel Island’s wildlife and human visitors. In addition to being a staging area for migratory birds, the immediate area around the buildings is frequently used by ducks for nesting. Polar bears also frequent the island. In summertime, cruise ships visit Herschel Island. Parks Branch worked with the Aklavik Hunters and Trappers Committee and with available data to schedule construction around all of the various activities.
The project involved many partners including Yukon Heritage Branch, Herschel Island-Qikiqtaruk Territorial Park rangers, Yukon Parks and Environment Yukon Information Management & Technology Branch.
Construction crew at Herschel Island, summer 2012.

34
4.3 Solid Waste Management
What is the issue?
Solid waste disposal in landfills can pose environmental and health risks as well as land use planning challenges. Waste is costly to manage whether it is sent to landfills, diverted through recycling and composting, or shipped outside the territory for treatment. We reduce our reliance on landfills by generating less waste and by having more recycling and composting.
What are the indicators?
Total annual tonnage of waste being handled at the City of Whitehorse Waste Management Facility (Figure 4.3.1).
Whitehorse waste diverted through recycling and composting compared to waste generated (Figure 4.3.2).
Curbside collection of garbage and organics from single family households in Whitehorse between 2000 and 2011 (Figure 4.3.3).

35
Figure 4.3.1 Waste handled at the City of Whitehorse Waste Management Facility, 2000-2011
Source: City of Whitehorse Notes: ICI = Industrial, commercial, and institutional waste. Totals do not include clean fill stock piled for daily cover that can make up 0% to 30% of the waste stream in any given year (not included as it is used as cover material and is essential in the operation of the landfill).
36
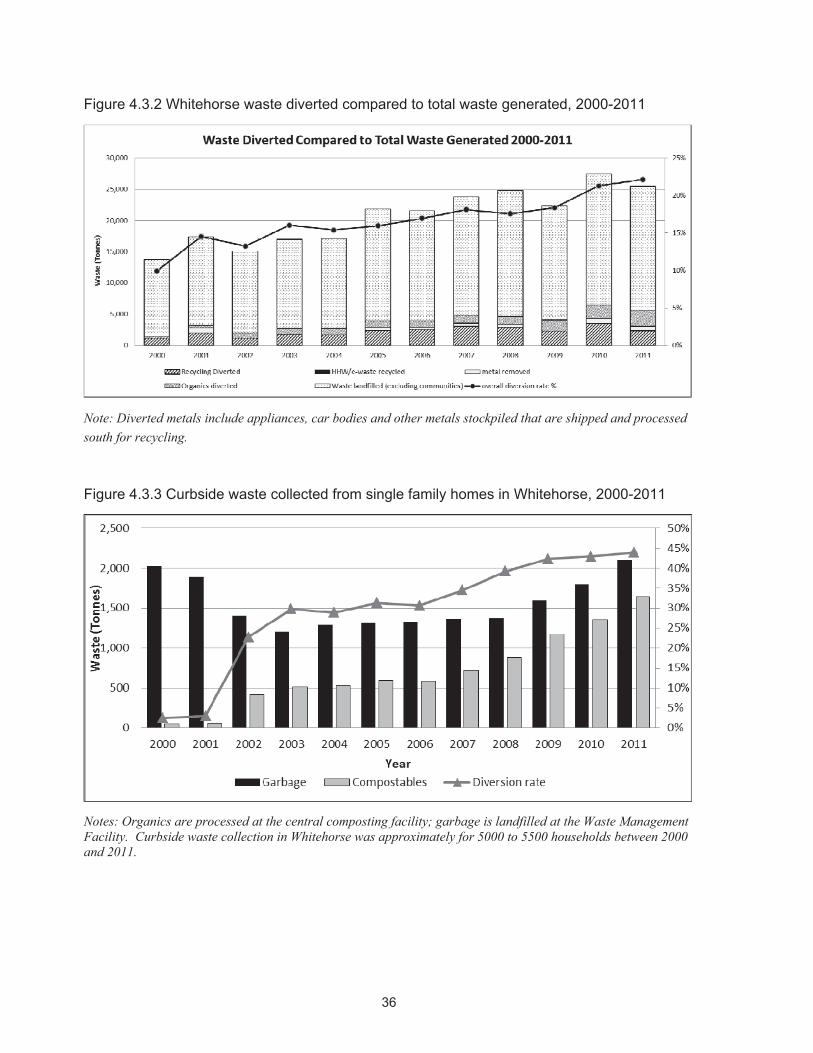
Figure 4.3.2 Whitehorse waste diverted compared to total waste generated, 2000-2011
Note: Diverted metals include appliances, car bodies and other metals stockpiled that are shipped and processed south for recycling.
Figure 4.3.3 Curbside waste collected from single family homes in Whitehorse, 2000-2011
Notes: Organics are processed at the central composting facility; garbage is landfilled at the Waste Management Facility. Curbside waste collection in Whitehorse was approximately for 5000 to 5500 households between 2000 and 2011.
37
What is happening?Between 2000 and 2011 there has been a 60% increase in waste being landfilled.
The overall diversion rate in Whitehorse has increased annually from 10% in 2000 to 22% in 2011. This does not include glass, refillable beer bottles, tires, and hazardous waste. Increases in diversion are largely due to the residential compost collection program offered by the City. Between 2000 and 2011 recycling rates have remained at 10-12% of diversion, while organics diversion has increased from 2% to 10% in that same time.
The amount of organic material composted at the Whitehorse composting facility has increased annually. Families with curbside compost pick up diverted 44% of their household waste in 2012. More waste may actually be diverted from households since this figure does not include diverted waste that is not measured such as recycling, backyard/worm composting, or the use of garburators.
Based on a Morrison Hershfield Landfill Cost Assessment Report (January 2013), the capacity of the City of Whitehorse’s landfill has been reduced from 78 years to 41 years. This has a significant impact on landfill closure costs for the City of Whitehorse.
Why is it happening and why is it significant?
Total waste being landfilled is affected by Whitehorse’s rising population and other communities that transport waste into Whitehorse for disposal. Taking population increases into account, between 2000 and 2011 the waste generation in Whitehorse has increased by 36% per person. Increases in development and construction in the Whitehorse area have contributed to significant increases in the amount of construction and demolition waste. The resulting increase in waste generation puts pressure on the life of the landfill and other diversion activities such as recycling, reuse and composting; resulting in higher costs to the user.
Yearly variations in diversion of recycled materials are affected by market demand for recyclable commodities. When markets were low in 2009, no metal was removed from the facility. Recyclables were stockpiled and shipped in 2010 when the market was more favourable.
Waste disposal can negatively affect the quality of land, air and water. Individuals can mitigate these impacts by reducing, reusing, recycling, refusing, and composting their waste as much as possible. Waste diversion through recycling and composting creates employment opportunities; recycling also prolongs resource supplies.
Taking action
In 2009, Yukon government developed a Solid Waste Action Plan to modernize existing solid waste facilities and to work with partners across Yukon to develop a coordinated approach to Yukon solid waste management. Also in 2009, Yukon government released a comprehensive solid waste study that recommends strategies and methods to improve Yukon’s waste management. In 2010, Yukon

38
government established a Solid Waste Advisory Committee to set priorities for solid waste and recycling options. The committee recommended increased waste diversion as part of a zero waste philosophy for Yukon. The committee is also reviewed funding for recycling facilities and increasing
the commodities covered under regulation. Subsequently, private recycling processors in Whitehorse upgraded their recycling facilities in Whitehorse in 2012.
Environment Yukon updated the solid waste permits in 2009 to include effective environmental management and monitoring practices, including the requirement to cease open burning and implementing groundwater monitoring at each facility. By the end of December 2012, the practice of burning domestic waste was ceased in all but one of Yukon
government’s solid waste disposal facilities (see interesting story in section 2.2). In addition, groundwater motoring wells have been installed in these facilities. The removal of metals and installation of hazardous waste containers in Yukon landfills occurred in 2011.
In 2009, the City of Whitehorse established a city-wide organic compost and garbage curbside cart program, which eliminated the need for compostable bags and made waste diversion easier. In 2010, the City of Whitehorse became a regional landfill site for surrounding communities. The community sites became transfer stations with enhanced recycling and diversion opportunities.
The City of Whitehorse developed a composting facility program with new equipment to increase compost quality and throughput. The compost is tested to meet guidelines and is then sold at the waste management facility. The Yukon Agricultural Branch has successfully used the compost in growth trials. This local product reduces the need to transport artificial fertilizers and for local soil harvesting. Keeping organics out of the landfill also reduces landfill leachate toxicity and decreases greenhouse gas emissions.
The City of Whitehorse audited its waste in 2010 to help achieve higher diversion rates. This identified a need for programs to improve diversion of construction, demolition, and ICI (Industrial, Commercial, and Institutional) waste from landfills. As part of this work, and described in the Whitehorse Strategic Sustainability Plan, the City of Whitehorse has established a goal of Zero Waste by 2040. Currently the City of Whitehorse is developing a Solid Waste Action Plan to test the target of reaching 50% waste diversion by 2015. The City of Whitehorse and Yukon government continue to hold household hazardous waste collection events in Whitehorse.
Dumpsters at a typical Yukon community landfill.

39
Data quality
The City of Whitehorse weighs waste at the management facility to ensure valid data is available from the curbside program and waste being landfilled. Interpreting the data can be challenging, as commercial, construction and domestic waste arrived co-mingled. Data regarding waste diversion are incomplete and difficult to correlate to an annual diversion rate, due to stockpiling and shipping irregularities.
These data do not represent what is happening in Yukon communities, other than the weight of material sent to Whitehorse for landfilling. The monitoring of waste diversion at communities is being partially addressed from the communities sending waste to Whitehorse.
40
5. Fish and Wildlife 5.1 Population Trends and Planning Initiatives
What is the issue?
The health of fish and wildlife populations are important components of healthy ecosystems and are important to the well-being of the people who rely on them. Planning processes find long-term and cooperative solutions that ensure healthy fish and wildlife populations.
What are the indicators?
Returns of spawning Chinook salmon in the Canadian portion of the upper Yukon River drainage (Figure 5.1.1).
Status of lake trout fisheries in Yukon (Figure 5.1.2).
Status of caribou herds in Yukon (Figure 5.1.3).
Status of community-based wildlife plans and species plans (Table 5.1.1).
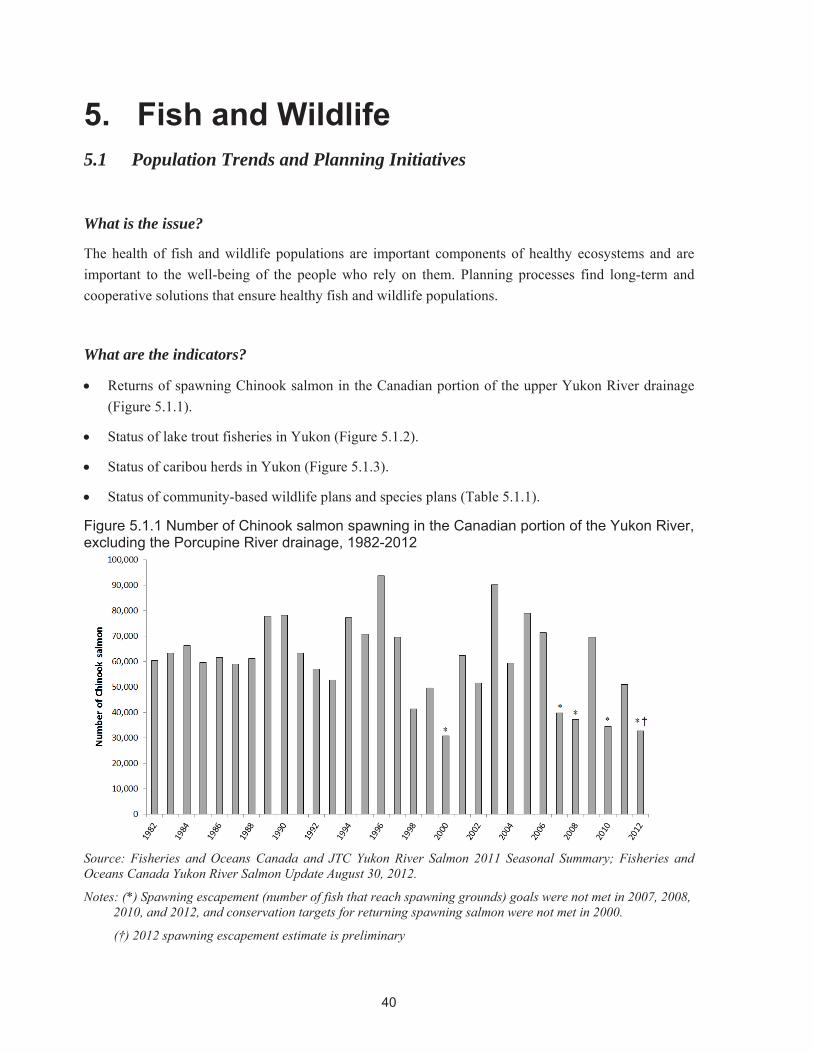
Figure 5.1.1 Number of Chinook salmon spawning in the Canadian portion of the Yukon River, excluding the Porcupine River drainage, 1982-2012
Source: Fisheries and Oceans Canada and JTC Yukon River Salmon 2011 Seasonal Summary; Fisheries and Oceans Canada Yukon River Salmon Update August 30, 2012.
Notes: (*) Spawning escapement (number of fish that reach spawning grounds) goals were not met in 2007, 2008, 2010, and 2012, and conservation targets for returning spawning salmon were not met in 2000.
(†) 2012 spawning escapement estimate is preliminary

41
Figure 5.1.2 Sustainability of angler harvest on select Yukon lake trout populations based on angler harvest data in 2011
Source: Environment Yukon
Note 1: Harvest is considered to be unsustainable when it exceeds the optimal sustainable yield, which is derived from a model based on physical and chemical parameters of the lake such as temperature and nutrient content.
Note 2: (*) Harvest may appear to be sustainable, when in fact a lake trout population is depressed (Braeburn, Snafu and Pine lakes); in Tarfu Lake, the lake trout population may be depleted, and harvest remains high.
Note 3: Harvest data are available for these lakes because they are where the most intensive fisheries take place. Fisheries on other lakes are expected to be, in most cases, within sustainable levels.
Harvest of lake trout is sustainable
Harvest of lake trout is increasingly unsustainable

42
Figure 5.1.3 Status and ranges of caribou in Yukon, 2013
Source: Environment Yukon

43
Table 5.1.1 Status of community-based wildlife plans and species plans in 2012
Plan Approved Status
Community-based fish and wildlife work plans
Dezadeash Lake No Under development
Little Salmon/Carmacks Traditional Territory 2004 Current
Na-Cho Nyäk Dun Traditional Territory 2010 Current
Vuntut Gwitchin Traditional Territory No Under development
Species Plans
Baikal Sedge Recovery Strategy 2011 Current
Management Plan for Dall’s Sheep In the Northern Richardson Mountains
No Draft recommended plan
Management Plan for Elk in Yukon 1998 Current
Management Plan for the Aishihik Wood Bison Herd in Southwestern Yukon
2012 Current
Management Plan for the Chisana Caribou Herd 2012 Current
Mandanna Lake No Under review
North Slope Muskox Management Plan No Under development
Northern Mountain Caribou Management Plan 2012 Current
Porcupine Caribou Harvest Management Plan 2010 Current
Southern Lakes Wildlife Coordinating Committee: Species Status Assessment & Recommendations
2012 Current
Wolf Conservation and Management Plan 2012 Current Yukon Amphibian Management Plan No Under development
Source: Updates from Environment Yukon.
What is happening and why is it happening?
The spawning escapement range of 42,500 – 55,000 Canadian-origin Chinook was not met in 2012, with a preliminary return estimate of 35,227 Chinook salmon to the Canadian portion of the Yukon River (Figure 5.1.1). Spawning escapement targets were also not met in 2007, 2008, and 2010. Recent low salmon runs have resulted in harvest restrictions (both voluntary and enforced) and have led to serious hardships for commercial and traditional harvesters in both Alaska and Yukon. Chinook salmon returns vary considerably due to a suite of factors, which include: the strength of

44
returning age classes, in-river harvest, offshore unintentional by-catch in the Pollock fishery, predation, disease loads, water levels, temperature, as well as environmental variables such as climatic events (Pacific decadal oscillation, El Niño, La Niña).
The majority of lake trout harvest in Yukon was sustainable; most water bodies were expected to continue to maintain quality fisheries (Figure 5.1.2). Only four lakes had a harvest that exceeded the sustainable limits: Caribou, Tarfu, Quiet and Louise lakes. Teslin Lake was nearing the point where harvest becomes unsustainable. Lake trout harvest in Braeburn, Snafu and Pine lakes, while low, may be unsustainable, as these lake trout populations appear depleted. Tarfu Lake, with a high harvest, may also have a depleted lake trout population. Generally, small lakes are more vulnerable to overharvesting because of their smaller lake trout populations and lower sustainable yields.
Of the 27 caribou herds in Yukon (Figure 5.1.3), six were assessed as stable/increasing, 14 were considered stable, five were unknown and two were thought to be declining. The declines in Yukon and other herds across the circumpolar north may be due to environmental changes, natural population cycles, and human influences such as harvest and development.
Two community-based fish and wildlife work plans are current and two are under development. Eight species plans are current and four planning processes are underway (Table 5.1.1). Many of these plans recognize that science, local, and traditional knowledge must all be considered when managing fish and wildlife.
Why is it significant?
Chinook salmon are an important part of the ecosystem, providing a key food source for bears, eagles and other predators, as well as bringing nutrients from the ocean to freshwater and terrestrial ecosystems. Salmon are important culturally, socially, and economically in Yukon. This was recognized in 2001, when Canada and the United States ratified the Yukon River Salmon Agreement to help rebuild and conserve stocks. Recent declines in salmon productivity and salmon fished as a by-catch of the Alaskan Pollock fishery have led to low returns of Chinook. Escapement targets for spawning salmon were not met in 2007, 2008, 2010 or 2012.
Lake trout are considered an indicator species due to their slow growth, position at the top of the aquatic food chain, reliance on healthy and clean habitats, and high value in Yukon fisheries. Healthy lake trout populations are indicative of the general health of the entire aquatic ecosystem. The status of lake trout fisheries informs decisions made by fishery managers to maintain sustainable fisheries.
Caribou are important ecologically and culturally. Many people rely on caribou for subsistence and spiritual well-being. Caribou herds that cross-jurisdictional boundaries require a coordinated approach to their management. One example is the Porcupine caribou herd, with a herd range that covers Yukon, Alaska and the Northwest Territories. The new management plan for the Chisana Caribou Herd was approved in 2012 and also demonstrates cross-jurisdictional challenges and solutions(www.env.gov.yk.ca/publications-maps/documents/chisana-mgmt-plan-2012.pdf)

45
Taking action
Beginning in 2007, the poor Chinook salmon runs have resulted in harvest restrictions in Alaska and Yukon and serious hardships for fishers and communities along the river. Since 2008, managers in Yukon and Alaska have been taking action with the goal of maintaining a healthy number of spawning salmon even in this time of low productivity. Some of the actions that have been taken include: full or partial closures of commercial, domestic, and recreational fisheries, voluntary reductions in fishing by First Nations, decrease in net mesh sizes to allow larger fish to reach the spawning grounds, reducing by-catch quotas for the Alaskan Pollock fishery and reduced fishing times in the subsistence fishery. The Yukon River Panel established by the Yukon River Salmon Agreement recommended spawning goals and allocated funding to program proposals submitted to the $1.2 million Yukon River Salmon Restoration fund.
From 2009 to 2012, Environment Yukon surveyed key fisheries through angler harvest studies (Bennett, Frances, Nares, Pine, Fish, Snafu, Tarfu, Caribou, Louise. Quiet, Frenchman and Ethel lakes, as well as Lubbock River and the Teslin River at Johnson’s Crossing) and fish population assessments (Bennett, Teslin, Fish, Lewes, Pine, Sekulmun, Snafu, Tarfu, Caribou, Ethel, Louise, Tatlamun, Frenchman, and Quiet lakes) to better understand which fish populations are sustainable and which need management action. Environment Yukon is developing new population assessment methods for Arctic grayling and burbot to be able to better understand the state of the resource.
Caribou were monitored by Environment Yukon in order assess overall status and trends. A plan for the boreal caribou population has been developed under the federal Species at Risk Act (see section 5.3).
Data quality
Data are standardized by the agencies collecting the information. Estimates of returning spawning salmon are based on aerial survey counts (1985-2002), radio tagging studies (2002-2004) and sonar estimates in Eagle, Alaska (2005-2012). The methods used prior to sonar in Eagle, Alaska underestimated returning salmon and therefore salmon returns were corrected to remove the bias.
Caribou herd ranges were based on information current to 2012 and were calculated using 95% kernel estimates from radio collared cow caribou.

46
5.2 Interesting Story: New bear incident map
One of the responsibilities of the Conservation Officer Services Branch is to prevent and mitigate conflicts between humans and wildlife. Human-bear conflicts are of particular concern because of the potential for human injury and property damage, and because these conflicts often result in the unnecessary destruction of these large charismatic fauna.
Each spring the Conservation Officer Services Branch launches an awareness campaign to remind the public of the need to responsibly manage their attractants (garbage, compost, meat, outdoor freezers). If we can prevent bears from becoming food-conditioned, they are less likely to come into conflict with humans.
In 2012, Environment staff collaborated on a new initiative, the Bear Incident Map Viewer. This interactive map on the department’s web page allows the public to see areas in the Southern Lakes region where bears are coming into conflict with humans. By clicking on a bear icon, the user is able to see the location as well as a photograph of the cause of the attractant (such as insecure garbage, front porch freezer). A ‘black’ bear icon marks an incident, while a ‘red’ bear icon show a location where a bear had to be destroyed because it became food-conditioned.
This new interactive bear map happened to be launched during a year when there were more bear conflicts than usual. In 2012, 17 bears were relocated and 19 bears were destroyed by conservation officers because of poorly managed attractants in the Whitehorse District. By October, the map had received about 5,800 hits. The bear incident map viewer will be operated as a pilot project until 2014, when its value will be reassessed.
The viewer is active between May and November and can be found at the following website: www.env.gov.yk.ca/publications-maps/bear_sightings_map.php
Black bear at a residence in Whitehorse, summer 2012

47
5.3 Contaminants
What is the issue?
Contaminants such as heavy metals, persistent organic pollutants and radionuclides can persist in the environment. Contaminants concentrated along the food chain may have serious health implications for wildlife as well as people who depend on traditional foods. Many contaminants found in the north were never used in the region or have been banned or restricted for many years. Transported here by wind and water, they tend to settle out in colder climates.
What are the indicators?
Mercury levels in Yukon caribou.
Mercury levels have been measured in Yukon caribou since 1994, which has allowed a thorough analysis of changes in mercury over time.
Cadmium levels in Yukon caribou and moose.
The Yukon Contaminants Committee, Environment Yukon, and the Northern Contaminants Program annually collect liver, kidney and muscle samples from Porcupine caribou for contaminant analysis. In the past, this program has included samples from moose and other caribou herds through the volunteer hunter survey program.
Mercury concentrations in lake trout.
In previous Yukon State of the Environment Reports, mercury concentrations in lake trout have been an indicator. A 20 year study of lake trout ended in 2010 and no new information is available. For information on lake trout mercury concentrations, please see previous Yukon State of the Environment Reports.
What is happening?
Caribou meat remains a healthy food choice because mercury levels were very low. Mercury concentrations in Porcupine caribou change from year to year in a cyclic pattern that is likely driven by environmental factors. Over the long term (1994 to 2011) there has been no increasing or decreasing trend in mercury concentration, so that mercury levels are considered to be stable.
Over the last 15 years, cadmium levels do not appear to be changing. As cadmium concentrates in animals’ liver and kidneys, it is recommended that people restrict intake of both organs. Yukon moose tend to have higher cadmium levels than barren-ground caribou. Cadmium levels are more variable in woodland caribou due to diet.
48
Why is it happening?
Caribou feed on lichen that can directly absorb airborne contaminants, such as mercury. The annual changes in mercury in Porcupine caribou may reflect changes in atmospheric mercury levels or changes in the environment (e.g. temperature, precipitation and wind) that affect how mercury moves from the air to caribou forage.
Cadmium is present in Yukon’s underlying geology, especially in the southeast region. The concentrations found in moose and woodland caribou are more likely the result of local sources rather than long range transport. Moose feed primarily on willows, which are hyperaccumulators of cadmium from the soil. Lichen, in contrast, has no root system to allow the absorption of local cadmium through the soil. Woodland caribou feed on a combination of willows and lichen. Barren-ground caribou feed almost exclusively on lichen during the winter months, so their cadmium levels tend to be lower.
Why is it significant?
The concentration of mercury in caribou continues to be very low. Although mercury concentrations do not appear to be increasing over the long term, the Porcupine caribou herd (as well as the Qamanirjuag caribou herd in the eastern Arctic) continues to be monitored so that the Yukon Contaminant Committee will be aware if that situation changes.
Because the levels of cadmium in Yukon moose and caribou are likely coming from naturally occurring sources, the only course of action is to be aware of the issue as a potential health concern. Health Canada recommends consuming one moose liver or kidney per year, and 7 to 32 caribou kidneys or 4 to 16 caribou livers depending on the herd.
Modern woodland caribou (Aishihik and Southern Lakes herds) actually have lower cadmium levels than fossilized teeth of caribou from the same areas, supporting the theory that cadmium is naturally occurring and stable over time.
Taking action
The federal Northern Contaminants Program has guided contaminants research and monitoring in the Canadian Arctic since 1991. The program supports a wide range of contaminant studies and is committed to monitoring contaminants in the Porcupine caribou herd on an annual basis. The program is making $200,000 available for projects in 2013/2014 in the areas of: Porcupine caribou, lake trout and burbot, and diet choices and/or risk perception of traditional/country foods and contaminants.
49
5.4 Species at Risk
What is the issue?
Biodiversity – the variety of life that exists on our planet– faces growing challenges in Yukon and abroad. These challenges are often related to human activities, such as loss of habitat, as well as a changing climate, which has implications for species habitats, shifting species ranges and new forms of competition.
Species at risk are those animals and plants whose populations are at risk of becoming extinct or extirpated from their range, and they are the ‘canaries in the coal mine’ warning of changes in our biodiversity. Twice annually the Committee on the Status of Endangered Species in Canada (COSEWIC) assesses the status of wild species that are of conservation concern and ranks them as Extinct, Extirpated, Endangered, Threatened or of Special Concern. Yukon does not have its own status assessment for species found in Yukon. However, the national status assessments include species found here and give Yukoners an indication of how our wild species are doing in the national context.
What are the indicators?
The number of species at risk in Yukon (Table 5.4.1).

50
Table 5.4.1 National status of species at risk that occur in Yukon, 2012
Taxonomic Group Common Name / Population COSEWIC Status Recovery Strategy or
Management Plan
Amphibians Western Toad Special Concern In progressBirds Barn Swallow Threatened No Canada Warbler Threatened No Common Nighthawk Threatened No Horned Grebe Special Concern No Peregrine Falcon Special Concern No Rusty Blackbird Special Concern In progress Short-eared Owl Special Concern No Olive-sided Flycatcher Threatened No Buff-breasted sandpiper Special Concern NoFish Bering Cisco Special Concern No Dolly Varden (Western Arctic population) Special Concern No Squanga Whitefish Special Concern No Bull Trout (Western Arctic population) Special Concern NoMammals Wood Bison Threatened In progress Grizzly Bear (Northwestern population) Special Concern No Polar Bear Special Concern No Wolverine (Western population) Special Concern No Woodland Caribou (Boreal population) Threatened Completed Woodland Caribou (Mountain population) Special Concern CompletedPlants Baikal Sedge Threatened Completed Yukon draba Endangered NoInsects Dune Tachnid Fly Special Concern No
Source: Committee on the Status of Endangered Wildlife in Canada (COSEWIC); and Biodiversity Programs, Fish and Wildlife Branch, Environment Yukon.
What is happening?
Yukon has the second lowest number of species at risk, with only Prince Edward Island having fewer. The Northwest Territories has almost twice as many species at risk as Yukon. However, the Committee on the Status of Endangered Wildlife in Canada (COSEWIC) has yet to assess all of Canada’s rare, and possibly at-risk, species of plants, fish, animals and insects.
Yukon has its first endangered species assessed this year, the Yukon draba. This small plant in the mustard family is known only in two places globally, both in Yukon, with one population just north of Haines Junction and the other near Aishihik village.
COSEWIC has identified 707 species at risk in Canada: 304 ‘endangered,’ 170 ‘threatened,’ 194 ‘special concern,’ 24 ‘extirpated,’ and 15 ‘extinct species.’

51
A variety of mechanisms at local, regional, national and global levels are being used to recover species at risk and reduce extinction risks. For example, a species that is locally healthy, but globally at risk requires coordinated efforts across borders to recover its numbers and maintain biodiversity.
Why is it happening?
A changing climate, competition from alien invasive species and habitat loss are the major reasons many species are at risk. Other factors are genetic and reproductive isolation, environmental contamination, overharvesting, and disease. Different tools are required at territorial, national and international levels for the effective protection of species at risk.
Why is it significant?
Personal health, and the health of the economy and society, depends on various ecological values. Biodiversity is the combination of life and the interactions with each other and with the rest of the environment that sustain our lives. There is also great intrinsic value of having healthy ecosystems with all of their component parts.
Taking action
National recovery and management plans are currently being developed for three species found in Yukon: wood bison, rusty blackbird and western toad. Plans have been completed for Baikal sedge and woodland caribou (mountain and boreal populations).
Yukon government recognizes that recovery plans and management strategies should clearly reflect the realities of Yukon’s environment and the values of Yukon people. As such, Yukon government continues to contribute to national species at risk recovery plans in partnership with other governments and groups in this territory. Yukon government technical experts sit on recovery planning teams convened by Environment Canada to bring territorial knowledge of the local situation forward.
Environment Yukon developed the Yukon Conservation Data Centre, which tracks and reports on the status of all species and ecological communities in Yukon and serves as a central source for all rare species data for the territory. A coordinator and a biodiversity information specialist make up the data centre. Partners include Environment Canada, Parks Canada and NatureServe Canada. The Yukon Conservation Data Centre continues to incorporate new partners and increase the available data to support the management of species at risk in Yukon.
Environment Yukon holds workshops annually to update and inform Yukoners and governments on current species at risk matters, new species of conservation concern, and improve communications on species at risk management in Yukon. Environment Yukon participates in COSEWIC and works cooperatively with other jurisdictions on species at risk management initiatives.

52
ConclusionThe Yukon State of Environment Interim Report, 2013 called for by the Environment Act is intended to help Yukoners better understand what is happening with the environment and to support discussions about what aspects of the environment are healthy and where improvements may be needed.
Yukon has a rich and diverse natural environment. Good information about the current health of our environment allows governments to plan for the future and citizens to understand the changes and participate in planning initiatives. Yukon has the benefit of being able to learn from the experiences of others, ensuring a sustainable direction underlies all our planning processes.

53
ReferencesChapter 1 Climate Change
1.1 Greenhouse Gas Emissions
Specific:
Tables 1.1.1 and 1.1.2 and Figure 1.1.1: Source: Environment Canada, Greenhouse Gas Division. National Inventory Report 1990–2010. Greenhouse Gas Sources and Sinks for Canada. 2012. <www.ec.gc.ca/Publications/>
General:
Energy Solutions Centre, Government of Yukon. <www.energy.gov.yk.ca>
Environment Canada, Greenhouse Gas Division. National Inventory Report 1990–2010. Greenhouse Gas Sources and Sinks for Canada. 2012. <www.ec.gc.ca/Publications/>
Government of Yukon. Energy Strategy for Yukon. 2009. <www.energy.gov.yk.ca/energy_strategy.html>
Government of Yukon. Government of Yukon Climate Change Strategy. 2006. <www.environmentyukon.gov.yk.ca/mapspublications/plansreports.php>
Government of Yukon. Government of Yukon Climate Change Action Plan. 2009. <www.env.gov.yk.ca/monitoringenvironment/ccactionplan.php>
Hassol, S.J. Impacts of a Warming Arctic: Arctic Climate Impacts Assessment. Cambridge University Press, United Kingdom and New York, NY, USA. 2004. <www.amao.mo/acia>
International Panel on Climate Change: Climate Change 2007: The Physical Science Basis. Contribution of Working Group I to the Fourth Assessment Report of the Intergovernmental Panel on Climate Change [Solomon, S., D. Qin, M. Manning, Z. Chen, M. Marquis, K.B. Averyt, M. Tignor and H.L. Miller (eds.)]. Cambridge University Press, Cambridge, United Kingdom and New York, NY, USA. 2007. <www.ipcc.ch/ipccreports/ar4-wg1.htm>
1.2 Changing Climate
Specific:
Figures 1.2.1: Source: Environment Canada, Climate Research Branch. Climate Trends and Variations Bulletin. 2010 <ec.gc.ca/adsc-cmda/>
General:
Canadian Council of Ministers for the Environment. Climate, Nature, People: Indicators of Canada’s Changing Climate. 2003. <www.ccme.ca/assets/pdf/cc_ind_full_doc_e.pdf>

54
Environment Canada, Climate Research Branch. Climate Trends and Variations Bulletin. <ec.gc.ca/adsc-cmda/>
Government of Yukon. Government of Yukon Climate Change Strategy. 2006. <www.environmentyukon.gov.yk.ca/mapspublications/plansreports.php>
Hassol, S.J. Impacts of a Warming Arctic: Arctic Climate Impacts Assessment. Cambridge University Press, United Kingdom and New York, NY, USA. 2004. <www.amao.mo/acia>
Lemmen, D.S., Warren, F.J., Lacroix, J., and Bush, E. (eds.) From Impacts to Adaptation: Canada in a Changing Climate 2007. Government of Canada, Ottawa, ON. 2008.
Chapter 2 Air
2.1 Air Quality
Specific:
Table 2.1.1 and Figure 2.1.1 Source: Whitehorse National Air Pollution Surveillance Station data, Standards and Approvals, Environmental Programs Branch, Environment Yukon.
Figure 2.1.2 Environment Canada National Air Pollution Surveillance Program Network <www.ec.gc.ca/rnspa-naps> , and National Air Pollution Surveillance Station data from Whitehorse Standards and Approvals, Environmental Programs Branch, Environment Yukon, British Columbia Environment.
General:
Environment Canada National Air Pollution Surveillance Network < www.ec.gc.ca/rnspa-naps/>
Environment Yukon and City of Whitehorse. Let’s Clear the Air: About Wood Smoke and Vehicle Exhaust. < www.env.gov.yk.ca/environment-you/wood_burning_tips.php >
Environment Yukon, Government of Yukon. Keeping our Air Clean. < www.env.gov.yk.ca/air-water-waste/air_emissions_regs.php >
Canadian Council of Ministers of the Environment. Canada-wide Standards for Particulate Matter and Ozone: Five Year Report: 2000-2005. 2006. <www.ccme.ca/assets/pdf/pm_oz_2000_2005_rpt_e.pdf>
Canadian Council of Ministers of the Environment. Particulate Matter and Ground-level Ozone. <www.ccme.ca/ourwork/air.html?category_id=99>
Canadian Environmental Protection Act/Federal-Provincial Advisory Committee Working Group on Air Quality Objectives and Guidelines. National Ambient Air Quality Objectives for Particulate Matter.1999. <dsp-psd.pwgsc.gc.ca/Collection/H46-2-98-220E.pdf>
Department of Health and Social Services, Government of Yukon. <www.hss.gov.yk.ca/sfpa.php>

55
Energy Solutions Centre, Government of Yukon. 2008/2009 Good Energy Rebate Program: Final Report. <www.esc.gov.yk.ca/pdf/good_energy_final_report_may_09.pdf>
Whitehorse National Air Pollution Surveillance Station data, Standards and Approvals, Environmental Programs Branch, Environment Yukon, Government of Yukon.
Yukon Wildland Fire Management, Department of Community Services, Government of Yukon. <www.community.gov.yk.ca/firemanagement>
Chapter 3 Water
3.1 Water Quality Index
Specific:
Table 3.1.1 Source: Environment Canada, Canadian Environmental Sustainability Indicators. <www.ec.gc.ca/indicateurs-indicators/>
Tables 3.1.2 and 3.1.3 Sources: Environment Canada and Water Resources Branch, Environment Yukon, Government of Yukon.
General:
British Columbia Water Quality Index. <www.env.gov.bc.ca/wat/wq>
Canadian Environmental Sustainability Indicators. <www.ec.gc.ca/indicateurs-indicators/>
Environment Canada, British Columbia Ministry of Environment and Environment Yukon. British Columbia and Yukon Territory Water Quality Report (2001-2004). <ec.gc.ca/eaudouce-freshwater>
Environment Canada. Water Quality Indicators. 2010 <http://www.ec.gc.ca/indicateurs-indicators/2102636F-9078-409F-8133-8775E51400BE/WQ_march2010_indicator_eng.pdf>
Pacific/Yukon Water Quality Monitoring Program. <www.waterquality.ec.gc.ca>
Whitley, G. Site Specific Water Quality Guidelines for the Klondike River Above Bonanza Creek – Draft. 2009.
Yukon Placer Secretariat. <www.yukonplacersecretariat.ca>
3.2 Interesting Story
General:
Yukon Water website. <www.yukonwater.ca>

56
Chapter 4 Land
4.1 Land Use and Resource Management Planning Specific:
Figure 4.1.1 and Tables 4.1.1, 4.1.2, 4.1.3 Sources:
Regional Land Use Plans— Yukon Land Use Planning Council. <www.planyukon.ca>
Official Community Plans and Local Area Plans/Area Zoning Regulations—update provided by Community Affairs, Community Development Division (Official Community Plans), and Yukon Department of Energy, Mines and Resources, Land Planning Branch.
Forestry Management Plans—update provided by Forest Planning and Development, Yukon Department of Energy Mines and Resources.
Protected Area and Other Plans—data provided by Yukon Parks Branch and Fish and Wildlife Branch, Environment Yukon. <www.environmentyukon.gov.yk.ca/parksconservation/parks.php>
4.2 Interesting Story General:
Yukon Parks Branch, Environment Yukon. <www.environmentyukon.gov.yk.ca/parksconservation/parks.php>
4.3 Solid Waste Management Specific:
Figures 4.3.1, 4.3.2 and 4.3.3 Sources: Data provided by Engineering & Environmental Services, City of Whitehorse.
General:
Engineering & Environmental Services, City of Whitehorse. <www.city.whitehorse.yk.ca>
Raven Recycling, Education Department. <www.ravenrecycling.org>
Community Services, Yukon government. <www.community.gov.yk.ca/cd/waste_management.html>
Chapter 5 Fish and Wildlife
5.1 Population Trends and Planning Initiatives Specific:
Figure 5.1.1 Source: Fisheries and Oceans Canada Yukon River Salmon Update, August 30, 2012.

57
<pac.dfo-mpo.gc.ca/yukon/docs/2012/yukon/2012-08-30.pdf>
< yukonriverpanel.com/salmon/publications/joint-technical-committee-reports>
Figures 5.1.2, 5.1.3, and Table 5.1.1 Source: Data provided by Environment Yukon, Fish and Wildlife Branch.
General:
CircumArctic Rangifer Monitoring and Assessment Network (CARMA). <www.carmanetwork.com>
Environment Yukon. Fish and Wildlife Management Branch.
Environment Yukon. Status of Yukon Fisheries 2010: An Overview of the State of Yukon Fisheries and the Health of Fish Stocks, with Special Reference to Fisheries Management Programs. Yukon Fish and Wildlife Branch Report MR-10-01. 2010. www.environmentyukon.gov.yk.ca/mapspublications/documents/status_yukon_fisheries2010.pdf>
Porcupine Caribou Management Board. <www.taiga.net/pcmb>
The United States and Canada Yukon River Joint Technical Committee. Yukon River Salmon 2010 Seasonal Summary and 2011 Seasonal Outlook. Regional Information Report No. 3A11-01. 2011.
Yukon River Panel. <yukonriverpanel.com/salmon>
5.2 Interesting Story
General:
Environment Yukon Bear Incident Map <www.env.gov.yk.ca/publications-maps/bear_sightings_map.php>
5.3 Contaminants General:
Fish and Wildlife Branch, Environment Yukon. <www.environmentyukon.gov.yk.ca/fishwild/index.html>
Gamberg, M. Arctic Caribou and Moose Contaminant Program. In Synopsis of research conducted under the 2009-2010 Northern Contaminant Program. Indian and Northern Affairs Canada, Northern Contaminants Program, Ottawa. 2010.
Gamberg, M. Arctic Caribou and Moose Contaminant Program. In Synopsis of research conducted under the 2008-2009 Northern Contaminant Program. Indian and Northern Affairs Canada, Northern Contaminants Program, Ottawa. 2009.

58
Gamberg, M. Mercury in Caribou Forage. In Synopsis of research conducted under the 2008-2009 Northern Contaminant Program. Indian and Northern Affairs Canada, Northern Contaminants Program, Ottawa. 2009.
Gamberg M., Palmer M., Roach P. Temporal and Geographic Trends in Trace Element Concentrations in Moose from Yukon, Canada. Sci Total Environ: 351-352: 530-538. 2005.
Northern Contaminants Program. <www.northerncontaminants.ca >
Stern, G. Trace metals and Organohalogen Contaminants in Fish from Selected Yukon Lakes. In Synopsis of research conducted under the 2009-2010 Northern Contaminant Program. Indian and Northern Affairs Canada, Northern Contaminants Program, Ottawa. 2011.
5.4 Species at Risk Specific: Table 5.4.1 Source: Committee on the Status of Endangered Wildlife in Canada. <www.cosewic.gc.ca>
and Biodiversity Programs, Fish and Wildlife Branch, Environment Yukon.
General:
Fish and Wildlife Branch, Environment Yukon. <www.environmentyukon.gov.yk.ca/wildlifebiodiversity>
Yukon Conservation Data Centre <www.env.gov.yk.ca/wildlifebiodiversity/cdc.php>
Canadian Endangered Species Conservation Council. 2006. Wild Species 2005: The General Status of Species in Canada. <www.wildspecies.ca>
Committee on the Status of Endangered Species in Canada. COSEWIC Annual Report 2010-2011. <www.cosewic.gc.ca>
Federal, Provincial and Territorial Governments of Canada. Canadian Biodiversity: Ecosystem Status and Trends 2010. Canadian Councils of Resource Ministers. Ottawa. 2010. <www.biodivcanada/ecosystems>
NatureServe. <www.natureserve-canada.ca >
Secretariat of the Convention on Biological Diversity. Global Biodiversity Outlook 3. Montréal. 2010. <gbo3.cbd.int>

59
Yukon State of the Environment Report 2013 Comment Form
Environment Yukon would like your input on ways to make this document more useful for you.
Who are you? Check one. (This is important for us to know who currently uses the Report) � Government � Business � Individual � Educational Institution � Non-profit � Other: ________________________________
What information do you find most useful?
What additional information or topics would you like to see?
What changes would make the report more useful to you?
What medium do you prefer? � Hard copy report � On-line � Both print and online � Other: _________________________________
The collection, use and disclosure of information is done in compliance with the territorial Access to Information and Protection of Privacy Act. Your comments to the Yukon government may be summarized in order to report on feedback received. Personal information that you provide will be protected in accordance with the Act.
Options for providing your feedback:
1. Complete the on-line survey: www.env.gov.yk.ca/soe2013 2. Email your comments to: [email protected] 3. Drop off the survey at: Environment Yukon, 10 Burns Road, Whitehorse, Yukon 4. Fax it to: Attn: Tim Sellars at 867-393-6213 5. Phone in your comments to: Tim Sellars at 867.667.8118
The deadline for submissions is July 31, 2013.

60
