yum! brands 2003 annual customer mania report
TRANSCRIPT

YUM! BRANDS 2003 ANNUAL CUSTOMER MANIA REPORTYUM! BRANDS 2003 ANNUAL CUSTOMER MANIA REPORT
Power Yum! of
Alone we’re delicious. Together we’re
Dear Partners, Dear Partners,Dear Partners, I’m pleased to report 2003 was a year where I’m pleased to report 2003 was a year whereI’m pleased to report 2003 was a year where we showed the underlying power of our global portfolio of leading restaurant brands. With continued profitable inter-national expansion led by dynamic growth in China, combined with strong momentum at Taco Bell in the United States, we achieved 13% earnings per share growth prior to special items.
This growth was achieved in spite of a challenging worldwide environment which included war in Iraq, SARS in Asia, and a generally soft economy the first half of the year. Highlights include over $1 billion in operating profit, over $1 billion in cash from operating activities, and nearly $1 billion in franchise fees. In so doing, we once again achieved one of the industry’s leading returns on invested capital at 18%. After paying off $2.6 billion in debt the past six years, we now have the power of an investment-grade quality balance sheet. Given this strong performance and increasing financial strength, our share price climbed 42% in 2003, and our annual return to shareholders is 14% since becoming a public company in 1997.
Going forward, we are quite confident we can continue to achieve our goals of growing our earnings per share at least 10% each year. We have three powerfully unique growth opportuni-ties that differentiate us from our competition. After reading this report, I hope you’ll agree that we are NOT YOUR ORDINARY RESTAURANT COMPANY.
Let me explain why we think so.
#1. Driving Profitable GLOBAL Growth On the international front we have an undeniable competitive advantage and undeniable growth opportunity with two global brands, KFC and Pizza Hut. This year we set another record as we opened 1,108 new restaurants outside the United States. That’s the third year in a row we’ve opened 1,000 or more.
Yum! Restaurants International is now our largest and fastest growing division, generating $441 million in operating profit and 22% growth in 2003. To put this in perspective, the inter-national team contributed $172 million in 1997, excluding charges for facility actions.
The root of this exciting growth stems from the competitive advantage of the tremendous infrastructure we already have in place. Today, we have strong local teams around the world, operate in over 100 countries with established supply chains, and have nearly 600 interna-tional franchisees.
Table of Contents Table of ContentsTable of Contents
Infc Dear Partners Dear Partners Dear Partners7 Yum! Dynasty Model Yum! Dynasty Model Yum! Dynasty Model8 88 Global Powerhouse Global Powerhouse Global Powerhouse
10 Yum! Restaurants International Yum! Restaurants International Yum! Restaurants International continues to be our Growth Engine! continues to be our Growth Engine!continues to be our Growth Engine!
12 Brand Power x5 Brand Power x5 Brand Power x514 Taco Bell Taco Bell Taco Bell
Think Outside the Bun Think Outside the BunThink Outside the Bun
16 Pizza Hut Pizza HutPizza Hut Gather ’Round the Good Stuff Gather ’Round the Good StuffGather ’Round the Good Stuff
18 KF KF KFC What’s Cookin’ C What’s Cookin’C What’s Cookin’
20 Long John Silver’s/A&W Long John Silver’s/A&WLong John Silver’s/A&W22 Power of Choice Power of ChoicePower of Choice24 Customer Mania Power Customer Mania PowerCustomer Mania Power26 100% CHAMPS with a Yes! 100% CHAMPS with a Yes! 100% CHAMPS with a Yes!28 Running Great Restaurants Running Great Restaurants Running Great Restaurants
29 Yum! At-a-glance Yum! At-a-glance Yum! At-a-glance30 Global Facts Global Facts Global Facts31 Unit Information Unit Information Unit Information32 Power of Results: Power of Results: Power of Results:
Yum! Financial Highlights Yum! Financial HighlightsYum! Financial Highlights33 Financials Financials FinancialsInbc Power of Giving Back Power of Giving Back Power of Giving Back

We thank our friends from PepsiCo who invested billions of dollars to establish the global network we inherited for both KFC and Pizza Hut. The happy reality is that it would take years of investment for any of our competitors to reach our size and scale (with the obvious exception of McDonald’s, which already makes $1.6 billion outside the U.S., demonstrating the size of the prize).
Our plan is to leverage our big scale markets. We have 11 countries and franchise business units that have almost 500 restaurants or more. We’re continuing to focus our international company operations investment in seven of these countries that account for over 70% of our international operating profit. Our franchise and joint venture partners are driving system growth by opening more than 70% of our new international restaurants. Importantly, our franchisees are using their capital, not ours, to grow their business since we strategically elected not to invest in our franchisees’ real estate, like some other franchisors do. We love the high return franchise business!
The silver bullet in our portfolio has to be China. What a business and what an incredible opportunity! KFC and Pizza Hut already have 1,000 and 120 restaurants in China, respec-tively. We have a senior tenured team that has worked together for over ten years, building the business from scratch to where we now make $157 million in operating profit, up 42% versus a year ago.
In addition, we have the unique advantage of owning our own food distribution system that gives us coverage in every major Chinese province and access to almost the entire 1.3 billion population. We also have one of the largest real estate teams of any retailer in the world that opened up 270 new restaurants in 2003. Our China operations are also best in class, with a highly educated workforce (64% of the restaurant general managers have at least a college education, the rest are plain smart!). We estimate there are 450 million urban customers who can afford our food in the fastest growing economy in the world. KFC is already the Chinese customers’ favorite brand and Pizza Hut is the number one casual dining chain. We just opened a Taco Bell Grande dine-in format that is off to a great start. The Chinese love our food and we love China. I’ve said it before and I’ll say it again, there is no doubt in my mind that one day we will have more restaurants in China than we do in the U.S.
Left: Seventeen years after openingthe fi rst KFC in China, Yum! Brands celebrated the opening of its 1,000threstaurant, located in Beijing.
Right: KFC in China gathered all of its 1,000 Restaurant General Managers together as part of its Annual Convention to mark the 1,000th restaurant milestone.
We’re continuing to
focus our international company operations
investment in seven countries.
1.
Above: The United Kingdom, one of our key high-growth markets, accounted for $97 million in operating profi t in 2003.

We are now the leading global developer of new We are now the leading global developer of newWe are now the leading global developer of new restaurants. We’ve created the equivalent of a new division in China, which recently opened its 1,000th KFC and made $157MM in 2003.
The biggest short-term international challenge we face is turning around our Mexico business. We have nearly 500 restaurants in Mexico that only made in total about $10 million in 2003, which is well below expectations. The good news is we have a talented team working hard to turn around same-store sales in this tough macro environment. In the meantime, we have temporarily pulled back on new Mexico development while we rebuild our existing business. We have so many profitable growth opportunities in other countries that we can turn off the capital faucet in a country, like Mexico, when we have a significant downturn and readily redeploy that capital in other markets. We want to continue to add at least 1,000 international new units each year AND we want to do it profitably. Consider this: excluding China, we only have 6,000 KFCs and 4,000 Pizza Huts compared to the 16,000 units McDonald’s has in international markets outside of China. With this kind of opportunity, we believe that we can continue to profitably grow at our 1,000+ new unit pace for many years without being heroic or foolishly chasing numbers.
Our most significant longer term challenge is developing new markets … getting to scale in Continental Europe, Brazil and India. This is tough sledding because building consumer aware-ness and acceptance takes time. It also takes time to build local operating capability. Our approach is to be patient and ever mindful of our overall profitability and returns. The promise is obvious.
Here are key measures for international: 15% operating profit growth per year, at least 7% system sales growth before foreign currency conversion, 1,000+ new units outside the U.S. and 20% return on invested capital.
In the U.S., Taco Bell is now the second most profitable QSR brand and just celebrated hitting the $1 million mark for average unit volumes. In 2003, company same-store sales were up 2% on top of 7% growth the previous year.
This result is coming from steadily improving operations and exceptional marketing. Taco Bell is now ranked #2 in QSR Magazine’s Annual Study for overall drive-thru service. And Taco Bell’s“Think Outside the Bun” advertising campaign and strong new product pipeline is among the best in the industry.
Our biggest disappointment in the U.S. this year was negative 1% and negative 2% company same-store sales growth at Pizza Hut and KFC, respectively. However, 2003 was a year of steady progress at Pizza Hut as the brand showed positive same-store sales growth seven of the last eight periods in 2003. Most importantly, the Pizza Hut team laid a strong growth foundation for this year and beyond. The brand was repositioned to target the heart of the pizza category focusing on the family and the primary decision maker, Mom.
We want to
continue to add
at least 1,000 new unitsoutside the U.S.,
each year, and do it profitably.
Top: Pizza Hut Korea President In-soo Cho serves up some of the new menu items in the world’sfi rst Pizza Hut Plus, which opened in Seoul during 2003.
Bottom: A new, 70-item menu high-lights the world’s fi rst Pizza HutPlus restaurant in Korea. In addi-tion to the usual array of pizzas, therestaurant features a wide varietyof appetizers, salads, pasta and beverages.
2.

We are the leader in the chicken, pizza, seafood & Mexican quick service categories.
A new advertising campaign, “Gather ’Round the Good Stuff ™,” was launched and is gaining traction with customers. The new product pipeline has been rebuilt with a record number of product and concept tests.
Pizza Hut is also steadily improving its operations and is the first one of our brands to achieve team member turnover of less than 100% for the full year … 99.6% to be exact (the industry average is nearly 200%).
While KFC is incredibly strong internationally, it is clearly our biggest challenge in the U.S. We are, however, confident the new management team we put in place is taking the right actions to turn the brand around.
We plan a major relaunch of KFC in the second half of 2004, featuring a new menu board that features a roasted line of new products and everyday value meals. We are also emphasizing the fact that our chicken is brought to our restaurants fresh, not frozen, every day.
Just as importantly for KFC, we are making steady progress in speed of service as we roll out the same drive-thru program that worked so effectively for Taco Bell. One big advantage we have is the ability to spread our best practices.
Key measures in the U.S.: At least 7% operating profit growth per year and at least 1–2%same-store sales growth.
#2. Multibranding Great Brands Our goal is to be the best in the world at providing branded restaurant choice. We have category-leading brands that are highly successful on a stand-alone basis. As a result, we are structured with fully staffed marketing and operating teams who wake up every single day focused on driving each brand’s differen-tiation, relevance and energy. Given the power of these individual brands, we have the opportunity to literally change the quick service restaurant industry as you know it today by offering two of our great brands in the same restau-rant … we call this strategy multibranding.
Multibranding gives us the competitive advantage of branded variety. It is already a big business for Yum!, accounting for 12% of our U.S. traditional restaurant base and generating almost $185 million in U.S. company store profits and franchise fees. Our learnings this year make
Multibrandinggives us the competitive
advantage of
branded variety.
With the acquisition of A&W andLong John Silver’s in 2002, we tripledour multibrand potential in the U.S.No one else has our brand portfoliopower.
3.

We are more confident than ever that multibranding is potentially the biggest sales and profit driver in the restaurant industry since the drive-thru window.
us more confident than ever that multibranding is potentially the biggest sales and profit driver in the restaurant industry since the introduction of the drive-thru window.
We started with combinations of KFC/Taco Bell and Taco Bell/Pizza Hut Express. We learned that we were able to add significant incremental average sales per unit, dramatically improving our unit cash flows. Our franchisees then pioneered multibrand combinations of KFC and Taco Bell with Long John Silver’s, the country’s leading seafood restaurant, and A&W All American Food, which offers pure-beef hamburgers and hot dogs along with its signature Root Beer Float. Based on outstanding customer feedback and results, we acquired Long John Silver’s and A&W in 2002. With this acquisition we tripled our multibranding potential in the U.S.
We can now open high return new restaurants in trade areas that used to be too expensive or did not have enough population density to allow us to go to market with one brand. With multi-branding, we believe we can take both KFC and Taco Bell to 8,000 units in the U.S. compared to the over 5,000 each we have today. As we expand, we expect to take volumes to an average of at least $1.1 million per restaurant.
One of the most exciting learnings we had in 2003, is that Long John Silver’s is performing even better than expected …we call it our hidden jewel. That’s because there is no national fish competitor in the QSR industry and consequently there is pent-up consumer demand for seafood. In addition to outstanding sales results with KFC and Taco Bell, we have created a Long John Silver’s/A&W combination that allows us to expand into “home-run” trade areas where we know demand is high and KFC and Taco Bell are already there. The results have led us to a “fish first” strategy with the goal of making Long John Silver’s a national brand.
I’m also pleased to report that we have created on our own a new multibrand concept called WingStreet, which is a tasty line of flavored bone-in and bone-out chicken wings. We believe that WingStreet can be an ideal multibrand partner for Pizza Hut’s delivery service. Initial customer response is promising. We also acquired Pasta Bravo, a California fast casual chain with an outstanding line of pastas at great value, to be a partner brand with Pizza Hut’s traditional dine-in restaurants. Franchise testing is underway. We are confident multibranding will be every bit as successful at Pizza Hut as it has been for our other brands.
In last year’s report, I stated that the biggest multibranding challenge is building the operating capability to successfully run these restaurants. That’s still a fact. With branded variety comes complexity. However, we have structured and invested to drive execution and it’s paying off. We now have a fully dedicated team of operating experts who have improved back of house
Top: The popularity of the Long John Silver’s brand grew in 2003 as it became the partner-of-choice in Yum!’s new Multibrand restau-rants. This year, Yum! has adopted a “fi sh fi rst” strategy of using the Multibrand development concept to get Long John Silver’s distribution upto at least 3,000 units and make it anational brand.
Bottom: Multibranding offers our customers more choice and conve-nience by bringing together two of our great brands under one roof.
4.

Customer Mania is about having a Yes! attitude, Customer Mania is about having a Yes! attitude,Customer Mania is about having a Yes! attitude, culture and mindset 100% of the time.
integration and systems, value engineered our facilities, developed WOW building designs and most importantly, improved people capability. While execution still remains our number one challenge, we are getting better and better. Improved margins and customer measures are evidence. Further proof in the pudding is that 50% of our multibranding units are being opened by franchisees who are putting their own hard-earned money into the game because they believe that the payout is there.
Again, this multibranding opportunity is unique to Yum! We clearly have first mover advantage. No one else has our brand portfolio power, plus our operational learnings put us well ahead of the pack.
Multibranding key measures: 500+ U.S. multibrand additions per year and at least mid-teen internal rates of return.
#3. Running Great RestaurantsWhile we have pockets of excellence around the globe, our customers are telling us we could only give ourselves a “C” or mediocre grade in operations execution. We’re making progress as we’ve climbed from the bottom to the middle of the pack versus competition, but mediocrity is miserable from our point of view. The bright side is we now have the key processes in place that are necessary to be a great restaurant operating company. We have standard-ized and are now implementing our best operating practices around the world: Customer Mania Training, CHAMPS (which measures operational basics like Cleanliness, Hospitality, Accuracy, Maintenance, Product Quality and Speed), Balanced Scorecard, CHAMPS Excellence Review and Bench Planning. The key now is to execute these tools that we know work with urgency.
As we do, we are fixated on two key measures that reflect the kind of consistency we want to drive across Yum! Brands:1) SAME-STORE SALES GROWTH IN EVERY STORE.2) 100% CHAMPS WITH A YES! ATTITUDE IN EVERY STORE.
Why are these two measures so important? If we are driving same-store sales growth, we are doing a better job of satisfying more customers. If we are achieving 100% CHAMPS with a Yes! attitude, we are giving our customers the basic experience they deserve and expect. Of course, the opposite is true when we don’t.
If we’re achieving
100% CHAMPS with a Yes! attitude, we’re giving
our customers the experience
they deserve and expect.
At A&W All American Food, customerskeep coming back for our pure 100%ground beef burgers served hot, freshand sizzling every time. Our deli-cious Double Bacon Cheeseburger,pictured below, is our number oneselling burger!
5.

We obviously have a major opportunity to improve. For example, at Taco Bell where we had our best U.S. company same-store sales growth of +2% in 2003, only 66% of our restaurants had sales growth and only 42% of the CHAMPS scores reached 100%. We have uneven perfor-mance like this at every brand in almost every country in the world. This only shows us how much upside we have to grow by Running Great Restaurants.
We are striving to train 840,000 team members across our system once a quarter on how to be Customer Maniacs. We began this training this year and turnover is down, complaints are down, and compliments are up. CHAMPS scores are improving. We’re making progress but we know we can and must get better. Our goal is to be the best restaurant operator in our industry.
As we march ahead, our entire organization is focused on building what we call the Yum! Dynasty, driving consistent results year after year, which is a trademark of truly great compa-nies and rising shareholder value. On the next page you can see the roadmap we’ve laid out for dynasty-like performance, along with some of my handwritten comments I always include in my New Year’s letter to our restaurant teams.
What you can’t see in our numbers, but I hope you can get a sense of in this report, is the power of the worldwide culture we are building. It’s a high energy, people capability first, customer mania culture that is centered on spirited recognition that drives performance. If you talk to our people, you’d hear a universal conviction that the culture we are building is our true secret weapon. I’m confident we will execute our unique strategies because our outstanding people and our tremendous franchisees are galvanized around building our business the right way.
In particular, I especially want to thank the Restaurant General Managers who have driven their same-store sales and achieved 100% CHAMPS scores. You are our number one leaders for a reason. Only RGMs can build the team of Customer Maniacs that can satisfy our customers. I appreciate your daily focus to deliver 100% CHAMPS every shift and your passion to build a team of 100% Customer Maniacs. I tell everyone the basic truth of our business: “Show me a great RGM and I’ll show you a great restaurant.” That’s because customers see the difference in the service and we see the difference in our profits.
I’d also like to thank our dedicated Board of Directors, especially Ron Daniel and John Weinberg who retired this year, for their contributions and passion for helping us build dynasty-like performance.
We have the power of Yum! and a great future. I hope you agree we are anything but your ordinary restaurant company.
YUM! TO YOU!
David C. NovakChairman and Chief Executive OfficerYum! Brands, Inc.
Our goal is to be the
best restaurant operator
in our industry.
Exciting products are constantly coming through the pipeline at Yum!’s individual brands. One such product is Taco Bell’s Cheesy Gordita Crunch, delivering the dynamic contrast of a crunchy taco shell inside a warm, soft Gordita fl atbread held together with a melted three-cheese blend.
We are anything but your ordinary restaurant company. We are anything but your ordinary restaurant company.We are anything but your ordinary restaurant company.
David C. NovakChairman and ChiefExecutive Offi cerYum! Brands, Inc.
6.

7.

globalglobal““power

house”
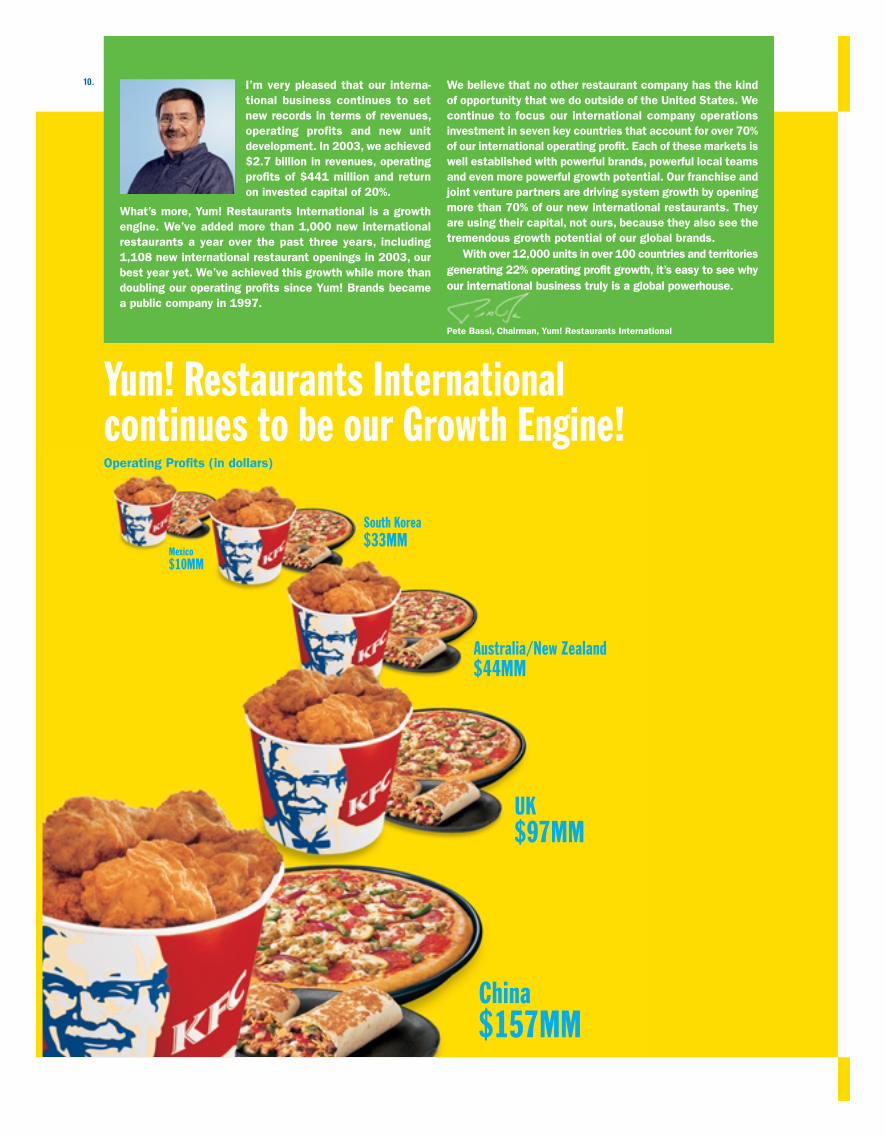
I’m very pleased that our interna-tional business continues to set new records in terms of revenues, operating profits and new unit development. In 2003, we achieved $2.7 billion in revenues, operating profits of $441 million and return on invested capital of 20%.
What’s more, Yum! Restaurants International is a growth engine. We’ve added more than 1,000 new international restaurants a year over the past three years, including 1,108 new international restaurant openings in 2003, our best year yet. We’ve achieved this growth while more than doubling our operating profits since Yum! Brands became a public company in 1997.
We believe that no other restaurant company has the kind of opportunity that we do outside of the United States. We continue to focus our international company operations investment in seven key countries that account for over 70% of our international operating profit. Each of these markets is well established with powerful brands, powerful local teams and even more powerful growth potential. Our franchise and joint venture partners are driving system growth by opening more than 70% of our new international restaurants. They are using their capital, not ours, because they also see the tremendous growth potential of our global brands.
With over 12,000 units in over 100 countries and territories generating 22% operating profit growth, it’s easy to see why our international business truly is a global powerhouse.
China $157MM
UK
$97MM
Australia/New Zealand $44MM
South Korea$33MM
Mexico$10MM
Yum! Restaurants International continues to be our Growth Engine!Operating Profi ts (in dollars)
Pete Bassi, Chairman, Yum! Restaurants International
10.

rising star
China continues to be our Rising Star, driving double-digit sales growth for the fifth consecutive year and record operating profit up over 42% in 2003.
Since opening the first KFC restaurant in Beijing in 1987, China continues to be the rising star of our international business.In 2003, we celebrated the opening of our 120th Pizza Hut restaurant and recently, the opening of our 1,000th KFC — and wecontinue to add over 200 restaurants a year. KFC is the leading restaurant brand in China and is widening the gap betweenour nearest competitor. In fact, a J.D. Powers survey two years ago rated KFC as the leading brand in any category — among every company doing business in China! And we’re proud Pizza Hut also has become the leader in the casual dining category.We also opened our first Taco Bell Grande restaurant in 2003, introducing the Chinese people to the great taste of Mexicanfood! All of this progress, and we aren’t even close to reaching our full potential there. There’s no doubt in our mind thatChina is going to be a global economic powerhouse for the longer term. In fact, we want to be the dominant Quick ServiceRestaurant leader in every major category in China, and we have the infrastructure and the leaders to make sure that ourstar continues to rise!
Asia has become a dominant market-place for Yum! Brands products. While Pizza Hut and KFC are long-time players in Asia, Taco Bell strengthened its position in the market in May 2003 with the opening of its fi rst Taco Bell in China — a table-service restaurant called Taco Bell Grande.
Above right: Sam Su (center), President, Yum! Restaurants China, helps celebrate the 1,000th KFC in that country.
11.

“brand

power””x5

“ Think Outside the Bun.”
14.

2003 was another solid year for Taco Bell —filled with terrific products and results. Our Customer Mania culture helped drive company same-store sales growth of 2% — and for the first time — our system average unit volume exceeded $1,000,000.
Mexican-inspired products like our delicious tacos, filling burritos, signature quesadillas, and innovative Border Bowls® had customers coming back for that “Taco Bell taste” you can’t get anywhere else. And 2004 promises some great specialty items as part of our new Big Bell Value Menu.
The Taco Bell team is also delighting our customers with a more consistent, satisfying experience every time they visit — and we’re seeing particular progress during Late Night. We’re proud of the fact that QSR Magazine rated us second in the overall drive-thru experience in their 2003 Drive-Thru Survey. And even our internal operations measurement — or
CHAMPS performance — tells us that we’re on the right track and providing a more consistent customer experience.
We’re thrilled to see our customer compliments up 59% over last year — and our employees are telling us they’re more satis-fied as well! In fact, we’re proud our team member turnover is down to 107% in 2003 from 221% in 2001.
I hope you’ll agree we’ve made solid progress this year, but we believe many opportunities remain — and we’re committed to even better results in 2004. It’s our passion around People Capability, Operations Excellence, Innovative Products and Marketing, that will entice more and more hungry customers to Think Outside the Bun!
®
Emil Brolick President and Chief Concept Offi cer, Taco Bell
15.

“ Gather ’Round the Good Stuff.”
Despite a challenging environment in 2003, Pizza Hut made steady progress in the second half of the year by growing company same-store sales in seven of the last eight periods. This was due, in large part, to the success of a brand new and exciting marketing campaign that invites our customers to “Gather ’Round the Good Stuff™.”
Our new advertising, products and promotions reinforce that we’re the family pizza company for nearly 50 million Pizza Hut customers each week. In 2003, we introduced family-friendly products like our first-to-market, lower fat Fit ’N Delicious™ pizzas. And we launched some family-focused promotions, like our DVD offer with every pizza purchase at menu price... giving our customers another fun way to gather around our delicious pizzas. We also tested a range of new products that we’ll take
to market in 2004, like the recently launched 4ForAll® pizza, offering four separate pizzas in one box.
I’m also proud Pizza Hut achieved the lowest team member turnover in the industry, at 99.6%. Our leaders have made great strides in delivering 100% CHAMPS with a Yes! attitude to each of our customers, and the results are not going unnoticed. In fact, customers in the 2003 Customer Satisfaction report from the University of Michigan rated Pizza Hut 7% better than in 2002. We’re going to keep working hard to convince more and more customers to “Gather ’Round the Good Stuff™” with Pizza Hut pizzas.
Peter Hearl President and Chief Concept Offi cer, Pizza Hut
16.

17.

KFC What’s Cookin’
18.

2003 was a challenging year for KFC. Early in the year we had some success with Honey BBQ Boneless Wings, which drove same-store sales by 6%, however our sales for the balance of the year declined. After listening to the voice of our customers, we have iden-
tified the critical issues that have caused our customers to visit us less frequently. Simply put, our customers told us we need to be more Relevant, and more Reliable. We’re going to respond by working hard to rebuild that trust, and re-earn customer loyalty. We have a plan in place for a fresh, exciting KFC, one that our customers will consider Relevant and Reliable. We began that journey toward the end of the year by introducing ads that invite our customers to KFC What’s Cookin’, which got people talking about our unbeatable fried chicken. We then were named as one of the top 10 fastest drive-thru restaurants in America by QSR Magazine, a major win on the operations front. Building
on this momentum, in 2004 we will be introducing new, deli-cious non-fried products, outstanding value meals, better-run restaurants, new menu boards and improved product packaging. And we’re not going to stop there….You’ll see a whole new advertising campaign that will remind our customers that our fried chicken is kitchen-fresh. And one of America’s hottest race car drivers, Dale Earnhardt Jr., will be behind the wheel of the new KFC car, convincing our customers to rush to KFC this summer for our Finger Lickin’ Good fried chicken.
As you can see, there’s a lot cookin’ at KFC.
Gregg DedrickPresident and Chief Concept Offi cer, KFC
19.

“ Surfs up... Time for a Frosty Float.”
20.

Surf’s Up. Long John Silver’s is the clear leader in quick-service seafood, with a commanding 35% category share. We plan to dive in to even bigger growth through multibranding, which will make
us a true national powerhouse.
We drove our U.S. company same-store sales growth 3% in 2003 and will be the key multibrand partner for the other Yum! brands going forward. In fact, Long John Silver’s will be the multibrand partner in about one half of the 500 multibrand additions which we expect will open in 2004. This “Fish First” strategy gives us a lot of new opportunities for future growth.
In 2003, our Fish and Shrimp Treasure Chest Family Meal was a huge success, increasing sales of our family meals by 22%. We also set an all-time weekly sales record for the Lenten season — $17,000 per restaurant — the highest weekly salesin our brand’s history! And we made it easier to eat our shrimp on the go with our new Bucket of Crunchy Shrimp
promotion. We’re proud of our heritage of offering signaturebatter-dipped products to millions of seafood lovers for nearly35 years. With multibranding, the Surf’s Up! to create shrimpand seafood excitement in the years ahead.
A&W All American Food has been offering our signature frosty root beer floats, 100%pure beef hamburgers, French fries, onionrings and chili dogs for nearly 85 years.
When you’re the longest-running quick service restaurant chainin the country, folks have lots of fond memories of A&W. Today,as a multibranding growth partner, we offer our delicious foodas “Hometown American Favorites Made Fun.” We’re capital-izing on our nostalgia by inviting our customers to come in andring our bell every time our teammates deliver on our CustomerMania Promise. And if you haven’t tasted one of our frosty rootbeer floats lately, drop by your hometown A&W to rediscoverhow sweet it can be!
Steve DavisPresident and Chief Executive Offi cer, Long John Silver’s, Inc. and Chief Executive Offi cer, A&W Restaurants, Inc.
21.

22.
“popow
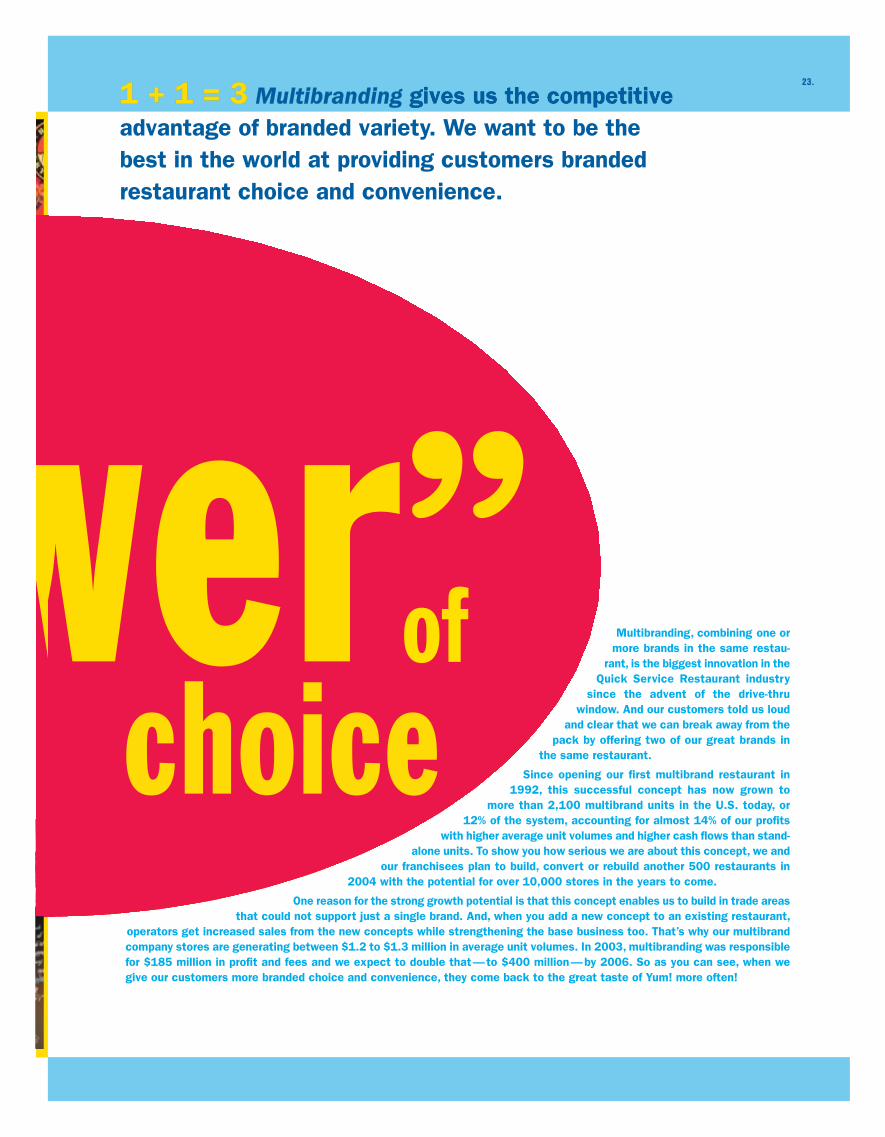
Multibranding, combining one ormore brands in the same restau-
rant, is the biggest innovation in the Quick Service Restaurant industry
since the advent of the drive-thruwindow. And our customers told us loud
and clear that we can break away from thepack by offering two of our great brands in
the same restaurant.
Since opening our first multibrand restaurant in 1992, this successful concept has now grown to
more than 2,100 multibrand units in the U.S. today, or12% of the system, accounting for almost 14% of our profits
with higher average unit volumes and higher cash flows than stand-alone units. To show you how serious we are about this concept, we and
our franchisees plan to build, convert or rebuild another 500 restaurants in 2004 with the potential for over 10,000 stores in the years to come.
One reason for the strong growth potential is that this concept enables us to build in trade areas that could not support just a single brand. And, when you add a new concept to an existing restaurant,
operators get increased sales from the new concepts while strengthening the base business too. That’s why our multibrandcompany stores are generating between $1.2 to $1.3 million in average unit volumes. In 2003, multibranding was responsiblefor $185 million in profit and fees and we expect to double that — to $400 million — by 2006. So as you can see, when wegive our customers more branded choice and convenience, they come back to the great taste of Yum! more often!
1 + 1 = 31 + 1 = 3 Multibranding gives us the competitive gives us the competitive gives us the competitive advantage of branded variety. We want to be the best in the world at providing customers branded restaurant choice and convenience.
23.
wwerer”” of ofchoicechoice

customer mania wpow“

wer”w

We think we have the
most talented Customer Maniacsin the industry. Meet some of them!
Top, left to right: Van Hang, Ramona Macias
Middle: Roxie Padot, Jeff Stricklin,
Brenda Lederer Bottom: Mitch McCulloch
Speed
Cleanliness
Accuracy
Product Quality
Hospitality
Maintenance
26.

Our formula for success is simple: put people capability first. When we do that, we’ll satisfy our customers better than anyone and generate more profits.
Around the globe, Building People Capability means we’re driving our Customer Mania culture deep to our restaurant teams and operating systems through 100% CHAMPS with a Yes! — our signature program of Customer Mania training and employee recognition. Everything we do — from hiring and training, to developing and retaining our leaders — is done with one purpose in mind: be the best at satisfying our customers better than anyone else. On these two pages, please meet some of the very best Customer Maniacs in the world!
Cleanliness Sparkle. That’s what Roxie Padot’s restaurant does. With 28 perfect 100% CHAMPS scores in a row, this 22-year veteran knows how to run great restaurants. During her career that started as a cashier, Roxie has developed a real Customer Mania focus for keeping her customers happy and her store clean. She drives that home to her team with three-times-a-day CHAMPS Alert checks. She agrees with the Colonel, “If you have time to lean, you have time to clean.” Roxie Padot, Restaurant General Manager, KFC, AJS Associates franchisee
Hospitality “Come on in, we’re family here.” It’s easy to see RGM Brenda Lederer’s approach to her customers and team when they’re in her restaurant. This 16-year veteran sees the people in her restaurant as more than an order — they are her friends. With a near perfect score on her CHAMPS review and a 4% same-store sales increase in 2003, you can tell that this Customer Maniac loves being in her restaurant. Brenda Lederer, Restaurant General Manager, A&W All American Food, Larry Blakley franchisee
Accuracy “Accuracy is a team effort,” says RGM Ramona Macias. “Everyone has to get it right.” That’s why Ramona uses her Customer Mania training to keep her team focused on their individual roles in satisfying customers. She rewards team members with lots of praise and everyone in her restaurant — from cooks to cashiers — is cross-trained so they can fill a void at a moment’s notice. With an overall CHAMPS score of 99% and sales up nearly 6% in 2003, you can see it’s a true team effort. Ramona Macias, Restaurant General Manager, Long John Silver’s
Maintenance RGM Mitch McCulloch knows that well- maintained equipment means delicious pizzas every time. And to prove it, Mitch and his team have been driving strong, double-digit sales growth in 2003. He says the perfect scores his restaurant repeatedly earns on Maintenance are a direct result of keeping everybody in the restaurant involved. Mitch posts a checklist that moni-tors not just the food supply but also keeps track of the equipment. That’s how he and his team repeatedly put smiles on their customers’ faces! Mitch McCulloch, Restaurant General Manager, Pizza Hut, High Plains Pizza franchisee
Product Quality “Yum!” RGM Jeff Stricklin’s customers say that again and again. It must be why Jeff’s same-store sales were up an incredible 20% in 2003. He and his Taco Bell team recorded 16 perfect consecutive 100% CHAMPS scores in a row — and he’s still going! That’s over a year of satisfying customers with delicious food in a great environment. In just two short years, Jeff has turned his Taco Bell into one of the top performers in the country. How did he do it? By driving a passionate Customer Mania culture and placing a strong emphasis on delicious product — every time! Jeff Stricklin, Restaurant General Manager, Taco Bell
Speed Don’t blink. Because RGM Van Hang makes things happen in his restaurant — fast. Among the top 2% of all Pizza Hut operators, Van closed out 2003 with same-store sales up 4% and an overall CHAMPS score of 93%. Van’s restaurant can be a very busy place, and he credits the intensity of his team — many who’ve been there for 10–14 years — in keeping things running smooth and fast. Now, there are some dedicated Customer Maniacs! Van Hang, Restaurant General Manager, Pizza Hut
Anne ByerleinChief People Offi cerYum! Brands, Inc.
27.

At Yum! Brands we’re building an operating culture of 840,000 Customer Maniacs with one purpose: satisfying our customers better than any other restaurant company. The true power of Running Great Restaurants is in giving a trusted customer experience — each and every time. To do that, we must live and breathe 100% CHAMPS with a Yes! attitude. When you are a customer in our restaurants, we want you to receive every letter of CHAMPS: Cleanliness, Hospitality, Accuracy, Maintenance, Product Quality and Speed. If we miss one of the letters, your service isn’t as good as it should be.
This is the beginning of our fourth year of utilizing our operational framework, and we are beginning our third year of customer and sales mania training each quarter in every restaurant. Our Chief Operating Officers are fully vested in driving our operational culturedeep into each of our companies. We recognize that it is our daily leadership intentionsaround the basics that will allow us to achieve the Run Great Restaurant vision.
I’m proud of the progress we made in 2003: Our CHAMPS scores are increasing and our customer complaints are down. Our external measures are beginning to improve and italso shows in our people. Our turnover rates are among the lowest in the industry andwe are more confident than ever that a stable environment is so important to continueto drive our Run Great Restaurant mission around the globe.
While we still have work to do to fulfill our vision of being the best restaurant opera-tors in the industry, our path to greatness is very clear. Hire, train and promote onlyCustomer Maniacs. Execute the basics with passion and urgency. Lead and coach eachrestaurant in a one-system fashion as if it were our only one. We know that when weexecute 100% CHAMPS with a Yes! attitude, our people become an unstoppable forcefor growing the business
Aylwin B. LewisPresident, Chief Multibranding and Operating OfficerYum! Brands, Inc.
Aylwin B. LewisPresident, Chief Multibranding and Operating OfficerYum! Brands, Inc.
Customer Mania means delivering 100% CHAMPS with a Yes! attitude every day. It’s the smile on our face and the smile in our voice. It’s putting the customer fi rst in everything we do.When we do that, our people become an unstoppable force for growing the business.
Running Great Restaurants
100% CHAMPS with a Yes! and Same-Store Sales Growth in Every Store
28.

®
•Dinner 59% •Lunch 34% •Dine Out 80%•Snacks/Breakfast 7% •Dine In 20%
U.S. Sales by Daypart U.S. Sales by Distribution Channel
•Dinner 64% •Lunch 27% •Dine Out 72%•Snacks/Breakfast 9% •Dine In 28%
•Dinner 43% •Lunch 45% •Dine Out 73%•Snacks/Breakfast 12% •Dine In 27%
•Dinner 54% •Lunch 40% •Dine Out 58%•Snacks/Breakfast 6% •Dine In 42%
•Dinner 27% •Lunch 49% •Dine Out 43%•Snacks/Breakfast 24% •Dine In 57%
Source: Crest
Yum! At-a-glance29.

International Operating Profit by Key MarketYear ended 2003 (in millions)
China $ 157Franchise Markets(b) 109Japan/Canada 60U.K. 97Australia/New Zealand 44South Korea 33Other 21Mexico 10Future Growth Markets(c) (30)Headquarters General & Administrative Costs (60)
$ 441
China 12%
Franchise Markets(b) 28%
Japan/Canada 20%
U.K. 15%
Australia/New Zealand 9%
South Korea 4%
Other 7%
Mexico 3%
Future Growth Markets(c) 2%
International System Sales(a) by Key MarketYear ended 2003
Global Facts
(a) System sales represents the combined sales of Company, unconsolidated affiliates, franchise and license restaurants.
(b) Includes franchise-only markets in the remainder of Asia, Continental Europe, Carribean/Latin America, Middle East/Southern Africa.
(c) Includes KFC Germany, KFC Netherlands, KFC France, KFC Brazil and India.
Worldwide Sales(in billions) 5-year
2003 2002 2001 2000 1999 growth(a)
United States
KFC Company sales $ 1.4 $ 1.4 $ 1.4 $ 1.4 $ 1.5 (3%) Franchisee sales(b) 3.5 3.4 3.3 3.0 2.8 7%
Pizza Hut Company sales $ 1.6 $ 1.5 $ 1.5 $ 1.8 $ 2.1 (8%) Franchisee sales(b) 3.5 3.6 3.5 3.2 2.9 8%
Taco Bell Company sales $ 1.6 $ 1.6 $ 1.4 $ 1.4 $ 1.6 (5%) Franchisee sales(b) 3.8 3.6 3.5 3.7 3.6 4%
Long John Silver’s(c) Company sales $ 0.5 $ 0.3 NM Franchisee sales(b) 0.3 0.2 NM
A&W(c) Company sales $ — $ — NM Franchisee sales(b) 0.2 0.2 NM
Total U.S. Company sales $ 5.1 $ 4.8 $ 4.3 $ 4.6 $ 5.2 (5%) Franchisee sales(b) 11.3 11.0 10.3 9.9 9.3 6%
International
KFC Company sales $ 1.7 $ 1.5 $ 1.2 $ 1.1 $ 1.1 8% Franchisee sales(b) 4.6 3.9 3.8 3.9 3.5 10%
Pizza Hut Company sales $ 0.6 $ 0.6 $ 0.6 $ 0.6 $ 0.7 (1%) Franchisee sales(b) 2.4 2.2 2.0 2.0 1.9 6%
Taco Bell Company sales $ — $ — $ — $ — $ — NM Franchisee sales(b) 0.1 0.2 0.1 0.1 0.1 3%
Long John Silver’s(c) Company sales $ — $ — NM Franchisee sales(b) — — NM
A&W(c) Company sales $ — $ — NM Franchisee sales(b) 0.1 — NM
Total International Company sales $ 2.3 $ 2.1 $ 1.8 $ 1.7 $ 1.8 5% Franchisee sales(b) 7.2 6.3 5.9 6.0 5.5 8%
Worldwide
Company sales $ 7.4 $ 6.9 $ 6.1 $ 6.3 $ 7.0 (3%) Franchisee sales(b) 18.5 17.3 16.2 15.9 14.8 7%
(a) Compounded annual growth rate; totals for U.S., International and Worldwide exclude the impact of Long John Silver’s and A&W.
(b) Franchisee sales represents the combined estimated sales of unconsolidated affiliate and franchise and license restaurants. Franchisee sales, which are not included in our Company sales, generate franchise and license fees (typically at rates between 4% and 6%) that are included in our revenues.
(c) Beginning May 7, 2002, includes Long John Silver’s and A&W, which were added when we acquired Yorkshire Global Restaurants, Inc.
30.
China has achieved
double-digit system sales
growth for the
fifth consecutive year.

Worldwide System UnitsYear-end 2003 2002 %B(W) change
Company 7,854 7,526 4Unconsolidated affl iates 1,512 2,148 (30)Franchisees 21,471 20,724 4Licensees 2,362 2,526 (6)
Total 33,199 32,924 1
5-year. Year-end 2003 2002 2001 2000 1999 growth.(a)(b)
United StatesKFC 5,524 5,472 5,399 5,364 5,231 2Pizza Hut 7,523 7,599 7,719 7,927 8,084 (2)Taco Bell 5,989 6,165 6,444 6,746 6,879 (3)Long John Silver’s 1,204 1,221 NMA&W 576 665 NM
Total U.S.(c) 20,822 21,126 19,562 20,037 20,194 (1)
InternationalKFC 7,354 6,890 6,416 5,974 5,595 7Pizza Hut 4,560 4,431 4,272 4,157 3,961 3Taco Bell 249 267 239 249 232 2Long John Silver’s 31 28 NMA&W 183 182 NM
Total International 12,377 11,798 10,927 10,380 9,788 5
Total(c) 33,199 32,924 30,489 30,417 29,982 1
(a) Compounded annual growth rate; total U.S., International and Worldwide exclude the impact of Long John Silver’s and A&W.
(b) Compounded annual growth rate excludes the impact of transferring 30 units from Taco Bell U.S. to Taco Bell International in 2002.
(c) Includes 6 and 4 Yan Can units in 2003 and 2002, respectively.
Breakdown of Worldwide System Units UnconsolidatedYear-end 2003 Company Affiliate Franchised Licensed Total
United StatesKFC 1,252 — 4,204 68 5,524Pizza Hut 1,776 — 4,624 1,123 7,523Taco Bell 1,284 — 3,743 962 5,989Long John Silver’s 701 — 502 1 1,204A&W 81 — 493 2 576
Total U.S.(a) 5,094 6 13,566 2,156 20,822
InternationalKFC 1,685 773 4,835 61 7,354Pizza Hut 1,021 733 2,708 98 4,560Taco Bell 54 — 150 45 249Long John Silver’s — — 30 1 31A&W — — 182 1 183
Total International 2,760 1,506 7,905 206 12,377
Total 7,854 1,512 21,471 2,362 33,199
(a) Includes 6 Yan Can units.
Worldwide UnitsYear-end 2003 (in thousands)
33
31
21
11
9
7
6
Yum! Brands
McDonald’s
Subway
Burger King
Wendy’s
Domino’s Pizza
Dairy Queen
Unit Information31.

Financial Highlights
Year-end 2003 2003 2003 2002 2002 2002 % B(W) change % B(W) change % B(W) change
Company sales Company salesCompany sales $ 7,441 $ 7,441 $ 7,441 $ 6,891 $ 6,891 $ 6,891 8 8 8
Franchise and license fees Franchise and license feesFranchise and license fees 939 939 939 866 866 866 9 9 9
Total revenues Total revenuesTotal revenues $ 8,380 $ 7,757 8 $ 7,757 8 $ 7,757 8
Operating profit Operating profitOperating profit $ 1,059 $ 1,030 3 $ 1,030 3 $ 1,030 3
Earnings before special items Earnings before special itemsEarnings before special items $ 628 $ 628$ 628 $ 566 11 $ 566 11 $ 566 11Special items, net of tax Special items, net of taxSpecial items, net of tax (11) 17 17 17 NM NM NM
Net income Net incomeNet income $ 617 $ 617$ 617 $ 583 6 $ 583 6 $ 583 6
Wrench litigation Wrench litigationWrench litigation $ (42) $ (42)$ (42) $ — NM $ — NM $ — NMAmeriServe and other (charges) credits AmeriServe and other (charges) creditsAmeriServe and other (charges) credits 26 27 27 27 NM NM NMCumulative effect of accounting change Cumulative effect of accounting changeCumulative effect of accounting change (2) — — — NM NM NM
Special items Special itemsSpecial items (18) 27 27 27 NM NM NMIncome tax on special items Income tax on special itemsIncome tax on special items 7 (10) (10) (10) NM NM NM
Special items, net of tax Special items, net of taxSpecial items, net of tax $ (11) $ (11)$ (11) $ 17 NM $ 17 NM $ 17 NM
Diluted earnings per common share: Diluted earnings per common share:Diluted earnings per common share:Earnings before special items Earnings before special itemsEarnings before special items $ 2.06 $ 2.06$ 2.06 $ 1.82 13 $ 1.82 13 $ 1.82 13Special items, net of tax Special items, net of taxSpecial items, net of tax (0.04) 0.06 0.06 0.06 NM NM NM
Reported ReportedReported $ 2.02 $ 2.02$ 2.02 $ 1.88 7 $ 1.88 7 $ 1.88 7
Cash flows provided by operating activities Cash flows provided by operating activitiesCash flows provided by operating activities $ 1,053 $ 1,088 (3) $ 1,088 (3) $ 1,088 (3)
Average U.S. Sales per System Unit Average U.S. Sales per System UnitAverage U.S. Sales per System Unit(a)
(In thousands) (In thousands)(In thousands)Year-end Year-endYear-end 2003 2002 2001 2000 2002 2001 2000 2002 2001 2000 1999 5-year growth 1999 5-year growth 1999 5-year growth(b)
KFC KFCKFC $ 898 $898$ 898 $ 898 $ 865 $ 833 $898 $865 $833 $ 898 $ 865 $ 833 $ 837 2% $837 2% $ 837 2%Pizza Hut Pizza HutPizza Hut 748 748 724 712 748 724 712 748 724 712 696 3% 696 3% 696 3%Taco Bell Taco BellTaco Bell 1,005 964 890 896 964 890 896 964 890 896 918 2% 918 2% 918 2%
(a) Excludes license units. (a) Excludes license units.(a) Excludes license units.(b) Compounded annual growth rate. (b) Compounded annual growth rate.(b) Compounded annual growth rate.
$1 billion a year in franchise fees. We also continue to focus on our high-return international expansion. Domestically, we are the multibranding leader and with our “Fish First” multi-branding strategy, we are leveraging our Long John Silver’s brand to create greater national scale — nearly tripling our multibranding opportunities. We will also continue to improve our capital spending effectiveness around the globe, paying attention to where we spend our money, how we spend it, and what the returns look like. All in all, we are spending smarterand making sure that with each deci-sion, we’re acting wisely on behalf of our shareholders.
It’s amazing when you think about it. In just seven short yearssince our founding, we lowered our overall debt to $2.1 billionby the end of 2003. That’s down from the $4.7 billion worth of debt we started out with in the fall of 1997. Meanwhile, we have significantly grown our cash flow and realized high returns on invested capital thanks mainly to the strong performance of our international business. In fact, we’ve moved from having one of the lowest returns on invested capital — 8% — in 1997, to having today one of the highest returns in the quick service restaurant industry — 18%. How did we do it? As you’ve read in this Report, we have established a global operating culture with the platforms and systems in place to execute our base business better and better. And our focus on daily leadership around these tools is paying off. Our metrics are improving: We’re driving restaurant margins and same-store sales growth. In addition, we continue to focus on new franchise development without having to invest any of our own capital. We receive nearly
Dave Deno, Chief Financial Offi cerYum! Brands, Inc.
(In millions, except per share amounts) (In millions, except per share amounts)(In millions, except per share amounts)
32.
““powerpower””resultsofof

Yum! Brands Inc. 33.Management’s Discussion and Analysis of Financial Conditionand Results of Operations
INTRODUCTION AND OVERVIEWYUM! Brands, Inc. and Subsidiaries (collectively referred to as “YUM” or the “Company”) comprises the worldwide operations of KFC, Pizza Hut, Taco Bell, Long John Silver’s (“LJS”) and A&W All-American Food Restaurants (“A&W”) (collectively “the Concepts”) and is the world’s largest quick service restaurant (“QSR”) company based on the number of system units. LJS and A&W were added when YUM acquired Yorkshire Global Restaurants, Inc. (“YGR”) on May 7, 2002. With 12,377 international units, YUM is the second largest QSR company outside the U.S. YUM became an independent, publicly-owned company on October 6, 1997 (the “Spin-off Date”) via a tax-free distribu-tion of our Common Stock (the “Distribution” or “Spin-off”) to the shareholders of our former parent, PepsiCo, Inc. (“PepsiCo”).
Through its Concepts, YUM develops, operates, franchises and licenses a system of both traditional and non-traditional QSR restaurants. Traditional units feature dine-in, carryout and, in some instances, drive-thru or delivery services. Non-traditional units, which are typically licensed outlets, include express units and kiosks which have a more limited menu and operate in non-traditional locations like malls, airports, gasoline service stations, convenience stores, stadiums, amusement parks and colleges, where a full-scale traditional outlet would not be practical or efficient.
The retail food industry, in which the Company competes, is made up of supermarkets, supercenters, warehouse stores, convenience stores, coffee shops, snack bars, delicatessens and restaurants (including the QSR segment), and is intensely competitive with respect to food quality, price, service, convenience, location and concept. The industry is often affected by changes in consumer tastes; national, regional or local economic condi-tions; currency fluctuations; demographic trends; traffic patterns; the type, number and location of competing food retailers and products; and disposable purchasing power. Each of the Concepts competes with international, national and regional restaurant chains as well as locally-owned restaurants, not only for customers, but also for manage-ment and hourly personnel, suitable real estate sites and qualified franchisees.
The Company is focused on five long-term measures identified as essential to our growth and progress. These five measures and related key performance indicators are as follows:
International expansion• International system-sales growth (local currency)• Number of new international restaurant openings• Net international unit growth
Multibrand innovation and expansion• Number of multibrand restaurant locations• Number of multibrand units added• Number of franchise multibrand units added
Portfolio of category-leading U.S. brands• U.S. blended same-store sales growth• U.S. system-sales growth
Global franchise fees• New restaurant openings by franchisees• Franchise fee growth
Strong cash generation and returns• Cash generated from all sources• Cash generated from all sources after capital
spending• Restaurant marginsOur progress against these measures is discussed
throughout the Management’s Discussion and Analysis (“MD&A”).
All references to per share and share amounts in the following MD&A have been adjusted to reflect the two-for-one stock split distributed on June 17, 2002.
This MD&A should be read in conjunction with our Consolidated Financial Statements on pages 48 through 51 and the Cautionary Statements on page 47. All Note references herein refer to the Notes to the Consolidated Financial Statements on pages 52 through 74. Tabular amounts are displayed in millions except per share and unit count amounts, or as otherwise specifically identified.
FACTORS AFFECTING COMPARABILITY OF 2003 RESULTS TO 2002 RESULTS AND 2002 RESULTS TO 2001 RESULTS
YGR AcquisitionOn May 7, 2002, the Company completed its acquisition of YGR, the parent company of LJS and A&W. See Note 4 for a discussion of the acquisition.
As of the date of the acquisition, YGR consisted of 742 and 496 company and franchise LJS units, respectively, and 127 and 742 company and franchise A&W units, respec-tively. In addition, 133 multibranded LJS/A&W restaurants were included in the LJS unit totals. Except as discussed in certain sections of the MD&A, the impact of the acquisition on our results of operations in 2003 and 2002 was not significant relative to the comparable prior year period.
Amendment of Sale-Leaseback AgreementsAs discussed in Note 14, on August 15, 2003 we amended two sale-leaseback agreements assumed in our 2002 acquisition of YGR such that the agreements now qualify for sale-leaseback accounting. There was no gain or loss recorded as a result of this transaction; however, restau-rant margins decreased by approximately $3 million for the year ended December 27, 2003 as a result of the two amended agreements being accounted for as operating leases subsequent to the amendment. The decrease in restaurant margin was largely offset by a similar decrease in interest expense.

34.
Wrench LitigationWe recorded expense of $42 million in 2003. See Note 24 for a discussion of the Wrench litigation.
AmeriServe and Other Charges (Credits)We recorded income of $26 million in 2003, $27 million in 2002 and $3 million in 2001. See Note 7 for a detailed discussion of AmeriServe and other charges (credits).
Store Portfolio StrategyFrom time to time we sell Company restaurants to existing and new franchisees where geographic synergies can be obtained or where their expertise can generally be lever-aged to improve our overall operating performance, while retaining Company ownership of key U.S. and International markets. Such refranchisings reduce our reported Company sales and restaurant profits while increasing our franchise fees. Proceeds from refranchising increase the level of cash available to fund discretionary spending.
The following table summarizes our refranchising activities: 2003 2002 2001
Number of units refranchised 228 174 233Refranchising proceeds, pre-tax $ 92 $ 81 $ 111Refranchising net gains, pre-tax(a) $ 4 $ 19 $ 39(a) 2003 includes charges of approximately $16 million to write down the carrying
value of our Puerto Rican business to reflect the then current estimates of its fair value. The charges were recorded as a refranchising loss. 2001 includes $12 million of previously deferred refranchising gains and a charge of $11 million to mark to market the net assets of our Singapore business, which was sold during 2002 at a price approximately equal to its carrying value.
In addition to our refranchising program, from time to time we close restaurants that are poor performing, we relocate restaurants to a new site within the same trade area or we consolidate two or more of our existing units into a single unit (collectively “store closures”).
The following table summarizes Company store closure activities: 2003 2002 2001
Number of units closed 287 224 270Store closure costs $ 6 $ 15 $ 17Impairment charges for stores
to be closed $ 12 $ 9 $ 5
The impact on operating profit arising from our refranchising and Company store closures is the net of (a) the estimated reduction in restaurant profit, which reflects the decrease in Company sales, and general and administrative expenses and (b) the estimated increase in franchise fees from the stores refranchised. The amounts presented below reflect the estimated impact from stores that were operated by us for all or some portion of the respective previous year and were no longer operated by us as of the last day of the respective year. The amounts do not include results from new restaurants that we open in connection with a relocation of an existing unit or any incremental impact upon consolidation of two or more of our existing units into a single unit.
The following table summarizes the estimated impact on revenue of refranchising and Company store closures:
2003 Inter- U.S. national Worldwide
Decreased sales $ (148) $ (120) $ (268)Increased franchise fees 1 5 6
Decrease in total revenues $ (147) $ (115) $ (262)
2002 Inter- U.S. national Worldwide
Decreased sales $ (214) $ (90) $ (304)Increased franchise fees 4 4 8
Decrease in total revenues $ (210) $ (86) $ (296)
The following table summarizes the estimated impact on operating profit of refranchising and Company store closures: 2003 Inter- U.S. national Worldwide
Decreased restaurant profit $ (18) $ (15) $ (33)Increased franchise fees 1 5 6Decreased general and
administrative expenses — 6 6
Decrease in operating profit $ (17) $ (4) $ (21)
2002 Inter- U.S. national Worldwide
Decreased restaurant profit $ (23) $ (5) $ (28)Increased franchise fees 4 4 8Decreased general and
administrative expenses 1 2 3
(Decrease) increase in operating profit $ (18) $ 1 $ (17)
Impact of Recently Adopted Accounting PronouncementEffective December 30, 2001, the Company adopted Statement of Financial Accounting Standards (“SFAS”) No. 142, “Goodwill and Other Intangible Assets” (“SFAS 142”), in its entirety. In accordance with the requirements of SFAS 142, we ceased amortization of goodwill and indefinite-lived intangibles as of December 30, 2001. The following table summarizes the favorable effect of SFAS 142 on restaurant profit, restaurant margin and operating profit had SFAS 142 been effective in 2001.
Year Ended December 29, 2001 Inter- U.S. national Worldwide
Restaurant profit $ 21 $ 11 $ 32
Restaurant margin (%) 0.5 0.6 0.5
Operating profit $ 22 $ 16 $ 38
Yum! Brands Inc. 35.
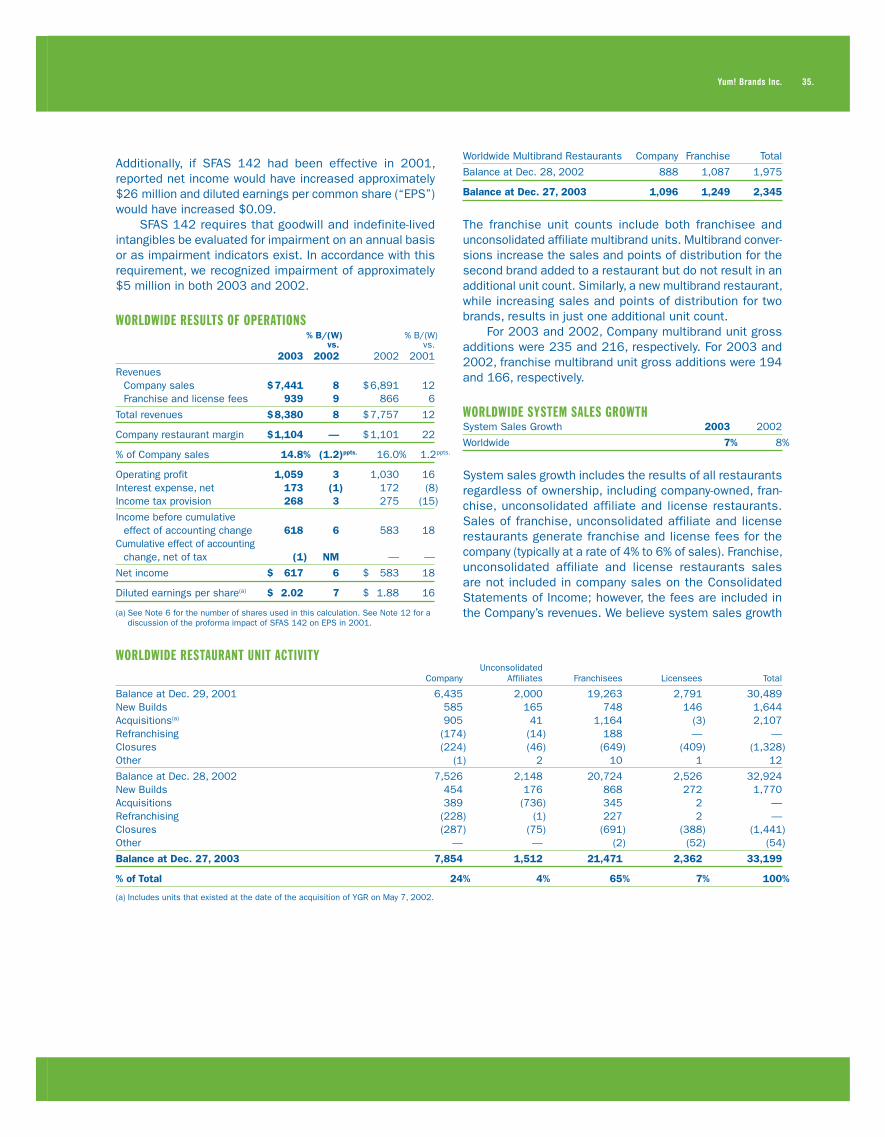
Additionally, if SFAS 142 had been effective in 2001, reported net income would have increased approximately $26 million and diluted earnings per common share (“EPS”) would have increased $0.09.
SFAS 142 requires that goodwill and indefinite-lived intangibles be evaluated for impairment on an annual basis or as impairment indicators exist. In accordance with this requirement, we recognized impairment of approximately $5 million in both 2003 and 2002.
WORLDWIDE RESULTS OF OPERATIONS % B/(W) % B/(W) vs. vs. 2003 2002 2002 2001
Revenues Company sales $ 7,441 8 $ 6,891 12 Franchise and license fees 939 9 866 6
Total revenues $ 8,380 8 $ 7,757 12
Company restaurant margin $ 1,104 — $ 1,101 22
% of Company sales 14.8% (1.2)ppts. 16.0% 1.2)ppts.
Operating profit 1,059 3 1,030 16Interest expense, net 173 (1) 172 (8)Income tax provision 268 3 275 (15)
Income before cumulative effect of accounting change 618 6 583 18
Cumulative effect of accounting change, net of tax (1) NM — —
Net income $ 617 6 $ 583 18
Diluted earnings per share(a) $ 2.02 7 $ 1.88 16
(a) See Note 6 for the number of shares used in this calculation. See Note 12 for a discussion of the proforma impact of SFAS 142 on EPS in 2001.
WORLDWIDE RESTAURANT UNIT ACTIVITY Unconsolidated Company Affiliates Franchisees Licensees Total
Balance at Dec. 29, 2001 6,435 2,000 19,263 2,791 30,489New Builds 585 165 748 146 1,644Acquisitions(a) 905 41 1,164 (3) 2,107Refranchising (174) (14) 188 — —Closures (224) (46) (649) (409) (1,328)Other (1) 2 10 1 12
Balance at Dec. 28, 2002 7,526 2,148 20,724 2,526 32,924New Builds 454 176 868 272 1,770Acquisitions 389 (736) 345 2 —Refranchising (228) (1) 227 2 —Closures (287) (75) (691) (388) (1,441)Other — — (2) (52) (54)
Balance at Dec. 27, 2003 7,854 1,512 21,471 2,362 33,199
% of Total 24% 4% 65% 7% 100%
(a) Includes units that existed at the date of the acquisition of YGR on May 7, 2002.
Worldwide Multibrand Restaurants Company Franchise Total
Balance at Dec. 28, 2002 888 1,087 1,975
Balance at Dec. 27, 2003 1,096 1,249 2,345
The franchise unit counts include both franchisee and unconsolidated affiliate multibrand units. Multibrand conver-sions increase the sales and points of distribution for the second brand added to a restaurant but do not result in an additional unit count. Similarly, a new multibrand restaurant, while increasing sales and points of distribution for two brands, results in just one additional unit count.
For 2003 and 2002, Company multibrand unit gross additions were 235 and 216, respectively. For 2003 and 2002, franchise multibrand unit gross additions were 194 and 166, respectively.
WORLDWIDE SYSTEM SALES GROWTHSystem Sales Growth 2003 2002
Worldwide 7% 8%
System sales growth includes the results of all restaurants regardless of ownership, including company-owned, fran-chise, unconsolidated affiliate and license restaurants. Sales of franchise, unconsolidated affiliate and license restaurants generate franchise and license fees for the company (typically at a rate of 4% to 6% of sales). Franchise, unconsolidated affiliate and license restaurants sales are not included in company sales on the Consolidated Statements of Income; however, the fees are included in the Company’s revenues. We believe system sales growth
36.
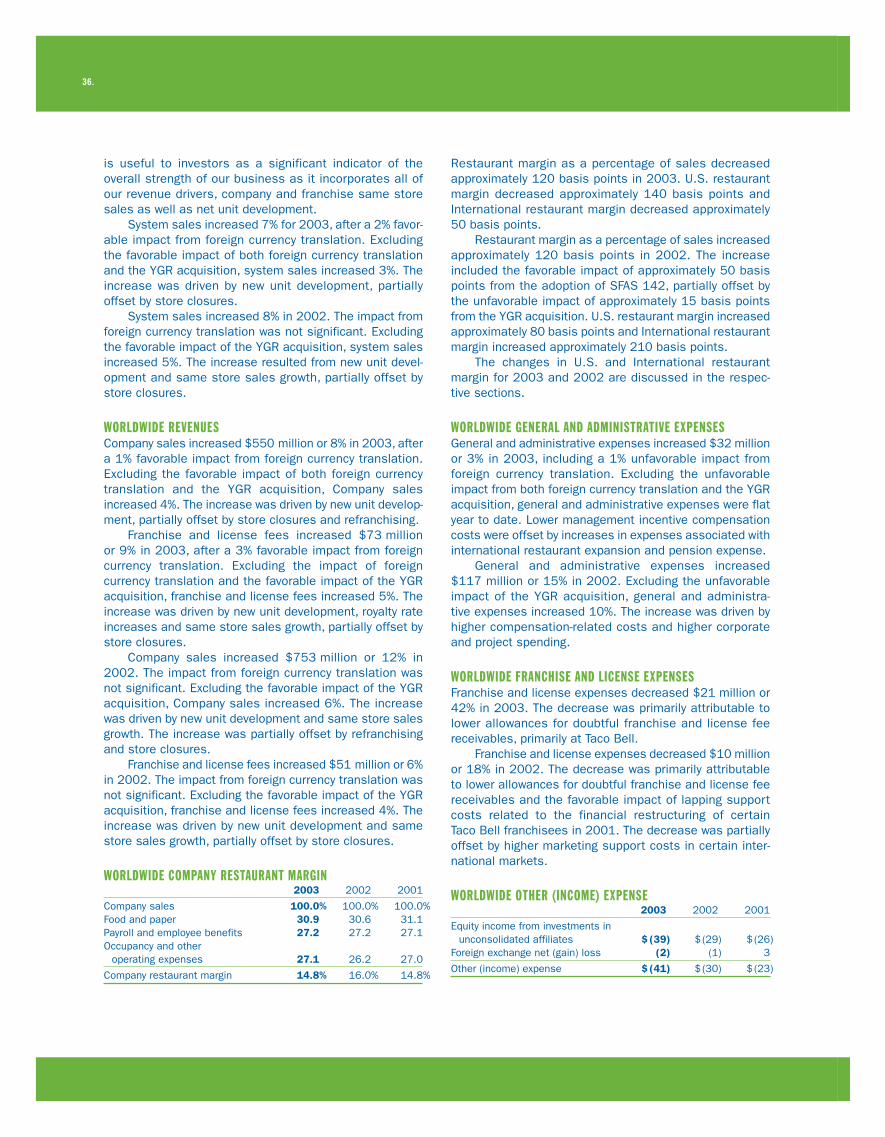
is useful to investors as a significant indicator of the overall strength of our business as it incorporates all of our revenue drivers, company and franchise same store sales as well as net unit development.
System sales increased 7% for 2003, after a 2% favor-able impact from foreign currency translation. Excluding the favorable impact of both foreign currency translation and the YGR acquisition, system sales increased 3%. The increase was driven by new unit development, partially offset by store closures.
System sales increased 8% in 2002. The impact from foreign currency translation was not significant. Excluding the favorable impact of the YGR acquisition, system sales increased 5%. The increase resulted from new unit devel-opment and same store sales growth, partially offset by store closures.
WORLDWIDE REVENUESCompany sales increased $550 million or 8% in 2003, after a 1% favorable impact from foreign currency translation. Excluding the favorable impact of both foreign currency translation and the YGR acquisition, Company sales increased 4%. The increase was driven by new unit develop-ment, partially offset by store closures and refranchising.
Franchise and license fees increased $73 million or 9% in 2003, after a 3% favorable impact from foreign currency translation. Excluding the impact of foreign currency translation and the favorable impact of the YGR acquisition, franchise and license fees increased 5%. The increase was driven by new unit development, royalty rate increases and same store sales growth, partially offset by store closures.
Company sales increased $753 million or 12% in 2002. The impact from foreign currency translation was not significant. Excluding the favorable impact of the YGR acquisition, Company sales increased 6%. The increase was driven by new unit development and same store sales growth. The increase was partially offset by refranchising and store closures.
Franchise and license fees increased $51 million or 6% in 2002. The impact from foreign currency translation was not significant. Excluding the favorable impact of the YGR acquisition, franchise and license fees increased 4%. The increase was driven by new unit development and same store sales growth, partially offset by store closures.
WORLDWIDE COMPANY RESTAURANT MARGIN 2003 2002 2001
Company sales 100.0% 100.0% 100.0%Food and paper 30.9 30.6 31.1Payroll and employee benefits 27.2 27.2 27.1Occupancy and other
operating expenses 27.1 26.2 27.0
Company restaurant margin 14.8% 16.0% 14.8%
Restaurant margin as a percentage of sales decreased approximately 120 basis points in 2003. U.S. restaurant margin decreased approximately 140 basis points and International restaurant margin decreased approximately 50 basis points.
Restaurant margin as a percentage of sales increased approximately 120 basis points in 2002. The increase included the favorable impact of approximately 50 basis points from the adoption of SFAS 142, partially offset by the unfavorable impact of approximately 15 basis points from the YGR acquisition. U.S. restaurant margin increased approximately 80 basis points and International restaurant margin increased approximately 210 basis points.
The changes in U.S. and International restaurant margin for 2003 and 2002 are discussed in the respec-tive sections.
WORLDWIDE GENERAL AND ADMINISTRATIVE EXPENSESGeneral and administrative expenses increased $32 million or 3% in 2003, including a 1% unfavorable impact from foreign currency translation. Excluding the unfavorable impact from both foreign currency translation and the YGR acquisition, general and administrative expenses were flat year to date. Lower management incentive compensation costs were offset by increases in expenses associated with international restaurant expansion and pension expense.
General and administrative expenses increased $117 million or 15% in 2002. Excluding the unfavorable impact of the YGR acquisition, general and administra-tive expenses increased 10%. The increase was driven by higher compensation-related costs and higher corporate and project spending.
WORLDWIDE FRANCHISE AND LICENSE EXPENSESFranchise and license expenses decreased $21 million or 42% in 2003. The decrease was primarily attributable to lower allowances for doubtful franchise and license fee receivables, primarily at Taco Bell.
Franchise and license expenses decreased $10 million or 18% in 2002. The decrease was primarily attributable to lower allowances for doubtful franchise and license fee receivables and the favorable impact of lapping support costs related to the financial restructuring of certain Taco Bell franchisees in 2001. The decrease was partially offset by higher marketing support costs in certain inter-national markets.
WORLDWIDE OTHER (INCOME) EXPENSE 2003 2002 2001
Equity income from investments in unconsolidated affiliates $ (39) $ (29) $ (26)
Foreign exchange net (gain) loss (2) (1) 3
Other (income) expense $ (41) $ (30) $ (23)

Yum! Brands Inc. 37.
The increase in other (income) expense in 2003 was primarily driven by the improved operating performance of our unconsolidated affiliates, particularly in China.
WORLDWIDE FACILITY ACTIONSWe recorded a net loss from facility actions of $36 million, $32 million and $1 million in 2003, 2002 and 2001, respectively. See the Store Portfolio Strategy section for more detail of our refranchising and closure activities and Note 7 for a summary of the components of facility actions by reportable operating segment.
WORLDWIDE OPERATING PROFIT % B/(W) % B/(W) vs. vs. 2003 2002 2002 2001
United States $ 812 1 $ 802 15International 441 22 361 19Unallocated and corporate
expenses (179) — (178) (20)Unallocated other income
(expense) (3) NM (1) NMUnallocated facility actions gain 4 NM 19 NMWrench litigation (42) NM — —AmeriServe and other (charges)
credits 26 NM 27 NM
Operating profit $ 1,059 3 $ 1,030 16
The changes in U.S. and International operating profit for 2003 and 2002 are discussed in the respective sections.
Unallocated and corporate expenses increased $1 million in 2003 and $30 million or 20% in 2002. The 2002 increase was primarily driven by higher compensation-related costs and higher corporate and project spending.
Unallocated facility actions comprises refranchising gains (losses) which are not allocated to the U.S. or International segments for performance reporting purposes. See Note 7 for further discussion.
WORLDWIDE INTEREST EXPENSE, NET 2003 2002 2001
Interest expense $ 185 $ 180 $ 172Interest income (12) (8) (14)
Interest expense, net $ 173 $ 172 $ 158
Interest expense increased $5 million or 3% in 2003. Excluding the impact of the YGR acquisition, interest expense decreased 6%. The decrease was primarily due to a decrease in our average debt outstanding.
Interest expense increased $8 million or 5% in 2002. Excluding the impact of the YGR acquisition, interest expense decreased 12%. The decrease was driven by a reduction in our average debt balance partially offset by an increase in our average interest rate. Our average interest rate increased due to a reduction in our variable-rate borrowings using proceeds from the issuance of longer term, fixed-rate notes.
WORLDWIDE INCOME TAXES 2003 2002 2001
Reported Income taxes $ 268 $ 275 $ 241 Effective tax rate 30.2% 32.1% 32.8%
The reconciliation of income taxes calculated at the U.S. federal tax statutory rate to our effective tax rate is set forth below: 2003 2002 2001
U.S. federal statutory tax rate 35.0% 35.0% 35.0%State income tax, net of federal
tax benefit 1.8 2.0 2.1Foreign and U.S. tax effects
attributable to foreign operations (3.6) (2.8) (0.7)Adjustments to reserves and prior years (1.7) (1.8) (1.8)Foreign tax credit amended
return benefit (4.1) — —Valuation allowance additions
(reversals) 2.8 — (1.7)Other, net — (0.3) (0.1)
Effective tax rate 30.2% 32.1% 32.8%
Income taxes and the effective tax rate as shown above reflect tax on all amounts included in our results of opera-tions except for the income tax benefit of approximately $1 million on the $2 million cumulative effect adjustment recorded in the year ended December 27, 2003 due to the adoption of SFAS 143.
The 2003 effective tax rate decreased 1.9 percentage points to 30.2%. The decrease in the effective tax rate was primarily due to a 4.1 percentage point benefit of amending certain prior U.S. income tax returns to claim credit for foreign taxes paid in prior years. The returns were amended upon our determination that it was more beneficial to claim credit for such taxes than to deduct such taxes, as had been done when the returns were originally filed. In future years, we anticipate continuing to claim credit for foreign taxes paid in the then current year, as we have done in 2003 and 2002. However, the amended return benefit recognized in 2003 is non-recurring.
The decrease in the 2003 effective tax rate was partially offset by the recognition of valuation allowances for certain deferred tax assets whose realization is no longer considered more likely than not. The valuation allowances recognized primarily related to deferred tax assets in Mexico and Thailand. See Note 22 for a discussion of valuation allowances.
The 2002 effective tax rate decreased 0.7 percentage points to 32.1%. The decrease in the effective tax rate was primarily due to our claiming credit against our current and future U.S. income tax liability for foreign taxes paid in 2002, as opposed to deducting such taxes on our U.S. income tax returns as was done in 2001. This decrease was partially offset by the impact of lapping valuation allowance reversals recorded in 2001.
In 2003 and 2002, the effective tax rate attributable to foreign operations was lower than the U.S. federal statutory

38.
rate primarily due to the benefit of claiming credit against our current and future U.S. income tax liability for foreign taxes paid.
Adjustments to reserves and prior years include the effects of the reconciliation of income tax amounts recorded in our Consolidated Statements of Income to amounts reflected on our tax returns, including any adjust-ments to the Consolidated Balance Sheets. Adjustments to reserves and prior years also includes changes in tax reserves established for potential exposure we may incur if a taxing authority takes a position on a matter contrary to our position. We evaluate these reserves, including interest thereon, on a quarterly basis to insure that they have been appropriately adjusted for events that we believe may impact our exposure.
U.S. RESULTS OF OPERATIONS % B/(W) % B/(W) vs. vs. 2003 2002 2002 2001
Revenues Company sales $ 5,081 6 $ 4,778 11 Franchise and license fees 574 1 569 5
Total revenues $ 5,655 6 $ 5,347 11
Company restaurant margin $ 739 (3) $ 764 18
% of Company sales 14.6% (1.4)ppts. 16.0% 0.8)ppts.
Operating profit $ 812 1 $ 802 15
U.S. RESTAURANT UNIT ACTIVITY Unconsolidated Company Affiliates.(a) Franchisees Licensees Total
Balance at Dec. 29, 2001 4,284 — 12,733 2,545 19,562New Builds 210 4 233 136 583Acquisitions(b) 899 — 1,001 (3) 1,897Refranchising (47) — 47 — —Closures (153) — (351) (382) (886)Other(c) — — — (30) (30)
Balance at Dec. 28, 2002 5,193 4 13,663 2,266 21,126New Builds 142 3 245 259 649Acquisitions 106 — (108) 2 —Refranchising (150) — 148 2 —Closures (197) (1) (386) (373) (957)Other — — 4 — 4
Balance at Dec. 27, 2003 5,094 6 13,566 2,156 20,822
% of Total 25% — 65% 10% 100%
(a) Represents Yan Can units.
(b) Includes units that existed at the date of the acquisition of YGR on May 7, 2002.
(c) Represents licensee units transferred from U.S. to International.
U.S. Multibrand Restaurants Company Franchise Total
Balance at Dec. 28, 2002 844 973 1,817
Balance at Dec. 27, 2003 1,032 1,116 2,148
For 2003 and 2002, Company multibrand unit gross addi-tions were 222 and 212, respectively. For 2003 and 2002, franchise multibrand unit gross additions were 160 and 153, respectively.
U.S. SYSTEM SALES GROWTHSystem Sales Growth 2003 2002
U.S. 3% 9%
System sales increased 3% for 2003. Excluding the favor-able impact of the YGR acquisition, system sales increased
1%. The increase was driven by new unit development, partially offset by store closures.
System sales increased 9% in 2002. Excluding the favor-able impact of the YGR acquisition, system sales increased 4%. The increase resulted from same store sales growth and new unit development, partially offset by store closures.
U.S. REVENUESCompany sales increased $303 million or 6% in 2003. Excluding the favorable impact of the YGR acquisition, company sales increased 2%. The increase was driven by new unit development, partially offset by store closures and refranchising.
Franchise and license fees increased $5 million or 1% in 2003. Excluding the favorable impact of the YGR acquisi-tion, franchise and license fees remained essentially flat

Yum! Brands Inc. 39.
as a decrease primarily driven by store closures was largely offset by new unit development.
Company sales increased $491 million or 11% in 2002. Excluding the favorable impact of the YGR acquisi-tion, company sales increased 3%. The increase was driven by new unit development and same store sales growth. The increase was partially offset by store closures and refranchising.
Franchise and license fees increased $29 million or 5% in 2002. Excluding the favorable impact of the YGR acquisition, franchise and license fees increased 3%. The increase was driven by same store sales growth and new unit development, partially offset by store closures.
U.S. SAME STORE SALESU.S. same store sales includes only company restaurants that have been open one year or more. U.S. blended same store sales include KFC, Pizza Hut, and Taco Bell company owned restaurants only. U.S. same store sales for Long John Silver’s and A&W restaurants are not included. Following are the same store sales growth results by brand:
2003 Same Average Store Trans- Guest Sales actions Check
KFC (2)% (4)% 2%Pizza Hut (1)% (4)% 3%Taco Bell 2% 1% 1% 2002 Same Average Store Trans- Guest Sales actions Check
KFC — (2)% 2%Pizza Hut — (2)% 2%Taco Bell 7% 4% 3%
For 2003, blended Company same store sales were flat due to a decrease in transactions offset by an increase in average guest check. For 2002, blended Company same store sales were up 2% due to increases in both transac-tions and average guest check.
U.S. COMPANY RESTAURANT MARGIN 2003 2002 2001
Company sales 100.0% 100.0% 100.0%Food and paper 28.8 28.2 28.6Payroll and employee benefits 31.0 30.9 30.6Occupancy and other operating
expenses 25.6 24.9 25.6
Company restaurant margin 14.6% 16.0% 15.2%
Restaurant margin as a percentage of sales decreased approximately 140 basis points in 2003. The decrease was primarily driven by increased occupancy expenses
due to higher rent, primarily due to additional rent expense associated with the amended YGR sale-leaseback agree-ments, and utilities. The higher food and paper costs were primarily due to the impact of unfavorable discounting and product mix. Also contributing to the decrease was higher labor costs, primarily driven by low single-digit increases in wage rates.
Restaurant margin as a percentage of sales increased approximately 80 basis points in 2002. The increase includes the favorable impact of approximately 50 basis points from the adoption of SFAS 142, which was partially offset by the unfavorable impact of approximately 20 basis points from the YGR acquisition. The increase was primarily driven by the favorable impact of same store sales growth on margin and lower food and paper costs, partially offset by an increase in labor costs. The decrease in food and paper costs was primarily driven by cheese costs. The increase in labor costs was primarily driven by wage rates.
U.S. OPERATING PROFITOperating profit increased $10 million or 1% in 2003. Excluding the favorable impact of the YGR acquisition, operating profit was flat compared to 2002. Decreases driven by lower margins as a result of increased occupancy expenses and the impact of unfavorable discounting and product mix shift on food and paper costs were offset by lower franchise and license and general and administrative expenses.
Operating profit increased $107 million or 15% in 2002, including a 3% favorable impact from the adoption of SFAS 142. Excluding the favorable impact of both SFAS 142 and the YGR acquisition, operating profit increased 9%. The increase was driven by same store sales growth and the favorable impact of lapping franchise support costs related to the restructuring of certain Taco Bell franchisees in 2001. The increase was partially offset by higher restau-rant operating costs, primarily due to higher labor costs, and the unfavorable impact of refranchising and store closures. The higher labor costs were driven by wage rates.
INTERNATIONAL RESULTS OF OPERATIONS % B/(W) % B/(W) vs. vs. 2003 2002 2002 2001
Revenue Company sales $ 2,360 12 $ 2,113 14 Franchise and license fees 365 23 297 8
Total revenues $ 2,725 13 $ 2,410 13
Company restaurant margin $ 365 8 $ 337 31
% of Company sales 15.5% (0.5)ppts. 16.0% 2.1)ppts.
Operating profit $ 441 22 $ 361 19

40.
INTERNATIONAL RESTAURANT UNIT ACTIVITY Unconsolidated Company Affiliates Franchisees Licensees Total
Balance at Dec. 29, 2001 2,151 2,000 6,530 246 10,927New Builds 375 161 515 10 1,061Acquisitions(a) 6 41 163 — 210Refranchising (127) (14) 141 — —Closures (71) (46) (298) (27) (442)Other(b) (1) 2 10 31 42
Balance at Dec. 28, 2002 2,333 2,144 7,061 260 11,798New Builds 312 173 623 13 1,121Acquisitions 283 (736) 453 — —Refranchising (78) (1) 79 — —Closures (90) (74) (305) (15) (484)Other(c) — — (6) (52) (58)
Balance at Dec. 27, 2003 2,760 1,506 7,905 206 12,377
% of Total 22% 12% 64% 2% 100%
(a) Includes units that existed at the date of the acquisition of YGR on May 7, 2002.
(b) Primarily represents licensee units transferred from U.S. to International in 2002.
(c) Represents an adjustment of previously reported amounts.
INTERNATIONAL REVENUESCompany sales increased $247 million or 12% in 2003, after a 4% favorable impact from foreign currency transla-tion. The increase was driven by new unit development, partially offset by refranchising, same store sales declines and store closures.
Franchise and license fees increased $68 million or 23% in 2003, after a 9% favorable impact from foreign currency translation. The increase was driven by new unit development, royalty rate increases and same store sales growth, partially offset by store closures.
Company sales increased $262 million or 14% in 2002, after a 1% favorable impact from foreign currency translation. The increase was driven by new unit development, partially offset by refranchising and store closures. The unfavorable impact of refranchising primarily resulted from the sale of the Singapore business in the third quarter of 2002.
Franchise and license fees increased $22 million or 8% in 2002, after a 1% unfavorable impact from foreign currency translation. Excluding the impact of foreign currency translation and the favorable impact of the YGR acquisition, franchise and license fees increased 8%. The increase was driven by new unit development and same store sales growth, partially offset by store closures.
INTERNATIONAL COMPANY RESTAURANT MARGIN 2003 2002 2001
Company sales 100.0% 100.0% 100.0%Food and paper 35.5 36.1 36.9Payroll and employee benefits 19.0 18.7 19.1Occupancy and other
operating expenses 30.0 29.2 30.1
Company restaurant margin 15.5% 16.0% 13.9%
International Multibrand Restaurants Company Franchise Total
Balance at Dec. 28, 2002 44 114 158
Balance at Dec. 27, 2003 64 133 197
For 2003 and 2002, Company multibrand unit gross addi-tions were 13 and 4, respectively. Company multibrand restaurants at December 27, 2003 also include 9 units acquired during the year from an unconsolidated affiliate. For 2003 and 2002, franchise multibrand unit gross addi-tions were 34 and 13, respectively.
INTERNATIONAL SYSTEM SALES GROWTHSystem Sales Growth 2003 2002
International 14% 8%
System sales increased 14% in 2003, after a 7% favorable impact from foreign currency translation. The increase was driven by new unit development, partially offset by store closures.
System sales increased 8% in 2002, after a 1% unfa-vorable impact from foreign currency translation. Excluding the impact of foreign currency translation and the favorable impact of the YGR acquisition, system sales increased 8%. The increase was driven by new unit development and same store sales growth, partially offset by store closures.

Yum! Brands Inc. 41.
Restaurant margin as a percentage of sales decreased approximately 50 basis points in 2003, including a 20 basis points unfavorable impact from foreign currency translation. The remaining decrease was driven by the impact on margin of same store sales declines. These decreases were partially offset by the impact of supply chain savings initiatives on the cost of food and paper (principally in China), and the cessa-tion of depreciation expense of approximately $9 million for the Puerto Rico business which is held for sale.
Restaurant margin as a percentage of sales increased approximately 210 basis points in 2002, including the favorable impact of approximately 60 basis points from the adoption of SFAS 142. The increase was primarily driven by the favorable impact of lower restaurant operating costs and the elimination of lower average margin units through store closures. Lower restaurant operating costs primarily resulted from lower food and paper costs, partially offset by higher labor costs.
INTERNATIONAL OPERATING PROFITOperating profit increased $80 million or 22% in 2003, including a 7% favorable impact from foreign currency translation. The remaining increase was driven by new unit development and the impact of supply chain savings initia-tives on the cost of food and paper, partially offset by the impact of same store sales declines on margins and higher general and administrative expenses.
Operating profit increased $56 million or 19% in 2002. Excluding the impact of foreign currency translation and the favorable impact from the adoption of SFAS 142, operating profit increased 13%. The increase was driven by new unit development and the favorable impact of lower restaurant operating costs, primarily lower cost of food and paper. The increase was partially offset by higher general and adminis-trative expenses, primarily compensation-related costs.
CONSOLIDATED CASH FLOWSNet cash provided by operating activities was
$1,053 million compared to $1,088 million in 2002. The decrease was primarily driven by $130 million in voluntary contributions to our funded pension plan in 2003, partially offset by higher net income.
In 2002, net cash provided by operating activities was $1,088 million compared to $832 million in 2001. Excluding the impact of the AmeriServe bankruptcy reorga-nization process, cash provided by operating activities was $1,043 million versus $704 million in 2001. The increase was driven by higher net income and timing of tax receipts and payments.
Net cash used in investing activities was $519 million versus $885 million in 2002. The decrease in cash used was driven by the $275 million acquisition of YGR in 2002 and lower capital spending in 2003.
In 2002, net cash used in investing activities was $885 million versus $503 million in 2001. The increase in cash used was primarily due to the acquisition of YGR and higher capital spending in 2002, partially offset by the acqui-sition of fewer restaurants from franchisees in 2002.
Net cash used in financing activities was $475 million versus $187 million in 2002. The increase was driven by higher net debt repayments and higher shares repurchased in 2003.
In 2002, net cash used in financing activities was $187 million versus $352 million in 2001. The decrease is primarily due to lower debt repayments and higher proceeds from stock option exercises versus 2001, partially offset by higher shares repurchased in 2002.
CONSOLIDATED FINANCIAL CONDITIONAssets increased $220 million or 4% to $5.6 billion
primarily due to a net increase in property, plant and equipment, driven by capital expenditures in excess of depreciation and asset dispositions. The decrease in the allowance for doubtful accounts from $42 million to $28 million was primarily the result of the write-off of receiv-ables previously fully reserved.
Liabilities decreased $306 million or 6% to $4.5 billion primarily due to the repayment of amounts under our Credit Facility, decreased short-term borrowings and the reduc-tion in long-term debt as a result of the amendment of certain sale-leaseback agreements (see Note 14). These decreases were partially offset by an increase in accounts payable and other current liabilities primarily due to the accrual of $42 million related to the Wrench litigation.
LIQUIDITY AND CAPITAL RESOURCESOperating in the QSR industry allows us to generate substantial cash flows from the operations of our company stores and from our franchise operations, which require a limited YUM investment. In each of the last two fiscal years, net cash provided by operating activities has exceeded $1 billion. These cash flows have allowed us to fund our discretionary spending, while at the same time reducing our long-term debt balances. We expect these levels of net cash provided by operating activities to continue in the fore-seeable future. Our discretionary spending includes capital spending for new restaurants, acquisitions of restaurants from franchisees and repurchases of shares of our common stock. Though a decline in revenues could adversely impact our cash flows from operations, we believe our operating cash flows, our ability to reduce discretionary spending, and our borrowing capacity will allow us to meet our cash requirements in 2004 and beyond.
Our primary bank credit agreement comprises a senior unsecured Revolving Credit Facility (the “Credit Facility”) which matures on June 25, 2005. On December 26, 2003, we voluntarily reduced our maximum borrowings
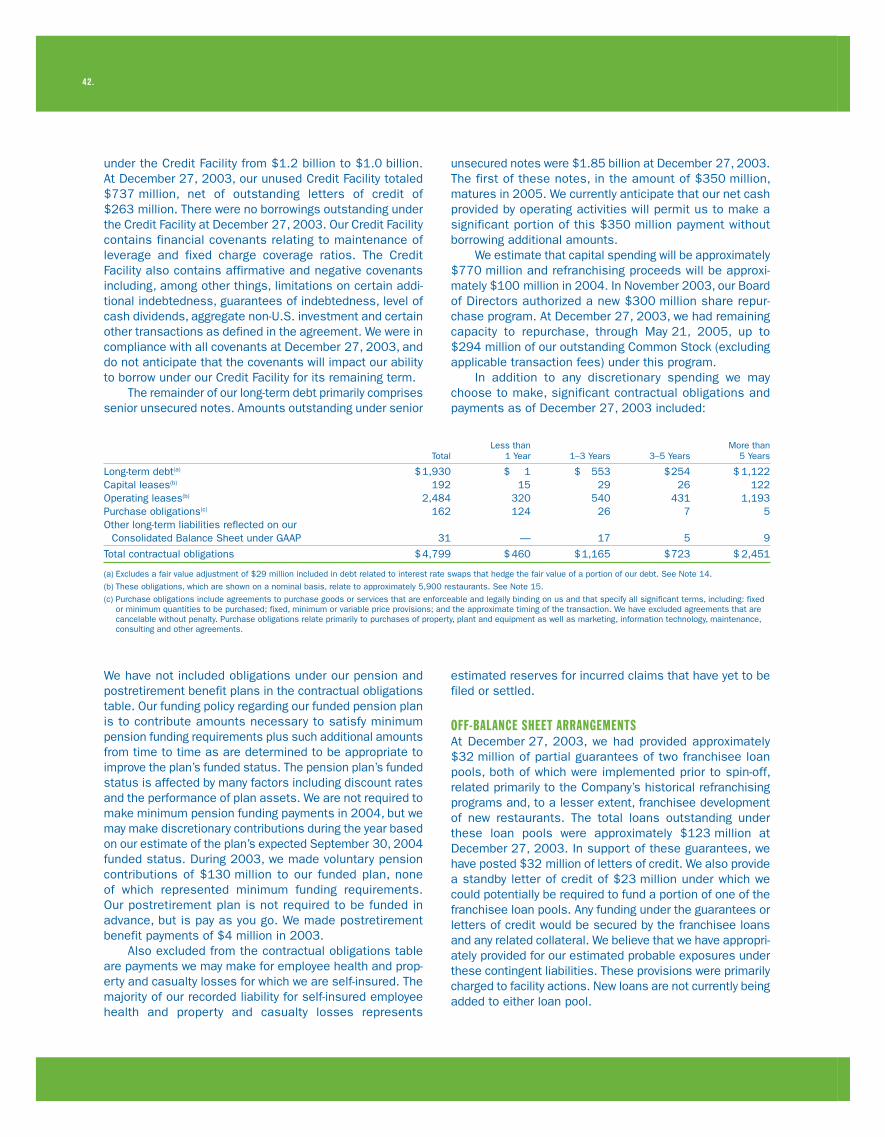
42.
under the Credit Facility from $1.2 billion to $1.0 billion. At December 27, 2003, our unused Credit Facility totaled $737 million, net of outstanding letters of credit of $263 million. There were no borrowings outstanding under the Credit Facility at December 27, 2003. Our Credit Facility contains financial covenants relating to maintenance of leverage and fixed charge coverage ratios. The Credit Facility also contains affirmative and negative covenants including, among other things, limitations on certain addi-tional indebtedness, guarantees of indebtedness, level of cash dividends, aggregate non-U.S. investment and certain other transactions as defined in the agreement. We were in compliance with all covenants at December 27, 2003, and do not anticipate that the covenants will impact our ability to borrow under our Credit Facility for its remaining term.
The remainder of our long-term debt primarily comprises senior unsecured notes. Amounts outstanding under senior
unsecured notes were $1.85 billion at December 27, 2003. The first of these notes, in the amount of $350 million, matures in 2005. We currently anticipate that our net cash provided by operating activities will permit us to make a significant portion of this $350 million payment without borrowing additional amounts.
We estimate that capital spending will be approximately $770 million and refranchising proceeds will be approxi-mately $100 million in 2004. In November 2003, our Board of Directors authorized a new $300 million share repur-chase program. At December 27, 2003, we had remaining capacity to repurchase, through May 21, 2005, up to $294 million of our outstanding Common Stock (excluding applicable transaction fees) under this program.
In addition to any discretionary spending we may choose to make, significant contractual obligations and payments as of December 27, 2003 included:
Less than More than Total 1 Year 1–3 Years 3–5 Years 5 Years
Long-term debt(a) $ 1,930 $ 1 $ 553 $ 254 $ 1,122Capital leases(b) 192 15 29 26 122Operating leases(b) 2,484 320 540 431 1,193Purchase obligations(c) 162 124 26 7 5Other long-term liabilities reflected on our
Consolidated Balance Sheet under GAAP 31 — 17 5 9
Total contractual obligations $ 4,799 $ 460 $ 1,165 $ 723 $ 2,451
(a) Excludes a fair value adjustment of $29 million included in debt related to interest rate swaps that hedge the fair value of a portion of our debt. See Note 14.
(b) These obligations, which are shown on a nominal basis, relate to approximately 5,900 restaurants. See Note 15.
(c) Purchase obligations include agreements to purchase goods or services that are enforceable and legally binding on us and that specify all significant terms, including: fixed or minimum quantities to be purchased; fixed, minimum or variable price provisions; and the approximate timing of the transaction. We have excluded agreements that are cancelable without penalty. Purchase obligations relate primarily to purchases of property, plant and equipment as well as marketing, information technology, maintenance, consulting and other agreements.
We have not included obligations under our pension and postretirement benefit plans in the contractual obligations table. Our funding policy regarding our funded pension plan is to contribute amounts necessary to satisfy minimum pension funding requirements plus such additional amounts from time to time as are determined to be appropriate to improve the plan’s funded status. The pension plan’s funded status is affected by many factors including discount rates and the performance of plan assets. We are not required to make minimum pension funding payments in 2004, but we may make discretionary contributions during the year based on our estimate of the plan’s expected September 30, 2004 funded status. During 2003, we made voluntary pension contributions of $130 million to our funded plan, none of which represented minimum funding requirements. Our postretirement plan is not required to be funded in advance, but is pay as you go. We made postretirement benefit payments of $4 million in 2003.
Also excluded from the contractual obligations table are payments we may make for employee health and prop-erty and casualty losses for which we are self-insured. The majority of our recorded liability for self-insured employee health and property and casualty losses represents
estimated reserves for incurred claims that have yet to be filed or settled.
OFF-BALANCE SHEET ARRANGEMENTSAt December 27, 2003, we had provided approximately $32 million of partial guarantees of two franchisee loan pools, both of which were implemented prior to spin-off, related primarily to the Company’s historical refranchising programs and, to a lesser extent, franchisee development of new restaurants. The total loans outstanding under these loan pools were approximately $123 million at December 27, 2003. In support of these guarantees, we have posted $32 million of letters of credit. We also provide a standby letter of credit of $23 million under which we could potentially be required to fund a portion of one of the franchisee loan pools. Any funding under the guarantees or letters of credit would be secured by the franchisee loans and any related collateral. We believe that we have appropri-ately provided for our estimated probable exposures under these contingent liabilities. These provisions were primarily charged to facility actions. New loans are not currently being added to either loan pool.

Yum! Brands Inc. 43.
We have guaranteed certain lines of credit and loans of Unconsolidated Affiliates totaling $28 million at December 27, 2003. Our Unconsolidated Affiliates had total revenues of over $1.5 billion for the year ended December 27, 2003 and assets and debt of approximately $858 million and $41 million, respectively, at December 27, 2003.
OTHER SIGNIFICANT KNOWN EVENTS, TRENDS OR UNCERTAINTIES EXPECTED TO IMPACT 2004 OPERATING PROFIT COMPARISONS WITH 2003
New Accounting Pronouncements Not Yet AdoptedSee Note 2.
Canada Unconsolidated Affiliate DissolutionOn November 10, 2003 our Unconsolidated Affiliate that previously operated 479 KFC, 236 Pizza Hut and 18 Taco Bell restaurants in Canada was dissolved. We owned 50% of this Unconsolidated Affiliate prior to its dissolution and accounted for our interest under the equity method. Upon dissolution, the Company assumed operation and acquired all associated assets of the Pizza Huts, as well as 17 Taco Bells and 5 KFCs. The Company also acquired the real estate associated with 140 KFCs for which the Company will not be the operator. Our former partner in the Unconsolidated Affiliate acquired full ownership of all other assets, as well as the franchise rights to operate 474 KFCs and one Taco Bell. Our former partner retained 10 KFCs and sold the remainder of these assets and franchise rights acquired to a newly-formed, publicly-held Income Trust in Canada, of which our former partner now holds a minority interest. The Company leases land and buildings for KFCs it does not operate to the Income Trust under operating and capital lease agreements through 2018. The Company will continue to receive a franchise royalty from the KFCs oper-ated by our former partner and the Income Trust.
The Company realized an immaterial gain upon dissolu-tion of the Unconsolidated Affiliate. This gain was realized as the fair value of our increased ownership in the assets received was greater than our carrying value in those assets, and was net of expenses associated with the dissolution of the Unconsolidated Affiliate.
The impact of the restructuring on our 2003 results of operations was not significant. As a result of the restruc-turing, 2004 Company sales are expected to increase by approximately $165 million and franchise fees are expected to decrease by approximately $10 million. The impact on net income is not expected to be material.
Amendment of Sale-Leaseback AgreementsAs discussed in Note 14 and on page 33 of this MD&A, in 2003 we amended two sale-leaseback agreements assumed in our 2002 acquisition of YGR. We estimate the impact of these amendments in 2004 to be a decrease in restaurant profit of $8 million and a decrease in interest expense of $10 million.
Puerto Rico Business Held for SaleOur Puerto Rican business has been held for sale since the fourth quarter of 2002. While a sale of the Puerto Rican business has not yet occurred, we continue to believe that it is probable that a sale will occur during 2004. Sales and restaurant profits of the Puerto Rican business were $187 million and $34 million in 2003.
Contingent Lease GuaranteesUnder terms of our separation agreements at the time of the Spin-off, we indemnified PepsiCo for any losses incurred related to their guarantees of lease agreements of certain non-core businesses which were sold prior to the Spin-off. Two of these businesses, Chevys Mexican Restaurant (Chevys) and Hot ’n Now (HNN) filed for bankruptcy protec-tion in October 2003 and January 2004, respectively. While we cannot presently determine our liability under these indemnities, if any, we do not expect the amount to have a material impact on our Consolidated Financial Statements. Any costs incurred will be charged to AmeriServe and other charges (credits). See Note 24 for further discussion.
Pension Plan Funded StatusCertain of our employees are covered under noncontributory defined benefit pension plans. The most significant of these plans was amended in 2001 such that employees hired after September 30, 2001 are no longer eligible to partici-pate. As of our September 30, 2003 measurement date, these plans had a projected benefit obligation (“PBO”) of $629 million, an accumulated benefit obligation (“ABO”) of $563 million and a fair value of plan assets of $438 million. As a result of the $125 million underfunded status of the plans relative to the ABO at September 30, 2003, we have recorded a $101 million charge to shareholders’ equity (net of tax of $61 million) as of December 27, 2003.
The PBO and ABO reflect the actuarial present value of all benefits earned to date by employees. The PBO incorporates assumptions as to future compensation levels while the ABO reflects only current compensation levels. Due to the relatively long time frame over which benefits earned to date are expected to be paid, our PBO and ABO are highly sensitive to changes in discount rates. We measured our PBO and ABO using a discount rate of 6.25% at September 30, 2003. A 50 basis point increase in this discount rate would have decreased our PBO by approximately $58 million at September 30, 2003. Conversely, a 50 basis point decrease in this discount rate would have increased our PBO by approximately $60 million at September 30, 2003.
Our expected long-term rate of return on plan assets is 8.5%. We believe that this assumption is appropriate given the composition of our plan assets and historical market returns thereon. Given no change to the market-related value of our plan assets as of September 30, 2003, a one percentage point increase or decrease in our expected rate of return on plan assets assumption would decrease or

44.
increase, respectively, our 2004 pension plan expense by approximately $4 million.
The losses our plan assets have experienced, along with the decrease in discount rates, have largely contrib-uted to the unrecognized actuarial loss of $230 million in our plans as of September 30, 2003. For purposes of determining 2003 expense our funded status was such that we recognized $6 million of unrecognized actuarial loss in 2003. We will recognize approximately $19 million of unrecognized actuarial loss in 2004. Given no change to the assumptions at our September 30, 2003 measurement date, actuarial loss recognition will remain at an amount near that to be recognized in 2004 over the next few years before it begins to gradually decline.
In total, we expect pension expense to increase approximately $14 million to $54 million in 2004. We have incorporated this incremental expense into our operating plans and outlook. The increase is driven by the recognition of actuarial losses as discussed in the preceding paragraph and an increase in interest cost because of the higher PBO. Service cost will also increase as a result of the lower discount rate, though, as previously mentioned, the plans are closed to new participants. A 50 basis point change in our discount rate assumption of 6.25% at September 30, 2003 would impact our 2004 pension expense by approxi-mately $11 million.
We do not believe that the underfunded status of the pension plans will materially affect our financial position or cash flows in 2004 or future years. Given current funding levels and discount rates we would anticipate making contri-butions to fully fund the pension plans over the course of the next five years. We believe our cash flows from oper-ating activities of approximately $1 billion per year are sufficient to allow us to make necessary contributions to the plans, and anticipated fundings have been incorporated into our cash flow projections. We have included known and expected increases in our pension expense as well as future expected plan contributions in our operating plans and outlook.
Avian FluIn several Asian markets, including Thailand, Taiwan, South Korea, Japan, Indonesia, Malaysia, Singapore and certain sections of China, avian flu has impacted retail sales trends and sales trends at KFC through March 5, 2004. Based on information as of March 5, 2004, the Company believes that the most likely effect of avian flu outbreaks in these markets, some of which are completely franchised markets, will be short term. Additionally, the Company currently does not expect that the avian flu outbreak will materially affect its chicken supply in Asia or other markets.
Our most significant market that has been affected by the avian flu is China. As we have previously stated, if the avian flu outbreak were to affect the entire country of China for up to two months (through the end of March 2004) with
sales declines in the range of 20% at KFC, 2004 diluted EPS results for the Company would be unfavorably impacted by up to $0.02. We have incorporated this potential unfavorable impact in our operating plans and outlook.
AmeriServe and Other Charges (Credits)During 2004, we expect to recover approximately $10 million related to recoveries from the AmeriServe bankruptcy reor-ganization process. We expect that this will substantially complete our recoveries related to the AmeriServe bank-ruptcy reorganization process. See Note 7 for a detailed discussion of AmeriServe and other charges (credits).
CRITICAL ACCOUNTING POLICIESOur reported results are impacted by the application of certain accounting policies that require us to make subjec-tive or complex judgments. These judgments involve estimations of the effect of matters that are inherently uncertain and may significantly impact our quarterly or annual results of operations or financial condition. Changes in the estimates and judgements could significantly affect our results of operations, financial condition and cash flows in future years. A description of what we consider to be our most significant critical accounting policies follows.
Impairment or Disposal of Long-Lived AssetsWe evaluate our long-lived assets for impairment at the individual restaurant level. Restaurants held and used are evaluated for impairment on a semi-annual basis or when-ever events or circumstances indicate that the carrying amount of a restaurant may not be recoverable (including a decision to close a restaurant). Our semi-annual test includes those restaurants that have experienced two consecutive years of operating losses. These impairment evaluations require an estimation of cash flows over the remaining useful life of the primary asset of the restaurant, which can be for a period of over 20 years, and any terminal value. We limit assumptions about important factors such as sales growth and margin improvement to those that are supportable based upon our plans for the unit and actual results at comparable restaurants.
If the long-lived assets of a restaurant on a held and used basis are not recoverable based upon forecasted, undiscounted cash flows, we write the assets down to their fair value. This fair value is determined by discounting the forecasted cash flows, including terminal value, of the restaurant at an appropriate rate. The discount rate used is our cost of capital, adjusted upward when a higher risk is believed to exist.
When it is probable that we will sell a restaurant, we write down the restaurant to its fair value. We often refranchise restaurants in groups and therefore perform impairment evaluations at the group level. Fair value is based on the expected sales proceeds less applicable transaction costs. Estimated sales proceeds are based on the most relevant of historical sales multiples or bids

Yum! Brands Inc. 45.
from buyers, and have historically been reasonably accurate estimations of the proceeds ultimately received.
See Note 2 for a further discussion of our policy regarding the impairment or disposal of long-lived assets.
Impairment of Investments in Unconsolidated AffiliatesWe record impairment charges related to an invest-ment in an unconsolidated affiliate whenever events or circumstances indicate that a decrease in the value of an investment has occurred which is other than temporary. In addition, we evaluate our investments in unconsolidated affiliates for impairment when they have experienced two consecutive years of operating losses. Our impairment measurement test for an investment in an unconsolidated affiliate is similar to that for our restaurants except that we use discounted cash flows after interest and taxes instead of discounted cash flows before interest and taxes as used for our restaurants. The fair value of our investments in unconsolidated affiliates is generally significantly in excess of their carrying value.
See Note 2 for a further discussion of our policy regarding the impairment of investments in unconsolidated affiliates.
Impairment of Goodwill and Indefinite-Lived Intangible AssetsWe evaluate goodwill and indefinite-lived intangible assets for impairment on an annual basis or more often if an event occurs or circumstances change that indicates impairment might exist. Goodwill is evaluated for impairment through the comparison of fair value of our reporting units to their carrying values. Our reporting units are our operating segments in the U.S. and our business management units internationally (typically individual countries). Fair value is the price a willing buyer would pay for the reporting unit, and is generally estimated by discounting expected future cash flows from the reporting units over twenty years plus an expected terminal value. We limit assumptions about important factors such as sales growth and margin improve-ment to those that are supportable based upon our plans for the reporting unit.
For 2003, there was no impairment of goodwill identi-fied during our annual impairment testing. For our reporting units with goodwill, the fair value is generally significantly in excess of the recorded carrying value. Thus, we do not believe that we have material goodwill that is at risk to be impaired given current business performance. For 2002, we impaired $5 million of goodwill related to the Pizza Hut France reporting unit.
Our impairment test for indefinite-lived intangible assets consists of a comparison of the fair value of the asset with its carrying amount. Our indefinite-lived intangible assets consist of values assigned to trademarks/brands of which we have acquired ownership (or the right to a perpetual royalty-free license in the case of A&W). We believe the value of these trademarks/brands is derived
from the royalty we avoid, in the case of Company stores, or receive, in the case of franchise stores, due to our owner-ship of or royalty-free license of the trademarks/brands. Thus, anticipated sales are the most important assumption in valuing trademarks/brands. We limit assumptions about sales growth, as well as other factors impacting the fair value calculation, to those that are supportable based on our plans for the applicable Concept.
The most significant recorded trademark/brand assets resulted when we acquired YGR in 2002. Upon this acqui-sition, $140 million and $72 million were allocated to the LJS and A&W trademarks/brands, respectively. The results generated to date from the YGR acquisition on an overall basis have met our expectations. We also now believe opportunities exist beyond those assumed in justification of our acquisition price with regard to increased penetra-tion of LJS, for both stand-alone units and as a multibrand partner. Accordingly, we now believe our system’s devel-opment capital, at least through the term of our current projections, will be primarily directed towards LJS.
The decision to focus short-term development on increased penetration of LJS and discretionary capital spending limits have resulted in less than originally planned development of A&W in the near term. Additionally, while we continue to view A&W as a viable multibrand partner, subse-quent to acquisition we decided to close or refranchise all Company-owned A&W restaurants that we had acquired. These restaurants were low-volume, mall-based units, that were inconsistent with the remainder of our Company-owned portfolio. We incorporated these plans into our fair value estimates of the LJS and A&W trademarks/brands in 2003. As sales projections for LJS were in excess of those originally assumed when valuing the LJS trademark/brand, the trademark/brand’s current fair value is in excess of its carrying value. Both the decision to close the Company-owned A&W units and the decision to focus on short-term development opportunities at LJS negatively impacted the fair value of the A&W trademark/brand. Accordingly, we recorded a charge of $5 million in 2003 to write the value of A&W trademark/brand down to its fair value.
While we believe the sales assumptions used in our determination of the fair value of the A&W trademark/brand are reasonable and consistent with our operating plans and forecasts, fluctuations in the assumptions would have impacted our impairment calculation. If the long-term rate of sales growth used in our determination of the fair value of the A&W trademark/brand would have been one percentage point higher, the trademark/brand would not have been impaired. Alternatively, if the long-term rate of sales growth would have been one percentage point lower, additional impairment of approximately $4 million would have been recognized.
See Note 2 for a further discussion of our policies regarding goodwill and indefinite-lived intangible assets.
46.
Allowances for Franchise and License Receivables and Contingent LiabilitiesWe reserve a franchisee’s or licensee’s entire receivable balance based upon pre-defined aging criteria and upon the occurrence of other events that indicate that we may not collect the balance due. As a result of reserving using this methodology, we have an immaterial amount of receiv-ables that are past due that have not been reserved for at December 27, 2003. See Note 2 for a further discussion of our policies regarding franchise and license operations.
Primarily as a result of our refranchising efforts, we remain liable for certain lease assignments and guaran-tees. We record a liability for our exposure under these lease assignments and guarantees when such exposure is probable and estimable. At December 27, 2003, we have recorded an immaterial liability for our exposure which we consider to be probable and estimable. The potential total exposure under such leases is significant, with $326 million representing the present value of the minimum payments of the assigned leases at December 27, 2003, discounted at our pre-tax cost of debt. Current franchisees are the primary lessees under the vast majority of these leases. We gener-ally have cross-default provisions with these franchisees that would put them in default of their franchise agreement in the event of non-payment under the lease. We believe these cross-default provisions significantly reduce the risk that we will be required to make payments under these leases and, historically, we have not been required to make such payments in significant amounts. See Note 24 for a further discussion of our lease guarantees.
Self-Insured Property and Casualty LossesWe record our best estimate of the remaining cost to settle incurred self-insured property and casualty claims. The esti-mate is based on the results of an independent actuarial study and considers historical claim frequency and severity as well as changes in factors such as our business envi-ronment, benefit levels, medical costs and the regulatory environment that could impact overall self-insurance costs. Additionally, a risk margin to cover unforeseen events that may occur over the several years it takes for claims to settle is included in our reserve, increasing our confidence level that the recorded reserve is adequate.
See Note 24 for a further discussion of our insurance programs.
Income Tax Valuation Allowances and Tax ReservesAt December 27, 2003, we have a valuation allowance of $183 million primarily to reduce our net operating loss and tax credit carryforwards of $231 million to an amount that will more likely than not be realized. These net operating loss and tax credit carryforwards exist in many state and foreign jurisdictions and have varying carryforward periods and restrictions on usage. The estimation of future taxable income in these state and foreign jurisdictions and our
resulting ability to utilize net operating loss and tax credit carryforwards can significantly change based on future events, including our determinations as to the feasibility of certain tax planning strategies. Thus, recorded valuation allowances may be subject to material future changes.
As a matter of course, we are regularly audited by federal, state and foreign tax authorities. We provide reserves for potential exposures when we consider it probable that a taxing authority may take a sustainable position on a matter contrary to our position. We evaluate these reserves, including interest thereon, on a quarterly basis to insure that they have been appropriately adjusted for events that may impact our ultimate payment for such exposures.
See Note 22 for a further discussion of our income taxes.
QUANTITATIVE AND QUALITATIVE DISCLOSURES ABOUT MARKET RISKThe Company is exposed to financial market risks associ-ated with interest rates, foreign currency exchange rates and commodity prices. In the normal course of business and in accordance with our policies, we manage these risks through a variety of strategies, which may include the use of derivative financial and commodity instruments to hedge our underlying exposures. Our policies prohibit the use of derivative instruments for trading purposes, and we have procedures in place to monitor and control their use.
Interest Rate RiskWe have a market risk exposure to changes in interest rates, principally in the United States. We attempt to minimize this risk and lower our overall borrowing costs through the utili-zation of derivative financial instruments, primarily interest rate swaps. These swaps are entered into with financial institutions and have reset dates and critical terms that match those of the underlying debt. Accordingly, any change in market value associated with interest rate swaps is offset by the opposite market impact on the related debt.
At December 27, 2003 and December 28, 2002, a hypothetical 100 basis point increase in short-term interest rates would result in a reduction of approximately $3 million and $6 million, respectively, in annual income before income taxes. The estimated reductions are based upon the level of variable rate debt and assume no changes in the volume or composition of debt. In addition, the fair value of our derivative financial instruments at December 27, 2003 and December 28, 2002 would decrease approximately $5 million and $8 million, respectively. The fair value of our Senior Unsecured Notes at December 27, 2003 and December 28, 2002 would decrease approximately $87 million and $93 million, respectively. Fair value was determined by discounting the projected cash flows.

Yum! Brands Inc. 47.
Foreign Currency Exchange Rate RiskInternational operating profit constitutes approximately 36% of our operating profit in 2003, excluding unallocated and corporate expenses. In addition, the Company’s net asset exposure (defined as foreign currency assets less foreign currency liabilities) totaled approximately $1.3 billion as of December 27, 2003. Operating in international markets exposes the Company to movements in foreign currency exchange rates. The Company’s primary exposures result from our operations in Asia-Pacific, the Americas and Europe. Changes in foreign currency exchange rates would impact the translation of our investments in foreign opera-tions, the fair value of our foreign currency denominated financial instruments and our reported foreign currency denominated earnings and cash flows. For the fiscal year ended December 27, 2003, operating profit would have decreased $49 million if all foreign currencies had uniformly weakened 10% relative to the U.S. dollar. The estimated reduction assumes no changes in sales volumes or local currency sales or input prices.
We attempt to minimize the exposure related to our investments in foreign operations by financing those investments with local currency debt when practical and holding cash in local currencies when possible. In addition, we attempt to minimize the exposure related to foreign currency denominated financial instruments by purchasing goods and services from third parties in local currencies when practical. Consequently, foreign currency denominated financial instruments consist primarily of intercompany short-term receivables and payables. At times, we utilize forward contracts to reduce our exposure related to these foreign currency denominated financial instruments. The notional amount and maturity dates of these contracts match those of the underlying receivables or payables such that our foreign currency exchange risk related to these instruments is eliminated.
Commodity Price RiskWe are subject to volatility in food costs as a result of market risk associated with commodity prices. Our ability to recover increased costs through higher pricing is, at times, limited by the competitive environment in which we operate. We manage our exposure to this risk primarily through pricing agreements as well as, on a limited basis, commodity future and option contracts. Commodity future and option contracts entered into for the fiscal years ended December 27, 2003, and December 28, 2002, did not significantly impact our financial position, results of operations or cash flows.
CAUTIONARY STATEMENTSFrom time to time, in both written reports and oral state-ments, we present “forward-looking statements” within the meaning of Section 27A of the Securities Act of 1933, as amended, and Section 21E of the Securities Exchange Act of 1934, as amended. The statements include those iden-tified by such words as “may,” “will,” “expect,” “project,” “anticipate,” “believe,” “plan” and other similar terminology. These “forward-looking statements” reflect our current expectations regarding future events and operating and financial performance and are based upon data available at the time of the statements. Actual results involve risks and uncertainties, including both those specific to the Company and those specific to the industry, and could differ materially from expectations.
Company risks and uncertainties include, but are not limited to, potentially substantial tax contingencies related to the Spin-off, which, if they occur, require us to indemnify PepsiCo, Inc.; changes in effective tax rates; our debt leverage and the attendant potential restriction on our ability to borrow in the future; potential unfavorable vari-ances between estimated and actual liabilities; our ability to secure distribution of products and equipment to our restaurants on favorable economic terms and our ability to ensure adequate supply of restaurant products and equip-ment in our stores; effects and outcomes of legal claims involving the Company; the effectiveness of operating initia-tives and advertising and promotional efforts; the ongoing financial viability of our franchisees and licensees; the success of our refranchising strategy; volatility of actuarially determined losses and loss estimates; and adoption of new or changes in accounting policies and practices including pronouncements promulgated by standard setting bodies.
Industry risks and uncertainties include, but are not limited to, economic and political conditions in the countries and territories where we operate, including effects of war and terrorist activities; changes in legislation and govern-mental regulation; new product and concept development by us and/or our food industry competitors; changes in commodity, labor, and other operating costs; changes in competition in the food industry; publicity which may impact our business and/or industry; severe weather conditions; volatility of commodity costs; increases in minimum wage and other operating costs; availability and cost of land and construction; consumer preferences, spending patterns and demographic trends; political or economic instability in local markets and changes in currency exchange and interest rates; the impact that any widespread illness or general health concern may have on our business and/or the economy of the countries in which we operate.

48.
Consolidated Statements of IncomeFiscal years ended December 27, 2003, December 28, 2002 and December 29, 2001
(in millions, except per share data) 2003 2002 2001
RevenuesCompany sales $ 7,441 $ 6,891 $ 6,138Franchise and license fees 939 866 815
8,380 7,757 6,953
Costs and Expenses, netCompany restaurants Food and paper 2,300 2,109 1,908 Payroll and employee benefits 2,024 1,875 1,666 Occupancy and other operating expenses 2,013 1,806 1,658
6,337 5,790 5,232
General and administrative expenses 945 913 796Franchise and license expenses 28 49 59Facility actions 36 32 1Other (income) expense (41) (30) (23)Wrench litigation 42 — —AmeriServe and other charges (credits) (26) (27) (3)
Total costs and expenses, net 7,321 6,727 6,062
Operating Profit 1,059 1,030 891Interest expense, net 173 172 158
Income Before Income Taxes and Cumulative Effect of Accounting Change 886 858 733Income tax provision 268 275 241
Income before Cumulative Effect of Accounting Change 618 583 492Cumulative effect of accounting change, net of tax (1) — —
Net Income $ 617 $ 583 $ 492
Basic Earnings Per Common Share $ 2.10 $ 1.97 $ 1.68
Diluted Earnings Per Common Share $ 2.02 $ 1.88 $ 1.62
See accompanying Notes to Consolidated Financial Statements.

Yum! Brands Inc. 49.
Consolidated Statements of Cash FlowsFiscal years ended December 27, 2003, December 28, 2002 and December 29, 2001
(in millions) 2003 2002 2001
Cash Flows — Operating ActivitiesNet income $ 617 $ 583 $ 492Adjustments to reconcile net income to net cash provided by operating activities: Cumulative effect of accounting change, net of tax 1 — — Depreciation and amortization 401 370 354 Facility actions 36 32 1 Wrench litigation 42 — — AmeriServe and other charges (credits) (3) — (6) Contributions to defined benefit pension plans (132) (26) (48) Other liabilities and deferred credits 17 (12) 37 Deferred income taxes (23) 21 (72) Other non-cash charges and credits, net 32 36 15Changes in operating working capital, excluding effects of acquisitions and dispositions: Accounts and notes receivable 2 32 116 Inventories (1) 11 (8) Prepaid expenses and other current assets — 19 (3) Accounts payable and other current liabilities (32) (37) (13) Income taxes payable 96 59 (33)
Net change in operating working capital 65 84 59
Net Cash Provided by Operating Activities 1,053 1,088 832
Cash Flows — Investing ActivitiesCapital spending (663) (760) (636)Proceeds from refranchising of restaurants 92 81 111Acquisition of Yorkshire Global Restaurants, Inc. — (275) —Acquisition of restaurants from franchisees (41) (13) (108)Short-term investments 13 9 27Sales of property, plant and equipment 46 58 57Other, net 34 15 46
Net Cash Used in Investing Activities (519) (885) (503)
Cash Flows — Financing ActivitiesProceeds from Senior Unsecured Notes — 398 842Revolving Credit Facility activity, by original maturity Three months or less, net (153) 59 (943)Proceeds from long-term debt — — 1Repayments of long-term debt (17) (511) (258)Short-term borrowings-three months or less, net (137) (15) 58Repurchase shares of common stock (278) (228) (100)Employee stock option proceeds 110 125 58Other, net — (15) (10)
Net Cash Used in Financing Activities (475) (187) (352)
Effect of Exchange Rate on Cash and Cash Equivalents 3 4 —
Net Increase (Decrease) in Cash and Cash Equivalents 62 20 (23)Cash and Cash Equivalents — Beginning of Year 130 110 133
Cash and Cash Equivalents — End of Year $ 192 $ 130 $ 110
See accompanying Notes to Consolidated Financial Statements.

50.
Consolidated Balance SheetsDecember 27, 2003 and December 28, 2002
(in millions) 2003 2002
ASSETSCurrent AssetsCash and cash equivalents $ 192 $ 130Short-term investments, at cost 15 27Accounts and notes receivable, less allowance: $28 in 2003 and $42 in 2002 169 168Inventories 67 63Assets classified as held for sale 96 111Prepaid expenses and other current assets 102 110Deferred income taxes 165 121
Total Current Assets 806 730
Property, plant and equipment, net 3,280 3,037Goodwill 521 485Intangible assets, net 357 364Investments in unconsolidated affiliates 184 229Other assets 472 555
Total Assets $ 5,620 $ 5,400
LIABILITIES AND SHAREHOLDERS’ EQUITYCurrent LiabilitiesAccounts payable and other current liabilities $ 1,213 $ 1,166Income taxes payable 238 208Short-term borrowings 10 146
Total Current Liabilities 1,461 1,520
Long-term debt 2,056 2,299Other liabilities and deferred credits 983 987
Total Liabilities 4,500 4,806
Shareholders’ EquityPreferred stock, no par value, 250 shares authorized; no shares issued — —Common stock, no par value, 750 shares authorized; 292 shares and
294 shares issued in 2003 and 2002, respectively 916 1,046Retained earnings (accumulated deficit) 414 (203)Accumulated other comprehensive income (loss) (210) (249)
Total Shareholders’ Equity 1,120 594
Total Liabilities and Shareholders’ Equity $ 5,620 $ 5,400
See accompanying Notes to Consolidated Financial Statements.

Yum! Brands Inc. 51.Consolidated Statements of Shareholders’ Equity (Deficit) and Comprehensive IncomeFiscal years ended December 27, 2003, December 28, 2002 and December 29, 2001
Retained Accumulated Earnings Other Issued Common Stock (Accumulated Comprehensive(in millions) Shares Amount Deficit) Income (Loss) Total
Balance at December 30, 2000 294 $ 1,133 $ (1,278) $ (177) $ (322)
Net income 492 492Foreign currency translation adjustment (5) (5)Net unrealized loss on derivative instruments (net of tax benefits of $1 million) (1) (1)Minimum pension liability adjustment (net of tax benefits of $14 million) (24) (24)
Comprehensive Income 462Repurchase of shares of common stock (5) (100) (100)Employee stock option exercises
(includes tax benefits of $13 million) 4 58 58Compensation-related events 6 6
Balance at December 29, 2001 293 $ 1,097 $ (786) $ (207) $ 104
Net income 583 583Foreign currency translation adjustment 6 6Net unrealized loss on derivative instruments (net of tax benefits of $1 million) (1) (1)Minimum pension liability adjustment (net of tax benefits of $29 million) (47) (47)
Comprehensive Income 541Repurchase of shares of common stock (8) (228) (228)Employee stock option exercises
(includes tax benefits of $49 million) 9 174 174Compensation-related events 3 3
Balance at December 28, 2002 294 $ 1,046 $ (203) $ (249) $ 594
Net income 617 617Foreign currency translation adjustment arising during the period 67 67Foreign currency translation adjustment included in net income 2 2Minimum pension liability adjustment (net of tax benefits of $18 million) (30) (30)
Comprehensive Income 656Repurchase of shares of common stock (9) (278) (278)Employee stock option exercises
(includes tax benefits of $26 million) 7 136 136Compensation-related events 12 12
Balance at December 27, 2003 292 $ 916 $ 414 $ (210) $ 1,120
See accompanying Notes to Consolidated Financial Statements.
52.
DESCRIPTION OF BUSINESSnote 1YUM! Brands, Inc. and Subsidiaries (collectively referred to as “YUM” or the “Company”) comprises the worldwide operations of KFC, Pizza Hut, Taco Bell and since May 7, 2002, Long John Silver’s (“LJS”) and A&W All-American Food Restaurants (“A&W”) (collectively the “Concepts”), which were added when we acquired Yorkshire Global Restaurants, Inc. (“YGR”). YUM is the world’s largest quick service restau-rant company based on the number of system units, with over 33,000 units in more than 100 countries and territories of which approximately 37% are located outside the U.S. YUM was created as an independent, publicly-owned company on October 6, 1997 (the “Spin-off Date”) via a tax-free distribu-tion by our former parent, PepsiCo, Inc. (“PepsiCo”), of our Common Stock (the “Distribution” or “Spin-off”) to its share-holders. References to YUM throughout these Consolidated Financial Statements are made using the first person nota-tions of “we,” “us “ or “our.”
Through our widely-recognized Concepts, we develop, operate, franchise and license a system of both traditional and non-traditional quick service restaurants. Each Concept has proprietary menu items and emphasizes the prepara-tion of food with high quality ingredients as well as unique recipes and special seasonings to provide appealing, tasty and attractive food at competitive prices. Our traditional restaurants feature dine-in, carryout and, in some instances, drive-thru or delivery service. Non-traditional units, which are principally licensed outlets, include express units and kiosks which have a more limited menu and operate in non-traditional locations like airports, gasoline service stations, convenience stores, stadiums, amusement parks and colleges, where a full-scale traditional outlet would not be practical or efficient. We are actively pursuing the strategy of multibranding, where two or more of our Concepts are operated in a single unit. In addition, we are testing multi-branding options involving one of our Concepts and either a concept in development, such as Pasta Bravo, or a concept not owned or affiliated with YUM.
SUMMARY OF SIGNIFICANT ACCOUNTING POLICIESnote 2Our preparation of the accompanying Consolidated Financial Statements in conformity with accounting principles gener-ally accepted in the United States of America requires us to make estimates and assumptions that affect reported amounts of assets and liabilities, disclosure of contin-gent assets and liabilities at the date of the financial statements, and the reported amounts of revenues and expenses during the reporting period. Actual results could differ from the estimates.
Principles of Consolidation and Basis of PreparationIntercompany accounts and transactions have been elimi-nated. Certain investments in businesses that operate our
Notes to Consolidated Financial Statements(Tabular amounts in millions, except share data)
Concepts are accounted for by the equity method. Generally, we possess 50% ownership of and 50% voting rights over these affiliates. Our lack of majority voting rights precludes us from controlling these affiliates, and thus we do not consolidate these affiliates. Our share of the net income or loss of those unconsolidated affiliates is included in other (income) expense.
We participate in various advertising cooperatives with our franchisees and licensees. In certain of these coopera-tives we possess majority voting rights, and thus control the cooperatives. As the contributions to the cooperatives are designated for advertising expenditures, any cash held by these cooperatives is considered restricted and is included in prepaid expenses and other current assets. Such restricted cash was approximately $34 million and $44 million at December 27, 2003 and December 28, 2002, respectively. As the contributions to these coopera-tives are designated and segregated for advertising, we act as an agent for the franchisees and licensees with regard to these contributions. Thus, in accordance with Statement of Financial Accounting Standards (“SFAS”) No. 45, “Accounting for Franchise Fee Revenue,” we do not reflect franchisee and licensee contributions to these coop-eratives in our Consolidated Statements of Income.
Fiscal YearOur fiscal year ends on the last Saturday in December and, as a result, a fifty-third week is added every five or six years. Fiscal year 2000 included 53 weeks. The Company’s next fiscal year with 53 weeks will be 2005. The first three quarters of each fiscal year consist of 12 weeks and the fourth quarter consists of 17 weeks in fiscal years with 53 weeks and 16 weeks in fiscal years with 52 weeks. Our subsidiaries operate on similar fiscal calendars with period end dates suited to their businesses. The subsidiaries’ period end dates are within one week of YUM’s period end date with the exception of our international businesses, which close one period or one month earlier to facilitate consolidated reporting.
ReclassificationsWe have reclassified certain items in the accompanying Consolidated Financial Statements and Notes thereto for prior periods to be comparable with the classification for the fiscal year ended December 27, 2003. These reclassifica-tions had no effect on previously reported net income.
Franchise and License OperationsWe execute franchise or license agreements for each unit which sets out the terms of our arrangement with the franchisee or licensee. Our franchise and license agree-ments typically require the franchisee or licensee to pay an initial, non-refundable fee and continuing fees based upon a percentage of sales. Subject to our approval and payment of a renewal fee, a franchisee may generally renew the franchise agreement upon its expiration.
We recognize initial fees as revenue when we have performed substantially all initial services required by the

Yum! Brands Inc. 53.
franchise or license agreement, which is generally upon the opening of a store. We recognize continuing fees as earned. We recognize renewal fees in income when a renewal agree-ment becomes effective. We include initial fees collected upon the sale of a restaurant to a franchisee in refranchising gains (losses). Fees for development rights are capitalized and amortized over the life of the development agreement.
We incur expenses that benefit both our franchise and license communities and their representative organizations and our company operated restaurants. These expenses, along with other costs of servicing of franchise and license agreements are charged to general and administrative expenses as incurred. Certain direct costs of our fran-chise and license operations are charged to franchise and license expenses. These costs include provisions for esti-mated uncollectible fees, franchise and license marketing funding, amortization expense for franchise related intan-gible assets and certain other direct incremental franchise and license support costs. Franchise and license expenses also includes rental income from subleasing restaurants to franchisees net of the related occupancy costs.
We monitor the financial condition of our franchisees and licensees and record provisions for estimated losses on receivables when we believe that our franchisees or licensees are unable to make their required payments. While we use the best information available in making our determination, the ultimate recovery of recorded receivables is also dependent upon future economic events and other conditions that may be beyond our control. Included in franchise and license expense in 2003 is a net benefit for uncollectible franchise and license receivables of $3 million as we were able to recover previously reserved receivables in excess of provisions made. Net provisions for uncollect-ible franchise and license receivables of $15 million and $24 million were included in franchise and license expense in 2002 and 2001, respectively.
Direct Marketing CostsWe report substantially all of our direct marketing costs in occupancy and other operating expenses. We charge direct marketing costs to expense ratably in relation to revenues over the year in which incurred and, in the case of adver-tising production costs, in the year the advertisement is first shown. Deferred direct marketing costs, which are classified as prepaid expenses, consist of media and related adver-tising production costs which will generally be used for the first time in the next fiscal year. To the extent we participate in advertising cooperatives, we expense our contributions as incurred. At the end of 2003 and 2002, we had deferred marketing costs of $3 million and $8 million, respectively. Our advertising expenses were $419 million, $384 million and $328 million in 2003, 2002 and 2001, respectively.
Research and Development ExpensesResearch and development expenses, which we expense as incurred, are reported in general and administrative expenses. Research and development expenses were $26 million in 2003 and $23 million in both 2002 and 2001.
Impairment or Disposal of Long-Lived AssetsEffective December 30, 2001, the Company adopted SFAS No. 144, “Accounting for the Impairment or Disposal of Long-Lived Assets” (“SFAS 144”). SFAS 144 retained many of the fundamental provisions of SFAS No. 121, “Accounting for the Impairment of Long-Lived Assets and for Long-Lived Assets to Be Disposed Of” (“SFAS 121”), but resolved certain implementation issues associated with that Statement. The adoption of SFAS 144 did not have a mate-rial impact on the Consolidated Financial Statements.
In accordance with SFAS 144, we review our long-lived assets related to each restaurant to be held and used in the business, including any allocated intangible assets subject to amortization, semi-annually for impairment, or whenever events or changes in circumstances indicate that the carrying amount of a restaurant may not be recover-able. We evaluate restaurants using a “two-year history of operating losses” as our primary indicator of potential impairment. Based on the best information available, we write down an impaired restaurant to its estimated fair market value, which becomes its new cost basis. We gener-ally measure estimated fair market value by discounting estimated future cash flows. In addition, when we decide to close a restaurant it is reviewed for impairment and depreciable lives are adjusted. The impairment evaluation is based on the estimated cash flows from continuing use through the expected disposal date and the expected terminal value.
The Company has adopted SFAS No. 146, “Accounting for Costs Associated with Exit or Disposal Activities” (“SFAS 146”), effective for exit or disposal activities that were initiated after December 31, 2002. Costs addressed by SFAS 146 include costs to terminate a contract that is not a capital lease, costs of involuntary employee termina-tion benefits pursuant to a one-time benefit arrangement, costs to consolidate facilities and costs to relocate employees. SFAS 146 changes the timing of expense recog-nition for certain costs we incur while closing restaurants or undertaking other exit or disposal activities; however, the timing difference is not typically significant in length. Adoption of SFAS 146 did not have a material impact on our Consolidated Financial Statements for the year ended December 27, 2003.
Store closure costs include costs of disposing of the assets as well as other facility-related expenses from previ-ously closed stores. These store closure costs are generally expensed as incurred. Additionally, at the date we cease using a property under an operating lease, we record a liability for the net present value of any remaining lease obligations, net of estimated sublease income, if any.
Refranchising gains (losses) includes the gains or losses from the sales of our restaurants to new and existing franchisees and the related initial franchise fees, reduced by transaction costs and direct administrative costs of refran-chising. In executing our refranchising initiatives, we most often offer groups of restaurants. We classify restaurants

54.
as held for sale and suspend depreciation and amortization when (a) we make a decision to refranchise; (b) the stores can be immediately removed from operations; (c) we have begun an active program to locate a buyer; (d) significant changes to the plan of sale are not likely; and (e) the sale is probable within one year. We recognize estimated losses on refranchisings when the restaurants are classified as held for sale. We recognize gains on restaurant refranchis-ings when the sale transaction closes, the franchisee has a minimum amount of the purchase price in at-risk equity, and we are satisfied that the franchisee can meet its financial obligations. If the criteria for gain recognition are not met, we defer the gain to the extent we have a remaining financial exposure in connection with the sales transaction. Deferred gains are recognized when the gain recognition criteria are met or as our financial exposure is reduced. When we make a decision to retain a store previously held for sale, we revalue the store at the lower of its (a) net book value at our original sale decision date less normal depreciation and amortization that would have been recorded during the period held for sale or (b) its current fair market value. This value becomes the store’s new cost basis. We charge (or credit) any difference between the store’s carrying amount and its new cost basis to refranchising gains (losses). When we make a decision to close a store previously held for sale, we reverse any previously recognized refranchising loss and then record impairment and store closure costs as described above. Refranchising gains (losses) also include charges for estimated exposures related to those partial guarantees of franchisee loan pools and contingent lease liabilities which arose from refranchising activities. These exposures are more fully discussed in Note 24.
SFAS 144 also requires the results of operations of a component entity that is classified as held for sale or has been disposed of be reported as discontinued operations in the Consolidated Statements of Income if certain condi-tions are met. These conditions include elimination of the operations and cash flows of the component entity from the ongoing operations of the Company and no significant continuing involvement by the Company in the operations of the component entity after the disposal transaction. The results of operations of stores meeting both these condi-tions that were disposed of in 2003 or 2002 or classified as held for sale at December 27, 2003 or December 28, 2002 were not material for any of the three years ended December 27, 2003.
Considerable management judgment is necessary to estimate future cash flows, including cash flows from continuing use, terminal value, closure costs, sublease income, and refranchising proceeds. Accordingly, actual results could vary significantly from our estimates.
Impairment of Investments in Unconsolidated AffiliatesWe record impairment charges related to an invest-ment in an unconsolidated affiliate whenever events or
circumstances indicate that a decrease in the value of an investment has occurred which is other than temporary. In addition, we evaluate our investments in unconsolidated affiliates for impairment when they have experienced two consecutive years of operating losses. Our impairment measurement test for an investment in an unconsolidated affiliate is similar to that for our restaurants except that we use discounted cash flows after interest and taxes instead of discounted cash flows before interest and taxes as used for our restaurants.
Considerable management judgment is necessary to estimate future cash flows. Accordingly, actual results could vary significantly from our estimates.
Asset Retirement ObligationsEffective December 29, 2002, the Company adopted SFAS No. 143, “Accounting for Asset Retirement Obligations” (“SFAS 143”). SFAS 143 addresses the financial accounting and reporting for legal obligations associated with the retirement of tangible long-lived assets and the associated asset retirement costs. As a result of obligations under certain leases that are within the scope of SFAS 143, the Company recorded a cumulative effect adjustment of $2 million ($1 million after tax) which did not have a material effect on diluted earnings per common share. The adoption of SFAS 143 also did not have a mate-rial impact on our Consolidated Financial Statements for the year ended December 27, 2003. If SFAS 143 had been adopted as of the beginning of 2002 or 2001, the cumu-lative effect adjustment would not have been materially different from that recorded on December 29, 2002.
Financial Instruments with Characteristics of both Liabilities and EquityThe Company has adopted SFAS No. 150, “Accounting for Certain Financial Instruments with Characteristics of both Liabilities and Equity” (“SFAS 150”). SFAS 150 establishes standards for how an issuer classifies and measures three classes of freestanding financial instruments with charac-teristics of both liabilities and equity. It requires that an issuer classify a financial instrument that is within its scope as a liability (or an asset in some circumstances). SFAS 150 was effective for financial instruments entered into or modi-fied after May 31, 2003, and otherwise was effective at the beginning of the first interim period beginning after June 15, 2003. The Company has not entered into or modified any financial instruments within the scope of SFAS 150 since May 31, 2003, nor does it currently hold any significant financial instruments within its scope.
GuaranteesThe Company has adopted Financial Accounting Standards Board (“FASB”) Interpretation No. 45, “Guarantor’s Accounting and Disclosure Requirements for Guarantees, Including Indirect Guarantees of Indebtedness to Others, an interpretation of FASB Statements No. 5, 57 and 107 and a

Yum! Brands Inc. 55.
rescission of FASB Interpretation No. 34” (“FIN 45”). FIN 45 elaborates on the disclosures to be made by a guarantor in its interim and annual financial statements about its obligations under guarantees issued. FIN 45 also clarifies that a guarantor is required to recognize, at inception of a guarantee, a liability for the fair value of certain obliga-tions undertaken. The initial recognition and measurement provisions were applicable to certain guarantees issued or modified after December 31, 2002. While the nature of our business results in the issuance of certain guarantees from time to time, the adoption of FIN 45 did not have a material impact on our Consolidated Financial Statements for the year ended December 27, 2003.
We have also issued guarantees as a result of assigning our interest in obligations under operating leases as a condition to the refranchising of certain Company restaurants. Such guarantees are subject to the require-ments of SFAS No. 145, “Rescission of FASB Statements No. 4, 44, and 64, Amendment of FASB Statement No. 13, and Technical Corrections” (“SFAS 145”). We recognize a liability for the fair value of such lease guarantees under SFAS 145 at their inception, with the related expense being included in refranchising gains (losses).
Cash and Cash EquivalentsCash equivalents represent funds we have temporarily invested (with original maturities not exceeding three months) as part of managing our day-to-day operating cash receipts and disbursements.
InventoriesWe value our inventories at the lower of cost (computed on the first-in, first-out method) or net realizable value.
Property, Plant and EquipmentWe state property, plant and equipment at cost less accumulated depreciation and amortization, impairment writedowns and valuation allowances. We calculate depre-ciation and amortization on a straight-line basis over the estimated useful lives of the assets as follows: 5 to 25 years for buildings and improvements, 3 to 20 years for machinery and equipment and 3 to 7 years for capitalized software costs. As discussed above, we suspend deprecia-tion and amortization on assets related to restaurants that are held for sale.
Internal Development Costs and Abandoned Site CostsWe capitalize direct costs associated with the site acqui-sition and construction of a Company unit on that site, including direct internal payroll and payroll-related costs. Only those site-specific costs incurred subsequent to the time that the site acquisition is considered probable are capitalized. If we subsequently make a determination that a site for which internal development costs have been capi-talized will not be acquired or developed, any previously capitalized internal development costs are expensed and included in general and administrative expenses.
Goodwill and Intangible AssetsThe Company has adopted SFAS No. 141, “Business Combinations” (“SFAS 141”). SFAS 141 requires the use of the purchase method of accounting for all business combinations and modifies the application of the purchase accounting method. Goodwill represents the excess of the cost of a business acquired over the net of the amounts assigned to assets acquired, including identifiable intan-gible assets, and liabilities assumed. SFAS 141 specifies criteria to be used in determining whether intangible assets acquired in a business combination must be recognized and reported separately from goodwill. We base amounts assigned to goodwill and other identifiable intangible assets on independent appraisals or internal estimates.
The Company has also adopted SFAS No. 142, “Goodwill and Other Intangible Assets” (“SFAS 142”). SFAS 142 eliminates the requirement to amortize good-will and indefinite-lived intangible assets, addresses the amortization of intangible assets with a defined life, and addresses impairment testing and recognition for goodwill and indefinite-lived intangible assets. As a result of adopting SFAS 142, we ceased amortization of goodwill and indefinite-lived intangible assets beginning December 30, 2001. Prior to the adoption of SFAS 142, we amortized goodwill on a straight-line basis up to 20 years and indefinite-lived intan-gible assets on a straight-line basis over 3 to 40 years. We evaluate the remaining useful life of an intangible asset that is not being amortized each reporting period to determine whether events and circumstances continue to support an indefinite useful life. If an intangible asset that is not being amortized is subsequently determined to have a finite useful life, we amortize the intangible asset prospectively over its estimated remaining useful life. Amortizable intangible assets continue to be amortized on a straight-line basis over 3 to 40 years. As discussed above, we suspend amor-tization on those intangible assets with a defined life that are allocated to restaurants that are held for sale.
In accordance with the requirements of SFAS 142, goodwill has been assigned to reporting units for purposes of impairment testing. Our reporting units are our operating segments in the U.S. (see Note 23) and our business management units internationally (typically individual countries). Goodwill impairment tests consist of a comparison of each reporting unit’s fair value with its carrying value. The fair value of a reporting unit is the amount for which the unit as a whole could be sold in a current transaction between willing parties. We generally estimate fair value based on discounted cash flows. If the carrying value of a reporting unit exceeds its fair value, goodwill is written down to its implied fair value. We have selected the beginning of our fourth quarter as the date on which to perform our ongoing annual impairment test for goodwill. For 2003, there was no impairment of goodwill identified during our annual impairment testing. For 2002, goodwill assigned to the Pizza Hut France reporting unit was

56.
deemed impaired and written off. The charge of $5 million was recorded in facility actions.
For indefinite-lived intangible assets, our impairment test consists of a comparison of the fair value of an intan-gible asset with its carrying amount. Fair value is the price a willing buyer would pay for the intangible asset and is gener-ally estimated by discounting the expected future cash flows associated with the intangible asset. We also perform our annual test for impairment of our indefinite-lived intangible assets at the beginning of our fourth quarter. Our indefinite-lived intangible assets consist of values assigned to certain trademarks/brands we have acquired. When determining the fair value, we limit assumptions about important factors such as sales growth to those that are supportable based on our plans for the trademark/brand. As discussed in Note 12, we recorded a $5 million charge in 2003 as a result of the impairment of an indefinite-lived intangible asset. This charge was recorded in facility actions.
See Note 12 for further discussion of SFAS 142.
Stock-Based Employee CompensationAt December 27, 2003, the Company had four stock-based employee compensation plans in effect, which are described more fully in Note 18. The Company accounts for those plans under the recognition and measurement principles of Accounting Principles Board Opinion No. 25, “Accounting for Stock Issued to Employees,” and related Interpretations. No stock-based employee compensation cost is reflected in net income, as all options granted under those plans had an exercise price equal to the market value of the underlying common stock on the date of grant. The following table illustrates the effect on net income and earnings per share if the Company had applied the fair value recognition provisions of SFAS No. 123 “Accounting for Stock-Based Compensation,” to stock-based employee compensation. 2003 2002 2001
Net Income, as reported $ 617 $ 583 $ 492 Deduct: Total stock-based employee
compensation expense determined under fair value based method for all awards, net of related tax effects (36) (39) (37)
Net income, pro forma 581 544 455Basic Earnings per Common Share As reported $ 2.10 $ 1.97 $ 1.68 Pro forma 1.98 1.84 1.55Diluted Earnings per Common Share As reported $ 2.02 $ 1.88 $ 1.62 Pro forma 1.91 1.76 1.50
Derivative Financial InstrumentsOur policy prohibits the use of derivative instruments for trading purposes, and we have procedures in place to monitor and control their use. Our use of derivative instru-ments has included interest rate swaps and collars, treasury locks and foreign currency forward contracts. In addition, on a limited basis we utilize commodity futures and options contracts. Our interest rate and foreign currency derivative
contracts are entered into with financial institutions while our commodity derivative contracts are exchange traded.
We account for derivative financial instruments in accordance with SFAS No. 133, “Accounting for Derivative Instruments and Hedging Activities” (“SFAS 133”) as amended by SFAS No. 149, “Amendment of Statement 133 on Derivative Instruments and Hedging Activities (“SFAS 149”). SFAS 133 requires that all derivative instru-ments be recorded on the Consolidated Balance Sheet at fair value. The accounting for changes in the fair value (i.e., gains or losses) of a derivative instrument is dependent upon whether the derivative has been designated and qualifies as part of a hedging relationship and further, on the type of hedging relationship. For derivative instruments that are designated and qualify as a fair value hedge, the gain or loss on the derivative instrument as well as the offsetting gain or loss on the hedged item attributable to the hedged risk are recognized in the results of operations. For deriva-tive instruments that are designated and qualify as a cash flow hedge, the effective portion of the gain or loss on the derivative instrument is reported as a component of other comprehensive income (loss) and reclassified into earnings in the same period or periods during which the hedged trans-action affects earnings. Any ineffective portion of the gain or loss on the derivative instrument is recorded in the results of operations immediately. For derivative instruments not desig-nated as hedging instruments, the gain or loss is recognized in the results of operations immediately. See Note 16 for a discussion of our use of derivative instruments, management of credit risk inherent in derivative instruments and fair value information related to debt and interest rate swaps.
New Accounting Pronouncements Not Yet AdoptedIn January 2003, the FASB issued Interpretation No. 46, “Consolidation of Variable Interest Entities, an interpretation of ARB No. 51” (“FIN 46”). FIN 46 was subsequently revised in December 2003. FIN 46 addresses the consolidation of entities whose equity holders have either (a) not provided sufficient equity at risk to allow the entity to finance its own activities or (b) do not possess certain characteristics of a controlling financial interest. FIN 46 requires the consolida-tion of these entities, known as variable interest entities (“VIEs”), by the primary beneficiary of the entity. The primary beneficiary is the entity, if any, that is subject to a majority of the risk of loss from the VIE’s activities, entitled to receive a majority of the VIEs residual returns, or both. FIN 46 is effective for all entities at the end of the first reporting period ending after March 15, 2004 (the quarter ending March 20, 2004 for the Company). FIN 46 was effective for special-purpose entities (as defined by FIN 46) at the end of the first reporting period ending after December 15, 2003, which did not impact the Consolidated Financial Statements. FIN 46 requires certain disclosures in financial statements issued after December 31, 2003, if it is reasonably possible that the Company will consolidate or disclose information about VIEs when FIN 46 becomes effective.
Yum! Brands Inc. 57.
FIN 46 excludes from its scope businesses (as defined by FIN 46) unless certain conditions exist. We believe the franchise entities which operate our restaurants, including our Unconsolidated Affiliates, meet the definition of a busi-ness. Thus, we are currently evaluating whether any of the aforementioned conditions exist that would subject any of our franchisees, including our Unconsolidated Affiliates, to the provisions of FIN 46, requiring us to determine if they are VIEs, and, if so, whether we are the primary beneficiary. We do not possess any ownership interests in our franchi-sees except for our investments in various Unconsolidated Affiliates accounted for under the equity method (see Note 24 for further description). Additionally, we generally do not provide financial support to our franchisees in a typical franchise relationship. While we continue to evaluate the applicability of FIN 46 to our franchise relationships, at this time we do not believe that the required consolidation of franchise entities, if any, would materially impact our Financial Statements.
The Company, along with representatives of the franchisee groups of each of its Concepts, has formed purchasing cooperatives for the purpose of purchasing certain restaurant products and equipment in the U.S. Our equity ownership in each cooperative is generally propor-tional to our percentage ownership of the U.S. system units for the Concept. We are continuing to evaluate whether any of these cooperatives are VIEs under the provisions of FIN 46 and, if so, whether we are the primary benefi-ciary. We do not currently believe that consolidation will be required for these cooperatives as a result of our adoption of FIN 46.
As discussed further in Note 24, we have posted a $12 million of letter of credit supporting our guarantee of a franchisee loan pool. Additionally, we have provided a standby letter of credit of $23 million under which we could potentially be required to fund a portion of this loan pool. The letters of credit were issued under our existing bank credit agreement. This loan pool, which is not held or funded by an affiliate of the Company, primarily funded purchases of restaurants from the Company and, to a lesser extent, franchisee development of new restaurants. The total loans outstanding under this loan pool were approxi-mately $87 million at December 27, 2003. Our maximum exposure to loss as a result of our involvement with this loan pool was $28 million at December 27, 2003. During the year ended December 27, 2003 the entity which holds this loan pool sold these loans to a qualifying special-purpose entity (“QSPE”) as described in SFAS No. 140, “Accounting for Transfers and Servicing of Financial Assets and Extinguishments of Liabilities” and settled its existing obligations with the proceeds. As QSPEs are not within the scope of FIN 46, the Company will not be required to consolidate the entity that now holds this loan pool.
TWO-FOR-ONE COMMON STOCK SPLITnote 3On May 7, 2002, the Company announced that its Board of Directors approved a two-for-one split of the Company’s outstanding shares of Common Stock. The stock split was effected in the form of a stock dividend and entitled each shareholder of record at the close of business on June 6, 2002 to receive one additional share for every outstanding share of Common Stock held on the record date. The stock dividend was distributed on June 17, 2002, with approxi-mately 149 million shares of common stock distributed. All per share and share amounts in the accompanying Consolidated Financial Statements and Notes to the Financial Statements have been adjusted to reflect the stock split.
YGR ACQUISITIONnote 4On May 7, 2002, YUM completed its acquisition of YGR. At the date of acquisition, YGR consisted of 742 and 496 company and franchise LJS units, respectively, and 127 and 742 company and franchise A&W units, respectively. In addition, 133 multibranded LJS/A&W restaurants were included in the LJS unit totals. This acquisition was made to facilitate our strategic objective of achieving growth through multibranding, where two or more of our Concepts are operated in a single restaurant unit. We paid approxi-mately $275 million in cash and assumed approximately $48 million of bank indebtedness in connection with the acquisition of YGR. The purchase price was allocated to the assets acquired and liabilities assumed based on esti-mates of their fair values at the date of acquisition. We determined these fair values with the assistance of a third party valuation expert. The following table summarizes the fair values of YGR’s assets acquired and liabilities assumed at the date of acquisition.
Current assets $ 35Property, plant and equipment 58Intangible assets 250Goodwill 209Other assets 85
Total assets acquired 637Current liabilities 100Long-term debt, including current portion 59Future rent obligations related to
sale-leaseback agreements 168Other long-term liabilities 35
Total liabilities assumed 362
Net assets acquired (net cash paid) $ 275
Of the $250 million in acquired intangible assets, $212 million was assigned to trademarks/brands. The remaining acquired intangible assets primarily consist

58.
of franchise contract rights which will be amortized over thirty years, the typical term of a YGR franchise agreement including renewals. Of the $212 million in trademarks/brands approximately $191 million and $21 million were assigned to the U.S. and International operating segments, respectively. Of the remaining $38 million in intangible assets, approximately $31 million and $7 million were assigned to the U.S. and International operating segments, respectively.
The $209 million in goodwill was assigned to the U.S. operating segment. As we acquired the stock of YGR, none of the goodwill is expected to be deductible for income tax purposes.
Liabilities assumed included approximately $48 million of bank indebtedness that was paid off prior to the end of the second quarter of 2002 and approximately $11 million in capital lease obligations. We also assumed approximately $168 million in present value of future rent obligations related to three existing sale-leaseback agree-ments entered into by YGR involving approximately 350 LJS units. As a result of liens held by the buyer/lessor on certain personal property within the units, the sale-lease-back agreements were accounted for as financings upon acquisition. As discussed further in Note 14, two of these sale-leaseback agreements were amended during 2003 and are now being accounted for as operating leases.
As of the date of acquisition we recorded approxi-mately $49 million of reserves (“exit liabilities”) related to our plans to consolidate certain support functions, and exit certain markets through store refranchisings and closures, as presented in the table below. The consolida-tion of certain support functions included the termination of approximately 100 employees. Our remaining exit liabilities, as well as amounts utilized through cash payments during 2003 and 2002, are presented below.
Lease and Other Severance Contract Other Benefits Terminations Costs Total
Total reserve at acquisition $ 13 $ 31 $ 5 $ 49
Amounts utilized in 2003 (5) (5) (3) (13)Amounts utilized in 2002 (8) — (1) (9)
Total reserve as ofDecember 27, 2003 $ — $ 26 $ 1 $ 27
We expensed integration costs of approximately $4 million in 2003 and $6 million in 2002 related to the acquisi-tion. These costs were recorded as AmeriServe and other charges (credits). See Note 7 for further discussion regarding AmeriServe and other charges (credits).
The results of operations for YGR have been included in our Consolidated Financial Statements since the date of acquisition. If the acquisition had been completed as of the beginning of the years ended December 28, 2002 and
December 29, 2001, pro forma Company sales and fran-chise and license fees would have been as follows:
2002 2001
Company sales $ 7,139 $ 6,683Franchise and license fees 877 839
The impact of the acquisition, including interest expense on debt incurred to finance the acquisition, on net income and diluted earnings per share would not have been significant in 2002 and 2001. The pro forma information is not necessarily indicative of the results of operations had the acquisition actually occurred at the beginning of each of these periods nor is it necessarily indicative of future results.
ACCUMULATED OTHER COMPREHENSIVE INCOME (LOSS)note 5
Accumulated other comprehensive income (loss) includes:
2003 2002
Foreign currency translation adjustment $ (107) $ (176)Minimum pension liability adjustment, net of tax (101) (71)Unrealized losses on derivative instruments,
net of tax (2) (2)
Total accumulated other comprehensive income (loss) $ (210) $ (249)
EARNINGS PER COMMON SHARE (“EPS”)note 6 2003 2002 2001
Net income $ 617 $ 583 $ 492
Basic EPS:Weighted-average common shares
outstanding 293 296 293
Basic EPS $ 2.10 $ 1.97 $ 1.68
Diluted EPS:Weighted-average common shares
outstanding 293 296 293Shares assumed issued on exercise
of dilutive share equivalents 52 56 55Shares assumed purchased with
proceeds of dilutive share equivalents (39) (42) (44)
Shares applicable to diluted earnings 306 310 304
Diluted EPS $ 2.02 $ 1.88 $ 1.62
Unexercised employee stock options to purchase approxi-mately 4 million, 1.4 million and 5.1 million shares of our Common Stock for the years ended December 27, 2003, December 28, 2002 and December 29, 2001, respec-tively, were not included in the computation of diluted EPS because their exercise prices were greater than the average market price of our Common Stock during the year.

Yum! Brands Inc. 59.
ITEMS AFFECTING COMPARABILITY OF NET INCOMEnote 7Facility ActionsFacility actions consists of the following components:
Refranchising net (gains) losses;
Store closure costs;
Impairment of long-lived assets for stores we intend to close and stores we intend to continue to use in the business;
Impairment of goodwill and indefinite-lived intangible assets subsequent to the adoption of SFAS 142.
2003 2002 2001
U.S.Refranchising net (gains) losses(a) (b) $ (20) $ (4) $ (44)Store closure costs 1 8 13Store impairment charges 10 15 14SFAS 142 impairment charges(c) 5 — —
Facility actions (4) 19 (17)
InternationalRefranchising net (gains) losses(a) (b) 16 (15) 5Store closure costs 5 7 4Store impairment charges 19 16 9SFAS 142 impairment charges(c) — 5 —
Facility actions 40 13 18
WorldwideRefranchising net (gains) losses(a) (b) (4) (19) (39)Store closure costs 6 15 17Store impairment charges 29 31 23SFAS 142 impairment charges(c) 5 5 —
Facility actions $ 36 $ 32 $ 1
(a) Includes initial franchise fees in the U.S. of $3 million in 2003, $1 million in 2002 and $4 million in 2001 and in International of $2 million in 2003, $5 million in 2002 and $3 million in 2001. See Note 9.
(b) In 2001, U.S. refranchising net (gains) losses included $12 million of previously deferred refranchising gains and International refranchising net (gains) losses included a charge of $11 million to mark to market the net assets of the Singapore business, which was held for sale. The Singapore business was subsequently sold during the third quarter of 2002. In 2003, International refranchising net (gains) losses included a charge of approximately $16 million to write down the carrying value of the Puerto Rican business to fair value.
(c) In 2003, we recorded a $5 million charge in the U.S. related to the impairment of the A&W trademark/brand (see further discussion at Note 12). In 2002, we recorded a $5 million charge in International related to the impairment of the goodwill of the Pizza Hut France reporting unit.
The following table summarizes the 2003 and 2002 activity related to reserves for remaining lease obligations for stores closed or stores we intend to close.
Estimate/ Beginning Amounts New Decision Ending Balance Used Decisions Changes Other Balance
2002 Activity $ 48 (17) 16 3 1 $ 51
2003 Activity $ 51 (27) 11 2 3 $ 40
The following table summarizes the carrying values of the major classes of assets held for sale at December 27, 2003 and December 28, 2002. U.S. amounts primarily represent land on which we previously operated restaurants and are net of impairment charges of $2 million and $4 million at December 27, 2003 and December 28, 2002, respectively. The carrying values in International relate primarily to our
Puerto Rican business, which we wrote down $16 million during 2003 to reflect then current estimates of its fair value. These write-downs were recorded as a refranchising loss. The carrying values of liabilities of the Puerto Rican business that we anticipate will be assumed by a buyer were not significant at December 27, 2003 or at December 28, 2002.
December 27, 2003
Inter- U.S. national Worldwide
Property, plant and equipment, net $ 9 $ 73 $ 82Goodwill — 12 12Other assets — 2 2
Assets classified as held for sale $ 9 $ 87 $ 96
December 28, 2002
Inter- U.S. national Worldwide
Property, plant and equipment, net $ 7 $ 89 $ 96Goodwill — 13 13Other assets — 2 2
Assets classified as held for sale $ 7 $ 104 $ 111
The following table summarizes Company sales and restau-rant profit related to stores held for sale at December 27, 2003, or disposed of through refranchising or closure during 2003, 2002 and 2001. Stores disposed of through closure include certain stores we have relocated within the same trade area. The operations of such stores classified as held for sale as of December 27, 2003 or December 28, 2002 or disposed of in 2003 or 2002, which meet the conditions of SFAS 144 for reporting as discontinued operations were not material. Restaurant profit represents Company sales less the cost of food and paper, payroll and employee benefits and occupancy and other operating expenses.
2003 2002 2001
Stores held for sale at December 27, 2003:
Sales $ 187 $ 189 $ 184 Restaurant profit 34 28 23Stores disposed of in
2003, 2002 and 2001: Sales $ 158 $ 324 $ 640 Restaurant profit 14 37 67
Restaurant profit on stores held for sale includes a benefit from the suspension of depreciation and amortization of approximately $13 million and $4 million in 2003 and 2002, respectively.
Wrench LitigationExpense of $42 million for 2003 reflects the legal judg-ment against Taco Bell Corp. on June 4, 2003 in Wrench v. Taco Bell Corp. and related interest. See Note 24 for a discussion of Wrench litigation.
AmeriServe and Other Charges (Credits)AmeriServe Food Distribution Inc. (“AmeriServe”) was the primary distributor of food and paper supplies to our U.S.

60.
stores when it filed for protection under Chapter 11 of the U.S. Bankruptcy Code on January 31, 2000. A plan of reor-ganization for AmeriServe (the “POR”) was approved on November 28, 2000, which resulted in, among other things, the assumption of our distribution agreement, subject to certain amendments, by McLane Company, Inc. During the AmeriServe bankruptcy reorganization process, we took a number of actions to ensure continued supply to our system. Those actions resulted in significant expense for the Company, primarily recorded in 2000. Under the POR we are entitled to proceeds from certain residual assets, pref-erence claims and other legal recoveries of the estate.
We classify expenses and recoveries related to AmeriServe, as well as integration costs related to our acquisition of YGR, costs to defend certain wage and hour litigation and certain other items, as AmeriServe and other charges (credits). These amounts were classified as unusual items in previous years.
Income of $26 million was recorded as AmeriServe and other charges (credits) for 2003 and primarily includes recoveries related to the AmeriServe bankruptcy reorga-nization process. Income of $27 million was recorded as AmeriServe and other charges (credits) for 2002, primarily resulting from recoveries related to the AmeriServe bank-ruptcy reorganization process, partially offset by integration costs related to our acquisition of YGR and costs to defend certain wage and hour litigation. Income of $3 million was recorded as AmeriServe and other charges (credits) for 2001, which primarily included recoveries related to the AmeriServe bankruptcy reorganization process offset by aggregate settlement costs associated with certain litigation, and expenses, primarily severance, related to decisions to streamline certain support functions. The reserves related to decisions to streamline certain support functions were utilized in 2002.
SUPPLEMENTAL CASH FLOW DATAnote 8 2003 2002 2001
Cash Paid for: Interest $ 178 $ 153 $ 164 Income taxes 196 200 264Significant Non-Cash Investing and
Financing Activities: Assumption of debt and capital leases
related to the acquisition of YGR $ — $ 227 $ — Capital lease obligations incurred to
acquire assets 9 23 18 Contribution of non-cash net assets
to an unconsolidated affiliate — — 21 Assumption of liabilities in connection
with a franchise acquisition — — 36 Fair market value of assets received in
connection with a non-cash acquisition — — 9 Debt reduction due to amendment of
sale-lease back agreements (See Note 14) 88 — —
On November 10, 2003 our unconsolidated affiliate in Canada was dissolved. Upon dissolution, the Company assumed operation of certain units that were previously operated by the unconsolidated affiliate. The Company also assumed ownership of the assets related to the units that it now operates, as well as the real estate associated with certain units previously owned and operated by the uncon-solidated affiliate that are not operated by franchisees (either our former partner in the unconsolidated affiliate or a publicly-held Income Trust in Canada). The acquired real estate associated with the units that are not operated by the Company is being leased to the franchisees. The resulting reduction in our investments in unconsolidated affiliates ($56 million at November 10, 2003) was primarily offset by increases in property, plant and equipment, net and capital lease receivables (included in other assets). The Company realized an immaterial gain upon the dissolution of the unconsolidated affiliate. This gain was realized as the fair value of our increased ownership in the assets received was greater than our carrying value in these assets, and was net of expenses associated with the dissolution.
FRANCHISE AND LICENSE FEESnote 9
2003 2002 2001
Initial fees, including renewal fees $ 36 $ 33 $ 32Initial franchise fees included in
refranchising gains (5) (6) (7)
31 27 25Continuing fees 908 839 790
$ 939 $ 866 $ 815
OTHER (INCOME) EXPENSEnote 10 2003 2002 2001
Equity income from investments in unconsolidated affiliates $ (39) $ (29) $ (26)
Foreign exchange net (gain) loss (2) (1) 3
$ (41) $ (30) $ (23)
PROPERTY, PLANT AND EQUIPMENT, NETnote 11 2003 2002
Land $ 662 $ 621Buildings and improvements 2,861 2,742Capital leases, primarily buildings 119 102Machinery and equipment 1,964 1,736
5,606 5,201Accumulated depreciation and amortization (2,326) (2,164)
$ 3,280 $ 3,037
Depreciation and amortization expense related to property, plant and equipment was $388 million, $357 million and $320 million in 2003, 2002 and 2001, respectively.

Yum! Brands Inc. 61.
GOODWILL AND INTANGIBLE ASSETSnote 12The changes in the carrying amount of goodwill are as follows: Inter- U.S. national Worldwide
Balance as of December 29, 2001 $ 21 $ 38 $ 59Reclassification of reacquired
franchise rights(a) 145 96 241Impairment(b) — (5) (5)Acquisitions, disposals and other, net(c) 206 (16) 190
Balance as of December 28, 2002 $ 372 $ 113 $ 485Acquisitions, disposals and other, net(d) 14 22 36
Balance as of December 27, 2003 $ 386 $ 135 $ 521
(a) The Company’s business combinations have included acquiring restaurants from our franchisees. Prior to the adoption of SFAS 141, the primary intangible asset to which we generally allocated value in these business combinations was reacquired franchise rights. We determined that reacquired franchise rights did not meet the criteria of SFAS 141 to be recognized as an asset apart from goodwill. Accordingly, on December 30, 2001, we reclassified $241 million of reacquired franchise rights to goodwill, net of related deferred tax liabilities of $53 million, ($27 million for the U.S. and $26 million for International).
(b) Represents impairment of the goodwill of the Pizza Hut France reporting unit.
(c) Includes goodwill related to the YGR purchase price allocation. For International, includes a $13 million transfer of goodwill to assets held for sale (see Note 7).
(d) Primarily includes goodwill recorded as a result of acquisitions of restaurants from franchisees.
Intangible assets, net for the years ended 2003 and 2002 are as follows: 2003 2002 Gross Gross Carrying Accumulated Carrying Accumulated Amount Amortization Amount Amortization
Amortized intangible assets Franchise contract rights $ 141 $ (49) $ 135 $ (43) Trademarks/brands 67 (1) — — Favorable operating leases 19 (13) 21 (13) Pension-related intangible 14 — 18 — Other 31 (23) 26 (23)
$ 272 $ (86) $ 200 $ (79)
Unamortized intangible assets Trademarks/brands $ 171 $ 243
The most significant recorded trademark/brand assets resulted when we acquired YGR in 2002. The fair value of a trademark/brand is determined based upon the value derived from the royalty we avoid, in the case of Company stores, or receive, in the case of franchise and licensee stores, for the use of the trademark/brand. This fair value determination is thus largely dependent upon our estima-tion of sales attributable to the trademark/brand.
The fair value of the LJS trademark/brand was deter-mined to be in excess of its carrying value during our 2003 annual impairment test. The estimate of sales attributable to the LJS trademark/brand at the date of this test reflected the opportunities we believe exist with regard to increased penetration of LJS, for both stand-alone units and as a multibrand partner. Accordingly, we now believe our system’s development capital, at least through the term of our current projections, will be primarily directed towards LJS.
The decision to focus short-term development largely on increased penetration of LJS and our discretionary capital spending limits have resulted in less than originally planned development of A&W in the near term. Additionally, while we continue to view A&W as a viable multibrand partner, subsequent to acquisition we decided to close or refranchise all Company-owned A&W restaurants that we had acquired. These restaurants were low-volume, mall-based units that were inconsistent with the remainder of our Company-owned portfolio. Both the decision to close these Company-owned A&W units and the decision to focus on short-term development opportunities at LJS negatively impacted the fair value of the A&W trademark/brand. Accordingly, we recorded a $5 million charge in 2003 to facility actions to write the value of the A&W trademark/brand down to its fair value.
Historically, we have considered the assets acquired representing trademark/brand to have indefinite useful lives due to our expected use of the asset and the lack of legal, regulatory, contractual, competitive, economic or other factors that may limit their useful lives. As required by SFAS 142, we reconsider the remaining useful life of indefi-nite-life intangible assets each reporting period. Subsequent to the recording of the impairment of the A&W trademark/brand, we began amortizing its remaining balance over a period of thirty years (less than $1 million of amortization expense was recorded in 2003). While we continue to incor-porate development of the A&W trademark/brand into our multibranding plans, our decision to no longer operate the acquired stand-alone Company-owned A&W restaurants is considered a factor that limits its useful life. Accordingly, we are amortizing the remaining balance of the A&W trademark/brand over a period of thirty years, the typical term of our multibrand franchise agreements including renewals. We continue to believe that all of our other recorded trademark/brand assets have indefinite lives.
As a result of adopting SFAS 142, we ceased amor-tization of goodwill and indefinite-lived intangible assets beginning December 30, 2001. Amortization expense for definite-lived intangible assets was $7 million in 2003 and $6 million in 2002, respectively. Amortization expense for goodwill and all intangible assets was $37 million in 2001. Amortization expense for definite-lived intangible assets will approximate $9 million in 2004, $8 million in 2005 and 2006, and $7 million in both 2007 and 2008.
The following table provides a reconciliation of reported net income to adjusted net income as though SFAS 142 had been effective for the year ended 2001:
2001
Amount Basic EPS Diluted EPS
Reported net income $ 492 $ 1.68 $ 1.62Add back amortization expense
(net of tax): Goodwill 25 0.09 0.09 Trademarks/brands 1 — —
Adjusted net income $ 518 $ 1.77 $ 1.71

62.
ACCOUNTS PAYABLE AND OTHER CURRENT LIABILITIESnote 13 2003 2002
Accounts payable $ 439 $ 417Accrued compensation and benefits 257 258Other current liabilities 517 491
$ 1,213 $ 1,166
SHORT-TERM BORROWINGS AND LONG-TERM DEBTnote 14 2003 2002
Short-term BorrowingsCurrent maturities of long-term debt $ 10 $ 12International lines of credit — 115Other — 19
$ 10 $ 146
Long-term DebtSenior, unsecured Revolving Credit Facility,
expires June 2005 $ — $ 153Senior, Unsecured Notes, due May 2005 351 351Senior, Unsecured Notes, due April 2006 200 200Senior, Unsecured Notes, due May 2008 251 251Senior, Unsecured Notes, due April 2011 645 645Senior, Unsecured Notes, due July 2012 398 398Capital lease obligations (See Note 15) 112 99Other, due through 2010 (6% – 12%) 80 170
2,037 2,267Less current maturities of long-term debt (10) (12)
Long-term debt excluding SFAS 133 adjustment 2,027 2,255Derivative instrument adjustment under
SFAS 133 (See Note 16) 29 44
Long-term debt including SFAS 133 adjustment $ 2,056 $ 2,299
Our primary bank credit agreement comprises a senior unsecured Revolving Credit Facility (the “Credit Facility”) which matures on June 25, 2005. On December 26, 2003, we voluntarily reduced our maximum borrowings under the Credit Facility from $1.2 billion to $1.0 billion. The Credit Facility is unconditionally guaranteed by our principal domestic subsidiaries and contains financial covenants relating to maintenance of leverage and fixed charge coverage ratios. The Credit Facility also contains affirmative and negative covenants including, among other things, limi-tations on certain additional indebtedness, guarantees of indebtedness, level of cash dividends, aggregate non-U.S. investment and certain other transactions as defined in the agreement. We were in compliance with all debt covenants at December 27, 2003.
Under the terms of the Credit Facility, we may borrow up to the maximum borrowing limit less outstanding letters of credit. At December 27, 2003, our unused Credit Facility totaled $737 million, net of outstanding letters of credit of $263 million. There were no borrowings outstanding under the Credit Facility at the end of the year. The interest rate for borrowings under the Credit Facility ranges from 1.0% to 2.0% over the London Interbank Offered Rate (“LIBOR”)
or 0.00% to 0.65% over an Alternate Base Rate, which is the greater of the Prime Rate or the Federal Funds Effective Rate plus 0.50%. The exact spread over LIBOR or the Alternate Base Rate, as applicable, will depend upon our performance under specified financial criteria. Interest on any outstanding borrowings under the Credit Facility is payable at least quarterly. In 2003, 2002 and 2001, we expensed facility fees of approximately $6 million, $5 million and $4 million, respectively. At December 28, 2002, the weighted average contractual interest rate on borrowings outstanding under the Credit Facility was 2.6%.
In 1997, we filed a shelf registration statement with the Securities and Exchange Commission for offerings of up to $2 billion of senior unsecured debt. In June 2002, we issued $400 million of 7.70% Senior Unsecured Notes due July 1, 2012 (the “2012 Notes”). The net proceeds from the issuance of the 2012 Notes were used to repay indebted-ness under the Credit Facility. Additionally, we capitalized debt issuance costs of approximately $5 million related to the 2012 Notes in the third quarter of 2002. The following table summarizes all Senior Unsecured Notes issued under this shelf registration through December 27, 2003:
Principal Interest RateIssuance Date Maturity Date Amount Stated Effective.(d)
May 1998 May 2005(a) $ 350 7.45% 7.62%May 1998 May 2008(a) 250 7.65% 7.81%April 2001 April 2006(b) 200 8.50% 9.04%April 2001 April 2011(b) 650 8.88% 9.20%June 2002 July 2012(c) 400 7.70% 8.04%(a) Interest payments commenced on November 15, 1998 and are payable semi-
annually thereafter.
(b) Interest payments commenced on October 15, 2001 and are payable semi-annually thereafter.
(c) Interest payments commenced on January 1, 2003 and are payable semi-annually thereafter.
(d) Includes the effects of the amortization of any (1) premium or discount; (2) debt issuance costs; and (3) gain or loss upon settlement of related treasury locks. Does not include the effect of any interest rate swaps as described in Note 16.
We have $150 million remaining for issuance under the $2 billion shelf registration.
In connection with our acquisition of YGR in 2002, we assumed approximately $168 million in present value of future rent obligations related to three existing sale-leaseback agreements entered into by YGR involving approximately 350 LJS units. As a result of liens held by the buyer/lessor on certain personal property within the units, the sale-leaseback agreements were accounted for as financings upon acquisition. On August 15, 2003, we amended two of these sale-leaseback agreements to remove the liens on the personal property within the units. As the two amended agreements now qualify for sale-lease-back accounting, they will be accounted for as operating leases. Accordingly, the future rent obligations associated with the two amended agreements, previously recorded as long-term debt of $88 million, are no longer reflected on our Consolidated Balance Sheet as of December 27, 2003. There was no gain or loss recorded as a result of this transaction.

Yum! Brands Inc. 63.
The annual maturities of long-term debt as of December 27, 2003, excluding capital lease obligations of $112 million and derivative instrument adjustments of $29 million, are as follows:
Year ended:
2004 $ 12005 3512006 2022007 22008 252Thereafter 1,122
Total $ 1,930
Interest expense on short-term borrowings and long-term debt was $185 million, $180 million and $172 million in 2003, 2002 and 2001, respectively.
LEASESnote 15We have non-cancelable commitments under both capital and long-term operating leases, primarily for our restau-rants. Capital and operating lease commitments expire at various dates through 2087 and, in many cases, provide for rent escalations and renewal options. Most leases require us to pay related executory costs, which include property taxes, maintenance and insurance.
Future minimum commitments and amounts to be received as lessor or sublessor under non-cancelable leases are set forth below: Commitments Lease Receivables Direct Capital Operating Financing Operating
2004 $ 15 $ 320 $ 8 $ 222005 15 290 8 202006 14 250 7 192007 13 227 7 182008 13 204 6 17Thereafter 122 1,193 63 102
$ 192 $ 2,484 $ 99 $ 198
At year-end 2003, the present value of minimum payments under capital leases was $112 million. At December 27, 2003, and December 28, 2002, unearned income associ-ated with direct financing lease receivables was $41 million and $9 million, respectively.
The details of rental expense and income are set forth below: 2003 2002 2001
Rental expense Minimum $ 329 $ 303 $ 268 Contingent 44 40 25
$ 373 $ 343 $ 293
Minimum rental income $ 14 $ 11 $ 14
Contingent rentals are generally based on sales levels in excess of stipulated amounts contained in the lease agreements.
FINANCIAL INSTRUMENTSnote 16Derivative Instruments
Interest RatesWe enter into interest rate swaps and forward rate agree-ments with the objective of reducing our exposure to interest rate risk and lowering interest expense for a portion of our debt. Under the contracts, we agree with other parties to exchange, at specified intervals, the difference between variable rate and fixed rate amounts calculated on a notional principal amount. At December 27, 2003 and December 28, 2002, we had outstanding pay-variable interest rate swaps with notional amounts of $350 million. These swaps have reset dates and floating rate indices which match those of our underlying fixed-rate debt and have been designated as fair value hedges of a portion of that debt. As the swaps qualify for the short-cut method under SFAS 133 no ineffectiveness has been recorded. The fair value of these swaps as of December 27, 2003 and December 28, 2002 was approximately $31 million and $48 million, respectively, and has been included in other assets. The portion of this fair value which has not yet been recognized as a reduction to interest expense (approxi-mately $29 million and $44 million at December 27, 2003 and December 28, 2002, respectively) has been included in long-term debt.
During 2002, we entered into treasury locks with notional amounts totaling $250 million. These treasury locks were entered into to hedge the risk of changes in future interest payments attributable to changes in the benchmark interest rate prior to issuance of additional fixed-rate debt. These locks were designated and effective in offsetting the variability in cash flows associated with the future interest payments on a portion of the 2012 Notes. Thus, the insignificant loss at which these treasury locks were settled will be recognized as an increase to interest on the debt through 2012.
Foreign ExchangeWe enter into foreign currency forward contracts with the objective of reducing our exposure to cash flow volatility arising from foreign currency fluctuations associated with certain foreign currency denominated financial instru-ments, the majority of which are intercompany short-term receivables and payables. The notional amount, maturity date, and currency of these contracts match those of the underlying receivables or payables. For those foreign currency exchange forward contracts that we have desig-nated as cash flow hedges, we measure ineffectiveness by

64.
comparing the cumulative change in the forward contract with the cumulative change in the hedged item. No signifi-cant ineffectiveness was recognized in 2003 or 2002 for those foreign currency forward contracts designated as cash flow hedges.
CommoditiesWe also utilize on a limited basis commodity futures and options contracts to mitigate our exposure to commodity price fluctuations over the next twelve months. Those contracts have not been designated as hedges under SFAS 133. Commodity future and options contracts entered into for the fiscal years ended December 27, 2003 and December 28, 2002 did not significantly impact the Consolidated Financial Statements.
Deferred Amounts in Accumulated Other Comprehensive Income (Loss)As of December 27, 2003, we had a net deferred loss asso-ciated with cash flow hedges of approximately $2 million, net of tax. Of this amount, we estimate that a net after-tax loss of less than $1 million will be reclassified into earnings through December 25, 2004. The remaining net after-tax loss of approximately $2 million, which arose from the settlement of treasury locks entered into prior to the issuance of certain amounts of our fixed-rate debt, will be reclassified into earnings from December 26, 2004 through 2012 as an increase to interest expense on this debt.
Credit RisksCredit risk from interest rate swap, treasury lock and forward rate agreements and foreign exchange contracts is dependent both on movement in interest and currency rates and the possibility of non-payment by counterparties. We mitigate credit risk by entering into these agreements with high-quality counterparties, and netting swap and forward rate payments within contracts.
Accounts receivable consists primarily of amounts due from franchisees and licensees for initial and continuing fees. In addition, we have notes and lease receivables from certain of our franchisees. The financial condition of these franchisees and licensees is largely dependent upon the underlying business trends of our Concepts. This concentration of credit risk is mitigated, in part, by the large number of franchisees and licensees of each Concept and the short-term nature of the franchise and license fee receivables.
Fair ValueAt December 27, 2003 and December 28, 2002, the fair values of cash and cash equivalents, short-term investments, accounts receivable, and accounts payable approximated carrying value because of the short-term nature of these instruments. The fair value of notes receivable approximates carrying value after consideration of recorded allowances.
The carrying amounts and fair values of our other financial instruments subject to fair value disclosures are as follows: 2003 2002 Carrying Fair Carrying Fair Amount Value Amount Value
Debt Short-term borrowings
and long-term debt, excluding capital leases and the derivative instrument adjustments $ 1,925 $ 2,181 $ 2,302 $ 2,470
Debt-related derivative instruments:
Open contracts in a net asset position 31 31 48 48
Foreign currency-related derivative instruments:
Open contracts in a net asset (liability) position — — (1) (1)
Lease guarantees 8 37 4 42
Guarantees supporting financial arrangements of certain franchisees, unconsolidated affiliates and other third parties 8 10 16 17
Letters of credit — 3 — 3
We estimated the fair value of debt, debt-related derivative instruments, foreign currency-related derivative instruments, guarantees and letters of credit using market quotes and calculations based on market rates.
PENSION AND POSTRETIREMENT MEDICAL BENEFITSnote 17Pension BenefitsWe sponsor noncontributory defined benefit pension plans covering substantially all full-time U.S. salaried employees, certain hourly employees and certain interna-tional employees. The most significant of these plans, the YUM Retirement Plan (the “Plan”), is funded while benefits from the other plan are paid by the Company as incurred. During 2001, the Plan was amended such that any sala-ried employee hired or rehired by YUM after September 30, 2001 is not eligible to participate in the Plan. Benefits are based on years of service and earnings or stated amounts for each year of service.
Postretirement Medical BenefitsOur postretirement plan provides health care benefits, principally to U.S. salaried retirees and their dependents. This plan includes retiree cost sharing provisions. During 2001, the plan was amended such that any salaried employee hired or rehired by YUM after September 30, 2001 is not eligible to participate in this plan. Employees hired prior to September 30, 2001 are eligible for benefits

Yum! Brands Inc. 65.
if they meet age and service requirements and qualify for retirement benefits.
On December 8, 2003, the Medicare Prescription Drug, Improvement and Modernization Act of 2003 (the “Act”), which introduces a Medicare prescription drug benefit as well as a federal subsidy to sponsors of retiree health care benefit plans that provide a benefit that is at least actuari-ally equivalent to the Medicare benefit, was enacted. On January 12, 2004 the FASB issued Financial Staff Position No. 106a, “Accounting and Disclosure Requirements Related to The Medicare Prescription Drug, Improvement and Modernization Act of 2003” (“FSP 106a”) to discuss certain accounting and disclosure issues raised by the Act. We have elected to defer the measurement and disclosure requirements under the provisions of FSP 106a until specific authoritative guidance is issued by the FASB later in 2004. The reported accumulated benefit obligation and net periodic benefit costs of our postretirement plan do not reflect the effects of the Act. The authoritative guidance, when issued, could require revisions to previously reported information. While we may be eligible for benefits under the Act based on the prescription drug benefits provided in our postretirement plan, we do not believe such benefits will have a material impact on our Consolidated Financial Statements.
We use a measurement date of September 30 for our pension and post-retirement medical plans described above.
Obligation and Funded status at September 30: Postretirement Pension Benefits Medical Benefits 2003 2002 2003 2002
Change in benefit obligationBenefit obligation at
beginning of year $ 501 $ 420 $ 68 $ 58 Service cost 26 22 2 2 Interest cost 34 31 5 4 Plan amendments — 14 — — Curtailment gain (1) (3) — — Benefits and expenses paid (21) (16) (4) (3) Actuarial loss 90 33 10 7
Benefit obligation at end of year $ 629 $ 501 $ 81 $ 68
Change in plan assetsFair value of plan assets at
beginning of year $ 251 $ 291 Actual return on plan assets 52 (24) Employer contributions 157 1 Benefits paid (21) (16) Administrative expenses (1) (1)
Fair value of plan assets at end of year $ 438 $ 251
Funded status $ (191) $ (250) $ (81) $ (68)Employer contributions — 25.(a) — —Unrecognized actuarial loss 230 169 28 18Unrecognized prior service cost 12 16 — —
Net amount recognized at year-end $ 51 $ (40) $ (53) $ (50)
(a) Reflects a contribution made between the September 30, 2002 measurement date and December 28, 2002.
Amounts recognized in the statement of financial position consist of:
Accrued benefit liability $ (125) $ (172) $ (53) $ (50) Intangible asset 14 18 — — Accumulated other
comprehensive loss 162 114 — —
$ 51 $ (40) $ (53) $ (50)
Additional InformationOther comprehensive loss
attributable to change in additional minimum liability recognition $ 48 $ 76
Additional year-end information for pension plans with accumulated benefit obligations in excess of plan assets
Projected benefit obligation $ 629 $ 501 Accumulated benefit obligation 563 448 Fair value of plan assets 438 251
While we are not required to make contributions to the Plan in 2004, we may make discretionary contributions during the year based on our estimate of the Plan’s expected September 30, 2004 funded status.
Components of Net Periodic Benefit Cost Pension Benefits 2003 2002 2001
Service cost $ 26 $ 22 $ 20Interest cost 34 31 28Amortization of prior service cost 4 1 1Expected return on plan assets (30) (28) (29)Recognized actuarial loss 6 1 1
Net periodic benefit cost $ 40 $ 27 $ 21
Additional loss recognized due to: Curtailment $ — $ 1 $ — Special termination benefits — — 2 Postretirement Medical Benefits 2003 2002 2001
Service cost $ 2 $ 2 $ 2Interest cost 5 4 4Amortization of prior service cost — — (1)Recognized actuarial loss 1 1 —
Net periodic benefit cost $ 8 $ 7 $ 5
Prior service costs are amortized on a straight-line basis over the average remaining service period of employees expected to receive benefits. Curtailment gains and losses have gener-ally been recognized in facility actions as they have resulted primarily from refranchising and closure activities.
Weighted-average assumptions used to determine benefit obligations at September 30: Postretirement Pension Benefits Medical Benefits 2003 2002 2003 2002
Discount rate 6.25% 6.85% 6.25% 6.85%Rate of compensation increase 3.75% 3.85% 3.75% 3.85%

66.
Weighted-average assumptions used to determine the net periodic benefit cost for fiscal years: Pension Benefits Postretirement Medical Benefits 2003 2002 2001 2003 2002 2001
Discount rate 6.85% 7.60% 8.03% 6.85% 7.58% 8.27%Long-term rate of return on plan assets 8.50% 10.00% 10.00% — — —Rate of compensation increase 3.85% 4.60% 5.03% 3.85% 4.60% 5.03%
Our estimated long-term rate of return on plan assets represents a weighted-average of expected future returns on the asset categories included in our target investment allocation based primarily on the historical returns for each asset category, adjusted for an assessment of current market conditions.
Assumed health care cost trend rates at September 30: Postretirement Medical Benefits 2003 2002
Health care cost trend rate assumed for next year 12% 12%Rate to which the cost trend rate is assumed to
decline (the ultimate trend rate) 5.5% 5.5%Year that the rate reaches the ultimate trend rate 2012 2011
There is a cap on our medical liability for certain retirees. The cap for Medicare eligible retirees was reached in 2000 and the cap for non-Medicare eligible retirees is expected to be reached between the years 2007–2008; once the cap is reached, our annual cost per retiree will not increase.
Assumed health care cost trend rates have a signifi-cant effect on the amounts reported for our postretirement health care plans. A one-percentage-point change in assumed health care cost trend rates would have the following effects: 1-Percentage- 1-Percentage- Point Point Increase Decrease
Effect on total of service and interest cost $ — $ —Effect on postretirement benefit obligation $ 4 $ (3)
Plan AssetsOur pension plan weighted-average asset allocations at September 30, by asset category are set forth below:
Asset Category 2003 2002
Equity securities 65% 62%Debt securities 30% 37%Cash 5% 1%
Total 100% 100%
Our primary objectives regarding the pension assets are to optimize return on assets subject to acceptable risk and to maintain liquidity, meet minimum funding requirements and minimize plan expenses. To achieve these objectives we have adopted a passive investment strategy in which the asset performance is driven primarily by the investment allocation. Our target investment allocation is 70% equity securities and 30% debt securities, consisting primarily of low cost index mutual funds that track several sub-
categories of equity and debt security performance. The investment strategy is primarily driven by lower participant ages and reflects a long-term investment horizon favoring a higher equity component in the investment allocation.
A mutual fund held as an investment by the pension plan includes YUM stock in the amounts of $0.2 million and $0.1 million at September 30, 2003 and 2002 (less than 1% of total plan assets in each instance).
STOCK-BASED EMPLOYEE COMPENSATIONnote 18At year-end 2003, we had four stock option plans in effect: the YUM! Brands, Inc. Long-Term Incentive Plan (“1999 LTIP”), the 1997 Long-Term Incentive Plan (“1997 LTIP”), the YUM! Brands, Inc. Restaurant General Manager Stock Option Plan (“RGM Plan”) and the YUM! Brands, Inc. SharePower Plan (“SharePower”). During 2003, the 1999 LTIP was amended, subsequent to shareholder approval, to increase the total number of shares available for issuance and to make certain other technical and clarifying changes.
We may grant awards of up to 29.8 million shares and 45.0 million shares of stock under the 1999 LTIP, as amended, and 1997 LTIP, respectively. Potential awards to employees and non-employee directors under the 1999 LTIP include stock options, incentive stock options, stock appre-ciation rights, restricted stock, stock units, restricted stock units, performance shares and performance units. Potential awards to employees and non-employee directors under the 1997 LTIP include stock appreciation rights, restricted stock and performance restricted stock units. Prior to January 1, 2002, we also could grant stock options and incentive stock options under the 1997 LTIP. We have issued only stock options and performance restricted stock units under the 1997 LTIP and have issued only stock options under the 1999 LTIP.
We may grant stock options under the 1999 LTIP to purchase shares at a price equal to or greater than the average market price of the stock on the date of grant. New option grants under the 1999 LTIP can have varying vesting provisions and exercise periods. Previously granted options under the 1997 LTIP and 1999 LTIP vest in periods ranging from immediate to 2007 and expire ten to fifteen years after grant.
We may grant options to purchase up to 15.0 million shares of stock under the RGM Plan at a price equal to or greater than the average market price of the stock on the

Yum! Brands Inc. 67.
date of grant. RGM Plan options granted have a four year vesting period and expire ten years after grant. We may grant options to purchase up to 14.0 million shares of stock at a price equal to or greater than the average market price of the stock on the date of grant under SharePower. Previously granted SharePower options have expirations through 2013.
At the Spin-off Date, we converted certain of the unvested options to purchase PepsiCo stock that were held by our employees to YUM stock options under either the 1997 LTIP or SharePower. We converted the options at amounts and exercise prices that maintained the amount of unrealized stock appreciation that existed immediately prior to the Spin-off. The vesting dates and exercise periods of the options were not affected by the conversion. Based on their original PepsiCo grant date, these converted options
vest in periods ranging from one to ten years and expire ten to fifteen years after grant.
We estimated the fair value of each option grant made during 2003, 2002 and 2001 as of the date of grant using the Black-Scholes option-pricing model with the following weighted average assumptions: 2003 2002 2001
Risk-free interest rate 3.0% 4.3% 4.7%Expected life (years) 6.0 6.0 6.0Expected volatility 33.6% 33.9% 32.7%Expected dividend yield 0.0% 0.0% 0.0%
A summary of the status of all options granted to employees and non-employee directors as of December 27, 2003, December 28, 2002 and December 29, 2001, and changes during the years then ended is presented below (tabular options in thousands):
December 27, 2003 December 28, 2002 December 29, 2001 Wtd. Avg. Wtd. Avg. Wtd. Avg. Exercise Exercise Exercise Options Price Options Price Options Price
Outstanding at beginning of year 49,630 $ 17.54 54,452 $ 16.04 53,358 $ 15.60Granted at price equal to average market price 7,344 24.78 6,974 25.52 10,019 17.34Exercised (6,902) 16.18 (8,876) 14.06 (3,635) 11.56Forfeited (3,101) 19.18 (2,920) 19.07 (5,290) 17.16
Outstanding at end of year 46,971 $ 18.77 49,630 $ 17.54 54,452 $ 16.04
Exercisable at end of year 19,875 $ 17.22 17,762 $ 13.74 12,962 $ 12.76
Weighted average fair value of options granted during the year $ 9.43 $ 10.44 $ 7.10
The following table summarizes information about stock options outstanding and exercisable at December 27, 2003 (tabular options in thousands): Options Outstanding Options Exercisable Wtd. Avg. Remaining Wtd. Avg. Wtd. Avg.Range of Exercise Prices Options Contractual Life Exercise Price Options Exercise Price
$ 0 – 10 882 1.11 $ 7.70 882 $ 7.7010 – 15 7,757 3.29 12.73 7,109 12.7215 – 20 20,568 6.09 16.12 5,861 16.3620 – 30 16,656 7.72 24.42 5,379 23.3930 – 40 1,108 7.22 34.05 644 36.30
46,971 19,875

68.
In November 1997, we granted two awards of performance restricted stock units of YUM’s Common Stock to our Chief Executive Officer (“CEO”). The awards were made under the 1997 LTIP and may be paid in Common Stock or cash at the discretion of the Compensation Committee of the Board of Directors. Payment of an award of $2.7 million was contingent upon the CEO’s continued employment through January 25, 2001 and our attainment of certain pre-established earnings thresholds. In January 2001, our CEO received a cash payment of $2.7 million following the Compensation Committee’s certification of YUM’s attainment of the pre-established earnings threshold. Payment of an award of $3.6 million is contingent upon his employment through January 25, 2006 and our attain-ment of certain pre-established earnings thresholds. The annual expense related to these awards included in earn-ings was $0.4 million for 2003, $0.4 million for 2002 and $0.5 million for 2001.
OTHER COMPENSATION AND BENEFIT PROGRAMSnote 19We sponsor two deferred compensation benefit programs, the Restaurant Deferred Compensation Plan and the Executive Income Deferral Program (the “RDC Plan” and the “EID Plan,” respectively) for eligible employees and non-employee directors.
Effective October 1, 2001, participants can no longer defer funds into the RDC Plan. Prior to that date, the RDC Plan allowed participants to defer a portion of their annual salary. The participant’s balances will remain in the RDC Plan until their scheduled distribution dates. As defined by the RDC Plan, we credit the amounts deferred with earnings based on the investment options selected by the participants. Investment options in the RDC Plan consist of phantom shares of various mutual funds and YUM Common Stock. We recognize compensation expense for the apprecia-tion or depreciation, if any, attributable to all investments in the RDC Plan, and prior to October 1, 2001, for any matching contributions. Our obligations under the RDC program as of the end of 2003 and 2002 were $11 million and $10 million, respectively. We recognized annual compensation expense of $3 million in 2003, less than $1 million in 2002 and $3 million in 2001 for the RDC Plan.
The EID Plan allows participants to defer receipt of a portion of their annual salary and all or a portion of their incentive compensation. As defined by the EID Plan, we credit the amounts deferred with earnings based on the investment options selected by the participants. These investment options are limited to cash and phantom shares of our Common Stock. The EID Plan allows participants to defer incentive compensation to purchase phantom shares of our Common Stock at a 25% discount from the average market price at the date of deferral (the “Discount Stock Account”). Participants bear the risk of forfeiture of both
the discount and any amounts deferred to the Discount Stock Account if they voluntarily separate from employ-ment during the two year vesting period. We expense the intrinsic value of the discount over the vesting period. As investments in the phantom shares of our Common Stock can only be settled in shares of our Common Stock, we do not recognize compensation expense for the appreciation or the depreciation, if any, of these investments. Deferrals into the phantom shares of our Common Stock are credited to the Common Stock Account.
Our cash obligations under the EID Plan as of the end of 2003 and 2002 were $25 million and $24 million, respec-tively. We recognized compensation expense of $3 million in 2003, $2 million in 2002 and $4 million in 2001 for the EID Plan.
We sponsor a contributory plan to provide retirement benefits under the provisions of Section 401(k) of the Internal Revenue Code (the “401(k) Plan”) for eligible U.S. salaried and hourly employees. During 2003, participants were able to elect to contribute up to 25% of eligible compensation on a pre-tax basis (the maximum participant contribution increased from 15% to 25% effective January 1, 2003). Participants may allocate their contributions to one or any combination of 10 investment options within the 401(k) Plan. Effective October 1, 2001, the 401(k) Plan was amended such that the Company matches 100% of the participant’s contribution up to 3% of eligible compensation and 50% of the participant’s contribution on the next 2% of eligible compensation. All matching contributions are made to the YUM Common Stock Fund. Prior to this amendment, we made a discretionary matching contribution equal to a predetermined percentage of each participant’s contribu-tion to the YUM Common Stock Fund. We determined our percentage match at the beginning of each year based on the immediate prior year performance of our Concepts. We recognized as compensation expense our total matching contribution of $10 million in 2003, $8 million in 2002 and $5 million in 2001.
SHAREHOLDERS’ RIGHTS PLANnote 20In July 1998, our Board of Directors declared a dividend distribution of one right for each share of Common Stock outstanding as of August 3, 1998 (the “Record Date”). As a result of the two-for-one stock split distributed on June 17, 2002, each holder of Common Stock is entitled to one right for every two shares of Common Stock (one-half right per share). Each right initially entitles the registered holder to purchase a unit consisting of one one-thousandth of a share (a “Unit”) of Series A Junior Participating Preferred Stock, without par value, at a purchase price of $130 per Unit, subject to adjustment. The rights, which do not have voting rights, will become exercisable for our Common Stock ten business days following a public announcement that a

Yum! Brands Inc. 69.
person or group has acquired, or has commenced or intends to commence a tender offer for, 15% or more, or 20% or more if such person or group owned 10% or more on the adoption date of this plan, of our Common Stock. In the event the rights become exercisable for Common Stock, each right will entitle its holder (other than the Acquiring Person as defined in the Agreement) to purchase, at the right’s then-current exercise price, YUM Common Stock having a value of twice the exercise price of the right. In the event the rights become exercisable for Common Stock and thereafter we are acquired in a merger or other business combination, each right will entitle its holder to purchase, at the right’s then-current exercise price, common stock of the acquiring company having a value of twice the exercise price of the right.
We can redeem the rights in their entirety, prior to becoming exercisable, at $0.01 per right under certain specified conditions. The rights expire on July 21, 2008, unless we extend that date or we have earlier redeemed or exchanged the rights as provided in the Agreement.
This description of the rights is qualified in its entirety by reference to the original Rights Agreement, dated July 21, 1998, and the Agreement of Substitution and Amendment of Common Share Rights Agreement, dated August 28, 2003, between YUM and American Stock Transfer and Trust Company, the Rights Agent (both including the exhibits thereto).
SHARE REPURCHASE PROGRAMnote 21In November 2003, our Board of Directors authorized a new share repurchase program. This program authorizes us to repurchase, through May 21, 2005, up to $300 million of our outstanding Common Stock (excluding applicable trans-action fees). During 2003, we repurchased approximately 169,000 shares for approximately $5.7 million under this program at an average price per share of approximately $34. Based on market conditions and other factors, addi-tional repurchases may be made from time to time in the open market or through privately negotiated transactions at the discretion of the Company.
In November 2002, our Board of Directors authorized a share repurchase program. This program authorized us to repurchase up to $300 million (excluding applicable transaction fees) of our outstanding Common Stock. This share repurchase program was completed in 2003. During 2003, we repurchased approximately 9.2 million shares for approximately $272 million at an average price per share of approximately $30 under this program. During 2002, we repurchased approximately 1.2 million shares for approximately $28 million at an average price per share of approximately $24 under this program.
In February 2001, our Board of Directors authorized a share repurchase program. This program authorized us
to repurchase up to $300 million (excluding applicable transaction fees) of our outstanding Common Stock. This share repurchase program was completed in 2002. During 2002, we repurchased approximately 7.0 million shares for approximately $200 million at an average price per share of approximately $29 under this program. During 2001, we repurchased approximately 4.8 million shares for approximately $100 million at an average price per share of approximately $21 under this program.
INCOME TAXESnote 22The details of our income tax provision (benefit) are set forth below. Amounts do not include the income tax benefit of approximately $1 million on the $2 million cumulative effect adjustment recorded on December 29, 2002 due to the adoption of SFAS 143. 2003 2002 2001
Current:Federal $ 181 $ 137 $ 200Foreign 114 93 75State (4) 24 38
291 254 313
Deferred:Federal (23) 29 (29)Foreign (16) (6) (33)State 16 (2) (10)
(23) 21 (72)
$ 268 $ 275 $ 241
Taxes payable were reduced by $26 million, $49 million and $13 million in 2003, 2002 and 2001, respectively, as a result of stock option exercises. In addition, goodwill and other intangibles were reduced by $8 million in 2001 as a result of the settlement of a disputed claim with the Internal Revenue Service relating to the deductibility of reacquired franchise rights and other intangibles offset by an $8 million reduction in deferred and accrued taxes payable.
Valuation allowances related to deferred tax assets in certain states increased by $6 million ($4 million, net of federal tax) and $1 million ($1 million, net of federal tax) and in foreign countries increased by $19 million and $6 million in 2003 and 2002, respectively, as a result of determining that it is more likely than not that certain loss carryforwards will not be utilized prior to expiration. In 2001, valuation allowances related to deferred tax assets in certain states and foreign countries were reduced by $9 million ($6 million, net of federal tax) and $6 million, respectively, as a result of determining that these assets will be utilized prior to expiration.
The deferred foreign tax provision for both 2002 and 2001 included a $2 million credit to reflect the impact of changes in statutory tax rates in various countries.

70.
U.S. and foreign income before income taxes are set forth below: 2003 2002 2001
U.S. $ 669 $ 665 $ 599Foreign 217 193 134
$ 886 $ 858 $ 733
The reconciliation of income taxes calculated at the U.S. federal tax statutory rate to our effective tax rate is set forth below: 2003 2002 2001
U.S. federal statutory rate 35.0% 35.0% 35.0%State income tax, net of federal
tax benefit 1.8 2.0 2.1Foreign and U.S. tax effects
attributable to foreign operations (3.6) (2.8) (0.7)Adjustments to reserves and
prior years (1.7) (1.8) (1.8)Foreign tax credit amended
return benefit (4.1) — —Valuation allowance additions
(reversals) 2.8 — (1.7)Other, net — (0.3) (0.1)
Effective income tax rate 30.2% 32.1% 32.8%
We amended certain prior year returns in 2003 upon our determination that it was more beneficial to claim credit on our U.S. tax returns for foreign taxes paid than to deduct such taxes, as had been done when the returns were origi-nally filed. The benefit for amending such returns will be non-recurring.
The details of 2003 and 2002 deferred tax liabilities (assets) are set forth below: 2003 2002
Intangible assets and property, plant and equipment $ 232 $ 229
Other 101 76
Gross deferred tax liabilities $ 333 $ 305
Net operating loss and tax credit carryforwards $ (231) $ (194)
Employee benefits (115) (100)Self-insured casualty claims (52) (58)Capital leases and future rent
obligations related to sale-leaseback agreements (86) (114)
Various liabilities and other (362) (303)
Gross deferred tax assets (846) (769)Deferred tax asset valuation
allowances 183 155
Net deferred tax assets (663) (614)
Net deferred tax (assets) liabilities $ (330) $ (309)
Reported in Consolidated Balance Sheets as: Deferred income tax assets $ (165) $ (121) Other assets (178) (222) Accounts payable and other current liabilities 13 34
$ (330) $ (309)
A determination of the unrecognized deferred tax liability for temporary differences related to our investments in foreign subsidiaries and investments in foreign unconsoli-dated affiliates that are essentially permanent in duration is not practicable.
We have available net operating loss and tax credit carryforwards totaling approximately $1.5 billion at December 27, 2003 to reduce future tax of YUM and certain subsidiaries. The carryforwards are related to a number of foreign and state jurisdictions. Of these carryforwards, $18 million expire in 2004 and $1.2 billion expire at various times between 2005 and 2021. The remaining carryfor-wards of approximately $313 million do not expire.
REPORTABLE OPERATING SEGMENTSnote 23
We are principally engaged in developing, operating, franchising and licensing the worldwide KFC, Pizza Hut and Taco Bell concepts, and since May 7, 2002, the LJS and A&W concepts, which were added when we acquired YGR. KFC, Pizza Hut, Taco Bell, LJS and A&W operate throughout the U.S. and in 88, 86, 12, 3 and 13 coun-tries and territories outside the U.S., respectively. Our five largest international markets based on operating profit in 2003 are China, United Kingdom, Australia, Canada and Korea. At December 27, 2003, we had investments in 9 unconsolidated affiliates outside the U.S. which operate principally KFC and/or Pizza Hut restaurants. These uncon-solidated affiliates operate in China, Japan, Poland and the United Kingdom. Additionally, we had an investment in an unconsolidated affiliate in the U.S. which operates Yan Can restaurants.
We identify our operating segments based on manage-ment responsibility within the U.S. and International. For purposes of applying SFAS No. 131, “Disclosure About Segments of An Enterprise and Related Information” (“SFAS 131”), we consider LJS and A&W to be a single segment. We consider our KFC, Pizza Hut, Taco Bell and LJS/A&W operating segments to be similar and therefore have aggregated them into a single reportable operating segment. Within our International operating segment, no indi-vidual country was considered material under the SFAS 131 requirements related to information about geographic areas and therefore, none have been reported separately.
Revenues 2003 2002 2001
United States $ 5,655 $ 5,347 $ 4,827International 2,725 2,410 2,126
$ 8,380 $ 7,757 $ 6,953

Yum! Brands Inc. 71.
Operating Profit; Interest Expense, Net; andIncome Before Income Taxes 2003 2002 2001
United States $ 812 $ 802 $ 695International(a) 441 361 305Unallocated and corporate expenses (179) (178) (148)Unallocated other income (expense) (3) (1) (3)Unallocated facility actions(b) 4 19 39Wrench litigation(c) (42) — —AmeriServe and other
(charges) credits(c) 26 27 3
Total operating profit 1,059 1,030 891Interest expense, net (173) (172) (158)
Income before income taxes and cumulative effect of accounting change $ 886 $ 858 $ 733
Depreciation and Amortization 2003 2002 2001
United States $ 240 $ 228 $ 224International 146 122 117Corporate 15 20 13
$ 401 $ 370 $ 354
Capital Spending 2003 2002 2001
United States $ 395 $ 453 $ 392International 246 295 232Corporate 22 12 12
$ 663 $ 760 $ 636
Identifiable Assets 2003 2002 2001
United States $ 3,279 $ 3,285 $ 2,521International(d) 1,880 1,732 1,598Corporate(e) 461 383 306
$ 5,620 $ 5,400 $ 4,425
Long-Lived Assets(f) 2003 2002 2001
United States $ 2,880 $ 2,805 $ 2,195International 1,206 1,021 955Corporate 72 60 45
$ 4,158 $ 3,886 $ 3,195
(a) Includes equity income of unconsolidated affiliates of $44 million, $31 million and $26 million in 2003, 2002 and 2001, respectively.
(b) Unallocated facility actions comprises refranchising gains (losses) which are not allocated to the U.S. or International segments for performance reporting purposes.
(c) See Note 7 for a discussion of AmeriServe and other (charges) credits and Note 24 for a discussion of Wrench litigation.
(d) Includes investment in unconsolidated affiliates of $182 million, $225 million and $213 million for 2003, 2002 and 2001, respectively. On November 10, 2003 we dissolved our unconsolidated affiliate in Canada. See Note 8 for further discussion.
(e) Primarily includes deferred tax assets, cash and cash equivalents, property, plant and equipment, net, related to our office facilities and fair value of derivative instruments.
(f) Includes property, plant and equipment, net; goodwill; and intangible assets, net.
See Note 7 for additional operating segment disclosures related to impairment, store closure costs and the carrying amount of assets held for sale.
GUARANTEES, COMMITMENTS AND CONTINGENCIESnote 24Lease Guarantees and ContingenciesAs a result of (a) assigning our interest in obligations under real estate leases as a condition to the refranchising of certain Company restaurants; (b) contributing certain Company restaurants to unconsolidated affiliates; and (c) guaranteeing certain other leases, we are frequently contingently liable on lease agreements. These leases have varying terms, the latest of which expires in 2030. As of December 27, 2003 and December 28, 2002, the potential amount of undiscounted payments we could be required to make in the event of non-payment by the primary lessee was $411 million and $426 million, respectively. The present values of these potential payments discounted at our pre-tax cost of debt at December 27, 2003 and December 28, 2002, were $326 million and $310 million, respectively. Our franchisees are the primary lessees under the vast majority of these leases. We generally have cross-default provisions with these franchisees that would put them in default of their franchise agreement in the event of non-payment under the lease. We believe these cross-default provisions significantly reduce the risk that we will be required to make payments under these leases. Accordingly, the liability recorded for our exposure under such leases at December 27, 2003 and December 28, 2002, was not material.
Guarantees Supporting Financial Arrangements of Certain Franchisees, Unconsolidated Affiliates and Other Third PartiesAt December 27, 2003 and December 28, 2002, we had provided approximately $32 million of partial guarantees of two loan pools related primarily to the Company’s historical refranchising programs and, to a lesser extent, franchisee development of new restaurants. In support of one of these guarantees, we have posted $32 million of letters of credit. We also provide a standby letter of credit of $23 million under which we could potentially be required to fund a portion of one of the franchisee loan pools. The total loans outstanding under these loan pools were approximately $123 million at December 27, 2003. Any funding under the guarantees or letters of credit would be secured by the franchisee loans and any related collateral. We believe that we have appropriately provided for our estimated probable exposures under these contingent liabilities. These provisions were primarily charged to refranchising (gains) losses. New loans are not currently being added to either loan pool.
We have guaranteed certain lines of credit and loans of unconsolidated affiliates totaling $28 million and $26 million at December 27, 2003 and December 28, 2002, respectively. Our unconsolidated affiliates had total revenues of over $1.5 billion for the year ended December 27, 2003 and assets and debt of approxi-mately $858 million and $41 million, respectively, at December 27, 2003.

72.
We have also guaranteed certain lines of credit, loans and letters of credit of third parties totaling $8 million and $15 million at December 27, 2003 and December 28, 2002, respectively. If all such lines of credit and letters of credit were fully drawn the maximum contingent liability under these arrangements would be approximately $25 million as of December 27, 2003 and $27 million as of December 28, 2002.
We have varying levels of recourse provisions and collateral that mitigate the risk of loss related to our guar-antees of these financial arrangements of unconsolidated affiliates and other third parties. Accordingly, our recorded liability as of December 27, 2003 and December 28, 2002 is not significant.
Insurance ProgramsWe are self-insured for a substantial portion of our current and prior years’ coverage including workers’ compensation, employment practices liability, general liability, automobile liability and property losses (collectively, “property and casualty losses”). To mitigate the cost of our exposures for certain property and casualty losses, we make annual decisions to self-insure the risks of loss up to defined maximum per occurrence retentions on a line by line basis or to combine certain lines of coverage into one loss pool with a single self-insured aggregate retention. The Company then purchases insurance coverage, up to a specified limit, for losses that exceed the self-insurance per occurrence or aggregate retention. The insurers’ maximum aggregate loss limits are significantly above our actuarially determined probable losses; therefore, we believe the likelihood of losses exceeding the insurers’ maximum aggregate loss limits is remote.
We are also self-insured for healthcare claims for eligible participating employees subject to certain deductibles and limitations. We have accounted for our retained liabilities for property and casualty losses and healthcare claims, including reported and incurred but not reported claims, based on information provided by independent actuaries.
Due to the inherent volatility of actuarially determined property and casualty loss estimates, it is reasonably possible that we could experience changes in estimated losses which could be material to our growth in quarterly and annual net income. We believe that we have recorded reserves for property and casualty losses at a level which has substantially mitigated the potential negative impact of adverse developments and/or volatility.
Change of Control Severance AgreementsThe Company has severance agreements with certain key executives (the “Agreements”) that are renewable on an annual basis. These Agreements are triggered by a termina-tion, under certain conditions, of the executive’s employment following a change in control of the Company, as defined in the Agreements. If triggered, the affected executives would
generally receive twice the amount of both their annual base salary and their annual incentive in a lump sum, a propor-tionate bonus at the higher of target or actual performance, outplacement services and a tax gross-up for any excise taxes. These Agreements have a three-year term and auto-matically renew each January 1 for another three-year term unless the Company elects not to renew the Agreements. If these Agreements had been triggered as of December 27, 2003, payments of approximately $38 million would have been made. In the event of a change of control, rabbi trusts would be established and used to provide payouts under existing deferred and incentive compensation plans.
LitigationWe are subject to various claims and contingencies related to lawsuits, taxes, environmental and other matters arising out of the normal course of business. Like certain other large retail employers, the Company has been faced in certain states with allegations of purported class-wide wage and hour violations.
On August 29, 1997, a class action lawsuit against Taco Bell Corp., entitled Bravo, et al. v. Taco Bell Corp. (“Bravo”), was filed in the Circuit Court of the State of Oregon of the County of Multnomah. The lawsuit was filed by two former Taco Bell shift managers purporting to represent approximately 17,000 current and former hourly employees statewide. The lawsuit alleged violations of state wage and hour laws, principally involving unpaid wages including over-time, and rest and meal period violations, and sought an unspecified amount in damages. Under Oregon class action procedures, Taco Bell was allowed an opportunity to “cure” the unpaid wage and hour allegations by opening a claims process to all putative class members prior to certification of the class. In this cure process, Taco Bell paid out less than $1 million. On January 26, 1999, the Court certified a class of all current and former shift managers and crew members who claim one or more of the alleged violations. A Court-approved notice and claim form was mailed to approximately 14,500 class members on January 31, 2000. Trial began on January 4, 2001. On March 9, 2001, the jury reached verdicts on the substantive issues in this matter. A number of these verdicts were in favor of the Taco Bell position; however, certain issues were decided in favor of the plaintiffs. In April 2002, a jury trial to determine the damages of 93 of those claimants found that Taco Bell failed to pay for certain meal breaks and/or off-the-clock work for 86 of the 93 claimants. However, the total amount of hours awarded by the jury was substantially less than that sought by the claimants. In July and September 2002, the court ruled on several post-trial motions, including fixing the total number of potential claimants at 1,031 (including the 93 claimants for which damages had already been deter-mined) and holding that claimants who prevail are entitled to prejudgment interest and penalty wages. The second

Yum! Brands Inc. 73.
damages trial for the remaining 938 claimants began on July 7, 2003. Before the trial concluded, the parties reached an agreement to settle this matter in full. The court granted final approval of the settlement on December 23, 2003 and final judgment of dismissal was entered on December 26, 2003. Payments to class counsel and eligible claimants were made in the first quarter of 2004. We have previously provided for the costs of this settlement as AmeriServe and other charges (credits).
On January 16, 1998, a lawsuit against Taco Bell Corp., entitled Wrench LLC, Joseph Shields and Thomas Rinks v. Taco Bell Corp. was filed in the United States District Court for the Western District of Michigan. The lawsuit alleged that Taco Bell Corp. misappropriated certain ideas and concepts used in its advertising featuring a Chihuahua. The plaintiffs sought to recover monetary damages under several theories, including breach of implied-in-fact contract, idea misappropriation, conversion and unfair competition. On June 10, 1999, the District Court granted summary judgment in favor of Taco Bell Corp. Plaintiffs filed an appeal with the U.S. Court of Appeals for the Sixth Circuit (the “Court of Appeals”), and oral arguments were held on September 20, 2000. On July 6, 2001, the Court of Appeals reversed the District Court’s judgment in favor of Taco Bell Corp. and remanded the case to the District Court. Taco Bell Corp. unsuccessfully petitioned the Court of Appeals for rehearing en banc, and its petition for writ of certiorari to the United States Supreme Court was denied on January 21, 2002. The case was returned to District Court for trial which began on May 14, 2003 and on June 4, 2003 the jury awarded $30 million to the plaintiffs. Subsequently, the plaintiffs’ moved to amend the judgment to include pre-judgment interest and post-judgment interest and Taco Bell filed its post-trial motion for judgment as a matter of law or a new trial. On September 9, 2003, the District Court denied Taco Bell’s motion and granted the plaintiff’s motion to amend the judgment.
In view of the jury verdict and subsequent District Court ruling, we recorded a charge of $42 million in 2003. We continue to believe that the Wrench plaintiffs’ claims are without merit and have appealed the verdict to the Sixth Circuit Court of Appeals. Post-judgment interest will continue to accrue during the appeal process.
On July 9, 2003 we filed suit against Taco Bell’s former advertising agency in the United States District Court for the Central District of California seeking reimbursement for any final award that may be ultimately affirmed by the appeals courts and costs that we have incurred in defending this matter. We are also seeking reimbursement from our insurance carriers.
Obligations to PepsiCo, Inc. After Spin-offIn connection with the Spin-off, we entered into sepa-ration and other related agreements (the “Separation Agreements”) governing the Spin-off and our subsequent relationship with PepsiCo. These agreements provide certain indemnities to PepsiCo.
Under terms of the agreement, we have indemnified PepsiCo for any costs or losses it incurs with respect to all letters of credit, guarantees and contingent liabilities relating to our businesses under which PepsiCo remains liable. As of December 27, 2003, PepsiCo remains liable for approximately $82 million on a nominal basis related to these contingencies. This obligation ends at the time PepsiCo is released, terminated or replaced by a qualified letter of credit. We have not been required to make any payments under this indemnity.
Included in the indemnities described above are contin-gent liabilities on lease agreements of certain non-core businesses of PepsiCo which were sold prior to the Spinoff. Two of these businesses, Chevys Mexican Restaurant and Hot ’n Now filed for bankruptcy protection in October 2003 and January 2004, respectively. While we can not presently determine our liability under these indemnities, if any, we do not expect the amount to have a material impact on our Consolidated Financial Statements. Any related expenses will be recorded as AmeriServe and other charges (credits) in our Consolidated Income Statement.
Under the Separation Agreements, PepsiCo maintains full control and absolute discretion with regard to any combined or consolidated tax filings for periods through October 6, 1997. PepsiCo also maintains full control and absolute discretion regarding any common tax audit issues. Although PepsiCo has contractually agreed to, in good faith, use its best efforts to settle all joint interests in any common audit issue on a basis consistent with prior practice, there can be no assurance that determinations made by PepsiCo would be the same as we would reach, acting on our own behalf. Through December 27, 2003, there have not been any determinations made by PepsiCo where we would have reached a different determination.

74.
SELECTED QUARTERLY FINANCIAL DATA (UNAUDITED)note 252003 First Quarter Second Quarter Third Quarter Fourth Quarter Total
Revenues: Company sales $ 1,597 $ 1,723 $ 1,765 $ 2,356 $ 7,441 Franchise and license fees 205 213 224 297 939
Total revenues 1,802 1,936 1,989 2,653 8,380
Wrench litigation — 35 7 — 42AmeriServe and other charges (credits) — 2 (3) (25) (26)Total costs and expenses, net 1,585 1,716 1,720 2,300 7,321Operating profit 217 220 269 353 1,059Income before cumulative effect of accounting change 118 122 164 214 618Cumulative effect of accounting change, net of tax (1) — — — (1)Net income 117 122 164 214 617Diluted earnings per common share 0.39 0.40 0.53 0.70 2.02
2002 First Quarter Second Quarter Third Quarter Fourth Quarter Total
Revenues: Company sales $ 1,426 $ 1,571 $ 1,705 $ 2,189 $ 6,891 Franchise and license fees 188 196 210 272 866
Total revenues 1,614 1,767 1,915 2,461 7,757
AmeriServe and other charges (credits) (11) (9) (4) (3) (27)Total costs and expenses, net 1,388 1,526 1,657 2,156 6,727Operating profit 226 241 258 305 1,030Net income 124 140 147 172 583Diluted earnings per common share 0.40 0.45 0.47 0.56 1.88
See Note 24 for details of Wrench litigation and Note 7 for details of AmeriServe other charges (credits).

Yum! Brands Inc. 75.
To Our Shareholders:
We are responsible for the preparation, integrity and fair presentation of the Consolidated Financial Statements, related notes and other information included in this annual report. The financial statements were prepared in accordance with accounting principles generally accepted in the United States of America and include certain amounts based upon our estimates and assumptions, as required. Other financial information presented in the annual report is derived from the financial statements.
We maintain a system of internal control over financial reporting, designed to provide reasonable assurance as to the reliability of the financial statements, as well as to safeguard assets from unauthorized use or disposition. The system is supported by formal policies and procedures, including an active Code of Conduct program intended to ensure employees adhere to the highest standards of personal and professional integrity. Our internal audit function monitors and reports on the adequacy of and compliance with the internal control system, and appropriate actions are taken to address significant control deficiencies and other opportunities for improving the system as they are identified.
The Consolidated Financial Statements have been audited and reported on by our independent auditors, KPMG LLP, who were given free access to all financial records and related data, including minutes of the meetings of the Board of Directors and Committees of the Board. We believe that management representations made to the independent auditors were valid and appropriate.
The Audit Committee of the Board of Directors, which is composed solely of outside directors, provides oversight to our financial reporting process and our controls to safeguard assets through periodic meetings with our independent auditors, internal auditors and management. Both our independent auditors and internal auditors have free access to the Audit Committee.
Although no cost-effective internal control system will preclude all errors and irregularities, we believe our controls as of December 27, 2003 provide reasonable assurance that our assets are reasonably safeguarded.
David J. Deno Chief Financial Officer
Management’s Responsibility for Financial Statements

76.
The Board of DirectorsYUM! Brands, Inc.:
We have audited the accompanying consolidated balance sheets of YUM! Brands, Inc. and Subsidiaries (“YUM”) as of December 27, 2003 and December 28, 2002, and the related consolidated statements of income, cash flows and share-holders’ equity (deficit) and comprehensive income for each of the years in the three-year period ended December 27, 2003. These consolidated financial statements are the responsibility of YUM’s management. Our responsibility is to express an opinion on these consolidated financial statements based on our audits.
We conducted our audits in accordance with auditing standards generally accepted in the United States of America. Those standards require that we plan and perform the audit to obtain reasonable assurance about whether the financial statements are free of material misstatement. An audit includes examining, on a test basis, evidence supporting the amounts and disclosures in the financial statements. An audit also includes assessing the accounting principles used and significant estimates made by management, as well as evaluating the overall financial statement presentation. We believe that our audits provide a reasonable basis for our opinion.
In our opinion, the consolidated financial statements referred to above present fairly, in all material respects, the financial position of YUM as of December 27, 2003 and December 28, 2002, and the results of its operations and its cash flows for each of the years in the three-year period ended December 27, 2003, in conformity with accounting principles generally accepted in the United States of America.
As discussed in Notes 2 and 12 to the consolidated financial statements, YUM adopted the provisions of the Financial Accounting Standards Board’s Statement of Financial Accounting Standards No. 142, “Goodwill and Other Intangible Assets,” in 2002.
KPMG LLPLouisville, KentuckyFebruary 10, 2004
Report of Independent Auditors

Yum! Brands Inc. 77.
Selected Financial Data
Fiscal Year(in millions, except per share and unit amounts) 2003 2002 2001 2000 1999
Summary of OperationsRevenues Company sales(a) $ 7,441 $ 6,891 $ 6,138 $ 6,305 $ 7,099 Franchise and license fees 939 866 815 788 723
Total 8,380 7,757 6,953 7,093 7,822
Facility actions(b) (36) (32) (1) 176 381Wrench litigation(c) (42) — — — —AmeriServe and other (charges) credits(d) 26 27 3 (204) (51)
Operating profit 1,059 1,030 891 860 1,240Interest expense, net 173 172 158 176 202
Income before income taxes and cumulative effective of accounting change 886 858 733 684 1,038
Income before cumulative effect of accounting change 618 583 492 413 627Cumulative effect of accounting change, net of tax(e) (1) — — — —
Net income 617 583 492 413 627Basic earnings per common share(f) 2.10 1.97 1.68 1.41 2.05Diluted earnings per common share(f) 2.02 1.88 1.62 1.39 1.96
Cash Flow DataProvided by operating activities $ 1,053 $ 1,088 $ 832 $ 491 $ 565Capital spending, excluding acquisitions 663 760 636 572 470Proceeds from refranchising of restaurants 92 81 111 381 916
Balance SheetTotal assets $ 5,620 $ 5,400 $ 4,425 $ 4,149 $ 3,961Long-term debt 2,056 2,299 1,552 2,397 2,391Total debt 2,066 2,445 2,248 2,487 2,508
Other DataNumber of stores at year end Company 7,854 7,526 6,435 6,123 6,981 Unconsolidated Affiliates 1,512 2,148 2,000 1,844 1,178 Franchisees 21,471 20,724 19,263 19,287 18,414 Licensees 2,362 2,526 2,791 3,163 3,409
System 33,199 32,924 30,489 30,417 29,982
U.S. Company blended same store sales growth(g) — 2% 1% (2)% 4%International system sales growth(h)
Reported 14% 8% 1% 6% 10% Local currency(i) 7% 9% 8% 8% 8%Shares outstanding at year end(f) 292 294 293 293 302Market price per share at year end(f) $ 33.64 $ 24.12 $ 24.62 $ 16.50 $ 18.97
Fiscal years 2003, 2002, 2001 and 1999 include 52 weeks and fiscal year 2000 includes 53 weeks. From May 7, 2002, fiscal year 2002 included Long John Silver’s (“LJS”) and A&W All-American Food Restaurants (“A&W”), which were added when we acquired Yorkshire Global Restaurants, Inc. Fiscal year 2002 includes the impact of the adoption of Statement of Financial Accounting Standards (“SFAS”) No. 142, “Goodwill and Other Intangible Assets” (“SFAS 142”). See Note 12 to the Consolidated Financial Statements for further discussion. The selected financial data should be read in conjunction with the Consolidated Financial Statements and the Notes thereto.
(a) The decline in Company sales through 2001 was largely the result of our refranchising initiatives.
(b) See Note 7 to the Consolidated Financial Statements for a description of Facility actions in 2003, 2002 and 2001.
(c) See Note 24 to the Consolidated Financial Statements for a description of Wrench litigation in 2003.
(d) See Note 7 to the Consolidated Financial Statements for a description of AmeriServe and other charges (credits) in 2003, 2002 and 2001.
(e) Fiscal year 2003 includes the impact of the adoption of SFAS No. 143, “Accounting for Asset Retirement Obligations” (“SFAS 143”). See Note 2 to the Consolidated Financial Statements for further discussion.
(f) Per share and share amounts have been adjusted to reflect the two-for-one stock split distributed on June 17, 2002.
(g) U.S. Company blended same-store sales growth includes the results of Company owned KFC, Pizza Hut and Taco Bell restaurants that have been open one year or more. LJS and A&W are not included.
(h) International system sales growth includes the results of all international restaurants regardless of ownership, including Company owned, franchise, unconsolidated affiliate and license restaurants. Sales of franchise, unconsolidated affiliate and license restaurants generate franchise and license fees for the Company (typically at a rate of 4% to 6% of sales). Franchise, unconsolidated affiliate and license restaurant sales are not included in Company sales we present on the Consolidated Statements of Income; however, the fees are included in the Company’s revenues.
(i) Local currency is prior to foreign currency conversion to U.S. dollars.
78.
David C. Novak 51
Chairman, Chief Executive Offi cer and President,Yum! Brands, Inc.
Andrall E. Pearson 77
Founding Chairman, Yum! Brands, Inc.
James Dimon 48
Chairman and Chief Executive Offi cer, Bank One Corporation
Massimo Ferragamo 46
President and Vice Chairman, Ferragamo USA, Inc., a subsidiary of Salvatore Ferragamo Italia
J. David Grissom 65
Chairman, Mayfair Capital, Inc., a private investment fi rm
Bonnie G. Hill 62
Chairman and President, B. Hill Enterprises, LLC
Robert Holland, Jr. 63
Former owner and Chief Executive Offi cer, WorkPlace Integrators, Michigan’s largest Steelcase offi ce furniture dealer
Sidney Kohl 73
Former Chairman, Kohl’s Supermarkets, Founder, Kohl’s Department Stores
Kenneth Langone 67
Founder, Chairman of the Board and Chief Executive Offi cer, Invemed Associates, LLC, an investment banking fi rm, Founder, Home Depot, Inc.
Thomas M. Ryan 51
Chairman, President and Chief Executive Offi cer of CVS Corporation and CVS Pharmacy, Inc.
Jackie Trujillo 68
Chairman of the Board, Harman Management Corporation
Robert J. Ulrich 60
Chairman and Chief Executive Offi cer, Target Corporation and Target Stores
David C. Novak 51
Chairman, Chief Executive Offi cer and President, Yum! Brands, Inc.
Peter A. Bassi 54
Chairman, Yum! Restaurants International
Jonathan D. Blum 45
Senior Vice President, Public Affairs, Yum! Brands, Inc.
Emil J. Brolick 56
Pesident and Chief Concept Offi cer, Taco Bell, U.S.A.
Jared E. Buss 61
Chief Operating Offi cer, Pizza Hut, U.S.A.
Anne P. Byerlein 45
Chief People Offi cer, Yum! Brands, Inc.
Christian L. Campbell 53
Senior Vice President, General Counsel, Secretary and Chief Franchise Policy Offi cer, Yum! Brands, Inc.
Steven A. Davis 45
President and Chief Executive Offi cer, Long John Silver’s, Inc. and Chief Executive Offi cer, A&W Restaurants, Inc.
Gregg R. Dedrick 44
President and Chief Concept Offi cer, KFC, U.S.A.
David J. Deno 46
Chief Financial Offi cer, Yum! Brands, Inc.
Peter R. Hearl 52
President and Chief Concept Offi cer, Pizza Hut, U.S.A.
Robert C. Kreidler 40
Senior Vice President, Mergers and Acquisitions and Treasurer, Yum! Brands, Inc.
Aylwin B. Lewis 49
President, Chief Multibranding andOperating Offi cer, Yum! Brands, Inc.
Tony Mastropaolo 40
Chief Operating Offi cer, KFC, U.S.A.
Gregory N. Moore 54
Senior Vice President and Controller, Yum! Brands, Inc.
Charles E. Rawley, III 53
Chief Development Offi cer, Yum! Brands, Inc.
Rob Savage 42
Chief Operating Offi cer, Taco Bell, U.S.A.
Board of Directors Senior Officers

Yum! Brands Inc. 79.
Annual Meeting The Annual Meeting of Shareholders will be held at Yum! Brands’ headquarters, Louisville, Kentucky, at 9:00 a.m. (EDT), Thursday, May 20, 2004. Proxies for the meeting will be solicited by an independent proxy solicitor. This Annual Report is not part of the proxy solicitation.
INQUIRIES REGARDING YOUR YUM! HOLDINGSRegistered Shareholders (those who hold YUM shares in their own names) should address communications concerning statements, address changes, lost certificates and other administrative matters to:
American Stock Transfer & Trust Company59 Maiden LanePlaza LevelNew York, NY 10038Phone: (888) 439-4986 www.amstock.com or Shareholder CoordinatorYum! Brands, Inc.1441 Gardiner Lane, Louisville, KY 40213 Phone: (888) 298-6986E-mail: [email protected]
In all correspondence or phone inquires, please provide your name, your Social Security Number, and your YUM account number if you know it.
Registered Shareholders can access their accounts and complete the following functions online at the Web site of American Stock Transfer & Trust (“AST”).
Access account balance and other general account information
Change an account’s mailing address
View a detailed list of holdings represented by certifi-cates and the identifying certificate numbers
Request a certificate for shares held by AST
Replace a lost or stolen certificate
Retrieve a duplicate Form 1099-B
Purchase shares of YUM through the Company’s direct stock purchase plan
Sell shares held by AST
Access accounts online at the following URL: https://secure.amstock.com/Shareholder/sh_login.asp. Your account number and Social Security Number are required. If you do not know your account number, please call AST at (888) 439-4986 or YUM Shareholder Coordinator at (888) 298-6986. You may also request a Personal Identification Number (PIN) to access your account at the same URL. For security purposes, PINs are mailed to shareholders.
Beneficial Shareholders (those who hold YUM shares in the name of a bank or broker) should direct communications on all administrative matters to their stockbroker.
YUMBUCKS and SharePower Participants (employees with YUMBUCKS options or SharePower options) should address all questions regarding your account, outstanding options or shares received through option exercises to:
Merrill Lynch/SharePower Stock Option Plan Services P.O. Box 30446 New Brunswick, NJ 08989-0446 Phone: (800) 637-2432 (U.S.A., Puerto Rico and Canada)
(732) 560-9444 (all other locations)
In all correspondence, please provide your account number (for U.S. citizens, this is your Social Security Number), your ad dress, your telephone number and mention either YUMBUCKS or SharePower. For telephone inquiries, please have a copy of your most recent statement available.
Employee Benefit Plan ParticipantsDirect Stock Purchase Program . . . . . . . (888) 439-4986YUM 401(k) Plan . . . . . . . . . . . . . . . . . (888) 875-4015YUM Savings Center . . . . . . (617) 847-1013 (outside U.S.) P.O. Box 1389 Boston, MA 02104-1389
Please have a copy of your most recent statement available when calling. Press *0 for a customer service representa-tive and give the representative the name of the plan.
Shareholder Information

80.
Shareholder Services
Direct Stock Purchase Plan A prospectus and a brochure explaining this convenient plan are available from our transfer agent:
American Stock Transfer & Trust CompanyP.O. Box 922Wall Street StationNew York, NY 10269-0560Attn: DRIP Dept.Phone: (888) 439-4986
Low-Cost Investment Plan Investors may purchase their initial shares of stock through NAIC’s Low-Cost Investment Plan. For details contact:
National Association of Investors Corporation (NAIC) 711 West Thirteen Mile Road Madison Heights, Ml 48071 Phone: (877) ASK-NAIC (275-6242) www.better-investing.org
Financial and Other Information Earnings and other financial results, corporate news, corporate governance information and other company information are available on Yum! Brands’ Web site: www.yum.com
Copies of Yum! Brands’ SEC Forms 8-K, 10-K and 10-Q and quarterly earnings releases are available free of charge. Contact Yum! Brands’ Shareholder Relations at (888) 2YUMYUM (298-6986) or e-mail [email protected]
Securities analysts, portfolio managers, representa-tives of financial institutions and other individuals with questions regarding Yum! Brands’ performance are invited to contact:
Tim JerzykVice President, Investor Relations Yum! Brands, Inc. 1441 Gardiner LaneLouisville, KY 40213 Phone: (888) 298-6986
Independent Auditors KPMG LLP 400 West Market Street, Suite 2600 Louisville, KY 40202 Phone: (502) 587-0535
CAPITAL STOCK INFORMATIONStock Trading Symbol—YUMThe New York Stock Exchange is the principal market for YUM Common Stock.
Shareholders At year-end 2003, YUM! Brands had approxi-mately 102,000 registered shareholders of record of YUM common stock.
Dividend Policy Yum! Brands does not currently pay divi-dends.
FRANCHISE INQUIRIESDomestic Franchising Inquiry Phone Line
(866) 2YUMYUM (298-6986)International Franchising Inquiry Phone Line
(972) 338-8100 ext. 4480Online Franchise Information
http://www.yum.com/franchising/info.htm
Yum! Brands’ Annual Report contains many of the valuable trademarks owned and used by Yum! Brands and subsidiaries and affiliates in the United States and worldwide.
Printed on recycled paper.

At Yum! Brands, we believe that the power of giving back to the community is making a differ-ence in the lives of our customers and their families. While we commit ourselves to making a difference by financially supporting hundreds and hundreds of charities across the globe, our efforts are primarily focused on nourishing the bodies, minds and souls of children in need. We do this through programs dedicated to hunger relief, daycare subsidies, reading incentives and mentoring at-risk teens. From Europe to Asia to South America, we’re committed to improving the lives of the customers we serve.
Here’s a brief snapshot of the work that is underway:
Nourishing Bodies: Yum! Harvest In America alone, one in ten children under the age of five runs the risk of going to bed hungry every night. One in ten. So we decided to do something about this and have created the world’s largest prepared food recovery program. We now donate millions of pounds of prepared food to the hungry. Food that has nutritional value and will provide nourish-ment to those most in need, the underprivileged.
Nourishing Young Minds: Pizza Hut’s Book It! For nearly 20 years, Pizza Hut has provided an incentive for elementary aged children to learn to read. More than 22 million students a year, in 900,000 classrooms, participate in Book It! The program is relied on year after year by teachers in 50,000 schools — nearly 70% of the nation’s elementary schools — so that young minds are nourished with books.
Nourishing Souls: KFC’s Colonel’s Kids With more and more double-income and single-parent households, finding safe, affordable high-quality child care has become an increasing burden. That’s why KFC established the Colonel’s Kids Charity. Today, we help fund extended-hour and infant/toddler child care programs across the country for the millions of people who work “after hours” or on weekends. Since 2000, more than $3 million has been awarded to YMCA Child Care Centers nationwide.
Taco Bell’s TEENSupreme Through a unique partnership with the Boys & Girls Clubs of America, Taco Bell has established a mentoring program for at-risk teens, offering a safe haven and recre-ational activities to keep kids off the street. To date, over $13 million has been donated to the Boys & Girls Clubs for TEENSupreme programming.
HARVEST
““power”of giving back

YUM! BRANDS 2003 ANNUAL CUSTOMER MANIA REPORTYUM! BRANDS 2003 ANNUAL CUSTOMER MANIA REPORT
Power Yum! of
Yum! Yum! Yum! Yum! Yum! Yum! Yum! Yum! Yum! Yum! Yum! Yum! Yum! Yum! Yum! Yum! Yum! Yum! Yum! Yum! Yum! Yum! Yum! Yum! Yum! Yum! Yum! Yum! Yum! Yum! Yum! Yum! Yum! Yum! Yum! Yum! Yum! Yum! Yum!
Alone we’re delicious. Together we’re