yyearsears impact of health financing policies on
TRANSCRIPT

Impact of Health Financing Policies on Household Spending: Evidence from Cambodia Socio-Economic Surveys
2004 and 2009Chhim Chhun, Tong Kimsun, Ge Yu, Timothy Ensor and Barbara McPake
Working Paper Series No. 106
September 2015
A CDRI Publication
2 2 5YearsYears

Impact of Health Financing Policies on Household Spending: Evidence from Cambodia Socio-Economic Surveys
2004 and 2009
Chhim Chhun, Tong Kimsun, Ge Yu, Timothy Ensor and Barbara McPake
CDRI Working Paper Series No. 106
Phnom Penh, September 2015

ii
© 2015 CDRI - Cambodia Development Resource Institute
All rights reserved. No part of this publication may be reproduced, stored in a retrieval system or transmitted in any form or by any means—electronic, mechanical, photocopying, recording, or otherwise—without the written permission of CDRI.
ISBN 978-9924-5000-2-5
Mr Chhim Chhun Research Associate, Cambodia Development Resource Institute ([email protected])
Dr Tong Kimsun Senior research fellow, Cambodia Development Resource Institute ([email protected])
Dr Ge Yu Research Fellow, University of Leeds.
Prof. Tim Ensor Director of the Leeds Institute of Health Sciences, University of Leeds.
Prof. Barbara McPake Director of ReBuild Consortium and Director of Nossal Institute for Global Health, the University of Melbourne
Citation:
Chhim Chhun, Tong Kimsun, Ge Yu, Timothy Ensor and Barbara McPake. 2015. Impact of Health Financing Policies on Household Spending: Evidence from Cambodia Socio-Economic Surveys 2004 and 2009. CDRI Working Paper Series No. 106. Phnom Penh: CDRI.
CDRI 56, Street 315, Tuol Kork, Phnom Penh, Cambodia PO Box 622, Phnom Penh, Cambodia (855-23) 881384/881701/881916/883603 (855-23) 880734 E-mail: [email protected] Website: www.cdri.org.kh
Edited by: Susan WatkinsLayout and Cover Design: Meas Raksmey and Oum Chantha Printed and Bound in Cambodia by Donbosco printing

iii
Contents
Acronyms ..................................................................................................................................iv
Acknowledgements ....................................................................................................................v
Abstract .....................................................................................................................................vi
1. Introduction ............................................................................................................................1
2. Literature review ....................................................................................................................2
3. Health fi nancing policies in Cambodia ..................................................................................4
4. Structure of public spending on health ..................................................................................5
5. Data and methodology ...........................................................................................................6
5.1 Sample selection ..............................................................................................................6
5.2 User fees, health equity funds, vouchers and the poor ....................................................7
5.3 Out-of-pocket spending ...................................................................................................8
5.4 Estimation strategies ........................................................................................................8
6. Empirical fi ndings ................................................................................................................10
6.1 Out-of-pocket spending on health, and poverty status ...................................................10
6.2 Results of the two-part model .......................................................................................10
6.2.1 Coeffi cient estimates .............................................................................................10
6.2.2 Marginal effects ....................................................................................................11
7. Conclusion and policy implications .....................................................................................12
References ................................................................................................................................28
CDRI working paper series ......................................................................................................33
Figures and Tables
Figure 1: Health expenditure per capita, 1996-2010 (current prices) .......................................5
Figure 2: Poverty headcount ratio, 2004 and 2009 .................................................................16
Table 1: Characteristics of Cambodia Socio-Economic Surveys ..........................................13
Table 2: Samples for Cambodia Socio-Economic Surveys 2004 and 2009 ..........................14
Table 3: Administrative statistics on UF, CBHI and HEF coverage areas ............................14
Table 4: Study household sample ..........................................................................................14
Table 5: Descriptive statistics of household asset ownership, 2004 and 2009 ......................15
Table 6: Consumer price index (Phnom Penh prices=100) ...................................................16
Table 7: Out-of-pocket spending per capita per day in riel by poverty status (at 2009 prices) ....16
Table 8: Descriptive statistics ................................................................................................17

iv
Table 9: Impacts of policies on health spending: Probit with GLM with log link and gamma distribution ...........................................................................................18
Table 10: Impacts of policies on health spending: Probit with OLS with logged dependent variables ..................................................................................................19
Table 11: Impacts of policies on the share of household health spending to total spending: Probit with GLM with log link and gamma distribution .........................................20
Table 12: Impacts of policies on the share of household health spending to total spending: Probit with OLS with logged dependent variables ..................................................21
Table 13: Impacts of policies on health spending: Probit with GLM with log link and gamma distribution ...........................................................................................22
Table 14: Impacts of policies on health spending: Probit with OLS with logged dependent variables ......................................................................................23
Table 15: Impacts of policies on the share of household health spending to total spending: Probit with GLM with log link and gamma distribution .........................................24
Table 16: Impacts of policies on the share of household health spending to total spending: Probit with OLS with logged dependent variables ..................................................25
Table 17: Marginal effects .......................................................................................................26
Table 18: Marginal effects of subsample .................................................................................27
Acronyms
CBHI Community-based health insuranceCDRI Cambodia Development Resource InstituteCSES Cambodia Socio-Economic SurveyDFID Department for International Development, UKGDP Gross domestic productHEF Health equity fundsGLM Generalized linear modelIDPoor Identifi cation of Poor Households ProgrammeKHR Cambodian rielMEF Ministry of Economy and FinanceMOH Ministry of HealthNGO Non-governmental organisationOLS Ordinary least squaresPCA Principal component analysisReBUILD Research for Building Pro-poor Health Systems during Recovery from Confl ictUF User feesUK United KingdomUNTAC United Nations Transitory Authority in Cambodia
v
Acknowledgements
This paper is a part of the fi rst component of Research for Building Pro-Poor Health Systems during Recovery from Confl ict: ReBUILD (HRPC09 Health Systems Financing). ReBUILD is a research project led by the Liverpool School of Tropical Medicine, UK, in partnership with the Institute for International Health and Development, Queen Margaret University, Edinburgh, UK; Makerere University, Kampala, Uganda; College of Medicine and Allied Health Sciences, Freetown, Sierra Leone; Biomedical Research and Training Institute, Harare, Zimbabwe; and Cambodia Development Resource Institute, Phnom Penh, Cambodia. This project was made possible through fi nancial support from the United Kingdom’s Department for International Development (DFID).
The authors would like to thank Net Neath, Sok Sothea and Huon Chanthrea for their involvement in the fi rst two years of the four-year research project, particularly research design, literature review on health fi nancing, secondary data collection, data preparation for the initial national representative household survey and methodology selection. Gratitude extends to Dr Ijeoma Edoka and Dr Fu-Min Tseng of Queen Margaret University, whose technical support was greatly appreciated. The authors are also grateful to Dr Chhem Rethy (CDRI Executive Director), Larry Strange (former CDRI Executive Director), Dr Srinivasa Madhur (former CDRI Director of Research), and Ung Sirn Lee (former CDRI Director of Operations) for their support and encouragement.
The authors thank the Bureau of Health Economics and Financing of the Department of Planning and Health Information, Ministry of Health, for permission to use Health Financing Policies and Universal Health Coverage data, and the National Institute of Statistics for permission to use data from the Cambodia Socio-Economic Surveys.
Special gratitude is extended to our language editor, Susan Watkins, for her constant support.

vi
Abstract
We use the 2004 and 2009 Cambodia Socio-Economic Surveys to measure the impact of user fees, health equity funds, the government health subsidy scheme, vouchers and various combinations of these policies on household health spending. Employing a difference-in-differences estimator and a two part model, we fi nd that health equity funds and vouchers help to reduce household health spending whereas user fees and the government health subsidy scheme are unlikely to reduce household health spending as was originally designed. Continuation and expansion of health equity funds and voucher schemes is defi nitely crucial for Cambodia. The results also highlight the need for further policy-relevant research to improve the effectiveness of user fees and the government health subsidy scheme.
Key words: household health expenditure, user fees, health equity funds, difference-in-differences, two-part model.

1
CDRI Working Paper Series No. 106
1. Introduction
The signing of the Paris Peace Agreements on 23 October 1991 offi cially marked the end of the civil war that lasted more than twenty years in Cambodia. The Agreement allowed the United Nations to oversee the country’s political and economic management from 1991 until 1993. Under the direct supervision of the United Nations Transitory Authority in Cambodia (UNTAC), the fi rst general election was held in May 1993. However, factional fi ghting broke out in July 1997, leading to high tension between the ruling party and main opposition party. With the surrendering of the last remnants of the Khmer Rouge, the general election in July 1998 fi nally brought peace and stability to Cambodia.
The health system has been gradually restored. Before the fi rst general election, healthcare was offi cially provided free of charge for all patients at public health facilities. In 1996-97, health sector funding accounted for 12 to 13 percent of GDP—the largest share among Asian developing countries (Bitran et al. 2003). Even so, at 0.3 annual contacts per capita, public health service utilisation was still extremely low (MOH 1999). This was mainly due to the low offi cial salaries of public service providers and insuffi cient budget to cover the running costs of service delivery (Jacobs and Price 2004).1 At the time, out-of-pocket spending played the largest role in health sector fi nancing—amounting to 82 to 84 percent of the total, followed by offi cial development assistance 8 to 12 percent, the government 4 to 5 percent and NGOs 2 to 3 percent (Bitran et al. 2003).
To formalise cost recovery in the form of user fees (UF), the Ministry of Health (MOH) introduced the National Charter on Health Financing in 1996, authorising public health facilities to collect UF from all patients except the poorest. This initiative had three goals: “to reduce the unoffi cial charges and household out-of-pocket expenditures, to improve the quality of care through increased and timely availability of medical supplies, and to motivate staff through performance-related payment funded by fees” (Bitran et al. 2003, 2). To achieve these goals, the government allocated 49 percent of UF revenues for health facility staff salaries, 50 percent for non-salary operating costs and 1 percent for the National Treasury.
Cognisant of the ineffectiveness of the UF exemption programme and the fi nancial burden of rising out-of-pocket medical expenses, since the early 2000s, the government and its development partners have continued to introduce various approaches including health equity funds (HEF), community-based health insurance (CBHI), vouchers (VO) and social health insurance.
Since health sector reform started in 1996, several studies have attempted to assess the effects of UF on health service access (Wilkinson, Holloway and Fallavier 2001; Barber, Bonnet and Bekedam 2004; Jacobs and Price 2004; Hardeman et al. 2004; Meessen and Van Damme 2004; Meessen et al. 2006; Jacobs and Price 2008; Khun and Manderson 2008), equity (Wilkinson, Holloway and Fallavier 2001), out-of-pocket spending (Barber, Bonnet and Bekedam 2004), health facility performance (Wilkinson, Holloway and Fallavier 2001; Akashi et al. 2004; Barber, Bonnet and Bekedam (2004) and health service provider attitudes (Akashi et al. 2004). These studies found both positive and negative effects of UF.
1 In the late 1990s, Cambodian government offi cials received a monthly salary of approximately USD15. However, the monthly living cost for an average family of fi ve in Phnom Penh was USD200 to USD300 (MOP 1997). This evidence suggests that government offi cials including public health professionals were unable to rely on their salary alone to support their family. To make a minimum living, they had to seek additional income in the private sector and/or demand unoffi cial payments from patients.

2
Impact of Health Financing Policies on Household Spending
Other studies examine the impact of HEF on the utilisation of public health facilities by the poor (Hardeman 2001; Hardeman et al. 2004; Annear et al. 2006; Men and van Pelt 2006; Biacabe 2008; Criel et al. 2008), household health expenditure (Ir 2004, 2008; Van Damme et. al. 2004; van Pelt 2006), impoverishment and indebtedness (van Pelt 2006; Men and van Pelt 2006; Ir 2008; van Pelt 2008; MOH 2009), the quality of health services (Nguyen 2004; van Pelt 2006; Ir 2008; van Pelt 2008), healthcare-seeking behaviour (Van Damme et al. 2004; Annear et al. 2006; Jacobs and Lot 2006; Jacobs and Price 2006, 2008; Keller, Thome and Dekestier 2008)and other implementation arrangements including targeting of the poor (Hardeman et al. 2004) and attitudinal changes of health facility staff towards the poor (Nguyen 2004; Jacobs and Lot 2006; Annear et al. 2006, 2008; Ir 2008; van Pelt and Morineau 2008; Jordanwood, van Pelt and Grundmann 2009). The main fi ndings of these studies reveal that HEF have increased the utilisation of public health facilities especially by the poor, reduced out-of-pocket health expenditure, prevented borrowing or selling or pawning of assets for healthcare, improved the quality of health services for the poor, created incentives for staff to treat poor patients as equal to the non-poor, and motivated the poor to use public health facilities. However, as Annear (2010) points out,evidence regarding the impact of HEF on household health expenditure, impoverishment and indebtedness is very limited and incomplete and that on the improvement of the quality of health services for the poor is mixed.
Few studies have focussed on CBHI and voucher schemes. Phoung (2010) examined how CBHI can improve household access to healthcare while Ozawa (2010) looked at household and healthcare providers’ behaviours in response to CBHI. Their study fi ndings were not defi nitive, however. Phoung (2010) also identifi ed a potential link between CBHI and HEF and increased healthcare utilisation. The most recent study conducted by Van de Poel et al. (2013) found that vouchers raise the utilisation of postnatal care and universal vouchers have a signifi cant positive impact on antenatal care.
2. Literature reviewA considerable amount of literature has been published on health fi nancing in Cambodia since the health sector reformed in the late 1990s. To assess the impact of the introduction of user fees (UF), Jacobs and Price (2004), using data from Kirivong operational district, compared data before and after introduction of the UF scheme. They found that UF created a “medical poverty trap”, though this fi nding drew on descriptive analysis only. Using hospital data, patient and provider surveys and provider focus group discussions, Akashi et al. (2004) assessed the impact of UF in a public hospital—the National Maternal and Child Health Center—on patient utilisation, revenue and expenditure, quality of hospital services, provider attitudes, low-income patients and the government. The study found that patient satisfaction with the UF system was 92.7 percent and the number of outpatients had doubled. The average monthly number of babies delivered at hospital increased signifi cantly from 319 before the introduction of the system to 585 three years later. Hospital revenues also increased.
Hardeman et al. (2004), using data compiled from September 2000 to September 2002, assessed the impact of HEF on poor households’ access to healthcare in Sotnikum operational district, Siem Reap province. They found that HEF improved fi nancial access for the poor, but the poor continued to face many constraints to timely access. Operated by an NGO, the HEF scheme in Sotnikum health district was cost-effective with minimal leakage to the non-poor. Barber, Bonnet and Bekedam (2004), through a case study of Takeo provincial referral hospital, used secondary data to investigate to what extent UF can reduce out-of-pocket spending and promote fi nancial

3
CDRI Working Paper Series No. 106
stability. The study revealed that before UF was introduced, out-of-pocket spending for inpatient admission was USD15 to USD30 (without drugs) even though the offi cial hospital fee was only USD9.30 (with drugs, laboratory and imaging services), implying that the fi xed inpatient fee was approximately 65 percent less than under-the-table payments. They concluded, therefore, that UF has signifi cantly reduced out-of-pocket expenses. Ir (2004) used patient surveys conducted in 2000 and 2003 in Sotnikum and six other operational districts (Thma Puok, Svay Rieng, Kirivong, Takeo, Phnom Penh and Siem Reap) to capture the effect of HEF on household health expenditure. The results indicated that out-of-pocket health spending for both HEF benefi ciaries and non-benefi ciaries dropped substantially between 2000 and 2003; however, the study did not determine to what extent the decline may have been attributable to HEF.
Jacobs and Price (2006) used data compiled from September 2000 to September 2002 to assess the impact of HEF on out-of-pocket health expenditure in Kirivong operational district, and concluded that direct costs associated with seeking care were lower for HEF benefi ciaries (USD5.7) than for non-benefi ciaries (USD11.3). Annear et al. (2006) looked at contracting, HEF and CBHI and used information collected from 33 health operational districts. They found that all three schemes addressed different barriers to health services access to some extent but could not, even if taken together, overcome all barriers. The analysis indicates that HEF schemes are the most effective for providing increased health coverage for the poor and for the alleviation of poverty. Jacobs, Lewis and Oeun (2007) evaluated the effects of a UF scheme on healthcare-seeking behaviour and out-of-pocket expenditure at Kirivong referral hospital by comparing fee-exempted and fee-paying patients. The study found that the direct costs of seeking healthcare were USD4.3 for fee-exempted patients and USD15.3 for fee-paying patients. Annear et al. (2007) assessed the impact of UF, HEF, CBHI and contracting in Phnom Penh municipality hospital and Angroka operational district using administrative data, survey data and qualitative information. The study concluded that HEF and CBHI (run by SKY health insurance project) reduced treatment costs and improved access to services, but the UF scheme excluded the poor from health services: due to cost, many poor people did not attend health facilities when needed. Khun and Manderson (2008) conducted a case study in two villages to investigate the impact of UF on admission rates for dengue fever. Using quantitative and qualitative data, they concluded that the introduction of UF and limited application of fee exemptions severely affected the utilisation of public health facilities. Costs were often catastrophic, exacerbating the extreme poverty of those least able to afford medical treatment.
Ir re-examined the effectiveness of HEF in four hospitals in Kompong Cham by conducting a bed census in May 2006 (546 observations) and a follow-up bed census in February 2008 (553 observations). From the simple descriptive statistics of the two surveys, he concluded that health expenditure among HEF-eligible inpatients has increased signifi cantly. More recently, Annear (2010, iv), having conducted a comprehensive review of published and unpublished literature on HEF during 2001–10, concludes “There is little direct evidence on the impact of HEF on household health expenditures”. Flores et al. (2011) used Cambodian Socio-Economic Surveys (CSES) of 2004, 2007, 2008 and 2009 and the geographic distribution of HEF in Cambodia to identify their impact on out-of-pocket payments. The study found that among households with some out-of-pocket payments, HEF coverage reduces the amount by 29 percent on average. The effect is larger for households that are poorer, mainly use public healthcare services and live closer to a district hospital. HEF schemes are more effective in reducing out-of-pocket payments when they are operated by an NGO rather than the government, and when they operate in conjunction with public health services contracting. HEF coverage reduces household health-related debt by around 25 percent on average.

4
Impact of Health Financing Policies on Household Spending
Given the limited evidence on the effects of health fi nancing policies on household health expenditures, previous studies very likely drew on case studies of referral hospital admissions that used refl exive comparisons without taking household characteristics and other unobserved effects into account.2 Towards bridging this knowledge gap, our study aims to provide robust evidence on the impact of health fi nancing policies on household health expenditure by using data from CSES 2004 and 2009 and applying advanced econometric methods, i.e. difference-in-differences and two-part model. Importantly, our study intends to measure the combined effects of UF, HEF and VO on household health expenditure. This kind of empirical study is very new in Cambodia.
3. Health fi nancing policies in CambodiaCambodia’s health system is fi nanced by the government, development partners and private household expenditure. In the early 1990s, there was no formal fee system in public health facilities but informal fees were widely charged; in the case of serious illness, household health expenditure could reach several hundred US dollars. There was no health insurance. During that period, health sector reform mainly focused on generating additional resources through user fees (UF) to supplement the low salaries of public health workers and introducing management reforms used in the private sector into the public health system.
Progress has been made towards the establishment of the 1996 National Health Financing Charter, which authorised the collection of UF at public health facilities for all users, except the poorest, with the expectations of reducing the service cost mainly under-the-table charges, increasing public health services utilisation, improving service quality and boosting staff motivation. As of 2013, the majority of public health facilities were formally implementing UF (MOH 2013). Evidence showed that fi xed and offi cial UF not only contributed to increases in the utilisation of public health facilities but also promoted fi nancial sustainability (Barber, Bonnet and Bekedam 2004). However, some studies (e.g. Meessen and van Damme 2004; Jacobs and Price 2008; Health Economic Taskforce 2000) caution that this scheme has often failed to reach the poor; indeed, per capita household health expenditure increased signifi cantly from USD17 in 1993 to USD25 in 2005 (MOH 2008). This fi nding has raised great concern regarding equitable access to health services in Cambodia.
To address these concerns, a health equity fund (HEF) scheme was introduced by international NGOs in 2000.3 Primarily designed to provide access to health services and to protect the poor from catastrophic health expenditures (MOH 2008), the HEF benefi t package covered part or full costs of medical services, transport, food for patients and carers, and funeral costs (Flores et al. 2011). Assessments showed that HEF improved access to health services for the poor (Hardeman et al. 2004), reduced out-of-pocket spending and household health-related debt (Flores et al. 2011) and increased public health facilities utilisation (Noirhomme et al. 2007). Later studies, however, raised concerns about the long-term sustainability of the HEF scheme (see, for example, Tangcharoensthien et al. 2011). In addition to HEF, the government created its own subsidy scheme (SUBO) for the poor in 2006. The scheme aims to ease fi nancial barriers preventing the poor from accessing and using public health facilities by compensating healthcare providers for the cost of certain health services used by the poor. SUBO is fully fi nanced by the national budget under the MOH (MOH 2013).
2 The refl exive comparison method requires that base line and follow-up surveys be conducted before and after intervention so that impact can be measured by changes in outcome indicators (Ravallion 1999).
3 Health equity fund schemes funded by the World Health Organization and the UK were piloted in Phnom Penh and in two squatter urban areas in 2000 (Annear et al. 2008).

5
CDRI Working Paper Series No. 106
Voluntary community-based health insurance (CBHI) schemes have been introduced to provide further risk pooling. These were initially piloted in four locations in Kandal province in 1998 by a French NGO called Group de Recherche et d’Echanges (GRET) (Annear et al. 2008). They are designed to provide a risk-pooling mechanism for informal sector workers who earn an income above the poverty line (MOH 2008). The impact of these schemes, which have had limited penetration due partly to their voluntary approach, is unclear.
To incentivise the utilisation of maternal healthcare, voucher schemes were introduced in 2007 and currently cover one third of the country (Van De Poel et al. 2013). There are two types of voucher schemes: universal and targeted (the poorest women). A recent study by Vande Poel et al. (2013) reveals that universal schemes have a larger effect on facility delivery than targeted schemes. To provide universal coverage to wage earners employed in the formal sector, a master plan for social health insurance4 was developed in 2005, though this has yet to be implemented. It is due to start operating in 2015 (Ly 2011).
4. Structure of public spending on health
Health expenditure per capita doubled between 2000 and 2010. Health fi nancing is largely dominated by out-of-pocket spending, followed by development partners and the Cambodian government (Figure 1). Despite low government budget allocation, the share of government spending on health to GDP rose from 0.72 percent in 2000 to about 1.26 percent in 2010 (MEF 2010). Government spending on health is highly centralised. The MOH still controls more than 70 percent of the total expenditure while most of the remaining budget is delegated to provincial governors who have full authority to manage spending on utilities, fuel and other purchases on behalf of the health facilities (World Bank 2011). In addition, a large proportion of government health expenditure is fi nanced by external assistance rather than its own revenues (World Bank 2011). This raises great concerns over the sustainability of public health spending in Cambodia.
Figure 1: Health expenditure per capita, 1996-2010 (current prices)
ODA per capita50
1996
1998
2000
2002
2004
2006
2008
2010
40
30
20
10
USD
0
Government expenditure per capita
Out-of-pocket health expenditure per capita
ODA = overseas development assistanceSources: MEF 2010, WDI 2013 and authors’ calculations
4 Social health insurance consists of compulsory, voluntary and social assistance schemes. Voluntary and social assistance schemes often refer to community-based health insurance and health equity funds, while the compulsory scheme is a newly designed programme to target public offi cers, private formal sector employees and their dependents (Ly 2011).

6
Impact of Health Financing Policies on Household Spending
5. Data and methodology5.1 Sample selectionWith fi nancial and technical support from various development partners such as the Asian Development Bank (ADB), United Nations Development Programme (UNDP), World Bank, United Nations Children’s Fund (UNICEF), International Labour Organization (ILO) and Swedish International Development Cooperation Agency (Sida), the National Institute of Statistics (NIS) has conducted the Cambodia Socio-Economic Survey (CSES) for 10 rounds over the past two decades in 1993/94, 1996, 1997, 1999, 2004, 2007, 2008, 2009, 2010 and 2011. Although nationally representative, these household surveys are unfortunately not fully comparable mainly due to the sampling design and time of implementation (Table 1). Changes to the questionnaire design have also affected the comparability of data. For example, data on 177 food and 266 non-food items was collected in 1993/94, but subsequent surveys collected data on only 19-23 food and 13-14 non-food items; recall method only was used for collecting information on consumption in 1993/94, 1997, 1999, while both recall and diary methods were adopted from 2004 onwards; the household questionnaire used in 2007, 2008, 2010 and 2011 was smaller and covered fewer topics than that used in 2004 and 2009. This means that comparisons between the surveys done before and after 2004 are not recommended.5
Taking the sample size, survey and questionnaire design into account, this study uses data collected in 2004 and 2009.6 However, to some extent, the sampling frames for CSES 2004 and CSES 2009 are different, particularly at village level—CSES 2004 was based on the 1998 Population Census and CSES 2009 on the 2008 Population Census. To reduce the risk of compositional bias, we include only those communes sampled in both 2004 and 2009.7 In addition, we also exclude those samples collected in November and December 2003 and January 20058 from CSES 2004 to ensure that the timing and duration of sampling in the fi eld is equivalent (Table 2).
The UF scheme has been introduced across the country since 1996, followed by CBHI in 1998, HEF in 2000 and vouchers (VO) in 2007. Administrative data9 released by the MOH indicates that by 2004 UF had been implemented in 21 provinces, CBHI in 2 provinces, HEF in 11 provinces, and VO in just 1 province. By 2009, UF covered all 24 provinces, HEF 23 provinces, CBHI 8 provinces, and VO 5 provinces (Table 3). At commune level, in 2009, approximately 86 percent of the total communes were covered by UF while only 9 percent benefi ted from CBHI and 23 percent from HEF schemes; at the same time, VO had been extended to 21 percent of communes.
Having integrated health fi nancing policy variables into CSES 2004 and 2009, we note that the start of policy implementation coincided with the date of household interviews in some communes, while other communes were expected to benefi t from those policies several months after the survey was conducted. For this reason, we defi ne a household as being covered if
5 The Ministry of Planning (2006, 2012) also highlights that CSES datasets are not entirely comparable largely due to differences in sampling design—even the surveys in 1993/94, 1996, 1997 and 1999.
6 The sample households for CSES 2007 and 2008 formed the subsample of CSES 2004, and those for CSES 2010 and 2011 the subsample of CSES 2009.
7 In principle, we followed the approach used by Flores et al. (2011) but the difference between the two studies is that Flores et al. did not exclude data collected in November and December 2003 and January 2005 from their analysis.
8 Thirty-nine households interviewed in February 2005 are also excluded.9 Health Financing Policies and Universal Health Coverage data (unpublished) collected by the Bureau of Health
Economics and Financing of the Department of Planning and Health Information, Ministry of Health.

7
CDRI Working Paper Series No. 106
those policies had been operating in the commune for at least one month before the interviews started. This approach is to some extent in line with Flores et al. (2011).
With these assumptions, we fi nd that in 2004 the UF scheme most likely covered 3773 households, 70 of which also benefi ted from CBHI and 320 from HEF. To construct the baseline data from CSES 2004, i.e. households that were not covered by any kind of health fi nancing policy, we exclude those 3773 households from analysis. This reduces the sample size from 6356 households to 2583 households, 710 of which were likely affected by UF from February 2005 onwards, 590 from a policy combination of UF_VO, 190 from UF_HEF, 290 from UF_SUBO, 90 from UF_HEF_VO and 20 from UF_SUBO_VO. Unfortunately, no households were identifi ed as having benefi tted from CBHI. We therefore drop the CBHI policy variable from our analysis. To ensure comparability between 2004 and 2009, we also exclude households that in 2009 benefi ted from UF_CBHI (240 households) and UF_CBHI_HEF (147 households). The fi nal household sample for this study is presented in Table 4. Since the numbers of households benefi tting from UF_SUBO_VO were very small, with only 20 for 2004 and 30 for 2009, we drop this combination of schemes from our analysis.
5.2 User fees, health equity funds, vouchers and the poorGiven that the UF scheme is designed to exempt the poor from paying fees while HEF and vouchers target only the poor, it was important to identify the poor and non-poor households so that we could examine the impact of UF on the health expenditure of non-poor households and of HEF and vouchers on poor households.
Along with the structure and components of UF, the MOH also developed exemption criteria. Many studies including Akashi et al. (2004) warn that these exemption criteria are ineffective in identifying the poor due to the unreliability of patients’ responses to the exemption questionnaire. Importantly, the UF programme relies completely on the health facility staff identifi ed by the director to make exemption decisions. This approach could favour patients who can pay because a maximum of 49 percent of the total revenue from UF is allocated to supplement the salaries of health facility staff directly (Barber, Bonnet and Bekedam 2004).
HEF and vouchers that involve a third party to identify the poor and pay UF on their behalf have been introduced to complement the weakness of the UF exemption programme (Jacobs and Price 2004; Ir et al. 2010). In the early years of operation, most HEF schemes adopted the post-identifi cation approach—an asset-based means test—to assess eligibility, but the pre-identifi cation approach and consultation with community representatives to identify households eligible for fee exemption has been increasingly adopted. In 2007, the Ministry of Planning standardised the procedure to identify poor households (known as IDPoor) by means testing housing quality,10 amount of fl oorspace, agricultural land, fi shing equipment, livestock,11 durable assets,12 means of transport,13 dependent family members and associated criteria, as well as the general perception of the village group representatives. The outcome of IDPoor has been utilised by various government and non-government assistance programmes including HEF schemes (Flores et al. 2011).
10 Roofi ng materials, exterior wall construction materials and general housing conditions.11 Pigs, cows, buffaloes, goats and horses.12 Small radio, large radio, stereo, colour television, black and white television, video camera, video player/
karaoke, mobile telephone, water pump, thresher , rice mill, generator and battery charger.13 Bicycle, motorbike, tractor, horse/ox cart, motorbike, remorque, kou yon, car/van/truck, rowing boat and
motor boat.
8
Impact of Health Financing Policies on Household Spending
Although complete information to replicate the IDPoor means test is not available, following Filmer and Prichett (1994), we constructed an indicator using the wealth index. The majority of the assets used to formulate the index were aggregated into a single variable using principal component analysis (PCA) (see Table 5). Empirically, we applied PCA using asset data from CSES 2004, and used the factor scores of the fi rst principal component to generate the wealth index for both CSES 2004 and 2009. This approach ensures that the weight of each asset remains constant since it is very critical for poverty comparison over time.14 For this study we defi ne the 1st and 2nd quintiles of the wealth index as poor and the 3rd, 4th and 5th quintiles as non-poor. The differences in approach resultant of data limitations mean that our fi ndings may not be strictly comparable with those of other studies that use the IDPoor score.
5.3 Out-of-pocket spendingIn CSES 2004 and 2009, health expenditure for each household member over four weeks was recorded in the Health Section.15 However, the question on health spending in 2009 was more precise than in 2004. In 2009, spending on transport to health facilities and on health services was recorded separately, while only total health expenditure was available in 2004.16 Having compared the total health expenditure in 2004 and the spending on transport and health services in 2009, Flores et al. (2011) conclude that the respondents in 2004 may have included the transport cost in total health expenditure. In line with Flores et al. (2011), we defi ne total health expenditure as the aggregate of spending on transport and health services in 2009. Total household health expenditure is divided by household size and adjusted for different price levels in Phnom Penh and other regions over the study period using the consumer price index (Table 6).
5.4 Estimation strategiesWe examine the effects of policies (see Table 4 for sampling frame) on household health expenditure using a difference-in-differences (DID) method that compares the change in daily per capita health spending of the control group with the change in daily per capita health spending of the treatment group. This method is widely used to evaluate the effect of programme or policy interventions when panel or repeated cross-sectional data is available (e.g. Card and Krueger 1994). The basic models can be written as follows:
Yi = β0 + β1t + β2UF + β3UF * t + β4Xi + β5Zi + εi (1)
Yi = β0 + β1t + β2UF_VO + β3UF_VO * t + β4Xi + β5Zi + εi (2)
Yi = β0 + β1t + β2UF_HEF + β3UF_HEF * t + β4Xi + β5Zi + εi (3)
Yi = β0 + β1t + β2UF_SUBO + β3UF_SUBO * t + β4Xi + β5Zi + εi (4)
Yi = β0 + β1t + β2UF_HEF_VO + β3UF_HEF_VO * t + β4Xi + β5Zi + εi (5)
where UF is a dummy for user fees, UF_VO is a dummy for combination of user fees and voucher, UF_HEF a dummy for combination of user fees and health equity funds, UF_SUBO a dummy for combination of user fees and government subsidy scheme, UF_HEF_VO a dummy
14 For monetary approach, the prices are always kept constant across ecological zones and over time.15 Health expenditure for all household members was also recorded in the Non-Food Expenditure Section in 2009.
The unavailability of such information in 2004 led us to use the information collected under the Health Section. 16 To some extent, this could affect the comparability of total health expenditure between 2004 and 2009.

9
CDRI Working Paper Series No. 106
for combination of user fees, health equity funds and voucher, t a dummy for year (2009=1), X a vector of household covariates, Z a vector of community covariates17 and ε is an error term.
β0, β1, β2 and β3 are the coeffi cients to be estimated. As noted by Villa (2012), these coeffi cients are interpreted as follows:
β0 : an average outcome for the control group at baseline
β0 + β1 : an average outcome for the control group at follow-up
β2 : the difference between treated and control groups at baseline
β0 + β2 : an average outcome for the treated group at baseline
β0 + β1 + β2 + β3 : an average outcome for the treated group at follow-up
β3 : the difference-in-differences or impact
In addition, Villa (2012) demonstrates that difference-in-differences is a fl exible functional form that can be combined with other procedures such as propensity score matching (Heckman et al. 1997, 1998) and quintile regression (Meyer, Viscusi and Durbin 1995). Propensity score matching is used to ensure that the characteristics of the treatment group and the control group are as similar as possible, while quintile regression is used to examine the relationship between the independent variable and dependent variables at different points in the conditional distribution of the dependent variables.18
In the health sector, some variables of interest are equal to zero for a certain proportion of the observations in the dataset. For example, many households spend nothing on health services in a given reference period, resulting in data that has many zero values and is continuous. This is often called censored data. Censoring of independent variables is not a problem, but censoring of dependent variables leads to a number of econometric problems if ordinary least squares (OLS) is used. The literature highlights a number of econometric approaches to deal with a censored dependent variable. Among the most popular techniques for health expenditure modelling are the Tobit model, the sample selection model (Heckman selection model) and the two-part model (O’Donnell et al. 2008).
The selection of the most appropriate model for censored data largely depends on the values and assumptions that form the basis of the decision-making process (see Jones 2000), i.e. the decision to use health services (participation) and receive health services (consumption). The two-part model assumes that the participation and consumption decisions which are chronologically sequential lie behind medical expenditures, whereas the Tobit model simply assumes a single decision. The assumption of a single decision-making process is relatively strong since an individual is expected to have full information on the cost of treatment before going to a health facility. The sample selection model lies somewhere between the extremes of the Tobit and the two-part model, with the assumption that the two decisions—to seek medical care and the choice of how much to spend—are interdependent.19 However, the sample selection model is required to have a variable that
17 See Table 10 for the list of covariates.18 The standard linear regression model is to estimate the average relationship between the independent variable
and dependent variables. 19 In other words, Tobit model assumes that zero and positive values are generated by the same mechanism while
the two-part model allows for the possibility of different mechanisms (Cameron and Trivedi 2009).

10
Impact of Health Financing Policies on Household Spending
infl uences the decision of whether to spend on health services but does not infl uence the amount of money that is spent on healthcare. In practice, such a variable is extremely diffi cult to fi nd.
Given the data censoring problems of dependent variables, we combine the difference-in-differences method with the two-part model to estimate the impact of health fi nancing policies on household health spending, as in models (1) to (5) above.
6. Empirical fi ndings
6.1 Out-of-pocket spending on health, and poverty statusHaving defi ned poverty status by wealth quintiles, an approach closely in line with that of the Ministry of Planning, we generate daily per capita health spending at 2009 prices for both poor and non-poor households. Relative health spending for poor households in 2004 is lower than for non-poor households in both control and treatment groups, except for households living in areas that have a combination of UF_HEF_VO schemes, because of the very small sample used for CSES 2004 (Table 7). In 2009, poor households in areas with UF or a combination of UF_VO, UF_HEF or UF_HEF_VO schemes continue to spend less on health services than non-poor households, but they spend more than the non-poor in control and UF_SUBO areas.
Between 2004 and 2009, poor households’ daily per capita out-of-pocket spending on healthcare increased for all policies but was higher in the control areas, with a signifi cant increase of 354 percent. Disaggregated by various policy combinations, spending in areas with UF_SUBO increased 97 percent, UF_HEF_VO 86 percent, UF 77 percent, UF_HEF_VO 86 percent and UF_HEF 7 percent. At the same time, the daily per capita health spending of non-poor households decreased in control and UF_HEF areas and increased for other policy combinations. These descriptive statistics suggest that not all policies and their combinations reduce household health spending, especially of the poor.
6.2 Results of the two-part model
6.2.1 Coeffi cient estimates
Selection equation
Full sample: The coeffi cients of the fi ve health fi nancing policies, i.e. UF, UF_VO, UF_HEF, UF_SUBO and UF_HEF_VO are negative and statistically signifi cant at least at the 10 percent level (p<0.10), except for UF (Tables 9-12). This result implies that implementing UF in tandem with other policies decreases the probability of positive out-of-pocket health expenditure.
The coeffi cients of interaction terms between health fi nancing policies and time dummies are positive and statistically signifi cant at the 1 percent level (p<0.01) except for UF and UF_HEF. This result indicates that certain combinations of health fi nancing policies such as UF_VO, UF_SUBO and UF_HEF_VO are more likely to have increased the probability of positive out-of-pocket health expenditure in 2009 than in 2004 (the baseline period). This could be due to the increase in UF, the continuation of informal payments or the decline in eligibility for HEF and VO.

11
CDRI Working Paper Series No. 106
Subsample (poor households—wealth indices 1 and 2): Among the fi ve health fi nancing policies, only the coeffi cient of UF_VO is negative and statistically signifi cant at the 1 percent level, implying that UF_VO decreases the probability of positive out-of-pocket health expenditure. It is worth noting that UF and UF_HEF are more likely to have decreased and UF_VO and UF_HEF_VO more likely to have increased the probability of positive out-of-pocket health spending in 2009 than in 2004 (Tables 13-16).
Outcome equation
Full sample: The coeffi cients of interaction terms between health fi nancing policies and time dummies capture the impact of health fi nancing policies on out-of-pocket health spending. The result shows that only UF_HEF is negative and statistically signifi cant at least at the 10 percent level (Tables 9-12). However, the coeffi cients of interaction terms between UF, UF_VO, UF_SUBO, UF_HEF_VO and time dummies are not statistically signifi cant at the 10 percent level. This result implies that UF_HEF reduces out-of-pocket health spending, while other health fi nancing policies are unlikely to contribute to the reduction of out-of-pocket health expenditure as originally designed.
Subsample (poor households—wealth indices 1 and 2): Among the poor households with positive out-of-pocket health expenditure, the coeffi cients of interaction terms between UF, UF_VO, UF_HEF, UF_HEF_VO and time dummies are negative and statistically signifi cant at least at the 10 percent level regardless of the different approaches of the two-part model (Tables 13 and 14). This evidence confi rms that UF, UF_HEF, UF_VO and UF_HEF_VO defi nitely help to reduce out-of-pocket health expenditure in Cambodia. In other words, UF, HEF and VO have largely increased access to healthcare services in Cambodia particularly for the poor, who represented 28 percent of the total population in 2009. In contrast, the result for SUBO is not statistically signifi cant even at the 10 percent level, raising some concerns over the effectiveness of the government’s subsidy programme. In terms of share of out-of-pocket health expenditure to total spending, we fi nd that the coeffi cients of interaction terms between UF_VO, UF_HEF, UF_HEF_VO and time dummies are negative and statistically signifi cant at least at the 10 percent level. This evidence reconfi rms that UF_HEF, UF_VO and UF_HEF_VO not only reduce out-of-pocket health expenditure but also its share to total spending.
6.2.2 Marginal effects
Full sample: After examining the qualitative aspects of health fi nancing policies on out-of-pocket health expenditure, we then focus on its quantitative aspects (i.e. marginal effects) by using normal theory retransformation to obtain its fi tted value. For households that have positive out-of-pocket health expenditure, UF_HEF policy is likely to impact positively on health spending. The results show that it reduces daily per capita healthcare spending by KHR245.08 to KHR302.87, and reduces the share of health spending to total household spending by 1.51 percent to 1.76 percent (Table 17).
Subsample (poor households—wealth indices 1 and 2): Conditional on having positive out-of-pocket health expenditure, UF_HEF is likely to reduce the level of daily per capita out-of-pocket health expenditure by KHR613.23 to KHR620.05 (depending on the econometric approach). In terms of share, UF_HEF reduces the share of out-of-pocket health expenditure to total spending by 4.87 percent to 5.55 percent. UF_VO reduces daily per capita out-of-pocket expenses by KHR128.98 to KHR296.62, and UF_HEF_VO reduces daily per capita out-of-

12
Impact of Health Financing Policies on Household Spending
pocket expenses by KHR495.74 to KHR595.99, depending on the econometric approach. In terms of share, UF_VO reduces daily per capita out-of-pocket expenditure by 0.44 percent to 1.87 percent, while UF_HEF_VO reduces daily per capita out-of-pocket expenditure by 3.71 percent to 4.38 percent (Table 18).
7. Conclusion and policy implications
This paper examines the impact of health fi nancing policies—user fees (UF), health equity funds (HEF), vouchers (VO), subsidy schemes (SUBO) and various combinations of these policies—on out-of-pocket health expenditure by using nationally representative household data from Cambodia Socio-Economic Surveys 2004 and 2009. Having employed a difference-in-differences estimator with a two-part model (probit using a generalised linear model with log link and gamma distribution, and probit using ordinary linear regression with a logged dependent variable), we fi nd that policy combinations UF_HEF, UF_VO and UF_HEF_VO help in reducing both the level of out-of-pocket health expenditure and its share to total household spending for poor households. More precisely,
UF_HEF is likely to reduce daily per capita out-of-pocket health expenditure by KHR613.23 • to KHR620.05, and its share to total household spending by 4.87 percent to 5.55 percent.
UF_VO is likely to reduce daily per capita out-of-pocket expenditure by KHR128.98 to • KHR296.62, and its share to total household spending by 0.44 percent to 1.87 percent.
UF_HEF_VO is likely to reduce daily per capita out-of-pocket expenditure by KHR495.74 • to KHR595.99, and its share to total household spending by 3.71 percent to 4.38 percent.
However, we are unable to confi rm the effect of UF and SUBO on both out-of-pocket health expenditure and its share to total household spending.
Our fi ndings highlight that the continuation and expansion of health equity funds and voucher schemes is defi nitely crucial for Cambodia particularly for the poor who in 2009 represented 28 percent of the total population, and emphasise the need for further policy-relevant research on user fees and government subsidies.

13
CDRI Working Paper Series No. 106
Table 1: Characteristics of Cambodia Socio-Economic Surveys20
Sample size Sample coverage
Survey timing Survey method Number strata
CSES 1993 Villages: 498Households: 5578 Provinces: 15 10/1993-
09/1994Truncated sampling
3 (Phnom Penh, other urban, rural)
CSES 1996 Villages: 750Households: 9000 Provinces: 17
Round 1: 05-07/1996Round 2: 10-12/1996
Two stage sampling 1020
CSES 1997 Villages: 474Households: 6010 Provinces: 21 06/1997 Two stage
sampling3 (Phnom Penh, other urban, rural)
CSES 1999 Villages: 600Households: 6000 Provinces: 24
Round 1: 01-03/1999Round 2: 06-08/1999
Two stage sampling
10 (fi ve zones urban/rural)
CSES 2004 Villages: 900Households: 15,000 Provinces: 24 11/2003-
01/2005Two or three stage sampling
45 (province urban/rural)
CSES 2007 Villages: 360Households: 3593 Provinces: 21 01-12/2007 Two or three
stage sampling37 (province urban/rural)
CSES 2008 Villages: 357Households: 3,548 Provinces: 21 01-12/2008 Two or three
stage sampling37 (province urban/rural)
CSES 2009 Villages: 720Households: 11,970 Provinces: 24 01-12/2009 Two or three
stage sampling48 (province urban/rural)
CSES 2010 Villages: 360Households: 3600 Provinces: 24 01-12/2010 Two or three
stage sampling48 (province urban/rural)
CSES 2011 Villages: 360Households: 3600 Provinces: 24 01-12/2011 Two or three
stage sampling48 (province urban/rural)
Note: Primary data from the 1998 General Population Census was used to construct CSES 2004 sampling frame and data from the General Population Census 2009 for CSES 2009, while those of CSES 1993/94, 1996, 1997 and 1999 were based on the UNTAC frame. Sources: Prescott and Pradhan 1997; Ministry of Planning 1997, 1998, 2000, 2006, 2009a, 2012; World Bank 2009;
Knowles 2010, 2012a, b
20 “The population was grouped into 10 strata or geographical domains, namely: Phnom Penh, other Urban areas (provincial towns and centres), the provinces (rural areas only) of Banteay Meanchey, Battambang, Kompong Thom, Pursat, Siem Reap, Svay Rieng and Ratanakkiri, and other rural areas” (MOP 1997: xiv).

14
Impact of Health Financing Policies on Household Spending
Table 2: Samples for Cambodia Socio-Economic Surveys 2004 and 2009
All sample Excluding samples interviewed in 2003 and 2005 Common communes
2004 2009 2004 2009 2004 2009
Province 24 24 23 24 20 20
District 163 171 153 171 110 110
Commune 684 621 559 621 279 279
Village 859 715 695 715 396 357
Household 14840 11971 11825 11971 6356 5454Source: Authors’ calculation based on CSES 2004 and 2009
Table 3: Administrative statistics on UF, CBHI and HEF coverage areas
2004 2007 2009 Total*
UF HEF CBHI VO UF HEF CBHI VO
Province 21 11 2 1 24 23 8 5 24
District 133 27 3 6 182 102 26 37 185
Commune 867 74 12 54 1395 586 140 345 1621
Village 8132 655 170 504 12464 5315 1438 3701 14258Note: Administrative data provided by MOH; *Cambodia General Population Census 2008 (MOP 2009b)
Table 4: Study household sample
Policies variables Defi nition of policy variables 2004 2009
Control control areas 693 568
UF user fee areas 710 2067
UF_VO user fee and voucher areas 590 826
UF_HEF user fee and health equity fund areas 190 1076
UF_SUBO user fee and government subsidy scheme areas 290 518
UF_HEF_VO user fee, health equity fund, and voucher areas 90 369
UF_SUBO_VO user fee, government subsidy schemes and voucher areas 20 30
Total 2583 5454Note: We verifi ed communes that implemented UF, HEF, UF and HEF, and control in two operational districts and fi ve health centres in Prey Veng, Kampong Cham and Mondulkiri provinces. Source: Authors’ calculation based on CSES 2004 and 2009

15
CDRI Working Paper Series No. 106
Table 5: Descriptive statistics of household asset ownership, 2004 and 20092004 2009 Weights (PCA)
No. of durable assets per household (average) Radio 0.377 0.437 0.104 Stereo 0.242 0.141 0.224 Television 0.498 0.651 0.322 Camera 0.029 0.032 0.166 Video player/VCD/DVD 0.072 0.301 0.242 Cell phone 0.206 0.707 0.332 Water pump 0.087 0.119 0.061 Thresher 0.038 0.008 0.011 Rice mill 0.021 0.024 0.039 Generator 0.024 0.033 0.097 Bicycle 0.851 0.932 0.127 Cart 0.247 0.207 -0.004 Hand tractor 0.043 0.057 0.000 Rowing boat 0.087 0.058 -0.024 Motor boat 0.024 0.030 0.322 Car 0.033 0.042 0.203 Jeep 0.007 0.012 0.078 Motorcycle 0.355 0.602 0.010 Pigs 0.901 0.623 0.044 Cows 1.131 1.251 0.003 Buffalos 0.234 0.245 -0.024 Goats 0.019 0.019 0.000 Horses 0.009 0.008 -0.001
Roof primary construction material (% of households) Thatch, palm leaves, plastic sheet 27.800 16.000 -0.303 Galvanised iron/aluminium 35.200 45.000 0.042 Tiles, fi brous cement, concrete 37.000 39.000 0.244
Wall primary construction material (% of households) Bamboo, thatch, grass 43.500 33.900 -0.341 Wood, plywood, galvanised iron 46.900 53.200 0.207 Concrete, brick, stone, fi brous cement 9.600 12.900 0.244
Floor area of house (metre2) 42.918 44.134 0.288Total agricultural land (acre) 110.753 124.316 -0.001Economically inactive household members (%) 41.722 37.056 0.003
No. of observations 12000 11972

16
Impact of Health Financing Policies on Household Spending
Table 6: Consumer price index (Phnom Penh prices=100)
2004 2009
Phnom Penh 63.09 100.00
Other urban 49.25 80.22
Rural 45.20 73.48Source: World Bank 2011
Figure 2: Poverty headcount ratio, 2004 and 2009
Phnom Penh Other urban Other rural
45
%
40
35
30
25
20
15
10
5
0
2009
1.5 0.7
21.5
10.7
40.3
33.6 35.0
28.0
2004
Total
Source: Authors’ calculation
Table 7: Out-of-pocket spending per capita per day in riel by poverty status (at 2009 prices)
2004 2009 Change % change
Poor Non-poor Poor Non-
poor Poor Non-poor Poor Non-
poor
Control 134 478 610 469 476 -9 354 -2
UF 291 325 514 558 224 233 77 72
UF_VO 224 535 492 540 268 5 120 1
UF_HEF 183 331 197 319 13 -12 7 -4
UF_SUBO 309 391 610 553 301 162 97 42
UF_HEF_VO 145 69 269 824 125 755 86 1101
Total 242 413 461 509 219 96 91 23Note: We defi ne the 1st and 2nd quintiles as poor and the 3rd, 4th and 5th as non-poor.Source: Authors’ calculation

17
CDRI Working Paper Series No. 106
Table 8: Descriptive statistics
2004 2009 Difference
HHH age 45.1 46.0 0.89
HHH gender (1=male) 0.80 0.79 -0.01
HHH marital status (1=married) 0.80 0.79 -0.01
HHH educational level (1=no schooling) 0.27 0.23 -0.04
HHH educational level (1=primary school incomplete) 0.41 0.43 0.02
HHH educational level (1=primary school complete) 0.20 0.21 0.01
HHH educational level (1=lower secondary school) 0.07 0.09 0.02
HHH nationality (1=Khmer) 0.96 0.97 0.01
HHH main occupation (1=agriculture) 0.42 0.44 0.02
HHH main occupation (1=industry) 0.10 0.11 0.01
HH member (aged 0–4) 0.47 0.45 -0.02
HH member (aged 5–9) 0.58 0.52 -0.06
HH member (aged 10–14) 0.71 0.52 -0.19
HH member (aged 15–64, male) 1.45 1.49 0.04
HH member (aged 15–64, female) 1.66 1.63 -0.03
HH member (aged over 64) 0.21 0.21 0.00
HH landholding (1=no agricultural land) 0.38 0.38 0.00
HH landholding (1=agricultural land <1 ha) 0.30 0.31 0.01
HH landholding (1=agricultural land 1–2 ha) 0.17 0.17 0.00
HH landholding (1=agricultural land 2–3 ha) 0.07 0.07 0.00
RD (1=Phnom Penh) 0.21 0.15 -0.06
RD (1=Plains) 0.43 0.40 -0.03
RD (1=Tonle Sap) 0.20 0.31 0.11
RD (1=Coastal) 0.10 0.07 -0.03
VC (1=having private clinic, drug shop or other shop selling drugs, 0=otherwise) 0.45 0.43 -0.02
VC : log-distance to the nearest communal health centre (km) 1.28 1.16 -0.12
VC : log-distance to the nearest district hospital (km) 1.98 2.05 0.07
VC (1=dengue, major health problem) 0.26 0.27 0.01
VC (1=not enough medicine or drugs , major health services) 0.25 0.22 -0.03
VC (1=health services are too expensive, major health services) 0.17 0.31 0.14
VC (1=having health programmes (immunisation, maternal and child health/family planning, HIV/AIDs testing, or iodine defi ciency) 0.67 0.83 0.16
HHH: household head; HH: household; RD: regional dummy; VC: village characteristics.Source: Authors’ calculation

18
Impa
ct o
f Hea
lth F
inan
cing
Pol
icie
s on
Hou
seho
ld S
pend
ing
Tabl
e 9:
Impa
cts o
f pol
icie
s on
heal
th sp
endi
ng: P
robi
t with
GLM
with
log
link
and
gam
ma
dist
ribut
ion
(ful
l sa
mpl
e)
(1
)(2
)(3
)(4
)(5
)(6
)(7
)(8
)(9
)(1
0)
ufuf
_hef
uf_v
ouf
_hef
_vo
all_
polic
y
VAR
IAB
LES
prob
itgl
mpr
obit
glm
prob
itgl
mpr
obit
glm
prob
itgl
m
time
-0.2
85**
*0.
374*
-0.2
44**
*0.
473*
*-0
.221
***
0.30
1-0
.292
***
0.56
1***
-0.2
77**
*0.
268
UF
-0.0
924
-0.0
507
-0.1
04-0
.209
time_
UF
0.04
510.
108
0.08
090.
221
UF_
VO
-0.4
30**
*0.
414
-0.2
65**
*0.
069
time
_UF_
VO
0.45
1***
-0.5
24*
0.44
4***
-0.2
72
UF_
HEF
-0.2
31*
0.45
5-0
.357
***
0.33
8
time
_UF_
HEF
0.12
1-0
.852
**0.
213*
-0.6
70*
UF_
SUB
O-0
.255
**-0
.301
-0.2
40**
-0.1
22
time
_UF_
SUB
O0.
579*
**0.
216
0.59
0***
0.00
883
UF_
HEF
_VO
-0.6
50**
*-0
.234
-0.6
70**
*-0
.900
*
time_
UF_
HEF
_VO
0.92
9***
-0.3
341.
014*
**0.
591
Con
stan
t-1
.163
***
7.55
3***
-0.2
516.
252*
**-0
.539
*6.
761*
**-1
.455
***
7.47
3***
-0.7
56**
*6.
940*
**
Obs
erva
tions
4009
4009
2673
2673
3330
3330
1766
1766
8007
8007
Not
e: S
ignifi c
ant a
t ***
1 pe
rcen
t, **
5 pe
rcen
t and
*10
per
cent
. Exp
lana
tory
var
iabl
es li
sted
in T
able
8, a
nd w
ealth
qui
ntile
s inc
lude
d.
Sour
ce: A
utho
rs’ c
alcu
latio
n

19
CD
RI W
orki
ng P
aper
Ser
ies N
o. 1
06
Tabl
e 10
: Im
pact
s of p
olic
ies o
n he
alth
spen
ding
: Pro
bit w
ith O
LS w
ith lo
gged
dep
ende
nt v
aria
bles
(ful
l sam
ple)
(1
)(2
)(3
)(4
)(5
)(6
)(7
)(8
)(9
)(1
0)
ufuf
_hef
uf_v
ouf
_hef
_vo
all_
polic
y
VAR
IAB
LES
prob
itre
gres
s_lo
gpr
obit
regr
ess_
log
prob
itre
gres
s_lo
gpr
obit
regr
ess_
log
prob
itre
gres
s_lo
g
time
-0.2
85**
*0.
176
-0.2
44**
*0.
280*
*-0
.221
***
0.13
2-0
.292
***
0.36
3**
-0.2
77**
*0.
139
UF
-0.0
924
-0.2
61*
-0.1
04-0
.345
**
time_
UF
0.04
510.
347*
*0.
0809
0.35
8**
UF_
VO
-0.4
30**
*0.
235
-0.2
65**
*-0
.039
2
time
_UF_
VO
0.45
1***
-0.1
940.
444*
**-0
.109
UF_
HEF
-0.2
31*
0.54
6**
-0.3
57**
*0.
459*
*
time
_UF_
HEF
0.12
1-0
.733
***
0.21
3*-0
.626
***
UF_
SUB
O-0
.255
**-0
.639
***
-0.2
40**
-0.4
42**
time
_UF_
SUB
O0.
579*
**0.
449*
*0.
590*
**0.
301
UF_
HEF
_VO
-0.6
50**
*-0
.002
7-0
.670
***
-0.4
29
time_
UF_
HEF
_VO
0.92
9***
-0.6
081.
014*
**-0
.233
Con
stan
t-1
.163
***
6.89
3***
-0.2
516.
415*
**-0
.539
*6.
709*
**-1
.455
***
7.42
5***
-0.7
56**
*6.
559*
**
Obs
erva
tions
4009
4009
2673
2673
3330
3330
1766
1766
8007
8007
Not
e: S
ignifi c
ant a
t ***
1 pe
rcen
t, **
5 pe
rcen
t and
*10
per
cent
. Exp
lana
tory
var
iabl
es li
sted
in T
able
8, a
nd w
ealth
qui
ntile
s inc
lude
d.
Sour
ce: A
utho
rs’ c
alcu
latio
n

20
Impa
ct o
f Hea
lth F
inan
cing
Pol
icie
s on
Hou
seho
ld S
pend
ing
Tabl
e 11
: Im
pact
s of p
olic
ies o
n th
e sh
are
of h
ouse
hold
hea
lth sp
endi
ng to
tota
l spe
ndin
g: P
robi
t with
GLM
with
log
link
and
gam
ma
dist
ribut
ion
(ful
l sam
ple)
(1
)(2
)(3
)(4
)(5
)(6
)(7
)(8
)(9
)(1
0)
ufuf
_hef
uf_v
ouf
_hef
_vo
all_
polic
y
VAR
IAB
LES
prob
itgl
mpr
obit
glm
prob
itgl
mpr
obit
glm
prob
itgl
m
time
-0.2
85**
*-0
.071
-0.2
44**
*0.
009
-0.2
21**
*-0
.169
-0.2
92**
*0.
121
-0.2
77**
*-0
.148
UF
-0.0
924
-0.2
79*
-0.1
04-0
.357
**
time_
UF
0.04
510.
174
0.08
090.
238
UF_
VO
-0.4
30**
*0.
0647
-0.2
65**
*-0
.115
time
_UF_
VO
0.45
1***
-0.2
520.
444*
**-0
.133
UF_
HEF
-0.2
31*
0.22
8-0
.357
***
0.25
9
time
_UF_
HEF
0.12
1-0
.621
**0.
213*
-0.6
06**
UF_
SUB
O-0
.255
**-0
.593
***
-0.2
40**
-0.4
06**
time
_UF_
SUB
O0.
579*
**0.
349
0.59
0***
0.17
6
UF_
HEF
_VO
-0.6
50**
*-0
.396
-0.6
70**
*-0
.720
**
time_
UF_
HEF
_VO
0.92
9***
-0.2
241.
014*
**0.
273
Con
stan
t-1
.163
***
2.57
6***
-0.2
511.
726*
**-0
.539
*1.
922*
**-1
.455
***
2.36
2***
-0.7
56**
*2.
194*
**
Obs
erva
tions
4009
4009
2673
2673
3330
3330
1766
1766
8007
8007
Not
e: S
ignifi c
ant a
t ***
1 pe
rcen
t, **
5 pe
rcen
t and
*10
per
cent
. Exp
lana
tory
var
iabl
es li
sted
in T
able
8, a
nd w
ealth
qui
ntile
s inc
lude
d.
Sour
ce: A
utho
rs’ c
alcu
latio
n

21
CD
RI W
orki
ng P
aper
Ser
ies N
o. 1
06
Tabl
e 12
: Im
pact
s of p
olic
ies o
n th
e sh
are
of h
ouse
hold
hea
lth sp
endi
ng to
tota
l spe
ndin
g: P
robi
t with
OLS
with
logg
ed d
epen
dent
var
iabl
es
(ful
l sam
ple)
(1
)(2
)(3
)(4
)(5
)(6
)(7
)(8
)(9
)(1
0)
ufuf
_hef
uf_v
ouf
_hef
_vo
all_
polic
y
VAR
IAB
LES
prob
itre
gres
s_lo
gpr
obit
regr
ess_
log
prob
itre
gres
s_lo
gpr
obit
regr
ess_
log
prob
itre
gres
s_lo
g
time
-0.2
85**
*-0
.245
*-0
.244
***
-0.1
58-0
.221
***
-0.2
93**
-0.2
92**
*-0
.068
6-0
.277
***
-0.2
83**
UF
-0.0
924
-0.3
69**
*-0
.104
-0.4
10**
*
time_
UF
0.04
510.
404*
*0.
0809
0.39
7***
UF_
VO
-0.4
30**
*0.
0046
5-0
.265
***
-0.1
25
time
_UF_
VO
0.45
1***
-0.0
293
0.44
4***
0.00
708
UF_
HEF
-0.2
31*
0.43
8**
-0.3
57**
*0.
388*
*
time
_UF_
HEF
0.12
1-0
.643
***
0.21
3*-0
.578
***
UF_
SUB
O-0
.255
**-0
.902
***
-0.2
40**
-0.6
51**
*
time
_UF_
SUB
O0.
579*
**0.
637*
**0.
590*
**0.
493*
*
UF_
HEF
_VO
-0.6
50**
*-0
.185
-0.6
70**
*-0
.42
time_
UF_
HEF
_VO
0.92
9***
-0.4
451.
014*
**-0
.195
Con
stan
t-1
.163
***
1.94
1***
-0.2
511.
980*
**-0
.539
*1.
821*
**-1
.455
***
2.84
4***
-0.7
56**
*1.
644*
**
Obs
erva
tions
4009
4009
2673
2673
3330
3330
1766
1766
8007
8007
Not
e: S
ignifi c
ant a
t ***
1 pe
rcen
t, **
5 pe
rcen
t and
*10
per
cent
. Exp
lana
tory
var
iabl
es li
sted
in T
able
8, a
nd w
ealth
qui
ntile
s inc
lude
d.
Sour
ce: A
utho
rs’ c
alcu
latio
n

22
Impa
ct o
f Hea
lth F
inan
cing
Pol
icie
s on
Hou
seho
ld S
pend
ing
Tabl
e 13
: Im
pact
s of p
olic
ies o
n he
alth
spen
ding
: Pro
bit w
ith G
LM w
ith lo
g lin
k an
d ga
mm
a di
strib
utio
n, su
bsam
ple
(poo
r hou
seho
lds—
wea
lth in
dice
s 1 a
nd 2
)
(1
)(2
)(3
)(4
)(5
)(6
)(7
)(8
)(9
)(1
0)
ufuf
_hef
uf_v
ouf
_hef
_vo
all_
polic
y
VAR
IAB
LES
prob
itgl
mpr
obit
glm
prob
itgl
mpr
obit
glm
prob
itgl
m
Tim
e-0
.086
31.
302*
**-0
.218
1.47
9***
0.09
410.
963*
*-0
.315
1.66
5***
-0.0
466
1.21
1***
UF
0.19
50.
885*
*0.
0542
0.92
1**
Tim
e_U
F-0
.348
*-0
.918
**-0
.267
-0.9
12*
UF_
VO
-0.8
98**
*0.
959*
**-0
.524
***
0.97
0**
Tim
e_U
F_V
O0.
807*
**-1
.366
***
0.51
9**
-1.1
28**
UF_
HEF
0.01
530.
714
-0.3
351.
095*
Tim
e _U
F_H
EF-0
.447
-1.4
77**
-0.1
52-1
.609
**
UF_
SUB
O-0
.288
0.14
-0.1
130.
629
Tim
e _U
F_SU
BO
0.
312
-0.5
20.
244
-0.9
22*
UF_
HEF
_VO
-0.6
30.
736
-0.3
980.
931
Tim
e _U
F_H
EF_V
O1.
039*
*-1
.953
**0.
608*
-1.7
74*
Con
stan
t-1
.752
***
3.70
6***
-4.2
543.
800*
**3.
957
5.34
8***
-1.9
05**
3.28
0**
-0.0
029
5.79
4***
Obs
erva
tions
1320
1320
756
756
986
986
408
408
2804
2804
Not
e: S
ignifi c
ant a
t ***
1 pe
rcen
t, **
5 pe
rcen
t and
*10
per
cent
. Exp
lana
tory
var
iabl
es li
sted
in T
able
8.
Sour
ce: A
utho
rs’ c
alcu
latio
n

23
CD
RI W
orki
ng P
aper
Ser
ies N
o. 1
06
Tabl
e 14
: Im
pact
s of p
olic
ies o
n he
alth
spen
ding
: Pro
bit w
ith O
LS w
ith lo
gged
dep
ende
nt v
aria
bles
( po
or h
ouse
hold
s—w
ealth
indi
ces 1
and
2)
(1
)(2
)(3
)(4
)(5
)(6
)(7
)(8
)(9
)(1
0)
ufuf
_hef
uf_v
ouf
_hef
_vo
all_
polic
y
VAR
IAB
LES
prob
itre
gres
s_lo
gpr
obit
regr
ess_
log
prob
itre
gres
s_lo
gpr
obit
regr
ess_
log
prob
itre
gres
s_lo
g
Tim
e-0
.086
31.
000*
**-0
.218
1.26
6***
0.09
410.
766*
*-0
.315
1.04
7***
-0.0
466
0.99
2***
UF
0.19
50.
456*
0.05
420.
543*
*
Tim
e_U
F-0
.348
*-0
.649
*-0
.267
-0.7
39**
UF_
VO
-0.8
98**
*0.
738*
*-0
.524
***
0.62
7**
Tim
e _U
F_V
O0.
807*
**-0
.958
**0.
519*
*-0
.904
***
UF_
HEF
0.01
531.
080*
**-0
.335
1.20
9***
Tim
e _U
F_H
EF-0
.447
-1.4
73**
*-0
.152
-1.6
14**
*
UF_
SUB
O-0
.288
-0.1
89-0
.113
0.07
42
Tim
e _U
F_SU
BO
0.
312
-0.0
369
0.24
4-0
.422
UF_
HEF
_VO
-0.6
31.
202
-0.3
980.
795
Tim
e _U
F_H
EF_V
O1.
039*
*-2
.326
***
0.60
8*-1
.940
***
Con
stan
t-1
.752
***
4.57
5***
-4.2
543.
340*
**3.
957
6.11
2***
-1.9
05**
2.48
1*-0
.002
96.
352*
**
Obs
erva
tions
1320
1320
756
756
986
986
408
408
2804
2804
Not
e: S
ignifi c
ant a
t ***
1 pe
rcen
t, **
5 pe
rcen
t and
*10
perc
ent.
Expl
anat
ory
varia
bles
list
ed in
Tab
le 8
. So
urce
: Aut
hors
’ cal
cula
tion

24
Impa
ct o
f Hea
lth F
inan
cing
Pol
icie
s on
Hou
seho
ld S
pend
ing
Tabl
e 15
: Im
pact
s of p
olic
ies o
n th
e sh
are
of h
ouse
hold
hea
lth sp
endi
ng to
tota
l spe
ndin
g: P
robi
t with
GLM
with
log
link
and
gam
ma
dist
ribut
ion
(poo
r hou
seho
lds—
wea
lth in
dice
s 1 a
nd 2
)
(1
)(2
)(3
)(4
)(5
)(6
)(7
)(8
)(9
)(1
0)
ufuf
_hef
uf_v
ouf
_hef
_vo
all_
polic
y
VAR
IAB
LES
prob
itgl
mpr
obit
glm
prob
itgl
mpr
obit
glm
prob
itgl
m
Tim
e-0
.086
30.
715*
*-0
.218
0.93
9***
0.09
410.
477
-0.3
151.
147*
**-0
.046
60.
669*
*
UF
0.19
50.
494*
0.05
420.
557*
*
Tim
e_U
F-0
.348
*-0
.667
**-0
.267
-0.7
02**
UF_
VO
-0.8
98**
*0.
710*
**-0
.524
***
0.65
1**
Tim
e _U
F_V
O0.
807*
**-1
.110
***
0.51
9**
-0.9
42**
*
UF_
HEF
0.01
530.
456
-0.3
350.
802*
*
Tim
e _U
F_H
EF-0
.447
-1.1
73**
-0.1
52-1
.282
***
UF_
SUB
O-0
.288
-0.1
73-0
.113
0.15
4
Tim
e _U
F_SU
BO
0.
312
-0.2
550.
244
-0.5
58
UF_
HEF
_VO
-0.6
30.
44-0
.398
0.81
2
Tim
e _U
F_H
EF_V
O1.
039*
*-1
.588
**0.
608*
-1.6
03**
Con
stan
t-1
.752
***
0.77
7-4
.254
-0.0
899
3.95
71.
37-1
.905
**-0
.502
-0.0
029
2.05
8*
Obs
erva
tions
1320
1320
756
756
986
986
408
408
2804
2804
Not
e: S
ignifi c
ant a
t ***
1 pe
rcen
t, **
5 pe
rcen
t and
*10
per
cent
. Exp
lana
tory
var
iabl
es li
sted
in T
able
8.
Sour
ce: A
utho
rs’ c
alcu
latio
n

25
CD
RI W
orki
ng P
aper
Ser
ies N
o. 1
06
Tabl
e 16
: Im
pact
s of p
olic
ies o
n th
e sh
are
of h
ouse
hold
hea
lth sp
endi
ng to
tota
l spe
ndin
g: P
robi
t with
OLS
with
logg
ed d
epen
dent
var
iabl
es
(poo
r hou
seho
lds—
wea
lth in
dice
s 1 a
nd 2
)
(1
)(2
)(3
)(4
)(5
)(6
)(7
)(8
)(9
)(1
0)
ufuf
_hef
uf_v
ouf
_hef
_vo
all_
polic
y
VAR
IAB
LES
prob
itre
gres
s_lo
gpr
obit
regr
ess_
log
prob
itre
gres
s_lo
gpr
obit
regr
ess_
log
prob
itre
gres
s_lo
g
Tim
e-0
.086
30.
470*
-0.2
180.
718*
*0.
0941
0.23
4-0
.315
0.60
1*-0
.046
60.
443*
UF
0.19
50.
293
0.05
420.
387*
Tim
e_U
F-0
.348
*-0
.439
-0.2
67-0
.507
*
UF_
VO
-0.8
98**
*0.
562*
-0.5
24**
*0.
439*
Tim
e _U
F_V
O0.
807*
**-0
.732
**0.
519*
*-0
.660
**
UF_
HEF
0.01
530.
897*
*-0
.335
1.05
9***
Tim
e _U
F_H
EF-0
.447
-1.2
46**
*-0
.152
-1.3
99**
*
UF_
SUB
O-0
.288
-0.5
11*
-0.1
13-0
.268
Tim
e _U
F_SU
BO
0.
312
0.31
70.
244
-0.0
251
UF_
HEF
_VO
-0.6
30.
758
-0.3
980.
589
Tim
e _U
F_H
EF_V
O1.
039*
*-1
.784
**0.
608*
-1.5
53**
Con
stan
t-1
.752
***
0.48
2-4
.254
-0.6
73.
957
1.98
6-1
.905
**-1
.088
-0.0
029
2.18
1**
Obs
erva
tions
1320
1320
756
756
986
986
408
408
2804
2804
Not
e: S
ignifi c
ant a
t ***
1 pe
rcen
t, **
5 pe
rcen
t and
*10
per
cent
. Exp
lana
tory
var
iabl
es li
sted
in T
able
8.
Sour
ce: A
utho
rs’ c
alcu
latio
n
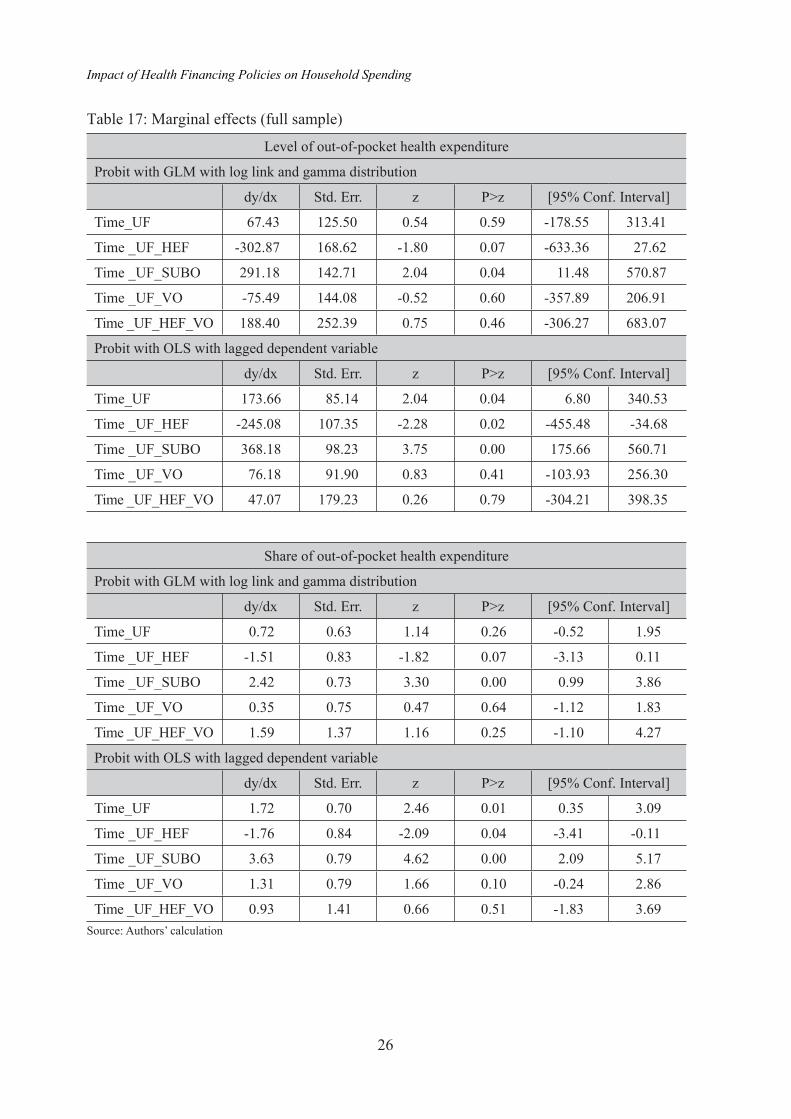
26
Impact of Health Financing Policies on Household Spending
Table 17: Marginal effects (full sample)
Level of out-of-pocket health expenditure
Probit with GLM with log link and gamma distribution
dy/dx Std. Err. z P>z [95% Conf. Interval]
Time_UF 67.43 125.50 0.54 0.59 -178.55 313.41
Time _UF_HEF -302.87 168.62 -1.80 0.07 -633.36 27.62
Time _UF_SUBO 291.18 142.71 2.04 0.04 11.48 570.87
Time _UF_VO -75.49 144.08 -0.52 0.60 -357.89 206.91
Time _UF_HEF_VO 188.40 252.39 0.75 0.46 -306.27 683.07
Probit with OLS with lagged dependent variable
dy/dx Std. Err. z P>z [95% Conf. Interval]
Time_UF 173.66 85.14 2.04 0.04 6.80 340.53
Time _UF_HEF -245.08 107.35 -2.28 0.02 -455.48 -34.68
Time _UF_SUBO 368.18 98.23 3.75 0.00 175.66 560.71
Time _UF_VO 76.18 91.90 0.83 0.41 -103.93 256.30
Time _UF_HEF_VO 47.07 179.23 0.26 0.79 -304.21 398.35
Share of out-of-pocket health expenditure
Probit with GLM with log link and gamma distribution
dy/dx Std. Err. z P>z [95% Conf. Interval]
Time_UF 0.72 0.63 1.14 0.26 -0.52 1.95
Time _UF_HEF -1.51 0.83 -1.82 0.07 -3.13 0.11
Time _UF_SUBO 2.42 0.73 3.30 0.00 0.99 3.86
Time _UF_VO 0.35 0.75 0.47 0.64 -1.12 1.83
Time _UF_HEF_VO 1.59 1.37 1.16 0.25 -1.10 4.27
Probit with OLS with lagged dependent variable
dy/dx Std. Err. z P>z [95% Conf. Interval]
Time_UF 1.72 0.70 2.46 0.01 0.35 3.09
Time _UF_HEF -1.76 0.84 -2.09 0.04 -3.41 -0.11
Time _UF_SUBO 3.63 0.79 4.62 0.00 2.09 5.17
Time _UF_VO 1.31 0.79 1.66 0.10 -0.24 2.86
Time _UF_HEF_VO 0.93 1.41 0.66 0.51 -1.83 3.69Source: Authors’ calculation

27
CDRI Working Paper Series No. 106
Table 18: Marginal effects of subsample (poor households—wealth indices 1 and 2)
Level of out-of-pocket health expenditure
Probit with GLM with log link and gamma distribution
dy/dx Std. Err. z P>z [95% Conf. Interval]
Time_UF -501.59 218.11 -2.30 0.02 -929.08 -74.10
Time _UF_HEF -620.05 229.99 -2.70 0.01 -1070.82 -169.29
Time _UF_SUBO -103.91 175.16 -0.59 0.55 -447.21 239.39
Time _UF_VO -296.62 200.51 -1.48 0.14 -689.62 96.38
Time _UF_HEF_VO -495.74 365.24 -1.36 0.18 -1211.60 220.13
Probit with OLS with lagged dependent variable
dy/dx Std. Err. z P>z [95% Conf. Interval]
Time_UF -381.85 163.13 -2.34 0.02 -701.58 -62.11
Time _UF_HEF -613.23 187.21 -3.28 0.00 -980.16 -246.30
Time _UF_SUBO 60.15 143.26 0.42 0.68 -220.63 340.93
Time _UF_VO -128.98 157.55 -0.82 0.41 -437.78 179.81
Time _UF_HEF_VO -595.99 326.03 -1.83 0.07 -1235.00 43.02
Share of out-of-pocket health expenditure
Probit with GLM with log link and gamma distribution
dy/dx Std. Err. z P>z [95% Conf. Interval]
Time_UF -3.60 1.42 -2.54 0.01 -6.37 -0.83
Time _UF_HEF -4.87 1.80 -2.71 0.01 -8.39 -1.35
Time _UF_SUBO -0.10 1.38 -0.07 0.94 -2.81 2.61
Time _UF_VO -1.87 1.55 -1.21 0.23 -4.90 1.16
Time _UF_HEF_VO -3.71 3.24 -1.15 0.25 -10.05 2.63
Probit with OLS with lagged dependent variable
dy/dx Std. Err. z P>z [95% Conf. Interval]
Time_UF -3.05 1.55 -1.97 0.05 -6.08 -0.02
Time _UF_HEF -5.55 1.79 -3.10 0.00 -9.06 -2.04
Time _UF_SUBO 1.90 1.40 1.36 0.17 -0.84 4.65
Time _UF_VO -0.44 1.74 -0.25 0.80 -3.85 2.97
Time _UF_HEF_VO -4.38 3.15 -1.39 0.16 -10.55 1.79Source: Authors’ calculation

28
Impact of Health Financing Policies on Household Spending
References
Akashi, Hidechika, Takako Yamada, Eng Huot, Koum Kandal and Takao Sugimoto. 2004. “User Fees at a Public Hospital in Cambodia: Effects on Hospital Performance and Provider Attitudes.” Social Science & Medicine 58(3): 553-564.
Annear, Peter. 2010. A Comprehensive Review of the Literature on Health Equity Funds in Cambodia 2001-2010 and Annotated Bibliography. Health Policy and Health Finance Hub Working Paper No. 9. Melbourne: Nossal Institute for Global Health, Univ. of Melbourne.
Annear, Peter Leslie, Maryam Bigdeli, Ros Chhun Eang and Bart Jacobs. 2008. “Providing Access to Health Services for the Poor: Health Equity in Cambodia.” Studies in Health Services Organization and Policy 23: 189-226.
Annear, Peter Leslie, with Maryam Bigdeli, Ros Chun Eang and Paul James. 2007. Study of Financial Access to Health Services for the Poor in Cambodia Phase 2: In-depth Analysis of Selected Case Studies. Phase 2 Final Report for the Ministry of Health, WHO, AusAID and RMIT University.
Annear, Peter Leslie, with David Wilkinson, Men Rithy Chean and Maurits van Pelt. 2006.Study of Financial Access to Health Services for the Poor in Cambodia Phase 1: Scope, Design and Data Analysis. Research report for the Ministry of Health, WHO, AusAID and RMIT University.
Barber, Sarah, Frederic Bonnet and Henk Bekedam. 2004. “Formalizing Under-the-table Payments to Control Out-of-Pocket Hospital Expenditure in Cambodia.” Health Policy and Planning 19(4): 199-208.
Biacabe, Sophie. 2008. Evaluation of UNICEF Supported Health Equity Fund in Svay Rieng Province. Phnom Penh: United Nations Children’s Fund.
Bitran, Ricardo, Vincent Turbat, Bruno Meessen and Wim Van Damme. 2003. Preserving Equity in Health in Cambodia: Health Equity Funds and Prospects for Replication. Washington, DC: World Bank Institute.
Cameron, A. Colin, and Pravin K. Trivedi. 2009. Microeconometrics Using Stata. College Station, TX: Stata Press.
Card, D., and A.B. Krueger. 1994.“Minimum Wages and Employment: A Case Study of the Fast Food Industry in New Jersey and Pennsylvania.” American Economic Review 84:772-793.
Criel, B., W. Van Damme, B. Meessen and P. Ir. 2008. “A Comparative Analysis of Public Social Assistance Systems in Belgium and Health Equity Funds in Cambodia: An Overview of Lessons Learned.” In Health and Social Protection Experiences from Cambodia, China and Lao PDR, edited by B. Meessen, X. Pei, B. Criel and G. Bloom. Antwerp: ITG Press.
Filmer, Deon, and Lant Pritchett. 1994. Estimating Wealth Effects without Expenditure Data or Tears: An Application to Educational Enrollments in States of India. Policy Research Working Paper 1994. Washington, DC: World Bank.

29
CDRI Working Paper Series No. 106
Flores, Gabriela, Por Ir, Chean R. Men, Owen O’Donnell and Eddy Van Doorslaer. 2011. Financial Projection of Patients through Compensation of Providers: The Impact of Health Equity Funds in Cambodia. Discussion Paper. Amsterdam: Tinbergen Institute.
Hardeman, Wim. 2001.“Considering Equity in Health Sector Reform: Case Study of a New Deal in Sotnikum, Cambodia.” Master’s thesis, Institute of Social Studies, The Hague.
Hardeman Wim, Wim Van Damme, Maurits Van Pelt, Ir Por, Heng Kimvan and Bruno Meessen. 2004. “Access to Health Care for All? User Fees Plus a Health Equity Fund in Sotnikum, Cambodia.” Health Policy and Planning 19(1): 22-32.
Health Economics Task Force, Ministry of Health. 2000. Introducing User Fees at Public Sector Health Facilities in Cambodia: An Overview (Briefi ng Paper). MOH/WHO Health Sector Reform Project III in Collaboration with Strengthening District Health Systems, MOH/UNICEF Phnom Penh.
Heckman, James, Hidehiko Ichimura and Petra Todd. 1997. “Matching as Econometric Evaluation Estimator: Evidence from Evaluating a Job Training Programme.” Review of Economic Studies 64:605-654.
Heckman, James, Hidehiko Ichimura, Jeffrey Smith and Petra Todd. 1998. “Characterizing Selection Bias Using Experimental Data.” Econometrica 66(5): 1017-1098.
Ir P. 2004. “Health Equity Funds to Improve Access to Health Care for the Poor in Cambodia.” Master’s dissertation, Price Leopold Institute of Tropical Medicine, Antwerp.
Ir P. 2008. Assessing Effectiveness of Health Equity Funds Bed Censuses in Four Hospitals in Kampong Cham. Phnom Penh: Belgium Technical Cooperation, Provision of Basic Health Services in Kompong Cham.
Ir, Por, Dirk Horemans, Narin Souk and Wim Van Damme. 2010. “Using Targeted Vouchers and Health Equity Funds to Improve Access to Skilled Birth Attendants for Poor Women: A Case Study in Three Rural Health Districts in Cambodia.” BMC Pregnancy and Childbirth 10(1).
Jacobs, Bart., and D. Lot. 2006. Health Seeking Behaviour, Out-of-Pocket Expenditure and Coping Mechanisms of Hospitalised Pre-identifi ed Equity Fund Benefi ciaries and Non-benefi ciaries: A Survey from Kirivong. Phnom Penh: Swiss Red Cross.
Jacobs, Bart, and Neil Price. 2004. “The Impact of the Introduction of User Fees at a District Hospital in Cambodia.” Health Policy and Planning 19(5): 310-321.
Jacobs, Bart, and Neil Price. 2006. “Improving Access for the Poorest to Public Sector Health Services: Insights from Kirivong Operational Health District in Cambodia.” Health Policy and Planning 21(1): 27-39.
Jacobs, Bart, and Neil Price. 2008. “A Comparative Study of the Effectiveness of Pre-Identifi cation and Passive Identifi cation for Hospital Fee Waivers at a Rural Cambodian Hospital.” In Health and Social Protection: Experiences from Cambodia, China and Lao PDR, Studies in Health Services Organization and Policy, edited by Bruno Meessen, Xiaomei Pei, Bart Criel and Gerald Bloom, 437-467. Antwerp: ITG Press.

30
Impact of Health Financing Policies on Household Spending
Jacobs, Bart, Neil Lewis Price and Sam Oeun. 2007. “Do Exemptions from User Fees Mean Free Access to Health Services? A Case Study from a Rural Cambodian Hospital.” Tropical Medicine and International Health 12(11): 1391-1401. doi:10.1111/j.1365-3156.2007.01926.
Jones, Andrew. M. 2000. “Health Econometrics.” In Handbook of Health Economics, edited by A.J. Culyer and J.P. Newhouse, 256-346. Amsterdam: Elsevier.
Jordanwood, T., M. van Pelt and C. Grundmann. 2009. Evaluation Report: Health: Equity Funds. Phnom Penh: University Research Co, LLC.
Keller, S., J.M. Thome and J.Y. Dekestier. 2008. Contracting of Health Services, Ang Rokar and Kirivong Operational Districts, Takeo Province, Cambodia. Final Evaluation Report. Phnom Penh: Swiss Red Cross.
Khun Sokrin, and Lenore Manderson. 2008. “Poverty, User Fees and Ability to Pay for Health Care for Children with Suspected Dengue in Rural Cambodia.” International Journal for Equity in Health 7(10): 1-8.
Knowles, James C. 2010. Poverty Estimates for Cambodia – 2008. Report prepared for the EAS Country Units of the World Bank. Washington, DC: World Bank.
Knowles, James C. 2012a. Poverty Profi le for Cambodia – 2009. Report prepared for and under the direction of the Poverty Reduction and Economic Management Sector Unit, East Asia and the Pacifi c Region, Poverty Cluster of the World Bank. Washington, DC: World Bank.
Knowles, James C. 2012b. Headline Poverty Estimates for Cambodia-2010. Report prepared for the EAS Country Units of the World Bank. Washington, DC: World Bank.
Ly Sopheap. 2011. “Social Health Insurance in Cambodia: An Analysis of the Health Care Delivery Mechanism.” In Improving Health Sector Performance: Institution, Motivations and Incentives; The Cambodia Dialogue, edited by Hossein Jalilian and Sen Vicheth, 101-135. Singapore: Institute of Southeast Asian Studies.
Meessen, Bruno, and Wim Van Damme. 2004. Health Equity Fund in Cambodia, a New Approach to Fee Exemptions, Session 7B, Reaching the Poor. Antwerp: Institute of Tropical Medicine.
Meessen, Bruno, Wim Van Damme, Christine Kirunga Tashobya and Abdelmajid Tibouti. 2006. “Poverty and User Fees for Public Health Care in Low-income Countries: Lessons from Uganda and Cambodia.” Lancet 368: 2253-2257.
Men, C.R., and M. van Pelt. 2006. Two Case Studies—Phnom Penh and Ang Roka: Equity Fund’s Impact on Access to Health Services. Study of Financial Access to Health Services for the Poor, MOH/WHO/AusAID/ RMIT University. Phnom Penh, MoPoTsyo (Patient Information Centre) and Centre for Advanced Studies.
Meyer, B.D., W.K. Viscusi and D.L. Durbin. 1995. “Workers’ Compensation and Injury Duration: Evidence from a Natural Experiment.” American Economic Review 85:322-340.
MEF, Ministry of Economy and Finance. 2010. Data of Public Expenditure of Cambodia. Phnom Penh: Ministry of Economy and Finance.

31
CDRI Working Paper Series No. 106
MOH, Ministry of Health. 1999. National Health Statistics Report 1998. Phnom Penh: Ministry of Health, Department of Planning and Health Information.
MOH. 2008. Health Strategic Plan 2008–2015: Accountability, Effi ciency, Quality, Equity. Phnom Penh: Ministry of Health.
MOH. 2009. Year 2008 Report on HEF-managed HEFI/HEFOs. Monitoring Group, Social Protection. Phnom Penh: Ministry of Health.
MOH. 2013. Annual Health Financing Report 2013. Phnom Penh: Bureau of Health Economics and Financing, Department of Planning and Health Information.
MOP, Ministry of Planning. 1997. Socio-Economic Survey of Cambodia 1996: Volume II Summary Results. Phnom Penh: Ministry of Planning.
MOP. 1998. A Poverty Profi le for Cambodia-1997. Phnom Penh: Ministry of Planning.
MOP. 2000. A Poverty Profi le for Cambodia-1999. Phnom Penh: Ministry of Planning.
MOP. 2006. A Poverty Profi le of Cambodia 2004. Phnom Penh: Ministry of Planning.
MOP. 2009a. Cambodia Socio-Economic Survey 2009. Phnom Penh: Ministry of Planning.
MOP. 2009b. General Population Census of Cambodia 2008. Phnom Penh: National Institute of Statistics, Ministry of Planning.
MOP. 2012. Cambodia Socio-Economic Survey 2010. Phnom Penh: Ministry of Planning.
Nguyen, A. 2004. The Svay Rieng Health Equity Fund: A Project Evaluation. Phnom Penh: UNCEF Cambodia.
Noirhomme, Mathieu, Bruno Meessen, Fred Griffi ths, Por Ir, Bart Jacobs, Rasoka Thor, Bart Criel and Wim Van Damme. 2007. “Improving Access to Hospital Care for the Poor: Comparative Analysis of Four Health Equity Funds in Cambodia.” Health Policy Planning 22(4): 246-262.
O’Donnell, Owen, Eddy van Doorslaer, Adam Wagstaff and Magnus Lindelow. 2008. Analyzing Health Equity Using Household Survey Data: A Guide to Techniques and Their Implementation. Washington, DC: World Bank.
Ozawa, Sachiko. 2010. “Trust and Voluntary Health Insurance in Cambodia.” Paper presented at the International Conference on Improving Health Sector Performance: Institutions, Motivations and Incentives, Phnom Penh Hotel, Phnom Penh, Cambodia, 27 April.
Ravallian, Martin. 1999. The Mystery of the Vanishing Benefi ts: Ms Speedy Analysts Introduction to Evaluation. Policy Research Working Paper No. 2153. Washington, DC: World Bank.
van Pelt, M. 2006. Health Equity Fund Assessment Report for BTC/CTB. Phnom Penh, Belgian Technical Cooperation, Provincial Basic Health Services Kompong Cham (PBHS-KC).
van Pelt, M. 2008. Report on Short Term Consultancy for Assessment of HEFs in Kompong Cham Province. Phnom Penh, Belgian Technical Cooperation.
van Pelt, M., and G. Morineau. 2008. “When Slum Dwellers Seek Health Care: Exploring a Community-Based Health Equity Fund’s Impact on Indebtedness for Health Care and

32
Impact of Health Financing Policies on Household Spending
on Utilization of Health Services.” In Health and Social Protection Experiences from Cambodia, China and Lao PDR, edited by B. Meessen, X. Pei, B. Criel and G. Bloom. Antwerp: ITG Press.
Phoung Pheakdey. 2010. “Social Micro Health Insurance.” Paper presented at the Public Health Forum on Poverty and Illness, Himawari Hotel, Phnom Penh, Cambodia, 1 April.
Prescott, Nicholas, and Menno Pradhan. 1997. A Poverty Profi le for Cambodia. World Bank Discussion Paper No. 373. Washington, DC: World Bank.
Tangcharoensathien, V., W. Patcharanarumol, Ir P., S. Aljunid, A. Mukti, K. Akkhavong, E. Banzonand D. Huong. 2011. “Health Financing Reforms in Southeast Asia: Challenges in Achieving Universal Coverage.” Lancet 377(9768): 863-873.
Van Damme, W., L. van Leemput, P.Ir, W. Hardeman and B. Meessen. 2004. “Out-of-Pocket Health Expenditure and Debt in Poor Households: Evidence from Cambodia.” Tropical Medicine International Health 9(2): 273-280.
Poel, Ellen Van De, Gabriela Flores, Por Ir, Owen O’donnell, and Eddy Van Doorslaer. 2013 “Vouchers Deliver: The Impact of Subsidies on the Utilization of Maternal Health Care in Cambodia.” Bulletin of the World Health Organization no. 92: 331-339.
Van de Poel, Ellen, Gabriela Flores, PorIr, Owen O’ Donnell and Eddy Van Doorslaer. 2013 “Vouchers Deliver: The Impact of Subsidies on the Utilization of Maternal Health Care in Cambodia.” Bulletin of the World Health Organization 92: 331-339.
Villa, Juan M. 2012.“Simplifying the Estimation of Difference in Differences Treatment Effects with Stata.” MPRA Paper No. 43943.
Wilkinson, D., J. Holloway and P. Fallavier. 2001. The Impact of User Fees on Access, Equity and Health Provider Practices in Cambodia. WHO Health Sector Reform Phase II Project Report. Phnom Penh: Cambodian Ministry of Health/Health Economics Task Force.
World Bank. 2009. Poverty Profi le and Trend in Cambodia: Findings from the 2007 Cambodia Socio-Economic Survey (CSES). Report No. 48618-KH.Washington, DC: World Bank.
World Bank. 2011. Cambodia More Effi cient Government Spending for Strong and Inclusive Growth: Integrated Fiduciary Assessment and Public Expenditure Review (IFAPER). Report No. 61694-KH. Washington, DC: World Bank.
World Bank. 2013. World Development Indicators 2013. Washington, DC: World Bank.

33
CDRI Working Paper Series No. 106
CDRI working paper series
WP 105) Roth Vathana and Lun Pide (August 2015), Health and Education in the Greater Mekong Subregion: Policies, Institutions and Practices – the Case of Cambodia in Khmer
WP 104) Sum Sreymom and Khiev Pirom (August 2015), Contract Farming in Cambodia: Different Models, Policy and Practice
WP 103) Chhim Chhun, Tong Kimsun, Ge Yu, Timothy Ensor and Barbara McPake (June 2015), Catastrophic Payments and Poverty in Cambodia: Evidence from Cambodia Socio-Economic Surveys 2004, 2007, 2009, 2010 and 2011
WP 102) Eng Netra, Vong Mun and Hort Navy (June 2015), Social Accountability in Service Delivery in Cambodia
WP 101) Ou Sivhouch (April 2015), A Right-Based Approach to Development: A Cambodian Perspective
WP 100) Sam Sreymom with Ouch Chhuong (March 2015), Agricultural Technological Practices and Gaps for Climate Change Adaptation
WP 99) Phay Sokcheng and Tong Kimsun (December 2014), Public Spending on Education, Health and Infrastructure and Its Inclusiveness in Cambodia: Benefi t Incidence Analysis
WP 98) Srinivasa Madhur (August 2014), Cambodia’s Skill Gap: An Anatomy of Issues and Policy Options
WP 97) Kim Sour, Dr Chem Phalla, So Sovannarith, Dr Kim Sean Somatra and Dr Pech Sokhem (August 2014), Methods and Tools Applied for Climate Change Vulnerability and Adaptation Assessment in Cambodia’s Tonle Sap Basin
WP 96) Kim Sean Somatra and Hort Navy (August 2014), Cambodian State: Developmental, Neoliberal? A Case Study of the Rubber Sector
WP 95) Theng Vuthy, Keo Socheat, Nou Keosothea, Sum Sreymom and Khiev Pirom (August 2014), Impact of Farmer Organisations on Food Security: The Case of Rural Cambodia
WP 94) Heng Seiha, Vong Mun and Chheat Sreang with the assistance of Chhuon Nareth (July 2014), The Enduring Gap: Decentralisation Reform and Youth Participation in Local Rural Governance
WP 93) Nang Phirun, Sam Sreymom, Lonn Pichdara and Ouch Chhuong (June 2014), Adaptation Capacity of Rural People in the Main Agro-Ecological Zones in Cambodia
WP 92) Phann Dalis (June 2014), Links between Employment and Poverty in Cambodia
WP 91) Theng Vuthy, Khiev Pirom and Phon Dary (April 2014), Development of the Fertiliser Industry in Cambodia: Structure of the Market, Challenges in the Demand and Supply Sidesand the Way Forward
WP 90) CDRI Publication (January 2014), ASEAN 2030: Growing Together for Economic Prosperity–the Challenges (Cambodia Background Paper)

34
Impact of Health Financing Policies on Household Spending
WP 89) Nang Phirun and Ouch Chhuong (January 2014), Gender and Water Governance: Women’s Role in Irrigation Management and Development in the Context of Climate Change
WP 88) Chheat Sreang (December 2013), Impact of Decentralisation on Cambodia’s Urban Governance
WP 87) Kim Sedara and Joakim Öjendal with the assistance of Chhoun Nareth (November 2013), Gatekeepers in Local Politics: Political Parties in Cambodia and their Gender Policy
WP 86) Sen Vicheth and Ros Soveacha with the assistance of Hieng Thiraphumry (October 2013), Anatomy of Higher Education Governance in Cambodia
WP 85) Ou Sivhuoch and Kim Sedara (August 2013), 20 Years’ Strengthening of Cambodian Civil Society: Time for Refl ection
WP 84) Ou Sivhuoch (August 2013), Sub-National Civil Society in Cambodia: A Gramscian Perspective
WP 83) Tong Kimsun, Lun Pide and Sry Bopharath with the assistance of Pon Dorina (August 2013), Levels and Sources of Household Income in Rural Cambodia 2012
WP 82) Nang Phirun (July 2013), Climate Change Adaptation and Livelihoods in Inclusive Growth: A Review of Climate Change Impacts and Adaptive Capacity in Cambodia
WP 81) Hing Vutha (June 2013), Leveraging Trade for Economic Growth in Cambodia
WP 80) Saing Chan Hang (March 2013), Binding Constraints on Economic Growth in Cambodia: A Growth Diagnostic Approach
WP 79) Lun Pidé (March 2013), The Role of Rural Credit during the Global Financial Crisis: Evidence From Nine Villages in Cambodia
WP 78) Tong Kimsun and Phay Sokcheng (March 2013), The Role of Income Diversifi cation during the Global Financial Crisis: Evidence from Nine Villages in Cambodia
WP 77) Saing Chan Hang (March 2013), Household Vulnerability to Global Financial Crisis and Their Risk Coping Strategies: Evidence from Nine Rural Villages in Cambodia
WP 76) Hing Vutha (March 2013), Impact of the Global Financial Crisis on the Rural Labour Market: Evidence from Nine Villages in Cambodia
WP 75) Tong Kimsun (March 2013), Impact of the Global Financial Crisis on Poverty: Evidence from Nine Villages in Cambodia
WP 74) Ngin Chanrith (March 2013), Impact of the Global Financial Crisis on Employment in SMEs in Cambodia
WP 73) Hay Sovuthea (March 2013), Government Response to Infl ation Crisis and Global Financial Crisis
WP 72) Hem Socheth (March 2013), Impact of the Global Financial Crisis on Cambodian Economy at Macro and Sectoral Levels
WP 71) Kim Sedara and Joakim Öjendal with Chhoun Nareth and Ly Tem (December 2012), A Gendered Analysis of Decentralisation Reform in Cambodia

35
CDRI Working Paper Series No. 106
WP 70) Hing Vutha, Saing Chan Hang and Khieng Sothy (August 2012), Baseline Survey for Socioeconomic Impact Assessment: Greater Mekong Sub-region Transmission Project
WP 69) CDRI Publication (March 2012), Understanding Poverty Dynamics: Evidence from Nine Villages in Cambodia
WP 68) Roth Vathana (March 2012), Sectoral Composition of China’s Economic Growth, Poverty Reduction and Inequality: Development and Policy Implications for Cambodia
WP 67) Keith Carpenter with assistance from PON Dorina (February 2012), A Basic Consumer Price Index for Cambodia 1993–2009
WP 66) TONG Kimsun (February 2012), Analysing Chronic Poverty in Rural Cambodia Evidence from Panel Data
WP 65) Ros Bansok, Nang Phirun and Chhim Chhun (December 2011), Agricultural Development and Climate Change: The Case of Cambodia
WP 64) Tong Kimsun, Sry Bopharath (November 2011), Poverty and Evironment Links: The Case of Rural Cambodia
WP 63) Heng Seiha, Kim Sedara and So Sokbunthoeun (October 2011), Decentralised Governance in Hybrid Polity: Localisation of Decentralisation Reform in Cambodia
WP 62) Chea Chou, Nang Phirun, Isabelle Whitehead, Phillip Hirsch and Anna Thompson (October 2011), Decentralised Governance of Irrigation Water in Cambodia: Matching Principles to Local Realities
WP 61) Ros Bandeth, Ly Tem and Anna Thompson (September 2011), Catchment Governance and Cooperation Dilemmas: A Case Study from Cambodia
WP 60) Saing Chan Hang, Hem Socheth and Ouch Chandarany with Phann Dalish and Pon Dorina (November 2011), Foreign Investment in Agriculture in Cambodia
WP 59) Chem Phalla, Philip Hirsch and Someth Paradis (September 2011), Hydrological Analysis in Support of Irrigation Management: A Case Study of Stung Chrey Bak Catchment, Cambodia
WP 58) Hing Vutha, Lun Pide and Phann Dalis (August 2011), Irregular Migration from Cambodia: Characteristics, Challenges and Regulatory Approach
WP 57) Tong Kimsun, Hem Socheth and Paulos Santos (August 2011), The Impact of Irrigation on Household Assets
WP 56) Tong Kimsun, Hem Socheth and Paulos Santos (July 2011), What Limits Agricultural Intensifi cation in Cambodia? The role of emigration, agricultural extension services and credit constraints
WP 55) Kem Sothorn, Chhim Chhun, Theng Vuthy and So Sovannarith (July 2011), Policy Coherence in Agricultural and Rural Development: Cambodia
WP 54) Nang Phirun, Khiev Daravy, Philip Hirsch and Isabelle Whitehead (June), Improving the Governance of Water Resources in Cambodia: A Stakeholder Analysis
WP 53) Chann Sopheak, Nathan Wales and Tim Frewer (August 2011), An Investigation of Land Cover and Land Use Change in Stung Chrey Bak Catchment, Cambodia

36
Impact of Health Financing Policies on Household Spending
WP 52) Ouch Chandarany, Saing Chanhang and Phann Dalis (June 2011), Assessing China’s Impact on Poverty Reduction In the Greater Mekong Sub-region: The Case of Cambodia
WP 51) Christopher Wokker, Paulo Santos, Ros Bansok and Kate Griffi ths (June 2011), Irrigation Water Productivity in Cambodian Rice System
WP 50) Pak Kimchoeun (May 2011), Fiscal Decentralisation in Cambodia: A Review of Progress and Challenges
WP 49) Chem Phalla and Someth Paradis (March 2011), Use of Hydrological Knowledge and Community Participation for Improving Decision-making on Irrigation Water Allocation
WP 48) CDRI Publication (August 2010), Empirical Evidence of Irrigation Management in the Tonle Sap Basin: Issues and Challenges
WP 47) Chea Chou (August 2010), The Local Governance of Common Pool Resources: The Case of Irrigation Water in Cambodia
WP 46) CDRI Publication (December 2009), Agricultural Trade in the Greater Mekong Sub-region: Synthesis of the Case Studies on Cassava and Rubber Production and Trade in GMS Countries
WP 45) CDRI Publication (December 2009), Costs and Benefi ts of Cross-country Labour Migration in the GMS: Synthesis of the Case Studies in Thailand, Cambodia, Laos and Vietnam
WP 44) Chan Sophal (December 2009), Costs and Benefi ts of Cross-border Labour Migration in the GMS: Cambodia Country Study
WP 43) Hing Vutha and Thun Vathana (December 2009), Agricultural Trade in the Greater Mekong Sub-region: The Case of Cassava and Rubber in Cambodia
WP 42) Thon Vimealea, Ou Sivhuoch, Eng Netra and Ly Tem (October 2009), Leadership in Local Politics of Cambodia: A Study of Leaders in Three Communes of Three Provinces
WP 41) Hing Vutha and Hossein Jalilian (April 2009), The Environmental Impacts of the ASEAN-China Free Trade Agreement for Countries in the Greater Mekong Sub-region
WP 40) Eng Netra and David Craig (March 2009), Accountability and Human Resource Management in Decentralised Cambodia
WP 39) Horng Vuthy and David Craig (July 2008), Accountability and Planning in Decentralised Cambodia
WP 38) Pak Kimchoeun and David Craig (July 2008), Accountability and Public Expenditure Management in Decentralised Cambodia
WP 37) Chem Phalla et al. (May 2008), Framing Research on Water Resources Management and Governance in Cambodia: A Literature Review
WP 36) Lim Sovannara (November 2007), Youth Migration and Urbanisation in Cambodia
WP 35) Kim Sedara and Joakim Öjendal with the assistance of Ann Sovatha (May 2007), Where Decentralisation Meets Democracy: Civil Society, Local Government, and Accountability in Cambodia

37
CDRI Working Paper Series No. 106
WP 34) Pak Kimchoeun, Horng Vuthy, Eng Netra, Ann Sovatha, Kim Sedara, Jenny Knowles and David Craig (March 2007), Accountability and Neo-patrimonialism in Cambodia: A Critical Literature Review
WP 33) Hansen, Kasper K. and Neth Top (December 2006), Natural Forest Benefi ts and Economic Analysis of Natural Forest Conversion in Cambodia
WP 32) Murshid, K.A.S. and Tuot Sokphally (April 2005), The Cross Border Economy of Cambodia: An Exploratory Study
WP 31) Oberndorf, Robert B. (May 2004), Law Harmonisation in Relation to the Decentralisation Process in Cambodia
WP 30) Hughes, Caroline and Kim Sedara with the assistance of Ann Sovatha (February 2004), The Evolution of Democratic Process and Confl ict Management in Cambodia: A Comparative Study of Three Cambodian Elections
WP 29) Yim Chea and Bruce McKenney (November 2003), Domestic Fish Trade: A Case Study of Fish Marketing from the Great Lake to Phnom Penh
WP 28) Prom Tola and Bruce McKenney (November 2003), Trading Forest Products in Cambodia: Challenges, Threats, and Opportunities for Resin
WP 27) Yim Chea and Bruce McKenney (October 2003), Fish Exports from the Great Lake to Thailand: An Analysis of Trade Constraints, Governance, and the Climate for Growth
WP 26) Sarthi Acharya, Kim Sedara, Chap Sotharith and Meach Yady (February 2003), Off-farm and Non-farm Employment: A Perspective on Job Creation in Cambodia
WP 25) Chan Sophal and Sarthi Acharya (December 2002), Facing the Challenge of Rural Livelihoods: A Perspective from Nine Villages in Cambodia
WP 24) Kim Sedara, Chan Sophal and Sarthi Acharya (July 2002), Land, Rural Livelihoods and Food Security in Cambodia
WP 23) McKenney, Bruce, Prom Tola. (July 2002), Natural Resources and Rural Livelihoods in Cambodia
WP 22) Chan Sophal and Sarthi Acharya (July 2002), Land Transactions in Cambodia: An Analysis of Transfers and Transaction Records
WP 21) Bhargavi Ramamurthy, Sik Boreak, Per Ronnås and Sok Hach (December 2001), Cambodia 1999-2000: Land, Labour and Rural Livelihood in Focus
WP 20) So Sovannarith, Real Sopheap, Uch Utey, Sy Rathmony, Brett Ballard and Sarthi Acharya (November 2001), Social Assessment of Land in Cambodia: A Field Study
WP 19) Chan Sophal, Tep Saravy and Sarthi Acharya (October 2001), Land Tenure in Cambodia: a Data Update
WP 18) Godfrey, Martin, So Sovannarith, Tep Saravy, Pon Dorina, Claude Katz, Sarthi Acharya, Sisowath D. Chanto and Hing Thoraxy (August 2001), A Study of the Cambodian Labour Market: Reference to Poverty Reduction, Growth and Adjustment to Crisis
WP 17) Chan Sophal and So Sovannarith with Pon Dorina (December 2000), Technical Assistance and Capacity Development at the School of Agriculture Prek Leap

38
Impact of Health Financing Policies on Household Spending
WP 16) Sik Boreak (September 2000), Land Ownership, Sales and Concentration in Cambodia
WP 15) Godfrey, Martin, Chan Sophal, Toshiyasu Kato, Long Vou Piseth, Pon Dorina, Tep Saravy, Tia Savara and So Sovannarith (August 2000), Technical Assistance and Capacity Development in an Aid-dependent Economy: The Experience of Cambodia
WP 14) Toshiyasu Kato, Jeffrey A. Kaplan, Chan Sophal and Real Sopheap (May 2000), Enhancing Governance for Sustainable Development
WP 13) Ung Bunleng (January 2000), Seasonality in the Cambodian Consumer Price Index
WP 12) Chan Sophal, Toshiyasu Kato, Long Vou Piseth, So Sovannarith, Tia Savora, Hang Chuon Naron, Kao Kim Hourn and Chea Vuthna (September 1999), Impact of the Asian Financial Crisis on the SEATEs: The Cambodian Perspective
WP 11) Chan Sophal and So Sovannarith (June 1999), Cambodian Labour Migration to Thailand: A Preliminary Assessment
WP 10) Gorman, Siobhan, with Pon Dorina and Sok Kheng (June 1999), Gender and Development in Cambodia: An Overview
WP 9) Teng You Ky, Pon Dorina, So Sovannarith and John McAndrew (April 1999), The UNICEF/Community Action for Social Development Experience—Learning from Rural Development Programmes in Cambodia
WP 8) Chan Sophal, Martin Godfrey, Toshiyasu Kato, Long Vou Piseth, Nina Orlova, Per Ronnås and Tia Savora (January 1999), Cambodia: The Challenge of Productive Employment Creation
WP 7) McAndrew, John P. (December 1998), Interdependence in Household Livelihood Strategies in Two Cambodian Villages
WP 6) Murshid, K.A.S. (December 1998), Food Security in an Asian Transitional Economy: The Cambodian Experience
WP 5) Kato, Toshiyasu, Chan Sophal and Long Vou Piseth (September 1998), Regional Economic Integration for Sustainable Development in Cambodia
WP 4) Chim Charya, Srun Pithou, So Sovannarith, John McAndrew, Nguon Sokunthea, Pon Dorina and Robin Biddulph (June 1998), Learning from Rural Development Programmes in Cambodia
WP 3) Kannan, K.P. (January 1997), Economic Reform, Structural Adjustment and Development in Cambodia
WP 2) McAndrew, John P. (January 1996), Aid Infusions, Aid Illusions: Bilateral and Multilateral Emergency and Development Assistance in Cambodia. 1992-1995
WP 1) Kannan, K.P. (November 1995), Construction of a Consumer Price Index for Cambodia: A Review of Current Practices and Suggestions for Improvement


Price: USD2.50
Cambodia Development Resource Institute 56 Street 315, Tuol Kork PO Box 622, Phnom Penh, Cambodia (855 23) 881 384/881 701/881 916/883 603 (855 23) 880 734
E-mail: [email protected]: www.cdri.org.kh