zebra and rainbow example of image quality standard in
TRANSCRIPT

Zebra and Rainbow Example of Image Quality Standard in TOFD and Phased Array Technique
Giuseppe NARDONI 1 , Pietro NARDONI
1, Diego NARDONI
1, Marco FEROLDI
1
1 I&T Nardoni Institute, Brescia-Folzano, Italy
Phone: + 39 030 266582; + 39 348220470; [email protected]; [email protected]
Abstract Image quality is a fundamental parameter to evaluate the correct setup of the equipment referred to the
calibration test. In TOFD technique the grey level, as contrast between positive and negative phase, is the main
parameter for detection and sizing of defects. Three quality classes have been proposed to graduate the grey
level. In addition tips resolution is also expressed as quality parameter. The first class has zebra as example of
grey contrast. In Phased Array technique, image quality of the reference indication, is characterized by spectrum
of colours. This image represents the echo dynamic curve of the reference reflector through which the size of
findings is estimated. The first class has the rainbow as an example of image standard. The paper presents with
different example the need to establish a standard quality of image, in particular in the evaluation of the
procedure demonstration. This will avoid the rejection of TOFD and Phased Array maps at the final stage of the
constructions as it is happened also recently, causing delay and heavy economic consequences.
Keywords: signal processing, image processing, Other Methods, phased array, Ultrasonic Testing (UT), image
quality, TOFD, grey level.
1. Introduction
The validation of TOFD and Phased Array procedure is a fundamental step in the examination
process to achieve the requested reliability. Basic in the validation process is the image
quality which express the correct set up of the equipment.
As for radiography examination where the density is basic parameter for the quality of
images, in the ultrasonic computerized system the image is instead fundamental in the
assessment of the inspection system.
In the present paper the two major computerized ultrasonic technique, TOFD and Phased
Array, used for weld examination are considered.
2. TOFD Technique
TOFD technique is based on diffraction phenomena; positive and negative phase of the wave
are represented through different grey level related to the intensity of the beam.
11th European Conference on Non-Destructive Testing (ECNDT 2014), October 6-10, 2014, Prague, Czech Republic

In fig.1 a typical A-SCAN presentation is represented with positive and negative phase.
Fig.1: typical A-SCAN presentation for TOFD.
In fig.2 an example of B-SCAN presentation and relative positive and negative phase in two
different case for porosity and lack of fusion.
Fig.2: B-SCAN presentation for isolated porosity and elongated.
2.1 Validation test with TOFD technique
To demonstrate the application of image quality in the validation test a sample of 60 mm weld
with artificial slit and hole has been prepared to evaluate the images for two different depth
zone.
In fig.3a and fig. 3b the sample and special scanner for validation (crocodile) are represented.
The characteristic of the scanner are the following: it is motorized and can carried out parallel
and non-parallel scanning in the same time without changing any hardware.
Fig.3: a) calibration block used for validation; b) special TOFD scanner.
positive
negative
positive
negative

In the following images are presented the different scan of the artificial defect in the
calibration block, obtained with different values of PCS.
Fig.4: Weld th= 60 mm; probe: 60°; diameter 12 mm; freq:5 MHz.; PCS 100 mm.
Fig.5 : Weld th= 60 mm; probe: 60°; diameter 12 mm; freq:5 MHz; PCS 100 mm.
Slit n.1 Image: class 1 Conforming
Slit n.2 Image: class 3
NOT Conforming
Upper surface Hole Ø 3mm Image: class 1 Conforming
Ø
Slit n.1 Image: class 1 Conforming
Slit n.2 Image: class 2 NOT Conforming

Fig.6 : Weld th= 60 mm; probe: 60°; diameter 12 mm; freq:5 MHz; PCS 100 mm.
Fig.7 Weld th= 60 mm; probe: 60°; diameter 12 mm; freq:5 MHz; PCS 140 mm.
Hole Ø 3mm Image: class 1
Conforming
Hole Ø 3mm Image: class 1 Conforming
Slit n.2 Image: class 1
Conforming
Slit n.1 Image: class 1 Conforming
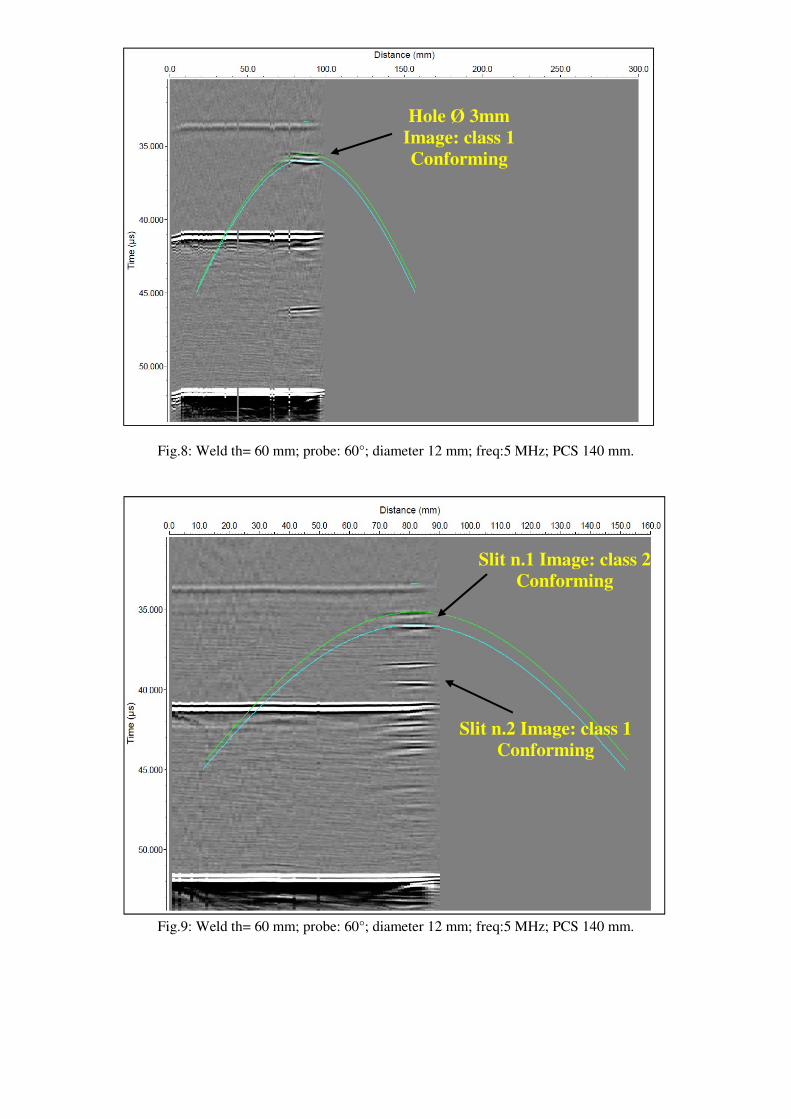
Fig.8: Weld th= 60 mm; probe: 60°; diameter 12 mm; freq:5 MHz; PCS 140 mm.
Fig.9: Weld th= 60 mm; probe: 60°; diameter 12 mm; freq:5 MHz; PCS 140 mm.
Hole Ø 3mm Image: class 1 Conforming
Slit n.2 Image: class 1 Conforming
Slit n.1 Image: class 2 Conforming

Fig.10: TOFD images: “Zebra” classification scan.
Fig.11: classification of image quality relative to a validation of TOFD technique related to four depth
zone.
Class 1
Class 2
Class 3
Class 1 Class 1 Class 1
Class 2 Class 2 Class 2
Class 3 Class 3 Class 3

3. Phased Array Technique
In phase array technique, as for TOFD technique, the quality level of the images relative to
the reference reflectors are fundamental in the set-up of the equipment for the examination of
welds.
Four fundamental colors have to be present in a typical PhA image:
• red
• yellow
• green
• blue
An example of ideal image is represented in fig. 12.
Fig. 12: examples of ideal Phased Array images

This image represents the echodynamic curve that we often use in pulse echo technique for
sizing defects when the non-amplitude based technique or fracture mechanic based criteria as
specified by ASME code in Sec. V Appendix VIII par. 410 has to be applied .
A typical echodynamic curve relative to a pulse echo technique is represented in fig. 13.
Fig.13 : example of echodynamic cure traced with pulse echo technique.
PA is a pulse echo technique with plury crystals that are fired in different time or phase as is
the usual wording (see fig. 14 and fig. 15).
Fig.14: the Phased Array probe with its plury crystals elements.
Fig.15:example of excitation pulses and creation of wave front.
Single crystal Connection with the PHA device
Gap between the elements
Probe width
Pha probe with 8 elements
Excitation pulses with different
phase
Wave front

The “quarter moon” shaped images of the sectorial scan presentation is the corresponding
echo dynamic curve of the single crystal pulse technique.
To have the correct presentation of a PhA image relative to a 100% DAC, all the four
fundamental colors of a typical PhA image (red, yellow, green and blue) have to be present in
the sectorial scan of the reference reflectors.
The length of this arc is the envelop from bleu to bleu passing through the green yellow and
red (see fig. 16).
Fig.16: PhA sectorial scan presentation with the four fundamental colors.
Three classes have been considered for this ultrasonic technique as indicated in the prospect
of fig.17
Class 1
Colors: blue green yellow red
Class 1
Colors: blue green yellow red
Class 1
Class 2
Colors: blue green yellow
Class 2
Colors: blue green yellow
Class 2
Class 3
Colors: blue green
Class 3
Colors: blue green
Class 3
Fig.17: multielement-phased array images: “rainbow” classification of the ecodynamic curve.

References
1. A.Filosi-ATB RIVA Calzoni Spa Roncadelle (BS), G. Nardoni and P.Nardoni- I&T
NARDONI INSTITUTE, Folzano (BS) 'IDN 94-Sizing and flaw characterization with
TOFD technique in the examination of 360 mm SAW weld 2-1/4 Cr Mo Reactor.
Evalutation of planar and volumetric flaw through TOFD and Pulse Echo technique'
Conferenza Nazionale sulle Prove non Distruttive, 2005.
2. G. Nardoni and P.Nardoni- I&T NARDONI INSTITUTE, Folzano (BS) 'Accuracy
Capability of TOFD Technique in Ultrasonic Examination of Welds', 15th
World
Conference on NonDestructive Testing, Rome 2000.
3. G. Nardoni, M. Certo, P.Nardoni, M. Feroldi, D. Nardoni- I&T NARDONI INSTITUTE,
Folzano (BS) 'Time of Flight Diffraction and Phased Array Techniques for the detection
of small transversal in hydrocraking units welds in CrMoV steel', Material Evaluation,
Vol.69, No 7, 2011.
4. Sharp R. S., 'Research Techniques in Non Destructive Testing', Vol IV, 1980.
5. Malcom, J. Croker, 'Encyclopedia of Acoustics, Vol.1, 1997.
6. ASME Code Sec. V, art. 4, Code Cases 2235.9. Use of Ultrasonic Examination in Lieu
of Radiography.
7. R/D Tech, 'Introduction to Phased Array ultrasonic Technology Application: R/D Tech
Guideline' Quebec City, Canada, 2004